Social Network Metric-Based Interventions? Experiments with an Agent-Based Model of the COVID-19 Pandemic in a Metropolitan Region

,
and
aInstitut für Qualifizierende Innovationsforschung & -beratung (IQIB), Bad Neuenahr-Ahrweiler, Germany; bUniversity of Hohenheim, Germany
Journal of Artificial
Societies and Social Simulation 24 (3) 6![]()
![]()
<https://www.jasss.org/24/3/6.html>
DOI: 10.18564/jasss.4571
Received: 08-Jun-2020 Accepted: 28-Apr-2021 Published: 30-Jun-2021
Abstract
We present and use an agent-based model to study interventions for suppression, mitigation, and vaccination in coping with the COVID-19 pandemic. Unlike metapopulation models, our agent-based model permits experimenting with micro-level interventions in social interactions at individual sites. We compare common macro-level interventions applicable to everyone (e.g., keep distance, close all schools) to targeted interventions in the social network spanned by households based on specific (potential) transmission rates (e.g., prohibit visiting spreading hubs or bridging ties). We show that, in the simulation environment, micro-level measures of 'locking' of a number of households and ‘blocking’ access to a number of sites (e.g., workplaces, schools, recreation areas) using social network centrality metrics permits refined control on the positioning on the immunity-mortality curve. In simulation results, social network metric-based vaccination of households offers refined control and reduces the spread saliently better than random vaccination.Introduction
With the world in the grip of waves of COVID-19 and its recent mutations, governments are considering ways to suppress or mitigate the epidemic. This in turn would maintain civil liberties and keep the economy afloat as much as possible. In general, the cornerstone of preventing and curbing massive outbreaks of viruses, is vaccination (Kilbourne 2006). However, at the onset of an epidemic of a new virus, vaccines are generally absent and the number of casualties may be high before a vaccine becomes available (see Cunha 2004). Historically, the response has been to quarantine and totally isolate pockets of infectors (Gensini et al. 2004), although an alternative approach is required whenever a virus is widespread. In this case, a mix of more refined measures such as hygiene, maintaining physical distances, wearing a mask, social distancing, isolation, blocking visits to transmission sites, etc., may all be used to get the spread under control. Once this has been achieved, the mix of measures can gradually be relaxed to return liberties to the public and phase in economic and societal activities. Now that the first vaccines have been approved by medicine agencies and pharmaceutical companies have commenced production and shipment, governments are also considering vaccination policies.
In this paper, an online agent-based model is presented that allow us to study the impact of a variety of policy measures on the spread of COVID-19 and the mortality and emerging immunity in a socio-spatial epidemiological model of a metropolitan region.1 Unlike deriving policies from models in which the effects of policy interventions are incorporated via a certain (assumed) impact on the reproduction number, in the agent-based model, agents follow their agendas and interact in private and public spaces such as their own home, workplace or school, in the supermarket, at mass gatherings (e.g., church, sports events, concerts, carnival), etc. This allows a detailed “what-if” study of the impact of policy measures within traditional epidemiological ABM/ IBM studies such as household isolation, closure of schools and workplaces and restrictions on travelling, both in general (Ferguson et al. 2006; Halloran et al. 2008) and for COVID-19 specifically (Anderson et al. 2020; Ferguson et al. 2020; Hellewell et al. 2020).
In addition to implementing and studying macro-level policy interventions (e.g., closing all schools, prohibiting interregional travel), we use an agent-based model to devise and study the impact of micro-level policy interventions. Unlike the real world, the simulated world offers full control over and detailed insight into stylized spatiotemporal interactions and thereby structural features of the social network. As such, the simulated world permits devising interventions using properties of the social network.
Here, we consider “locking” specific households and “blocking” specific workplaces, schools, etc., based on structural features of the social network. The idea is that social network metrices such as degree centrality and betweenness centrality indicate to what extent particular sites are spreading hubs or bridging ties between subnetworks and that preventing infection (through blocking, locking, or vaccinating) slows down or limits the spread. The main finding is that in the simulated world, social network metric-based interventions (e.g., closing a certain fraction of offices with high degree centrality) allow a high level of control over positioning on the immunity-mortality curve compared to the coarser control offered by macro-level interventions (e.g., closing all offices). That is, by picking the number of households or sites (e.g., offices, schools) that are (b)locked or vaccinated and picking spreading hubs or bridging ties, there is much more refined control over the number of infections and thereby emerging immunity and mortality.
Note that, here we do not claim to predict real-world outcomes, but study the effects of such metric-based intervention properties in a controlled laboratory setting. The simulated world is highly stylized and only partly calibrated to real-world data. For practical implementation of these metric-based interventions, more data on real-world interaction of agents would be required to construct the social network, possibly requiring additional tools (e.g., cell phone data or apps to track spatio-temporal interaction patterns). In addition, as with any other computational model used to study the COVID-19 pandemic, the quantitative output of our agent-based model depends on model assumptions and parameter choices (such as the demography and age-specific transmission rates). Given that research is still extending the amount of empirical evidence on COVID-19 epidemiology and disease progression, it is presently impossible to ensure a 100% accurate depiction of all relevant aspects. We therefore ask the reader to interpret and use the simulated results with caution.
The structure of the remainder of this paper is as follows: In Section 2, we introduce the agent-based model, elaborating on the epidemiological operationalization and the spatiotemporal behaviour driving interactions of agents. In Section 3, we present the simulation experiments consisting of the common macro-level policy measures currently widely applied as a benchmark and new micro-level policy interventions based on social network metrices. In Section 4, we discuss our results and provide conclusions.
Spatio-Temporal Agent-Based Model
Modelling alternatives
There are basically three types of epidemiological models in the literature. These differ on how they model (a) the infection and disease progression (describing the transition from one to the next state including the incubation time distribution, infectiousness per state, transmission probabilities, fatality rate, etc., and how this relates to ages of subjects), (b) the structure in which transmission occurs (e.g., explicitly by assuming transmission rates between subpopulations at the macro-level or implicitly by having transmission emerge by spatial proximity) and (c) the modelled population (e.g., composition of households, distributions of ages, etc., and -in our case- the spatio-temporal behavioural patterns such as going to work, to the supermarket and so on).
First, there are compartmental meta-population models such as the seminal Susceptible-Infected-Recovered (SIR) model (Kermack & McKendrick 1927) which use a system of differential/ difference equations to describe the dynamics in subpopulation sizes (see Wang & Li 2014 for a recent overview). An extensive version for COVID-19 is offered online by the Neherlab,2 of the Biozentrum, University of Basel. In these models, the impact of interventions is typically modelled by assuming reductions of a certain magnitude in the basic reproduction number (i.e., the new number of people infected by any one infected, notably whenever the entire population is still susceptible). Moreover, this type of models has a ‘uniform’ spatial and social interaction structure and the infection process is (implicitly) driven by homogeneous agents roaming an undefined space.
A second type of a simulation model is mostly concerned with illustrating fundamental mechanisms of diffusion processes and the impact of interventions in a stylistic setting. For instance, a model by Harry Stevens3 posted on The Washington Post website to explain the impact of ‘social distancing’, or an explanation of outbreak dynamics by Kevin Simler.4 Typically, for this type of model, a strong regularity in social or spatial structures is assumed (resembling to one of cellular automata) and the ability for calibration, forecasts, etc. is limited.
A third type of model uses agent-based or individual-based computer simulations (see for example, Macal & North 2009; Bonabeau 2002; Epstein & Axtell 1996; Gilbert 2008 for a general description). In contrast to the other two, agent-based models are particularly well-suited to study transmission in epidemics based on the behaviour of heterogeneous and autonomous agents (see e.g., Ajelli et al. 2010; Aleman et al. 2011; Crooks & Hailegiorgis 2014; Hunter et al. 2018; Roche et al. 2011). For advanced (mix-method) epidemiological ABM/ IBM studies on the impact of -what we call macro-level- policy measure such as household isolation, the closure of schools and workplaces and restrictions on travelling, in general, see Ferguson et al. (2006); Halloran et al. (2008), and for COVID-19 specifically, see Ferguson et al. (2020); Anderson et al. (2020); Hellewell et al. (2020). For an elaborate comparison of agent-based models for epidemiological modelling with other modelling approaches, see Ajelli et al. (2010); Nguyen et al. (2019). For a taxonomy of epidemiological ABM studies, see Hunter et al. (2017).
In general, agent-based models are particularly well-suited to study emerging behaviour and macro-level regularities. A particularly appealing feature of ABMs is that agents may be heterogeneous with regard to age and associated transmission and infection rates, as well as mobility, locations visited, and thereby social interaction (cf. Aleman et al. 2011; Guzzetta et al. 2011). Moreover, the transparency and traceability of processes to the level of individuals and their interactions allows the detailed analysis of transmission patterns and the role of transmission sites. Many of these ABMs have their own particularities with regard to modelling geography/ the environment, social structures, transportation/ mobility, properties of the pathogen, etc. In ABMs, there is disaggregation to the level of individual agents and heterogeneity in terms of location and (possibly) behaviour. In modelling, decisions have to be made with regard to the level of aggregation and simplification of the model. Generally, more descriptive models are more challenging to calibrate, as data is not readily available, and more parameter values are to be assumed. Despite the (greater) resemblance between the real and simulated world, simulation results have to be exclusively interpreted as due to processes within the simulated world. Particularly in highly stylized ABMs, the generality and external validity of conclusions may be limited. Here, we describe the core assumptions of our model concerning the disease progression and the (potential) spatio-temporal interaction and infection patterns.
Disease progression and infection models
In epidemiological agent-based models, the state of an agent is the stadium of the disease. In metapopulation SEIR models, subjects go from Susceptible, to Exposed, to Infected/ Infectious, and finally to Removed state (being either recovered/ resistant or deceased). The disease progression model specifies both the (distribution of the) duration in each of the stages and the moments and probabilities of transition to a new stage. For the agent-based model in this paper, we have used the discrete event model of An der Heiden & Buchholz (2020) of the Robert Koch Institute. In line with the SEIR model, the states are: Susceptible (\(\textbf{S}\)), Exposed (\(\textbf{E}\)), Infected (\(\textbf{I}\)) and possibly in severe (\(\textbf{X}\)) or even critical condition (\(\textbf{Y}\)), Recovered (\(\textbf{R}\)), and Deceased (\(\textbf{D}\)). In addition, there is a state Vaccinated (\(\textbf{V}\)) and for both the vaccinated and recovered state we assume that the agent is no longer susceptible, cannot be infected, nor infect other agents.
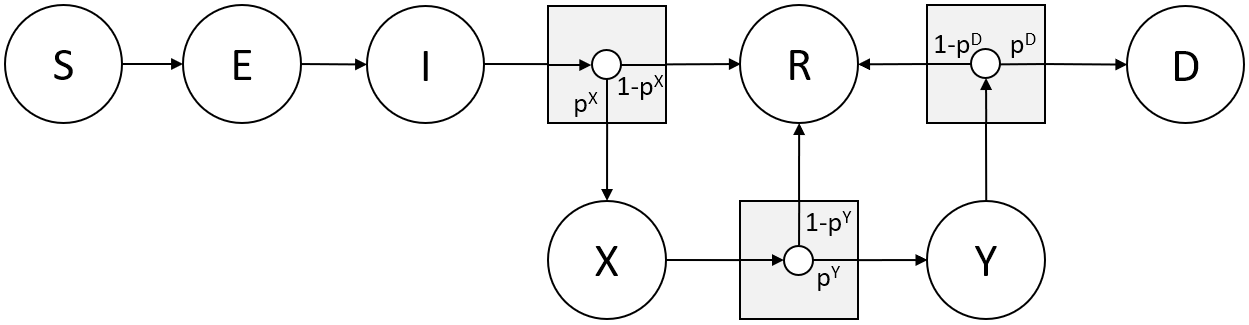
The state progression is characterized by (stochastic) durations \(\tau\) in a particular state and the transitions made with certain probabilities \(p\). The Exposed phase (\(\textbf{E}\)) lasts \(\tau^{E} + \tau^{E^{‘}}\) days, with \(\tau^{E}\) days in which the disease is latent and non-infectious, followed by \(\tau^{E^{‘}} = 1\) day in which the subject is pre-symptomatically infectious. The clinical, symptomatic phase (\(\textbf{I}\)) lasts \(\tau^{I} = 9\) days if recovering or 4 if falling severely ill, the Severely Infected state (\(\textbf{X}\)) lasts \(\tau^{X} = 14\) days if recovering or 1 day if becoming critically ill, the Critically Infected (\(\textbf{Y}\)) state lasts \(\tau^{Y} = 10\) days. The data on the duration of and transition probabilities between infected, severe, critical, and deceased states for COVID-19 is at present still fraught with uncertainty and varies from country to country for various reasons. In part, we are therefore forced to make assumptions.
These however, affect the simulation outcomes only quantitatively and do not affect the outcome of our qualitative policy comparisons based on relative quantities. Our parameter settings are derived from the following sources: Reports on the incubation period \(\tau^{E} + \tau^{E^{‘}}\), i.e., the delay from infection to symptoms of illness, for COVID-19 provide a preliminary estimate of an average duration of 5-6 days (Li et al. 2020; World Health Organization 2020). From a visual inspection of the onset plot in Li et al. (2020) and Akaike’s Information Criterion used by Cowling et al. (2007) on SARS, we assume a Lognormal distribution. For the purpose of the periodic simulation model in this paper, we used a discretization for \(\tau^{E}\). Generalized Reduced Gradient numerical fitting on the empirical distribution yielded parameter estimates \(\mu = 1.45\) and \(\sigma = 0.65\) (which yields a mean of \(e^{\mu + \sigma^{2}} \approx 5.3\)). The WHO (World Health Organization 2020 p. 12), early case studies (Bai et al. 2020), and popular media report supposed accounts of a-/pre-symptomatic transmission, the period for pre-symptomatic transmission prior to onset might be 1 – 2 days (see e.g., Anderson et al. 2020), so we set \(\tau^{E^{‘}} = 1\). While the progression rates between infected, severe, critical and deceased states were largely unknown at time of the first submission of this paper, the emerging fatality rates by age cohort should resemble the figures reported in the literature.
Thus, for calibration, one needs to pick sensible transition probabilities \(p^{X}\), \(p^{Y}\), \(p^{D}\), which differ considerably for each age cohort. Following advanced compartmental models, we have assumed the state progression rates reported in Table 1. We used 2019 demographic statistics derived from the Dutch statistics agency (CBS, Centraal Bureau voor de Statistiek) StatLine Dataset 7461 to validate the Case Fatality Rate by age group. Despite the low numbers of cases, fatality rates are qualitatively similar to those reported elsewhere (e.g., Aksamentov et al. 2020; Verity et al. 2020). Notably, we have picked values for \(p^{X}\), \(p^{Y}\), \(p^{D}\) per age cohort that are slightly higher than those reported in late April 2020 for qualitative research reasons.5 There are only rough statistics available for case fatality rates both with and without treatment in hospital (and with or without ventilation). In the case of The Netherlands, there is an additional complication, as vulnerable and weak COVID-patients were often not admitted to hospital in order to save them the ordeal of ICU. Moreover, limited PCR or antigen testing took place for those that perished. For the purpose of the simulation, we assume a reduction of \(\rho\) times the decease rate when receiving hospital treatment.
| \(p^{x}\) | \(p^{y}\) | \(p^{D}\) | Fatality rate (in the model) | Recovery rate | Fatality rate (empirical) | |
| 0-9 | 2 | 10 | 30 | 0.06 | 99.94 | 0.09 |
| 10-19 | 6 | 20 | 30 | 0.36 | 99.64 | 0.6 |
| 20-29 | 6 | 20 | 30 | 0.36 | 99.64 | 0.66 |
| 30-39 | 6 | 30 | 30 | 0.54 | 99.46 | 0.95 |
| 40-49 | 12 | 40 | 30 | 1.44 | 98.56 | 2.71 |
| 50-59 | 20 | 50 | 40 | 4 | 96 | 8.34 |
| 60-69 | 50 | 70 | 40 | 14 | 86 | 24.33 |
| 70-79 | 70 | 80 | 50 | 28 | 72 | 35.43 |
| 80- | 90 | 90 | 50 | 40.5 | 59.5 | 26.9 |
Spatial model for interaction and infection
The process of infection derives from assumptions on susceptibility and infectiousness and -in a spatial model- on physical proximity required for passing on the virus (e.g., in droplets when coughing or talking, or after touching contaminated objects). In the model, agents have a location (which is a two-dimensional floating-point coordinate), and it is the pairwise Euclidian distance (in ‘pixels’) between two agents that determines the occurrence of transmission. When agents’ pairwise Euclidian distance is below the infection distance \(D\), i.e., \(\Delta X^{2} + \Delta Y^{2} \leq \alpha D^{2}\), an infected agent will infect a susceptible agent. Scaling parameter \(\alpha\) is introduced to account for policy interventions. Mitigating factors (e.g., wearing a face mask, adhering to personal hygiene etc.,) lower the distance over which transmission occurs. The transmission probability also depends on the stage of the disease, as for example, in the pre-symptomatic stage very few pathogens are emitted. So far, little is known of the infection rates between age cohorts as a function of the infection stage and ages of agents. For the time being, we have assumed that infectiousness within and across age cohorts and for disease stage (exposed, infected, severe, critical) are a uniform 10%, except for a uniform 5% infectiousness for the pre-symptomatic exposed state (\(E^{‘}\)) presuming that yet few pathogens are emitted. The reproduction number is emerging from the interaction of agents and is used for cross-validation.
Figure 2 contains a screenshot of the graphical interface of the simulation model. The graphical interface contains four elements: (i) the large metropolitan city plan with different types of sites in the top-left, (ii) simulation controls at the bottom, (iii) the stacked graph reflecting the fractions of the state of infection of the agent population in the top-right, the labour volume graph the percentage of regular output, the stacked histogram the state per age cohort, and (iv) policy intervention options and simulation settings on the right below the graph (discussed in more detail in the next section). Additionally, on the map graphics, the day and time, some basic statistics, the case fatality rate and reproduction number \(R\) are reported.6
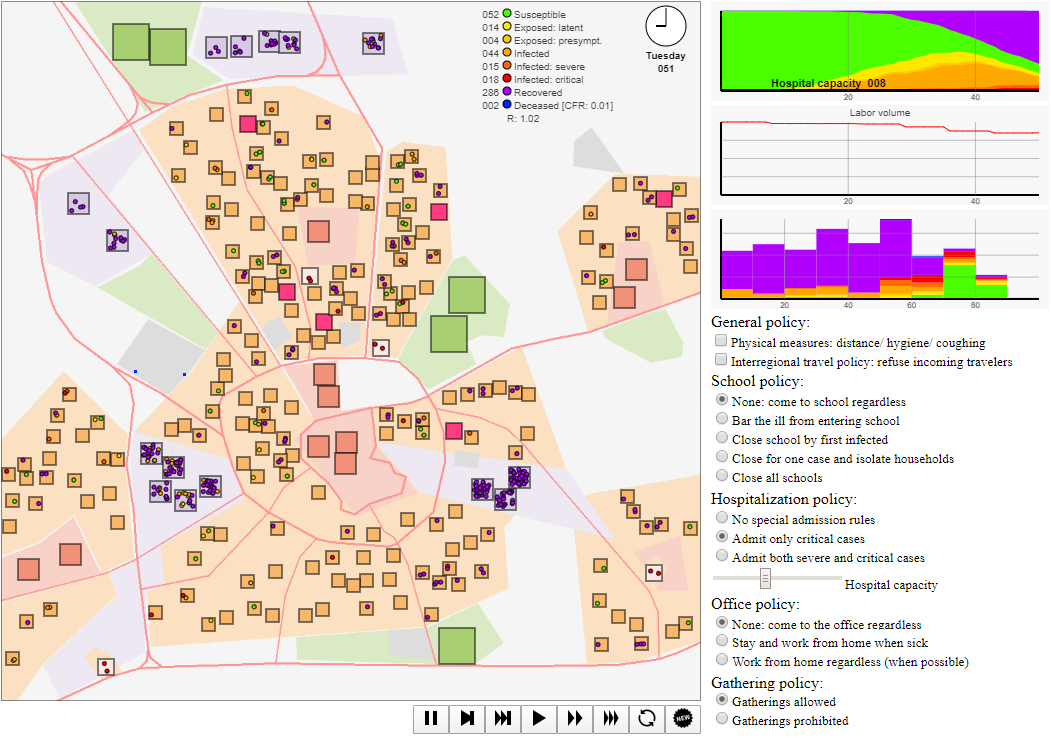
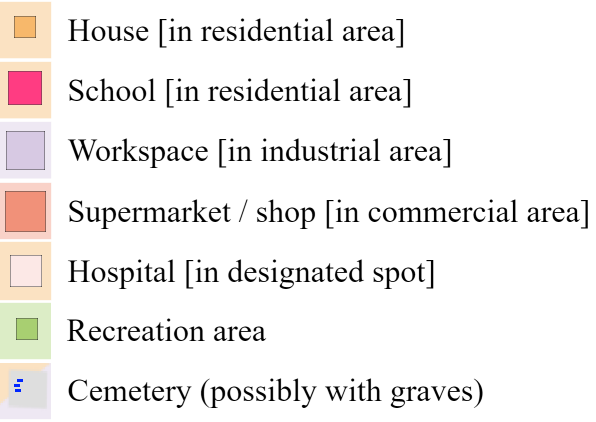
In this visualization, agents are represented by small coloured circles moving around the map to and from sites and spending time at each, interacting with other agents in physical proximity. The colour of these circles indicates the disease state, ranging from susceptible (green) to blue (deceased). There are several sites (houses, workplaces, supermarkets/ shops, schools, recreation & leisure sites, hospitals) at which interaction takes place, see the legend in Figure 3. The agent-based model takes as input a stylized map for which locations for houses, workspaces, supermarkets, recreation areas, and hospitals are randomly generated. In this setup, we picked \(N = 200\) households (a low number both for visualization purposes and due to client-side computational restrictions), 5 recreation areas (representing a range of social events, such as visits to concerts, churches, sports matches, etc.), 15 workplaces, 10 supermarkets, and 4 hospitals. Default parameter choices are reported in Appendix C.
Social dimension of interaction and infection
In our agent-based model, the spatio-temporal behaviour of agents determines the physical proximity to other agents and thereby the chances of infection. The spatio-temporal behaviour is specified for each agent explicitly and is assumed to be related to age, employment, household composition, house location, supermarket preference, favourite recreation area, etc. Agents follow a weekly agenda that dictates visits to particular sites (but possibly constrained by policy interventions) and thereby interaction with other agents.
In the default setup used in the simulation runs analysed here (unless explicitly mentioned otherwise) and in the simulation provided online, the agents’ agendas are as follows. The adults of age \(>\) 20 go to one of three nearest nearby workplaces (randomly drawn at the initialization of the simulation) during weekdays Monday - Friday, leaving for work at 08:00 and leaving work at 17:00. After work, the adult shops at the supermarket closest to home between 17:30 and 18:30. On Saturday, adult agents go to the nearest shop between 14:00 and 16:00. The children and teenagers (age \(\leq\) 20) go to the nearest school during weekdays Monday - Friday. Each pensioner (age \(>\) 65) stays at home from Monday to Saturday, except for a visit to the nearest supermarket for one and a half hour at a point in time between 10:00 and 20:00 that is uniform randomly drawn. On Sunday, all agents of the same household go to a ‘favourite’ recreation area between 11:00 and 15:00. In all other occasions and when a particular activity is prohibited by a policy intervention (e.g., going to school), agents (return and) stay at home. Furthermore, we assume that agents move around randomly within the boundaries of their current location (e.g., workplace, school, house) and only when agents are physically close, they infect one another. Agents’ agenda, and the location for appointments hence determines when they interact with whom and thus between which agents there is (potentially) transmission.
Given the role of households as transmission channels and connecting workplaces with schools, etc., we calibrate the household types and age distributions to empirical data. The household composition (number of adults and number of children) and age of the household members are drawn from the empirical distribution derived from the StatLine Dataset 37975 for 2019 of the Dutch statistics agency (CBS, Centraal Bureau voor de Statistiek). See Table 3 and Table 2 in Appendix A for a detailed overview. In this implementation, agendas and movement patterns are stylized rather than calibrated to empirical data, both because of a lack of detailed agenda data and the simplification of the metropolitan area. Given that the agenda determines the frequency, location, and duration of interaction, the quantitative impact of interventions (e.g., closing schools) may be over- or underestimated. In case the spatio-temporal interaction occurs more (less) in the simulation than in reality, the impact of intervention is overestimated (underestimated). In Section 3.8 and Appendix D, alternative agendas are used to establish the robustness of our finding that metric-based intervention permits refined positioning on the immunity-mortality curve.
Policy Experimentation
Experiment setup
Apart from impactful isolation and quarantine measures, it is possible to reduce chances of transmission physically (e.g., hygiene, keeping distance) as well as by limiting opportunities for social interactions (e.g., by barring people from meeting in certain sites). Such social distancing measures include isolation, household quarantine, and closing of schools, reducing contacts in the workplace and other gatherings in the community (Ferguson et al. 2020, 2006; Halloran et al. 2008; Hellewell et al. 2020). Our agent-based model allows for experimenting with a range of interventions to contain the spread of COVID-19.
We conducted extensive Monte Carlo experiments with a range of logical combinations of interventions, of which a few results are reported here. Each simulation started with one randomly chosen infected agent and runs for at least 70 periods (to ensure ample opportunity to transmit the virus) and from then onward the simulation stops if the distribution of infection states is stable for more than 10 periods. For cross-comparison of the simulation outcomes, we recorded the immunity (the percentage of the population that recovered from COVID-19) and mortality (the percentage that perished of COVID-19) at the end of each simulation run. While in general, there was a trade-off of mortality to attain high levels of immunity, high mortality rates were in part due to limitations in health care capacity. As such, the variation of policy measures in terms of immunity and mortality in conjunction is substantial, making it worthwhile to study alternative measures that offer more refined control over the infection rate. In contrast to generic macro-level measures applying to the entire population (e.g., maintain social distance) or to all sites of a particular type (e.g., close all workplaces), we have proposed micro-level measures that take heed of the structure of individual social interaction of agents. As such, we considered micro-level policies that exploit structural particularities of the social network of interaction and compare those to benchmark macro-level policies that are currently followed by policy makers.
Macro-level interventions
Macro-level interventions are those that are applicable to all agents (e.g., maintaining social distance) or to all sites of a particular type (e.g., prohibiting mass gathering, here modelled as visits to recreation areas), see Appendix B for operationalizations. These interventions effectively suppress the spread and leave large parts of the population susceptible. Thus, the risk of a next wave and hence the need for renewed interventions remain unchanged. We ran simulations for all logical combinations of interventions (see Table 6 in Appendix B for a full list of currently implemented interventions) with 20 random seeds per combination, 2400 cases in total. Our studies reveal that for a range of policy measures substantial immunity may emerge, but generally at the expense of a high total mortality rate. Note that some policies cause high mortality rates due to a rapid spread under limited intensive care capacity in hospitals.
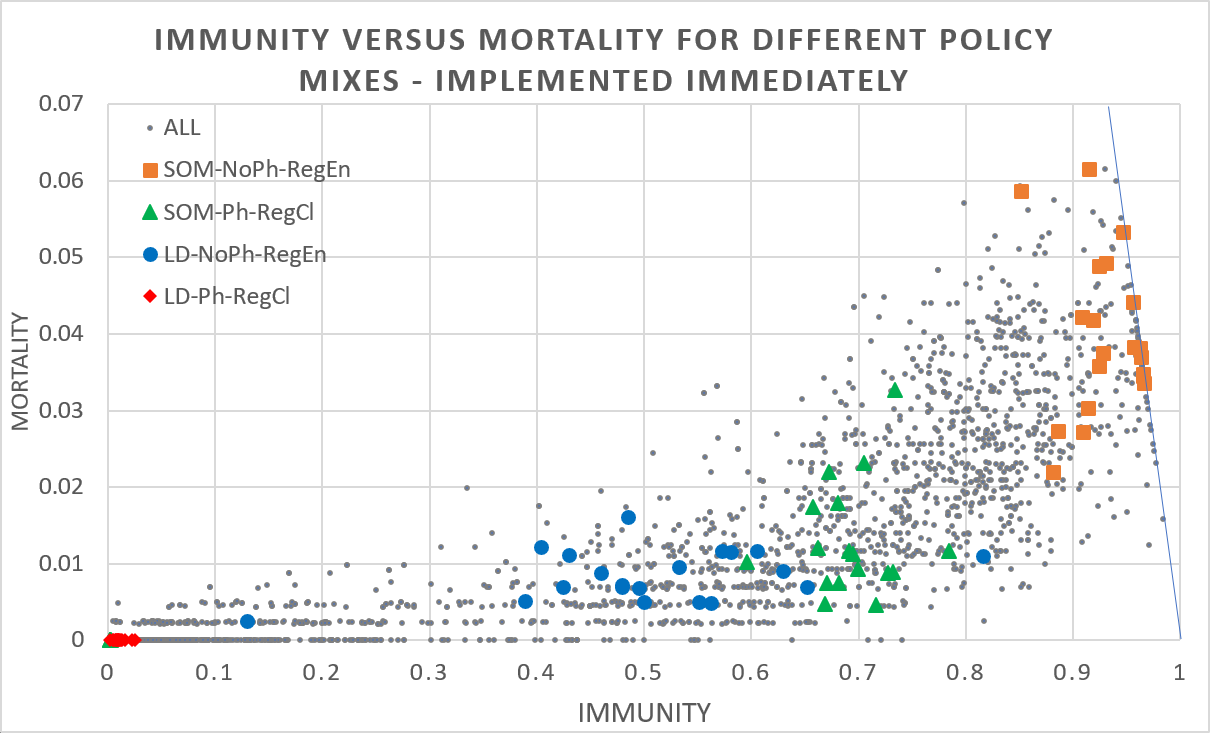
Figure 4 shows two extreme cases for physical measures being the combination of keeping distance, washing hands, etc. (yes: Ph, no: NoPh) and regional openness to travellers from outside the region (entry permitted: RegEn, prohibited: RegCl) for the case of a total lock-down (LD) when agents stay at (and possibly work from) home and freedom (SOM) when agents are going to the school, office, and mass gatherings. The results show that taking no measures (permitting interregional travellers and no physical measures) generally leads to high mortality/ high immunity rate outcomes, while taking strict measures (closing regional borders and physical measures: red diamonds) often leads to low mortality/ low immunity rate outcomes. However, since the fraction of agents still susceptible at the end of the simulation is 1 minus the immunity rate minus the mortality rate, the chance of a second wave is substantial for many (strict) policy mixes. In addition, there is substantial variance for non-strict policies which implies that policy makers have limited control, should monitor the development of rates, and may have to tinker policy measures dynamically. Moreover, the relationship of immunity and mortality is far from linear and outcomes under more lenient policy measures may tip to extreme outcomes, adding to the importance of having to monitor and tinker policy measures.
Whenever the epidemic is curbed within a region after the first wave and interregional traveling resumes, people may become infected outside the region, bring back the virus and spark a next wave of infections. The risk of a subsequent wave is of course particularly high if previous policy measures were strict (e.g., agents were not permitted to go to work or school) and immunity continued to be low (susceptibility remains high). Given that both short-range commuting and long-range traffic are important drivers of virus spread, computer models should ideally incorporate both, see e.g., Balcan et al. (2009).
Our simulation experiments revealed a strong moderating effect of regional policies on the impact of interregional travel, see Table ¿tbl:table2?. A mix of strict, early interventions (i.e., disallow agents to go to the office, school, etc.) will indeed stifle the intraregional spread and eradicate the virus from the region itself, but a large part of the population remains susceptible. In this case, the region remains vulnerable if both the intraregionalpolicies become more lenient (i.e., do allow agents to go to office, school, etc.) and interregional travellers are permitted. To prevent new regional outbreaks either one is to be controlled strictly, i.e., either policy makers (1) prohibit interregional travel and relax intraregional restrictions, or (2) one permits interregional travel but has to maintain intraregional restrictions. In contrast, only whenever there is group immunity (either emerging endogenously by late control or attained by vaccination), both interregional travelling can be permitted and regional restrictions can be relaxed.
| Regional isolation policies Interregional travel policy | Interregional travel policy | ||
| Early phase (e.g., during 1st national wave) | Later phase (e.g., during 2nd national wave) | Permit entry | Prohibit entry/Entry after total lockdown |
| Strict control: Low spread in first wave, high susceptibility remains | Lenient control: may permit the next regional wave | Incoming travellers may spark a new wave of infections | No new infections |
| Strict control: prevents the next regional wave | Incoming travellers may infect a small group (e.g., household), but these do not infect others due to lack of contact | No new infections | |
| Lenient control: Wide spread in first wave, low susceptibility remains, so high immunity | Lenient control: spreading does not occur anyhow | Infections due to incoming travellers do not diffuse due to group immunity | No new infections |
| Strict control: Wibut not needed because spreading does not occur anyhow | Incoming travellers may infect a small group (e.g., household), but infection does not spread due to lack of contact (but would not spread due to group immunity) | No new infections | |
Simulation experiments therefore suggest that subject to the absence of a vaccine, when either prohibiting interregional travelling or regional suppression is undesirable or impossible, a controlled spread to create group immunity is the only option to reduce the chance of a new outbreak: a second regional wave is likely to occur. Note however, macro-level policies such as these have either extreme outcomes (i.e., high immunity - high mortality, or low immunity - low mortality) or substantial variation in the outcome in immunity or mortality.
Social network metric-based interventions
In the previous section, we studied macro-level policies such as locking all households or blocking access to all schools, which have generally, either high variance or have outcomes that are extreme in terms of mortality and emerging immunity. Here, we studied using metrics of households and sites in the social network spanned by interactions of agents to have more refined control over the number of infections, thereby of the number of deceased and immune agents. The simulations should provide initial indications of whether, albeit in a stylized setting, this would lower the risk of future outbreaks (due to remaining mass susceptibility), reduce the need for (sustained) indiscriminate lockdowns, or incur many casualties.
In our case, this social network consisted of ‘nodes’ being certain sites (e.g., workplaces) and ‘edges’ between two nodes indicating that the virus may spread (in)directly from one to the other site by agents. Here, we distinguish between two ways of transmission: firstly, when a single agent visits both sites (direct transmission, e.g., visiting two different shops) and secondly, when an agent visiting one and another agent visiting the other site interact at a third site (indirect transmission, e.g., two members of the same household connect their respective workplaces).
As sites connect agents that potentially carry the virus to other sites, either themselves or via others, agent interactions span a network connecting sites. Depending on the position of this site in the network, sites have a particular role in the spread. This may be due to the number of sites connected to it, but also whether the site is connecting otherwise poorly connected or even unconnected subnetworks. The social network analytical toolkit7 provides indices that measure both: the node degree (number of edges) and betweenness centrality (number of times the node is on the shortest path between other nodes). In general, the higher the degree, the more likely the site has an infected agent (all else equal), and the more likely an agent in a connected site is infected. Moreover, the higher the betweenness centrality, the more often a node is involved in shortest transmission chains and thus contributing to a rapid spread. Note that a site may have high betweenness centrality without high degree, e.g., when it is a bridging tie between two subnetworks. We designed interventions based on degree and betweenness centrality to, notably, remove spreading hubs and bridging ties.
To demonstrate the impact of measures based on social network metrics, we introduced three micro-level policies in which access to particular sites or leaving one’s house is regulated based on the degree or betweenness centrality of that site or household. Firstly, ‘locking’, which is the policy of preventing all agents of a specific household from leaving their house. Locking is particularly relevant when the agents contained in it are (i) highly effective transmission channels (e.g., think of socially well-connected people, that are not only more likely to infect others but also to be infected) or (ii) bridging ties between subnetworks (e.g., members of a household are engaged in different communities). Secondly, ‘blocking’, which is the policy of preventing any agent from entering a specific site (e.g. supermarket, workplace). Blocking is particularly relevant when it is (i) a mass spreading hub (e.g., social events), or (ii) part of a bridging tie between subnetworks (e.g., a meeting place of members from otherwise disconnected communities). Blocking may therefore lengthen or break transition chains, thereby flatten the curve and as such alleviate ICUs. Alternative reasons to ‘block’ sites may relate to the properties of agents at these sites, e.g., the agents are vulnerable.
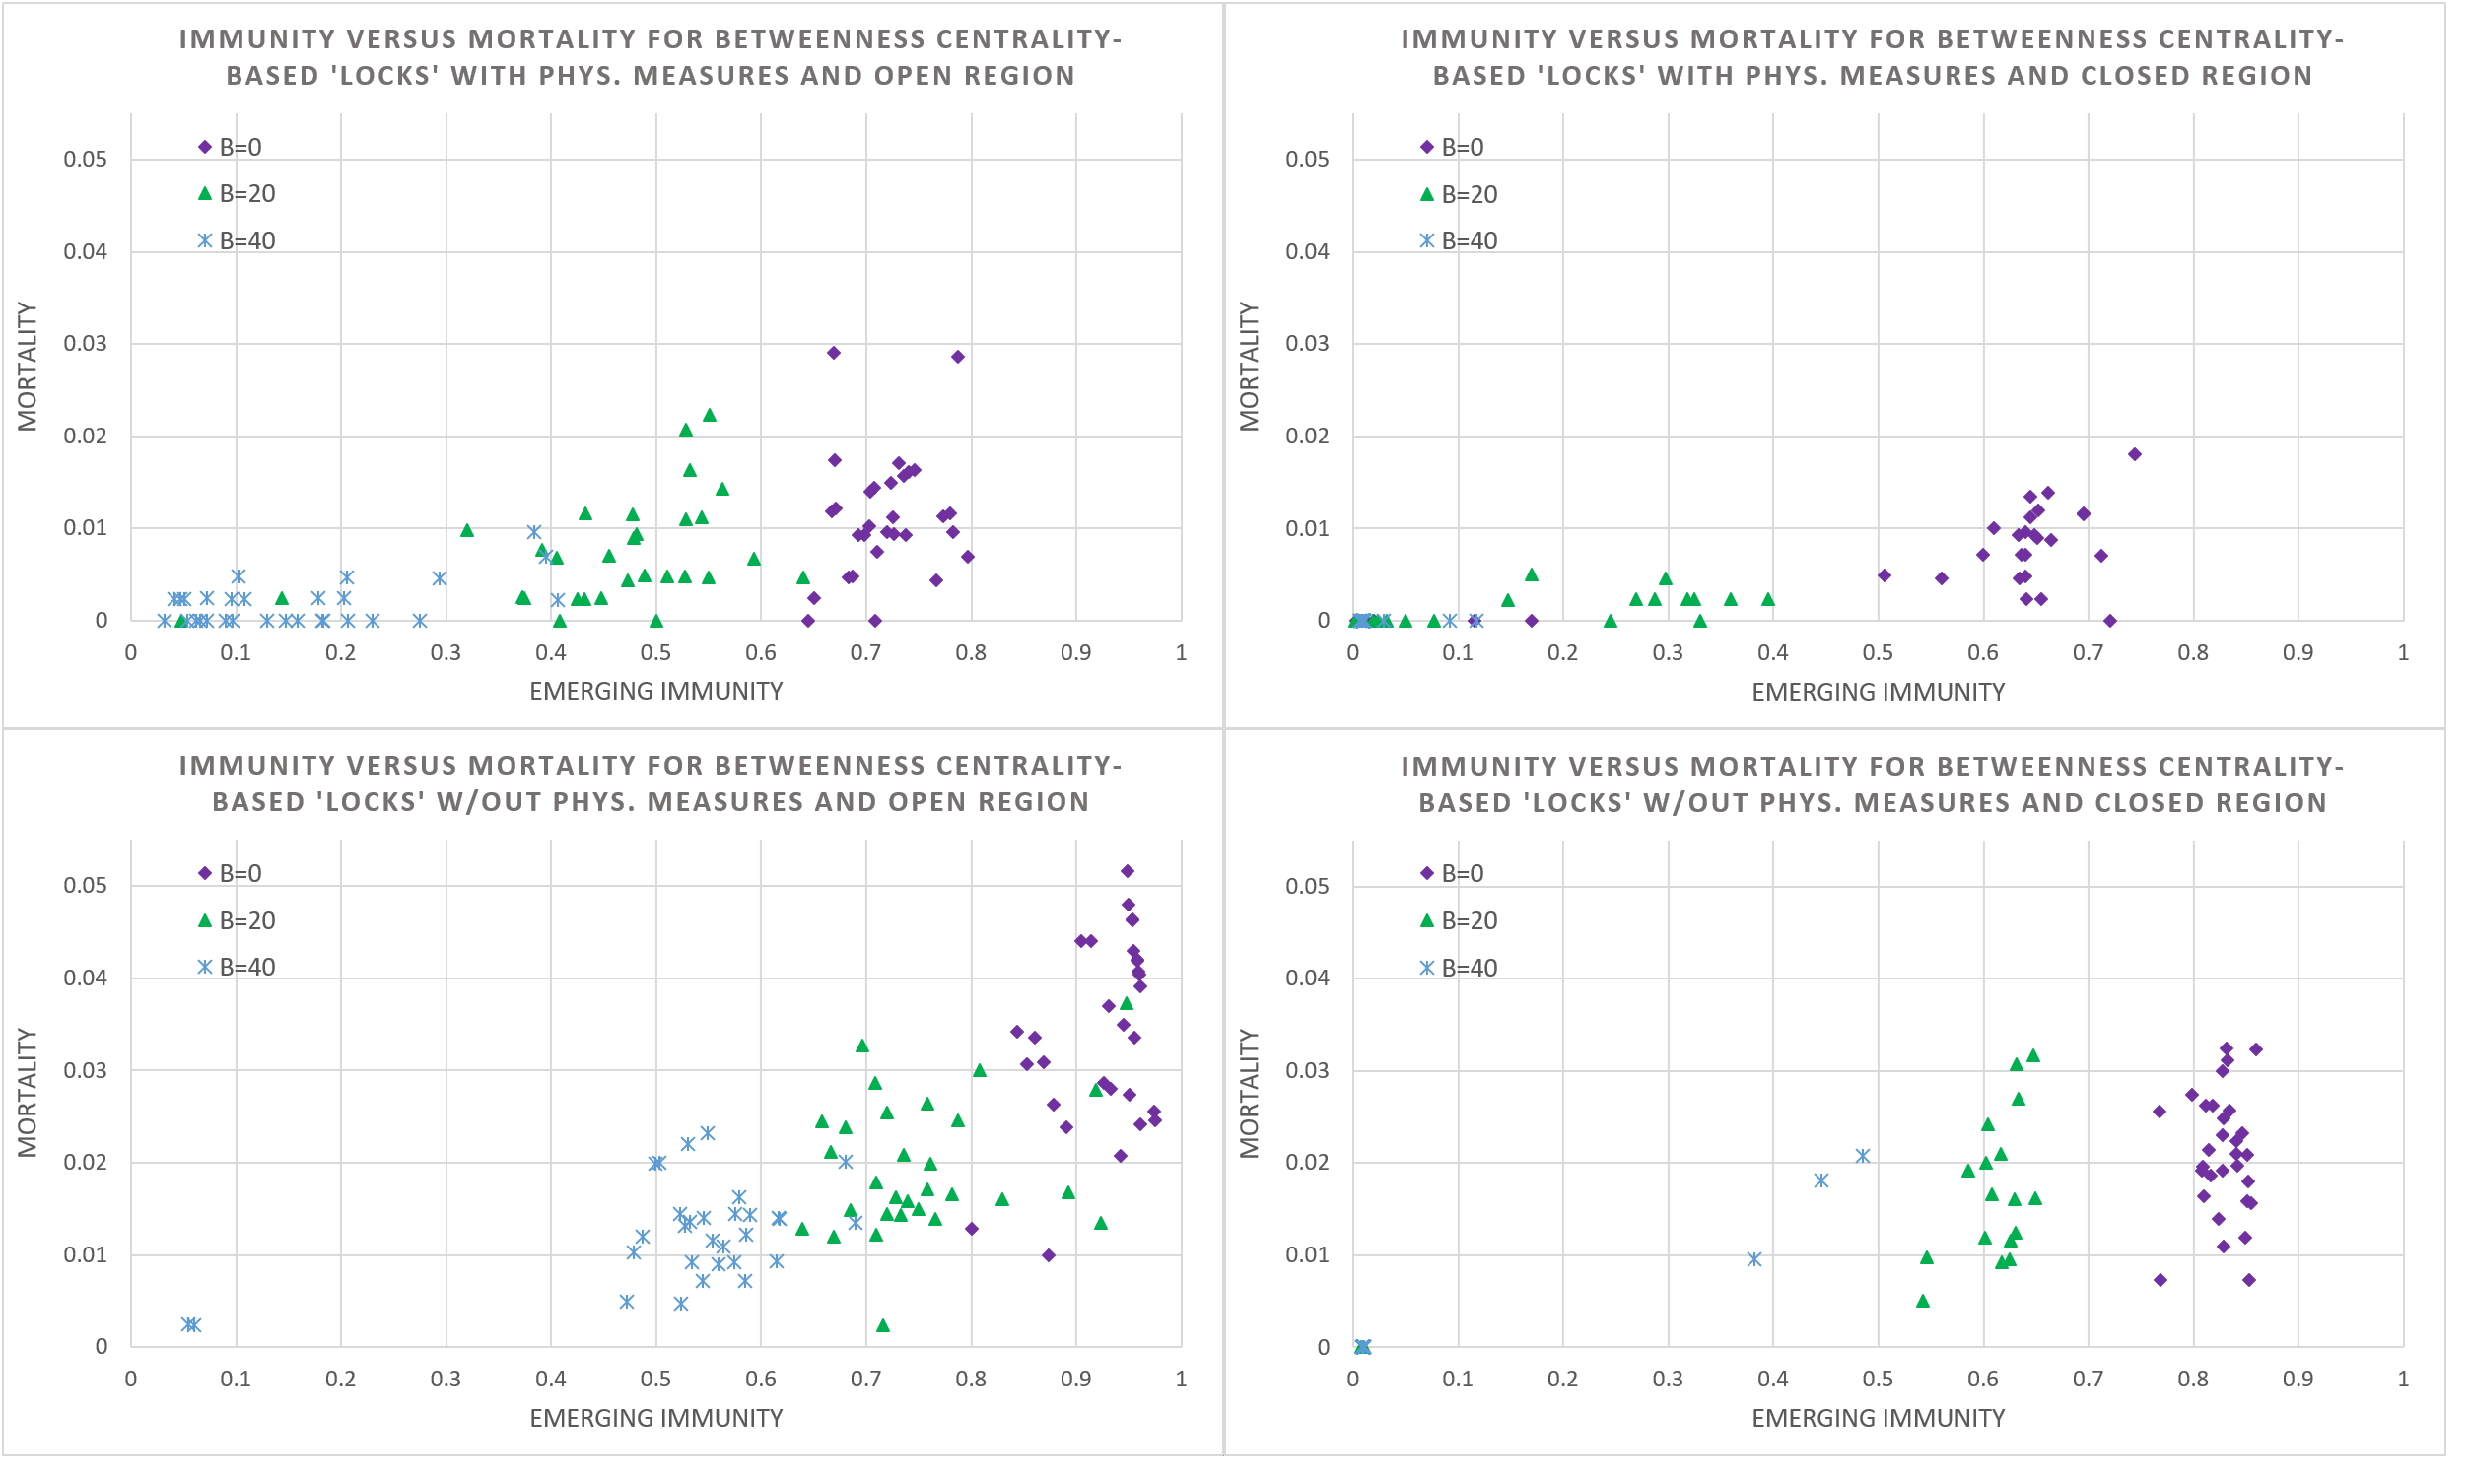
In our agent-based model, all visiting patterns are known and can be used to devise and study the impact of ‘locking’, i.e., the mandatory, discriminate isolation of members of a specific household into their house. We ran simulations for 30 cases for an increasing number of households locked (\(B = 0\), \(20\), \(40\)) and the four scenarios of having an open and closed region, and with physical hygiene measures or not. It is assumed that agents always come to the workplace and to school when not locked in. Given the substantial impact, we assume that mass gatherings are prohibited. To decide which households to lock, we use the betweenness centrality of a node (i.e., a household, in this case).
However, rather than determining the betweenness centrality for each household directly, which requires determining the shortest paths between all pairs of households (through relationships of individual members), we determined the betweenness centrality of schools and workplaces and compute an ‘aggregate betweenness centrality’ (ABC) for households based on schools and workplaces visited by household members. The connections established by households between school and workplace sites span the edges (and weights thereof) between associated nodes, see Figure 5. Subsequently, the betweenness centrality is computed for these site nodes and an aggregate betweenness centrality for households is computed by simply summing the centrality value of site nodes linked by members. In the next step, the B households with the highest ABC value are locked. The household ABC value is not divided by the number of members to make sure to lock households with more members earlier.
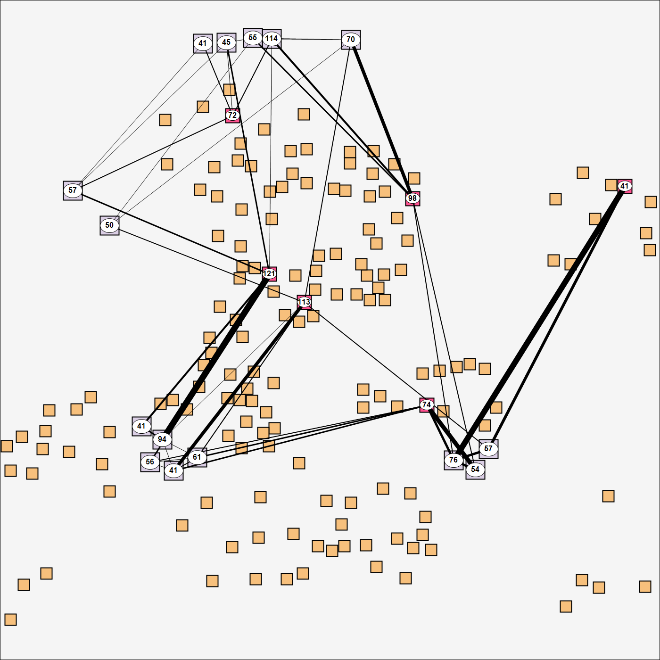
Figure 6 reveals that ‘locking’ is an effective instrument to reduce mortality, albeit again at the expense of immunity, given that increasing the number of locks, mortality and immunity also drops generally. Interestingly, the variation in the simulation outcome for immunity is moderate, which suggests that a locking policy is a dependable instrument for fine-tuned control for positioning on the immunity – mortality curve.
Moreover, there are also salient differences between the four scenarios showing that there is a strong moderating effect of the physical measures and interregional traveling policy. Particularly interesting is that while closing a region lowers the infection rate (and thereby mortality and immunity), the absence of an occasional infection increases the variation in the emerging immunity substantially.
We also studied the impact of ‘blocking’ in the same manner. Again, we simulated 30 cases for an increasing number of sites blocked (\(B = 0, 7, 14\)), the most central first, under the policy mix of having agents always come to the workplace and to school, and permit mass gatherings, and then for both having an open and closed region, with physical hygiene measures or not.
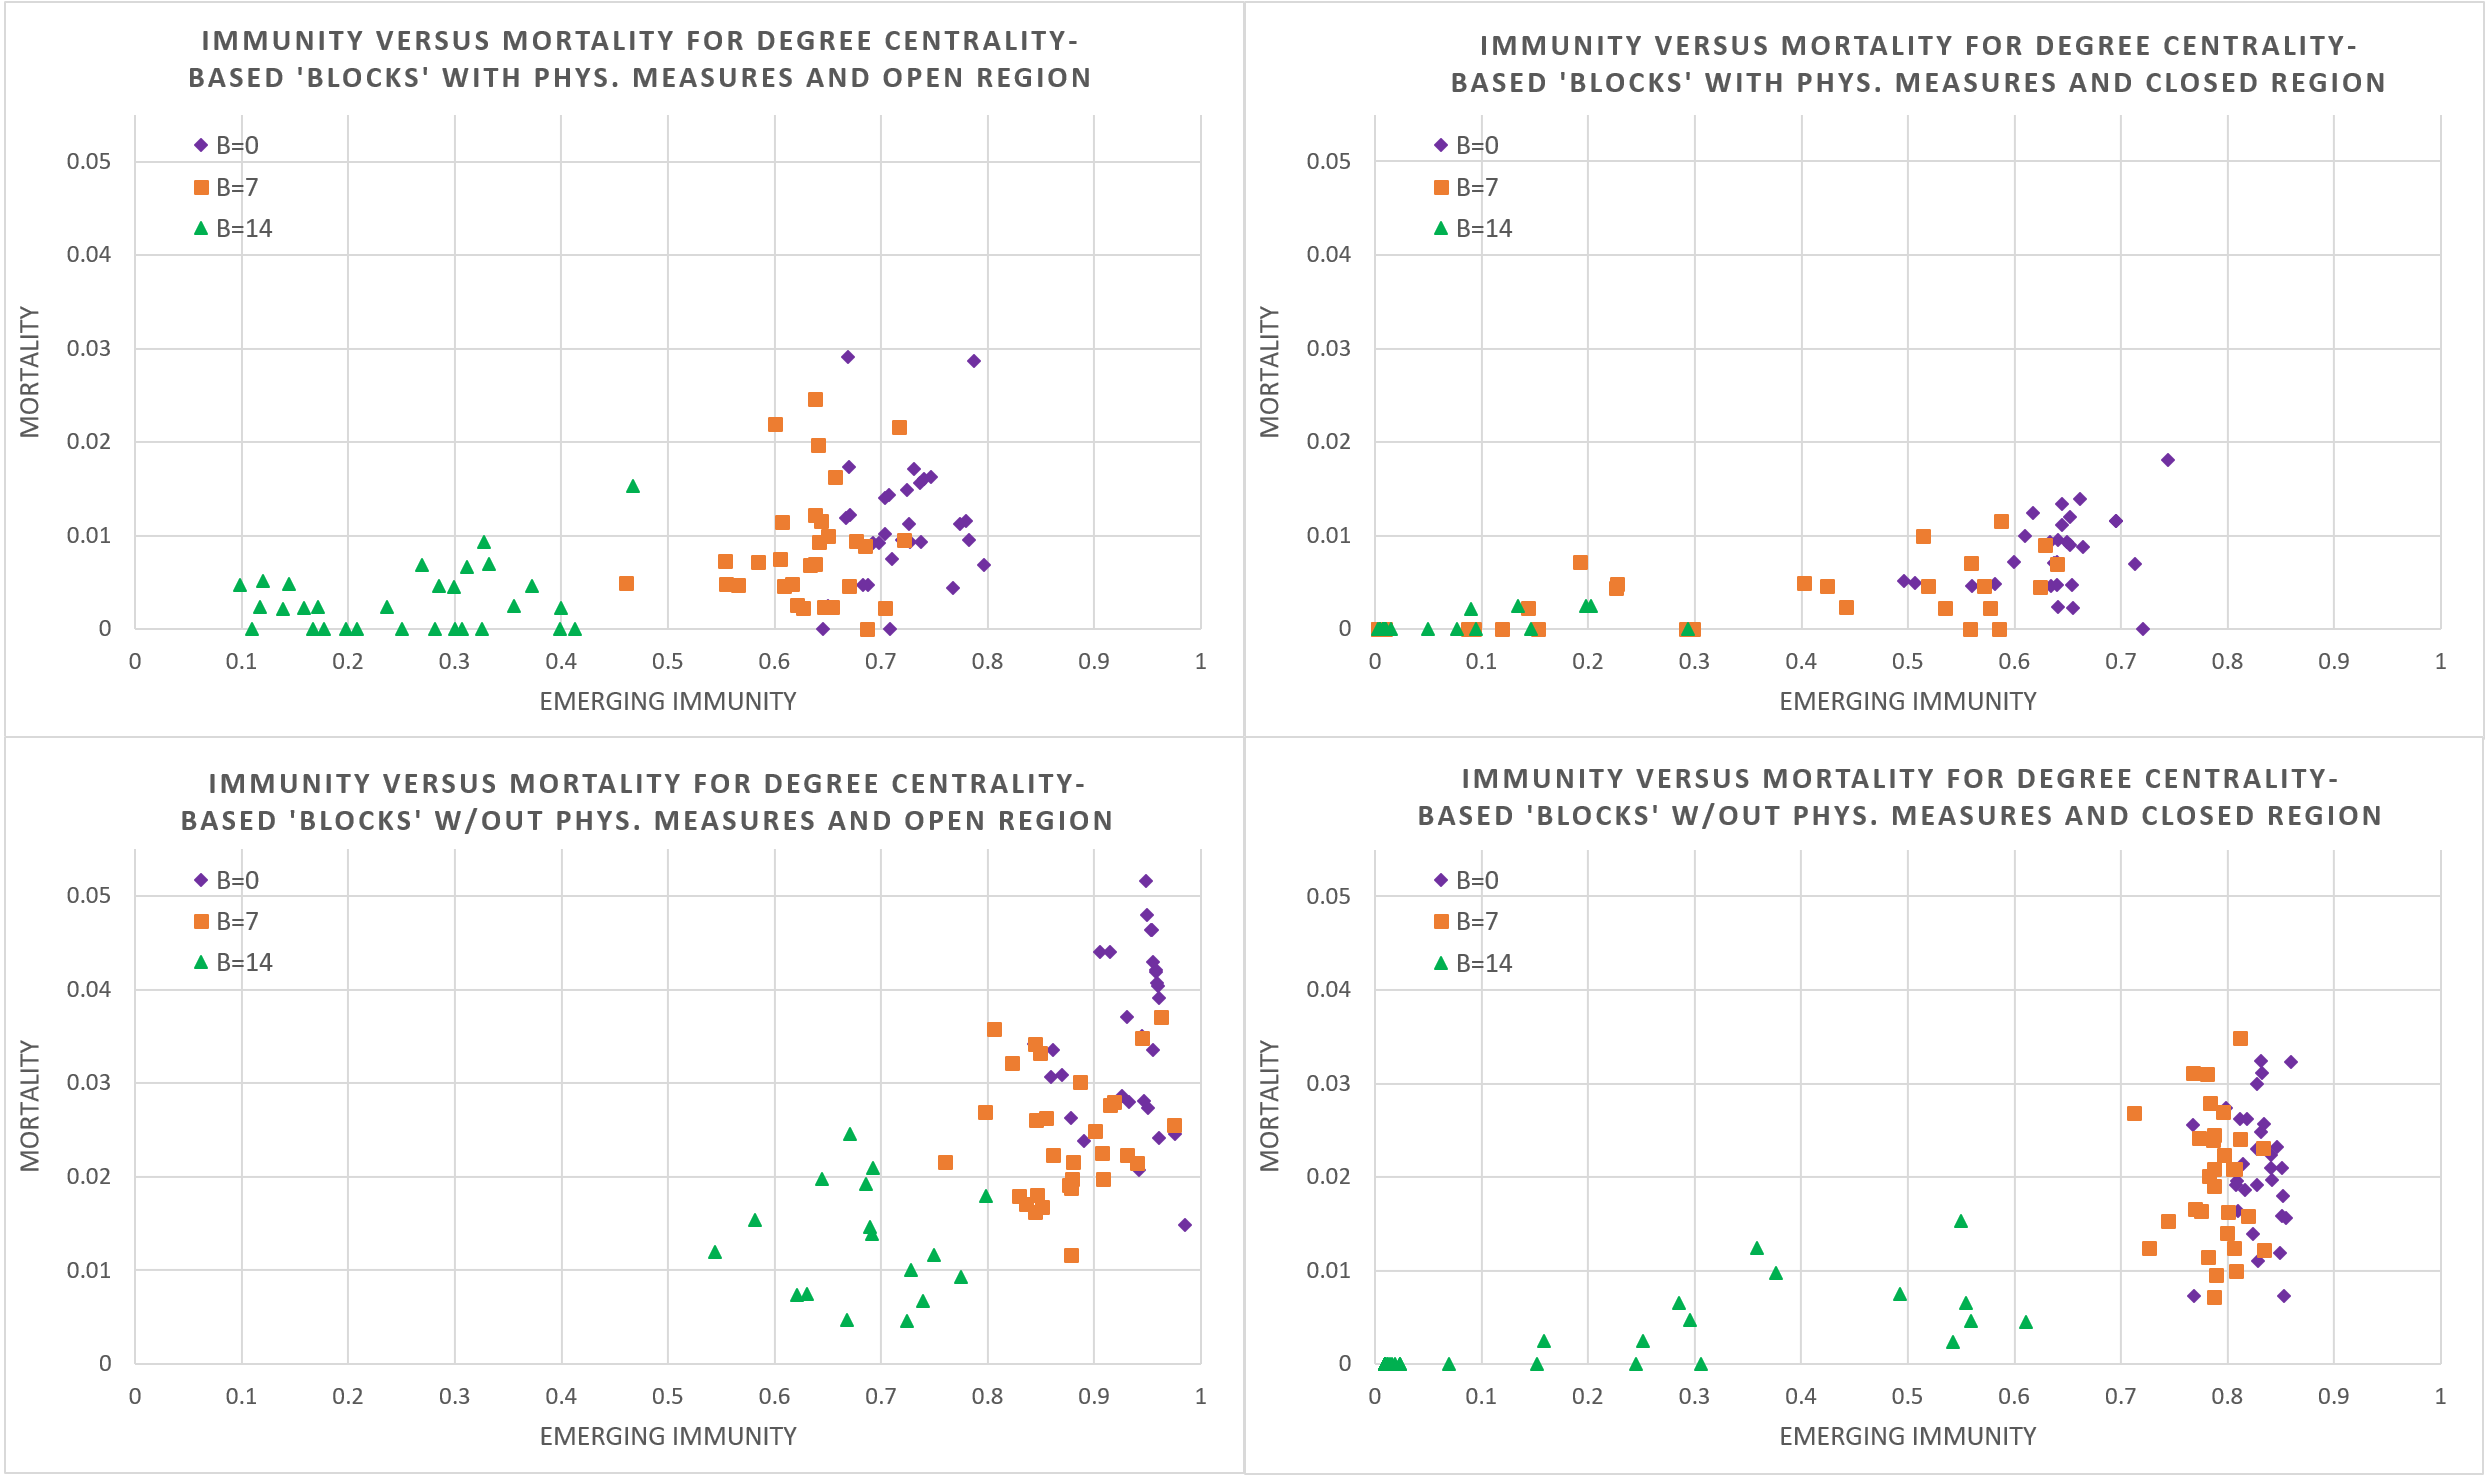
Figure 7 illustrates that blocking hubs lowers mortality and immunity (through lower infection rates) and is therefore an effective instrument to mitigate spread of the disease. Given that the number of sites is large and two extremes are that blocking all would stop spreading entirely and blocking none would mean full spreading, blocking seems to allow refined control over the epidemiological dynamics on the immunity-mortality curve. This said, there is considerable variation especially when more sites are blocked. It is also obvious that macro-level policies of imposing physical measures as well as closing the region, again have strong moderating effects., locking allows a more refined control over the number of infections, emerging immunity and mortality.
The finding that (b)locking permits fine-grained positioning on the immunity-mortality curve (and at least more refined than the macro-level policies), depends strongly on how this limits the number of opportunities and duration of spatio-temporal interaction. Given that locking effectively prevents interaction outside the household, this is more effective than blocking, which may still permit dome interaction (of some household members) in non-blocked sites. This also explains the high variation for the blocking policy. Moreover, given that the sheer number of households required is higher than the number of sites, locking offers more fine-grained control.
To ensure that our claims about this refined control does not rest too much on limiting agents’ agendas, we conducted a preliminary robustness analysis for a change in the agenda. In this, hours in the office, at school, and in the supermarket are varied, and the geographical span of working places picked by agents is increased. The smooth, downward sloping of the average rate of immunity and mortality for an increase in number of (b)locks is persistent. The detailed description and results are contained in Appendix D. The robustness hinges on the duration and number of interactions in the simulation as prediction for the rate of infection (and thereby immunity, and mortality rates). This rationale on the effect of duration and number of interactions arguably applies to both locking and blocking.
Social network metric-based vaccination
The simulation program allows us to study social network metric-based vaccination strategies, such as e.g., vaccination of people that are (working at) ‘spreading hubs’ first. Under the assumptions that vaccination causes indefinite immunity and that vaccinated people cannot ‘silently spread’ the virus, the ‘locking’ of a household is equivalent to vaccinating the household members. After all, these vaccinated agents do not contract, nor spread the virus. Moreover, in the simulation setup, their movement and interaction with other agents does not affect the diffusion at all.
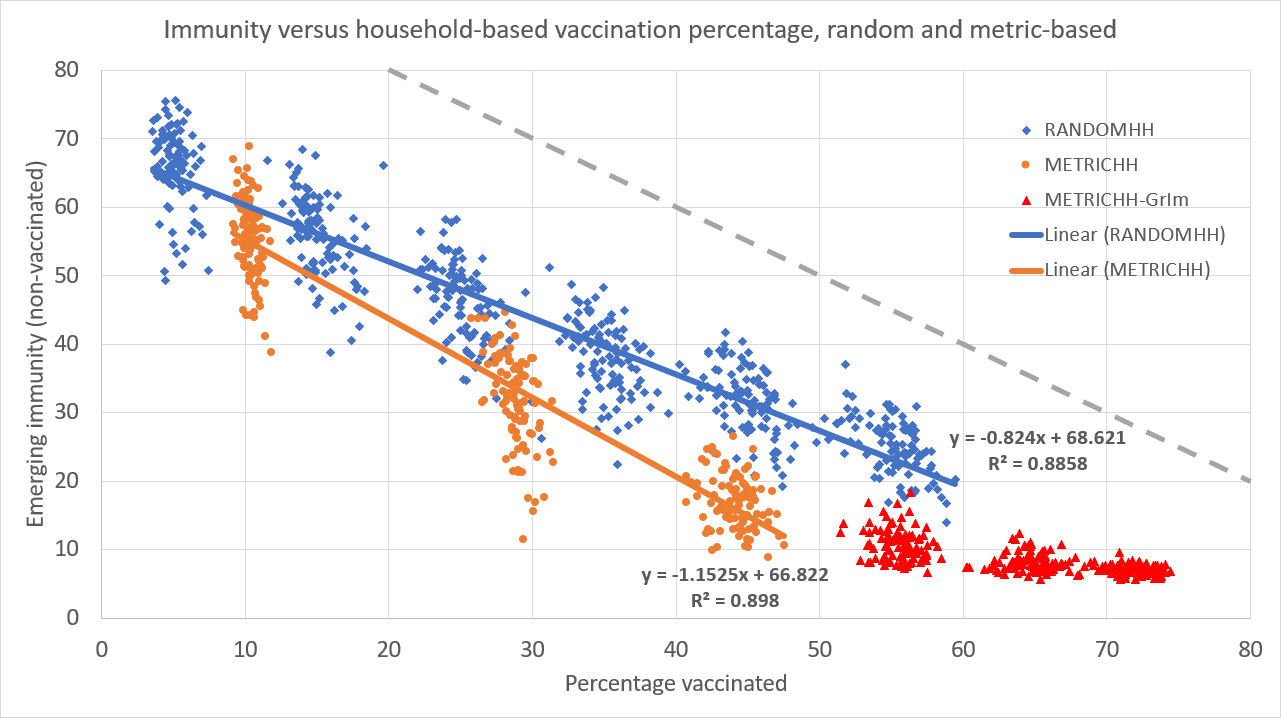
By this equivalence, vaccination of households also offers refined control over the emerging immunity and mortality. Simulation results indeed show smoothly downward sloping immunity curves (and thereby mortality) in the number of vaccinated households. This holds both when picking households on the basis of aggregate betweenness centrality as well as for the case with randomly picked households, see Figure 8. However, in the simulation results, the metric-based vaccination (METRICHH) reduces emerging immunity (i.e., the recoveries from infections) and as such also the mortality better than the benchmark random case (RANDOMHH), arguably by a stronger reduction of the number of infections. The plateauing, non-zero emerging immunity of unvaccinated agents (METRICHH-GrIm) reveals that beyond a certain number of vaccinations, there is group immunity: the number of newly infected is near-zero. In this particular simulation though, interregional traffic is permitted, and the lion’s share of these new infections are caused by travellers causing a small wave of infections.
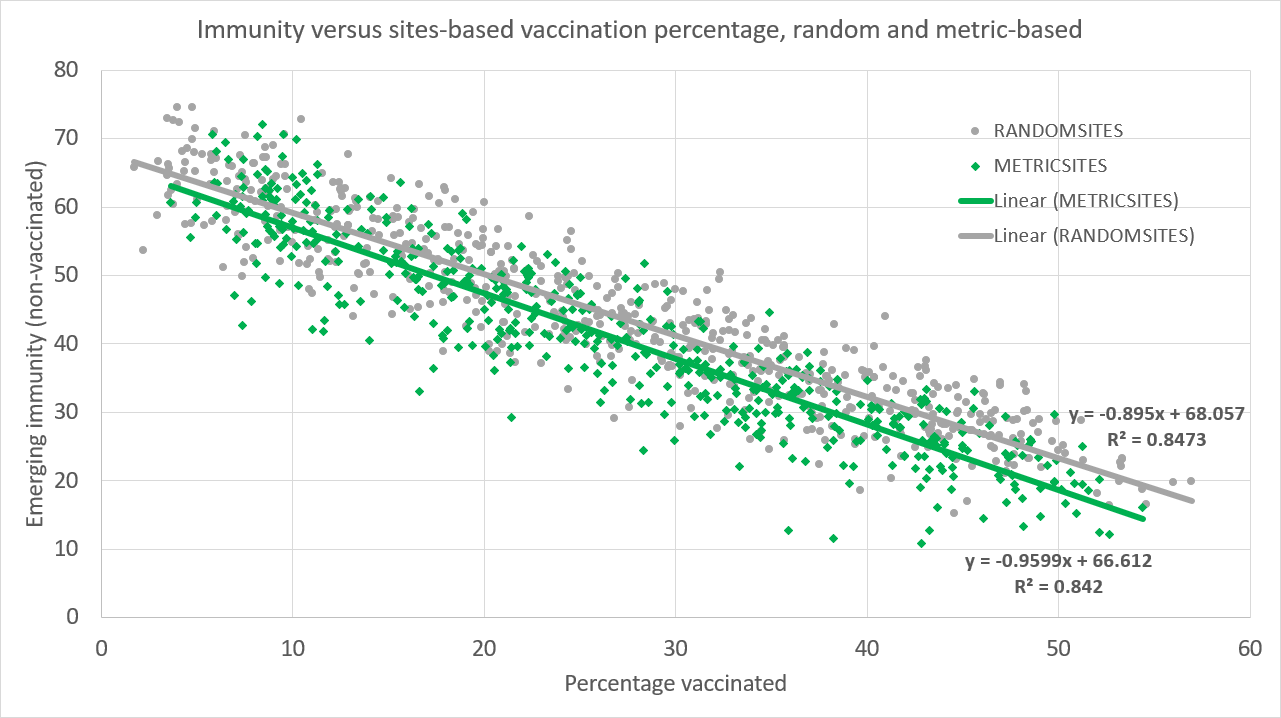
Figure 9 reveals that the vaccination of agents visiting particular sites (e.g., workplaces, schools, supermarkets) offers refined control over the number of infections (i.e., emerging immunity is dropping smoothly in the number of vaccinations). However, the metric-based vaccination strategy (METRICSITES) is not noticeably more effective in lowering immunity (thus, not the infection rate and mortality) than the benchmark case of picking sites uniform randomly (RANDOMSITES).
Conclusions and Discussions
This paper provides an agent-based simulation model to study the characteristics of a new type of policy interventions to contain the spread of COVID-19 in a simplified metropolitan region. In contrast to the real world, the simulation model offers full control over the spatio-temporal behaviour of agents and perfect insight into the disease state of agents, the locations of transmission, etc. The simulation environment therefore allows us to devise policy instruments that use micro-level information (that may not be readily available in reality), trace the impact of policy interventions meticulously and, on top of that, change interaction patterns, infection rates and disease progression parameters to fathom the performance of these interventions.
In the simulated world, macro-level interventions (such as closing all schools/ workplaces/ shops, prohibiting interregional travel) lower the transmission rates, but either the emerging immunity and mortality are very low or very high, or variability in outcomes is substantial. As such, macro-level interventions are effective for suppression, but are a coarse form of mitigation control. Illustratively, intraregional suppression (by a lock-down) leaves the agent population susceptible, and so to prevent a new wave, would call for prohibiting interregional travel until the vaccine is rolled out or alternatively, continuing suppression. In looking for fine-grained control over positioning on the immunity-mortality curve, we experimented with two micro-level interventions: one that targets ‘locking’ of certain (but not all) households and ‘blocking’ certain (but not all) sites based on centrality in the social network. The idea is that instead of closing all schools, one may target closing some schools that are spreading hubs or bridge cliques.
The main finding is that the rate of infection and thereby emerging immunity and mortality is smoothly declining in the number of households locked as well as in the number of sites blocked. In a limited robustness study, this smooth decline is persistent for variation in the agenda and spatial spread of sites visited. Such micro-level interventions based on social network metrics therefore seem to offer refined control over the spatial spread and infection rate (and thereby the number recovering and deceasing). This said, while both the blocking and locking interventions allow refined control over the positioning on the immunity-mortality curve, the major effect of mass spreading events (e.g., concerts, sports events) in the simulation results suggest that these micro-level interventions may be merely seen as complementary to certain macro-level interventions. Using the simulation program, we also studied vaccination of agents at central households and sites and found that both again offer refined control. Moreover, metric-based selection of households to vaccinate outperformed random selection significantly in curbing the spread, and group immunity was reached faster. In contrast, metric-based selection of sites (e.g., offices, schools) at which to vaccinate agents does limit the spread, but it did not outperform random selection significantly.
We stress that due to certain modelling choices, the external validity of findings on micro-level interventions in the simulated world is limited. Notably, the simulation world is small and highly stylized, some parameters are scaled to overcome the small size of the world, and the agendas of agents defining the spatio-temporal interaction are simplified. Although the model does provide suggestions for an alternative class of interventions based on micro-level interventions, the simplified agendas of agents and the limited numbers and types of sites may over- or underestimate the effectiveness of particular policy interventions. Future research could target extending the agent-based model in this direction and we make the source code publicly available. Moreover, since the first version of this model, new empirical data was established, which would permit updating our parameter choices, e.g., transition rates between disease states, hospitalization and ICU rates, state durations, and that these may well depend on age rate. During modelling and running simulations, new findings have been published and some we have not been able to incorporate.
The simulation results reveal a novel class of micro-level interventions (locking, blocking, and piecemeal vaccination of particularly central households and sites) that complements macro-level interventions. Albeit highly stylized with regard to agendas, sites, disease progression and transmission, we see that the network metric-based interventions in the simulated world offer a level of control over infection and thereby immunity and mortality that is more fine-grained than indiscriminate total lockdown. However, there are challenges to overcome in practical application. Finally, the network metric-based interventions as operationalized would require full information on the spatio-temporal pattern of people, which is not readily available in reality. Making estimates for the centrality would require data of (a substantial part of) the population at the individual level, e.g., as available using cell phone data or Corona contact tracing apps, which may be unavailable due to privacy regulations. Moreover, the discriminative character of addressing specific sites or households may be untenable from an ethical perspective.
Acknowledgements
We thank Robert Axtell (GMU), Michael Neugart (TU Darmstadt), Bill Ferguson (Grinnell), and other attendants of the Mason Pandemic Modeling Forum as well as Patrick Mellacher, Christian Neuwirth, Gudrun Wallentin, and other attendants of the workshop "Modelling the Spread and Impact of the Coronavirus” organized by the Schumpeter Centre of the University of Graz for helpful and inspiring comments. We also thank Juan Francisco Robles Fuentes (UGR), Frank Kugelmeier (St. Ursula Attendorn), Tobias Gaisser (TH Nürnberg), Cristina Ponsiglione (UniNa), Aykut Kibritçioğlu (TAU), Eleonora Psenner (EURAC), Yasushi Hara (Hitotsubashi University), Bin-Tzong Chie (TKU), Giuseppe Vizzari (UniMib), Marc Printz (Bluewin), Bogang Jun (Inha), Nicolas Béfort (Neoma), Kurtuluş Barış Öner, Luis Rubalcaba Bermejo (UAH), Rüdiger Kessel (Metrodata), Hans Bitto for testing, validation, ideas, and translations. The remaining errors are our own responsibility.Notes
- An agent-based policy laboratory for COVID-19 containment strategies, https://inno.uni-hohenheim.de/corona-modell.
- https://covid19-scenarios.org/ (last accessed October 8th, 2020).
- https://www.washingtonpost.com/graphics/2020/world/corona-simulator/ (last accessed October 8th, 2020).
- https://meltingasphalt.com/interactive/outbreak/ (last accessed October 8th, 2020).
- The stylized simulation serves as laboratory in which effects of interventions can be studied visually. Given the low number of agents in the visualization, we have permitted a minor scaling for the mortality and thereby impact of interventions. Given that the purpose of the agent-based model is to study the level of control obtained through social networkmetric-based interventions rather than accurate forecasts,we are primarily interested in qualitative, comparative results across simulation runs with the same parameter settings. We provide a limited robustness check for variation in the agents’ agendas as this affects also the social network structure. For readers interested in using the agent-based model to study interventions for alternative parameters or specific empirical cases, we have made the source code publicly available at https://github.com/BenVermeulen/UHOHCoronaPolicyLab.
- The reproduction number \(R\) is the number of susceptible members of a population that are infected by a single infector, while the basic \(R_{0}\) is the ‘pure’ number of infections, i.e., the number whenever there are no encounters with members that are already infected or immune. The \(R\) reported in the simulation model is simply the average number of agents infected by an infectious agent (including the pre-symptomatic stage).
- For terminology on social network analysis, see e.g., Wasserman & Faust (1994).
Appendix
A: Empirical household composition and member ages
The type of household is drawn from the ‘Tp prob’ column and based on the type of household, the age of the reference person is determined based on the probabilities indicated in Table 2. In case of a two-person household, the age of a potential partner is uniform randomly drawn from the same age cohort.
| Household type | Tp prob | 15-19 | 20-29 | 30-39 | 40-49 | 14.19% | 14.71% | 13.92% | 9.92% | 2.21% |
| 1 Adult, 1 Child | 4.51% | 0.13% | 6.07% | 14.94% | 27.19% | 30.92% | 11.28% | 5.12% | 3.44% | 0.91% |
| 1 Adult, 2 Children | 2.15% | 0.00% | 5.11% | 23.06% | 40.03% | 26.45% | 3.81% | 0.84% | 0.56% | 0.14% |
| 1 Adult, 3 Children | 0.68% | 0.00% | 4.39% | 32.21% | 43.63% | 17.42% | 1.90% | 0.29% | 0.00% | 0.15% |
| 2 Adult, 0 Children | 28.29% | 0.10% | 9.22% | 9.41% | 5.78% | 14.86% | 28.46% | 23.97% | 7.67% | 0.54% |
| 2 Adult, 1 Child | 9.53% | 0.01% | 5.57% | 22.44% | 19.53% | 32.62% | 15.40% | 3.62% | 0.76% | 0.05% |
| 2 Adult, 2 Children | 11.49% | 0.00% | 1.95% | 25.05% | 40.27% | 28.19% | 4.06% | 0.42% | 0.06% | 0.01% |
| 2 Adult, 3 Children | 4.51% | 0.00% | 1.04% | 22.77% | 47.58% | 25.83% | 2.44% | 0.29% | 0.02% | 0.02% |
| MISC | 0.51% | 2.73% | 36.91% | 22.85% | 8.59% | 9.77% | 10.16% | 5.66% | 2.73% | 0.59% |
Given the number of children in the household we derive the age of the oldest and youngest child from the empirical distribution from StatLine Dataset 71487 for 2019 of the Dutch statistics agency (CBS), see Table 2 and Table 3. The age is uniform randomly drawn capped by the age of the parent minus 19 years (14 years for parent younger than 20). The age of the middle child, in case of three children, is the arithmetic mean of the ages of the other two siblings.
| Age: 0 – 5 | Age: 6 – 11 | Age: 12 – 17 | Age: 18 – 24 | Age: 25 - | |
| 1 child | 24.78% | 12.27% | 16.25% | 25.57% | 21.13% |
| 2 children | 3 children | |
|---|---|---|
| Age: 0 – 5 & 0 – 5 | 15.51% | 4.40% |
| Age: 0 – 5 & 6 – 11 | 13.16% | 21.59% |
| Age: 0 – 5 & 12 – 17 | 1.06% | 9.70% |
| Age: 0 – 5 & 18 – 24 | 0.18% | 2.61% |
| Age: 0 – 5 & 25 – | 0.01% | 0.10% |
| Age: 6 – 11 & 6 – 11 | 12.32% | 3.72% |
| Age: 6 – 11 & 12 – 17 | 12.34% | 19.86% |
| Age: 6 – 11 & 18 – 24 | 1.06% | 7.94% |
| Age: 6 – 11 & 25 – | 0.06% | 0.62% |
| Age: 12 – 17 & 12 – 17 | 13.10% | 4.12% |
| Age: 12 – 17 & 18 – 24 | 13.25% | 16.68% |
| Age: 12 – 17 & 25 – | 0.40% | 1.93% |
| Age: 18 – 24 & 18 – 24 | 11.04% | 2.99% |
| Age: 18 – 24 & 25 – | 4.12% | 3.21% |
| Age: 25 – & 25 – | 2.38% | 0.50% |
B: Operationalizations of macro-level policy measures
| Policy measure | Operationalization |
| General policy: | |
| Physical measures: distance/ hygiene/ coughing | An infectious agent has to be closer in Euclidian pixel distance, to have a chance to infect a susceptible agent. |
| Interregional travel policy: refuse incoming travellers | Incidental exposure of random, susceptible agent does not occur. |
| School policy: | |
| None: come to school regardless | Agent goes to school when scheduled, unless severely or critically infected, then stays at home or goes to hospital. |
| Bar the ill from entering school | Agent does not go to school but stays home (also) when infected. |
| Close school upon first infected | ‘Block specific’: upon on first infected agent visiting school, close the school for all. |
| Close for one case and isolate households | ‘Block specific’ plus ‘household isolation’: upon first infected agent visiting school, close the school, and all school children and parents stay home. |
| Close all schools | Block all’: close all schools (regardless of states of agents). |
| Office police: | |
| None: come to the office regardless | Agent goes to workplace when scheduled, unless severely or critically infected, then stays at home or goes to hospital. |
| Stay and work from home when sick | Agent does not go to the workplace when infected, but instead works from home (possibly at lower productivity rate). |
| Work from home regardless (when possible) | Agent does not go to the workplace, regardless of state, but instead works from home (possibly at lower productivity rate). |
| Work from home if one employee sick and isolate households | ‘Block specific’ and ‘household isolation’: upon first infected employee, close the office, and employees and family members stay home. |
| Gathering policy: | |
| Gatherings allowed | Agent goes to recreation area when scheduled, unless severely or critically infected, then stays at home or goes to hospital. |
| Gatherings prohibited | Agent does not go to recreation area despite scheduled. |
| Prohibit if even one visitor was ill and isolate households | Block specific’ and ‘household isolation’: agent does not go to recreation area if one visitor is ill, and visitor and family members stay home. |
| Hospitalization policy: | |
| No special admission rules | No specific rules for going to the hospital. |
| Admit only critical cases | If beds are available, critically ill patients are admitted. |
| Admit both severe and critical cases | If beds are available, both severely and critically ill patients are admitted. |
| Hospital capacity | The number of beds per hospital, i.e., the maximum number of patients held at the same time. |
C: Default parameter settings
| Symbol | Variable | Default value |
|---|---|---|
| \(D\) | Infection distance | 2 |
| \(\alpha\) | Infection distance scale | 0.15 (0.05 when ‘physical measures’ policy) |
| ICU capacity | 2 | |
| \(N\) | Nr of households | 200 |
| Nr of initial infections | 1 | |
| \(\rho\) | Hospital recovery ratio | 4 |
D: Robustness for variations in agents’ agendas
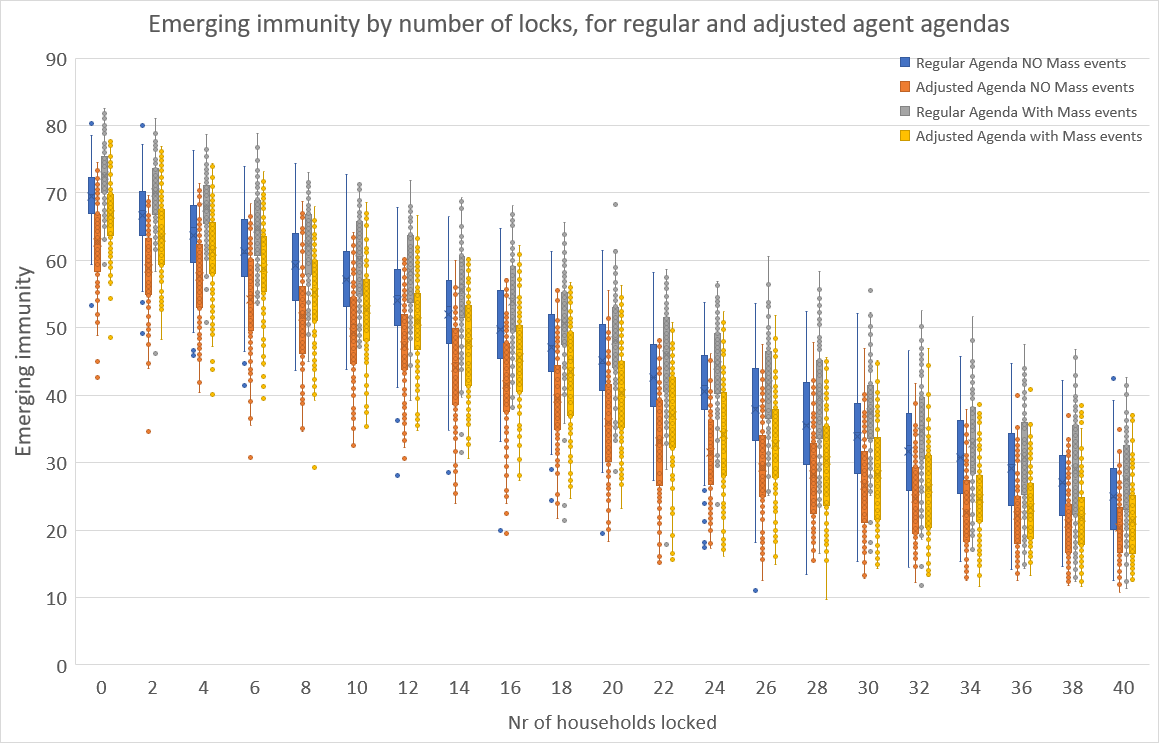
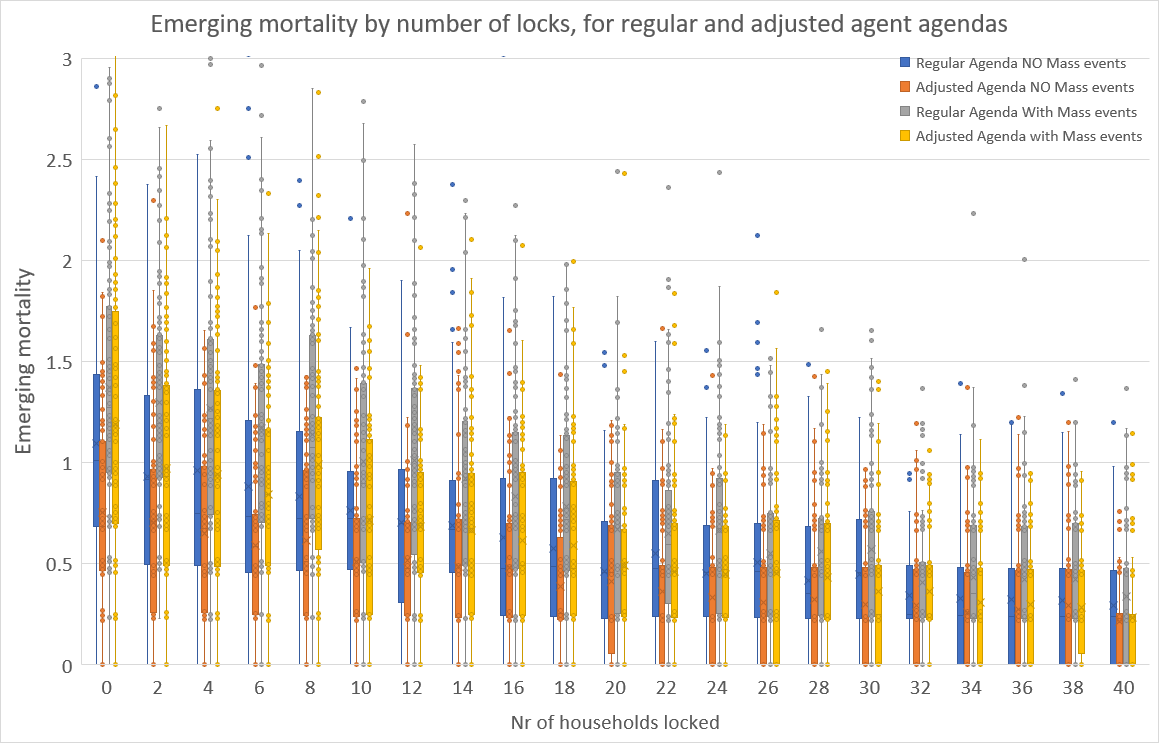
The claim is that the locking policy permits refined positioning on the mortality – immunity curve, and that this holds for a variation of the agents’ agendas. Figure 10 and Figure 11 contain the simulation results for immunity and mortality at the end of 180 periods of simulation runs for 100 runs for a wide range of numbers of households. Here, we have two types of agendas of the agents and in- and excluding mass events (like sports matches, concerts, etc.). There are no other measures, so also interregional travel is permitted and there are no physical hygiene measures imposed.
The ‘regular’ agenda is as described in Section 2.4. The ‘adjusted’ agenda has the variation that children of age \(<\) 13 go to school from 9:00 to 16:00 on workdays, except from 9:00 to 12:30 on Wednesday, thus reflecting common times for primary schools. Teenagers aged 13 - 20 years start at 9:00 or at 10:00 (with probability 0.5), and finish at 15:00 or 16:00 (with probability 0.5), so as to reflect the more variable times for secondary schools. Working adults ($>$20) now start at 8:00 or at 8:30 (each with probability 0.5), and to finish at 17:00 or at 17:30 (with probability 0.5). Moreover, adults now go to the supermarket at 17:30 or at 19:00 (with probability 0.5). The ‘adjusted’ agendas effectively reduce the average duration of interaction or the average number of contacts that agents have, and thereby the chance of getting infected decreases. Indeed, upon comparing the simulation results for the ‘regular’ and the ‘adjusted’ cases in the boxplot graphs, it is clear that emerging immunity and mortality drop (albeit non-significantly) across all numbers of locks. We do acknowledge that further refinements, notably those reducing the duration of interaction or the number of agents interacted with, would further lower immunity and mortality.
However, Figure 10 and Figure 11 do show that for both types of agendas, the gentle downward sloping nature of the boxes remains, which is a confirmation of our claim that the ‘locking’ permits refined positioning on the immunity-mortality curve is robust for variations in agents’ agendas.
References
AJELLI, M., Gonçalves, B., Balcan, D., Colizza, V., Hu, H., Ramasco, J. J., Merler, S., & Vespignani, A. (2010). Comparing large-scale computational approaches to epidemic modeling: Agent-based versus structured metapopulation models. BMC Infectious Diseases, 10(2010), 190. [doi:10.1186/1471-2334-10-190]
AKSAMENTOV, I., Noll, N., & Neher, R. (2020). COVID-19 scenario webapp. at: https://covid19-scenarios.org/.
ALEMAN, D. M., Wibisono, T. G., & Schwartz, B. (2011). A nonhomogeneous agent-Based simulation approach to modeling the spread of disease in a pandemic outbreak. Interfaces, 41(3), 301–315. [doi:10.1287/inte.1100.0550]
AN der Heiden, M., & Buchholz, U. (2020). Modellierung von Beispielszenarien der SARS-CoV-2-Epidemie 2020 in Deutschland. Robert Koch-Institut (RKI).
ANDERSON, R. M., Heesterbeek, H., Klinkenberg, D., & Hollingsworth, T. D. (2020). How will country-based mitigation measures influence the course of the COVID-19 epidemic? The Lancet, 395(10228), 931–934. [doi:10.1016/s0140-6736(20)30567-5]
BAI, Y., Yao, L., Wei, T., Tian, F., Jin, D. Y., Chen, L., & Wang, M. (2020). Presumed asymptomatic carrier transmission of COVID-19. JAMA, 323(14), 1406–1407. [doi:10.1001/jama.2020.2565]
BALCAN, D., Colizza, V., Gonçalves, B., Hu, H., Ramasco, J. J., & Vespignani, A. (2009). Multiscale mobility networks and the spatial spreading of infectious diseases. Proceedings of the National Academy of Sciences, 106(51), 21484–21489. [doi:10.1073/pnas.0906910106]
BONABEAU, E. (2002). Agent-based modeling: Methods and techniques for simulating human systems. Proceedings of the National Academy of Sciences, 99(3), 7280–7287. [doi:10.1073/pnas.082080899]
CROOKS, A. T., & Hailegiorgis, A. B. (2014). An agent-based modeling approach applied to the spread of cholera. Environmental Modelling & Software, 62, 164–177. [doi:10.1016/j.envsoft.2014.08.027]
CUNHA, B. A. (2004). Influenza: Historical aspects of epidemics and pandemics. Infectious Disease Clinics of North America, 18(1), 141–155. [doi:10.1016/s0891-5520(03)00095-3]
EPSTEIN, J. M., & Axtell, R. (1996). Growing Artificial Societies: Social Science from the Bottom Up. Washington, DC: Brookings Institution Press. [doi:10.7551/mitpress/3374.001.0001]
FERGUSON, N., Laydon, D., Nedjati Gilani, G., Imai, N., Ainslie, K., Baguelin, M., Bhatia, S., Boonyasiri, A., Cucunuba Perez, Z., Cuomo-Dannenburg, G., Dighe, A., Dorigatti, I., Fu, H., Gaythorpe, K., Green, W., Hamlet, A., Hinsley, W., Okell, L., Van Elsland, S., … Ghani, A. (2020). Report 9: Impact of non-pharmaceutical interventions (NPIs) to reduce COVID19 mortality and healthcare demand. Imperial College London. Available at: https://www.imperial.ac.uk/mrc-global-infectious-disease-analysis/covid-19/report-9-impact-of-npis-on-covid-19/. [doi:10.12688/wellcomeopenres.15805.1]
FERGUSON, N. M., Cummings, D. A. T., Fraser, C., Cajka, J. C., Cooley, P. C., & Burke, D. S. (2006). Strategies for mitigating an influenza pandemic. Nature, 442(7101), 448–452. [doi:10.1038/nature04795]
GENSINI, G. F., Yacoub, M. H., & Conti, A. A. (2004). The concept of quarantine in history: From plague to SARS. The Journal of Infection, 49(4), 257–261. [doi:10.1016/j.jinf.2004.03.002]
GILBERT, N. (2008). Agent-Based Models. usand Oaks, CA: Sage Publications.
GUZZETTA, G., Ajelli, M., Yang, Z., Merler, S., Furlanello, C., & Kirschner, D. (2011). Modeling socio-demography to capture tuberculosis transmission dynamics in a low burden settings. Journal of Theoretical Biology, 289, 197–205. [doi:10.1016/j.jtbi.2011.08.032]
HALLORAN, E. M., M., F. N., Eubank, S., Longini, I. M., Cummings, D. A. T., Lewis, B., Xu, S., Fraser, C., Vullikanti, A., Germann, T. C., Wagener, D., Beckman, R., Kadau, K., Barrett, C., Macken, C. A., Burke, D. S., & Cooley, P. (2008). Modeling targeted layered containment of an influenza pandemic in the United States. Proceedings of the National Academy of Sciences, 105(12), 4639–4644. [doi:10.1073/pnas.0706849105]
HELLEWELL, J., Abbott, S., Gimma, A., Bosse, N. I., Jarvis, C. I., Russell, T. W., Munday, J. D., Kucharski, A. J., Edmunds, W. J., Sun, F., Flasche, S., Quilty, B. J., Davies, N., Liu, Y., Clifford, S., Klepac, P., Jit, M., Diamond, C., Gibbs, H., … Eggo, R. M. (2020). Feasibility of controlling COVID-19 outbreaks by isolation of cases and contacts. The Lancet Global Health, 8(4), 488–496. [doi:10.1016/s2214-109x(20)30074-7]
HUNTER, E., Mac Namee, B., & Kelleher, J. (2018). An open-data-driven agent-based model to simulate infectious disease outbreaks. PloS One, 13(12), e0208775. [doi:10.1371/journal.pone.0208775]
HUNTER, E., Mac Namee, B., & Kelleher, J. D. (2017). A taxonomy for agent-Based models in human infectious disease epidemiology. Journal of Artificial Societies and Social Simulation, 20(3), 2: https://www.jasss.org/20/3/2.html. [doi:10.18564/jasss.3414]
KERMACK, W. O., & McKendrick, A. G. (1927). A contribution to the mathematical theory of epidemics. Proceedings of the Royal Society of London (Series A), 115(772), 700–721.
KILBOURNE, E. D. (2006). Influenza pandemics of the 20th century. Emerging Infectious Diseases, 12(1), 9–14. [doi:10.3201/eid1201.051254]
LI, Q., Guan, X., Wu, P., Wang, X., Zhou, L., Tong, Y., Ren, R., Leung, K. S. M., Lau, E. H. Y., Wong, J. Y., Xing, X., Xiang, N., Wu, Y., LI, C., Chen, Q., LI, D., Liu, T., Zhao, J., Liu, M., … Feng, Z. (2020). Early transmission dynamics in Wuhan, China, of novel Coronavirus–Infected pneumonia. The New England Journal of Medicine, 382, 1199–1207. [doi:10.1056/nejmoa2001316]
MACAL, C. M., & North, M. J. (2009). Agent-based modeling and simulation. 2009 Winter Simulation Conference (WSC 2009). Austin, TX, USA. [doi:10.1109/wsc.2009.5429318]
NGUYEN, L., Megiddo, I., & Howick, S. (2019). Simulation models for transmission of health care-associated infection: A systematic review. American Journal of Infection Control, 48(7), 810–821. [doi:10.1016/j.ajic.2019.11.005]
ROCHE, B., Drake, J. M., & Rohani, P. (2011). An agent-Based model to study the epidemiological and evolutionary dynamics of influenza viruses. BMC Bioinformatics, 12(87), 1–10. [doi:10.1186/1471-2105-12-87]
VERITY, R., Okell, L. C., Dorigatti, I., Winskill, P., Whittaker, C., Imai, N., Cuomo-Dannenburg, G., Thompson, H., Walker, P. G. T., Fu, H., Dighe, A., Griffin, J. T., Baguelin, M., Bhatia, S., Boonyasiri, A., Cori, Z., A.and Cucunubá, FitzJohn, R., Gaythorpe, K., Green, W., … Ferguson, N. M. (2020). Estimates of the severity of coronavirus disease 2019: A model-based analysis. The Lancet Infectious Diseases, 20(6), 669–677. [doi:10.1016/s1473-3099(20)30243-7]
WANG, L., & Li, X. (2014). Spatial epidemiology of networked metapopulation: An overview. Chinese Science Bulletin, 59(28), 3511–3522. [doi:10.1007/s11434-014-0499-8]
WASSERMAN, S., & Faust, K. (1994). Social Network Analysis: Methods and Applications.. Cambridge: Cambridge University Press.
WORLD Health Organization. (2020). Report of t