Using Agent-Based Modelling to Assess Scenarios for Enhanced Soil and Water Conservation in the Boset District, Ethiopia

,
and
Wageningen University and Research, Netherlands
Journal of Artificial
Societies and Social Simulation 24 (4) 8![]()
<https://www.jasss.org/24/4/8.html>
DOI: 10.18564/jasss.4714
Received: 10-Oct-2020 Accepted: 04-Oct-2021 Published: 31-Oct-2021
Abstract
The sustainability of the ongoing Campaign-Based Watershed Management (CBWM) program in Ethiopia is questionable due to poor planning and implementation of the Soil and Water Conservation (SWC) structures. This study uses an empirically based, agent-based model to explore the effect of six scenarios on both area of land covered by, as well as the quality of SWC structures in three Kebeles (villages) of Boset District. The analysis revealed that integrating multiple interventions enhanced SWC most in all Kebeles. Furthermore, increasing the commitment of local government through capacity building generated most effect and yet required the lowest investment. Motivating farmers, introducing alternative livelihood opportunities and establishing and strengthening micro-watershed associations had limited, but differential influence on the outcomes across the Kebeles. However, all alternative scenarios had some added value compared to doing business as usual. Hence, in order to enhance the outcomes and sustainability of the ongoing CBWM program in the study area and other similar localities, it is crucial to pay much more attention to increasing the commitment of local government actors through capacity building. This empowers local government actors to (1) plan and more efficiently implement the program in consultation with other local actors, and (2) integrate locally sensitive need-based adaptation of the program.Introduction
The Campaign-Based Watershed Management (CBWM) program is a national initiative that has been implemented in Ethiopia since 2011/12 to conserve natural resources and improve rural livelihoods. The program epitomizes a complex Social-Ecological Systems (SES) as it has been carried out through mass mobilization of farmers, with the coordination of local administration and technical support of extension workers at the Kebele/ village levels (the smallest administrative unit in Ethiopia, similar to a ward). The main activities include constructing Soil and Water Conservation (SWC) structures (communal land, private farmland) and planting tree seedlings (communal land) for 30 to 40 days annually without any form of payment to the farmers (Wolka 2014). The program has been acclaimed for ensuring the implementation of various SWC structures over a large area at low cost in a short period of time (Haregeweyn et al. 2015; Teshome et al. 2016). The sustainability of the program activities however, has often been questioned. In particular, areas questioned include: top-down planning approach (Assefa et al. 2021b; Snyder et al. 2014); low awareness and motivation of farmers to participate in the program (Abi et al. 2019; Assefa et al. 2021b); poor commitment of local government actors due to limited knowledge and skills, poor logistics, and inadequate budget (Assefa et al. 2021b, 2021a); focus on construction of SWC structures giving less attention to livelihoods (Wolka 2014; Abi et al. 2019); and little attention to the maintenance of the SWC structures (Assefa et al. 2021b; Snyder et al. 2014). These aspects point to various weaknesses of the CBWM program that have not yet been analysed systematically within the context of a complex SES.
Agent-Based Modelling (ABM) is the most promising approach to enhance our understanding of the problem, and at the same time effectively manage complex SES systems (Gilbert & Troitzsch 2005; Railsback & Grimm 2012). The approach has been used to test theories (e.g., Jager et al. 2000; Ghorbani et al. 2013; Parker & Meretsky 2004), conduct scenario-analysis to explore alternative strategies (e.g., Valbuena et al. 2008; An 2012; Hailegiorgis et al. 2018; Kaufmann et al. 2009) and facilitate discussions, learning and negotiations between actors (e.g., Campo et al. 2010; García-Barrios et al. 2011; Naivinit et al. 2010; Smajgl 2010). Though the overwhelming majority of ABMs are used to test theories or understand systems (Groeneveld et al. 2017), there is a gap in their use as policy tools to conduct scenario analysis or explore management strategies to support operational decisions in SES (Matthews et al. 2007; Schulze et al. 2017). However, as ABMs have become more widely used, there is a general tendency to develop descriptive models underpinned by empirical data to conduct scenario analysis or explore alternative strategies (Matthews et al. 2007). This focus on descriptive models is mainly attributed to the increasing covet among policy makers for model-based evidence to make problems more traceable and back up decisions (Clark & Holmes 2010).
Hence, implementing ABM in the CBWM program would extend our understanding of the system by virtual experimentation of various management options, as well as suggesting a more sustainable management strategy. While ABMs have been successfully used to analyse land use/land cover change (Matthews et al. 2007; Parker et al. 2003), environmental management (Kelly et al. 2013), and collective actions in common pool resource problems (Poteete et al. 2010; Schill et al. 2016), their use in representing and analysing CBWM or other related mass-mobilization based SWC interventions has been limited. Even so, these models are mostly narrow in scope or represent a particular system that are barely related to the specific case of the CBWM program. Furthermore, though participatory process are crucial to represent the decision-making behaviour of actors in the model (Seidl 2015), ABMs are scarcely underpinned by data collected through participatory processes and other reliable empirical data. These would be essential to conduct scenario analysis as well as facilitate discussions, learning and negotiations among actors in the collective SWC initiatives (e.g., Pak & Brieva 2010).
This approach would require developing an ABM of the CBWM program from scratch using empirical data collected through multiple methods, including interviews, household survey, GIS and RPGs. Models that are constructed using in-depth data from the field can successfully be used for social learning and scenario analysis (Fleskens et al. 2014; Pak & Brieva 2010). The main purpose of this paper is to briefly present a description of the conceptual model and an analysis of model results to explore alternative watershed management strategies, by comparing outcomes generated by different scenarios in and across three Kebeles (villages) in Boset District. The main aim is to show broader patterns of change in coverage with as well as variations in quality of SWC structures under different scenarios.
Methodological Set-Up
The ABM was developed and applied in Boset District of Oromia Regional State in the Central Rift Valley of Ethiopia (Figure 1). Here, climate variability and land degradation, particularly soil fertility depletion and water erosion, seriously affects agricultural production (Adimassu et al. 2012). The study focused on administrative boundaries (rather than hydrological boundaries), because the CBWM program is planned and implemented according to the administrative boundaries. Boset District has a total land area of 137,849 ha and an estimated total population of 174,659 in 2013, out of which 78.7% (137,517) live in rural areas (CSA, Central Statistical Agency 2013). According to BDFEDO, Boset District Finance and Economic Development Office (2012), about 89% of the district belongs to the tropical (25-30 °C) agro-climatic zone, while about 11% is subtropical (15-20 °C). The intensity of rainfall varies across different localities in the district, with average annual rainfall ranging between 700 and 800 mm (BDFEDO, Boset District Finance and Economic Development Office 2012). The district has experienced increased soil erosion rates over the past decades, with annual rates of 31 t ha-1 in 1973 and 56 t ha-1 in 2006 (Meshesha et al. 2012, 2014).
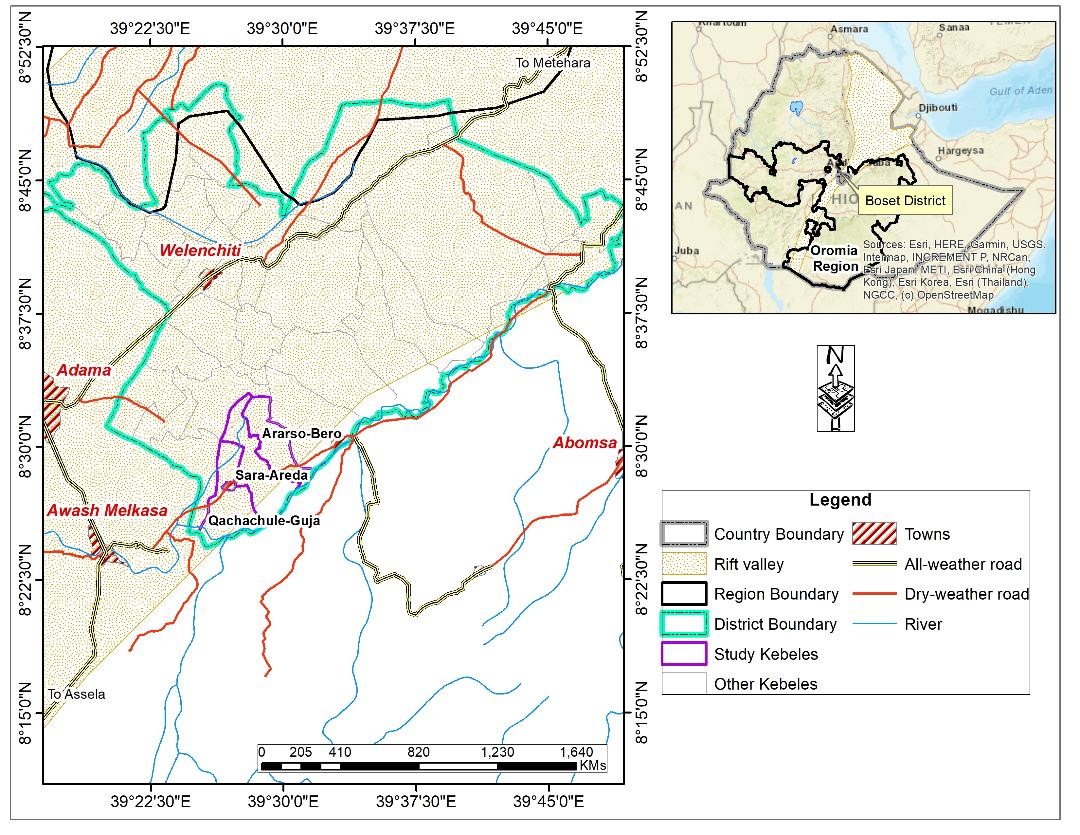
Among the 33 rural Kebeles in the District, three adjacent Kebeles namely Ararso-Bero, Sara-Areda, and Qachachule-Guja were selected based on their performance in the CBWM program activities carried out between 2011/12 and 2015/16. According to BDAO, Boset District Agriculture Office (2015), Ararso-Bero is the best performing Kebele in the District, while Sara-Areda and Qachachule-Guja are moderate and weak, respectively, when considering ownership, quality and quantity of watershed management activities as criteria. This gives us the opportunity to analyse processes and factors that contribute to variation in achievement across the Kebeles and explore alternative sustainable management strategies. The study Kebeles altogether included a total of 4,068 households (1449 in Ararso-Bero, 1414 in Sara-Areda, 1205 in Qachachule-Guja) and covered a total area of 10,669 ha; where Ararso-Bero, Sara-Areda, and Qachachule-Guja Kebeles constitute 2760 ha, 3913 ha, and 3996 ha respectively (BDAO, Boset District Agriculture Office 2015). In terms of outcomes, five micro-watersheds (intervention units for the CBWM program) were developed in Sara-Areda and Qachachule-Guja; while four micro-watersheds were developed in Ararso-Bero between 2011/12 and 2015/16 (Assefa et al. 2018).
The CBWM program activities are carried out each year in one or more micro-watersheds at the Kebele levels. The main activities include: (1) selecting new micro-watershed/s each year, (2) constructing SWC structures such as stone and soil bunds and planting tree seedlings through campaign works in the select micro-watershed/s, and (3) handing over the micro-watersheds on communal land and private farmland to associations responsible for the maintenance and protection activities and individual owners respectively (Assefa et al. 2021b, 2021a).
The study followed a Participatory Agent-Based Modelling approach. It began with an in-depth analysis of the CBWM program, followed by the construction of an ABM and the exploration of scenarios. To examine the CBWM program, mixed research methods were used. First, household surveys and interviews were used to assess the attributes, decision-making behaviour, and interactions among actors in the CBWM program (see Assefa et al. 2021b). This data was used to represent the micro-level decision-making behaviour of actors in the model.
Second, Google Earth Engine, a household survey and interviews were used to explore CBWM program outcomes (e.g., Assefa et al. 2018). The main aim was to gather quantitative estimates of outcomes (area of micro-watersheds, lengths of SWC structures, vegetation cover) of the program. Data on the outcomes of the program was crucial to analyse macro level conditions and calibrate the most important parameters in the model. The first conceptual model was prepared using Unified Modelling Language (UML) based on the actors’ decision-making and outcomes of the program.
Third, the conceptual model was validated by developing and employing a Role-Playing Game (RPG) (e.g., Assefa et al. 2021a). The game was developed based on input data from the Google Earth Engine, a household survey, and interviews. It aimed to assess farmers’ decision-making and facilitating discussions and mutual learning among actors to make collective decisions on alternative watershed management strategies. In this regard, the game was an important platform in refining our understanding or further exploration of actors’ behaviour and interactions, and explore scenarios or possible solutions to be tested in the model.
Finally, the revised conceptual model was described using the “Overview, Design concepts, and Details” (ODD) protocol (Grimm et al. 2010). Following Balke & Gilbert (2013) and Johnson et al. (2014), the model was designed by deriving probabilities of behaviour from empirical data and then attaching these to agents, using more qualitative data to identify the behaviour of actors and parameter values. The model’s results are presented using descriptive statistics.
The Model
Model description
The model simulates the CBWM program in three Kebeles of Boset District to explore conditions that enhance coverage with and quality of SWC structures. It has 36 system parameters with their default values and ranges (see Appendix A). The model includes three agents (farmers, Kebele administrator, extension workers) and the physical environment that interact with each other. The physical environment is represented by fields and each field is equal to 0.25 ha. The fields have attributes of slope, land use (farmland vs communal land), whether it is inside a selected/developed micro-watershed or not, whether it has SWC structures or not, and the quality of SWC structures (Table 1). The topography of the landscape is diffused from highest slope to lowest. Land use is assigned to fields based on slope, where all fields with slope \(>\) 30% is considered communal land (Gebreselassie et al. 2015). The initial number of micro-watersheds and area of land covered with SWC structures were set based on empirical data collected from the Kebeles (Assefa et al. 2018). The initial quality of SWC structures in 2015/16 is an average of 100 runs set in the calibration process, i.e. the model was initiated in 2011/12 and average quality in 2015/16 was adopted as initial value for scenario analysis (see https://doi.org/10.25937/e62c-x304).
| State variables | Values | Descriptions | Sources |
|---|---|---|---|
| Position (static) | Coordinates | - | Authors’ judgment |
| Owned-by (static) | farmer code | Shows the farmer who owns this field. Set based on average farm size of the three Kebeles: 1.28 ha. | Household survey (Assefa et al. 2021b) |
| Slope (static) | % | The topography of the landscape is diffused from highest slope to lowest at initialization. | Authors’ judgment |
| Land-use (static) | farmland or communal land | Shows whether this field is in the farmland or communal land. It is assigned to fields based on slope, where all fields with slope > 30% is considered communal land. | Gebreselassie et al. (2015) |
| Communal-microwatershed? (dynamic) | true/false | Shows whether this field is inside the micro-watershed on communal land or not. | Google Earth Engine (Assefa et al. 2021b) |
| Farmland-microwatershed? (dynamic) | true/false | Shows whether this field is inside the micro-watershed on farmland or not. | Google Earth Engine (Assefa et al. 2021b) |
| Communal-swccover? (dynamic) | true/false | Shows whether this field in micro-watersheds on communal land is covered with SWC structures or not. | Google Earth Engine (Assefa et al. 2021b) |
| Farmland-swccover? (dynamic) | true/false | Shows whether this field in micro-watersheds on farmland is covered with SWC structures or not. | Google Earth Engine (Assefa et al. 2021b) |
| Quality-SWC (dynamic) | 0-10 | Shows initial quality of SWC structures. Model initiated in 2011/12 and average quality-SWC in 2015/16 is taken as initial quality-SWC for scenario analysis. | Authors’ judgment |
| Micro-watershed -name (static) | field code | Shows name of micro-watersheds. The initial micro-watersheds were named “initial” and subsequently newly selected micro-watersheds were named: 0, 1, 2, etc. | Authors’ judgment |
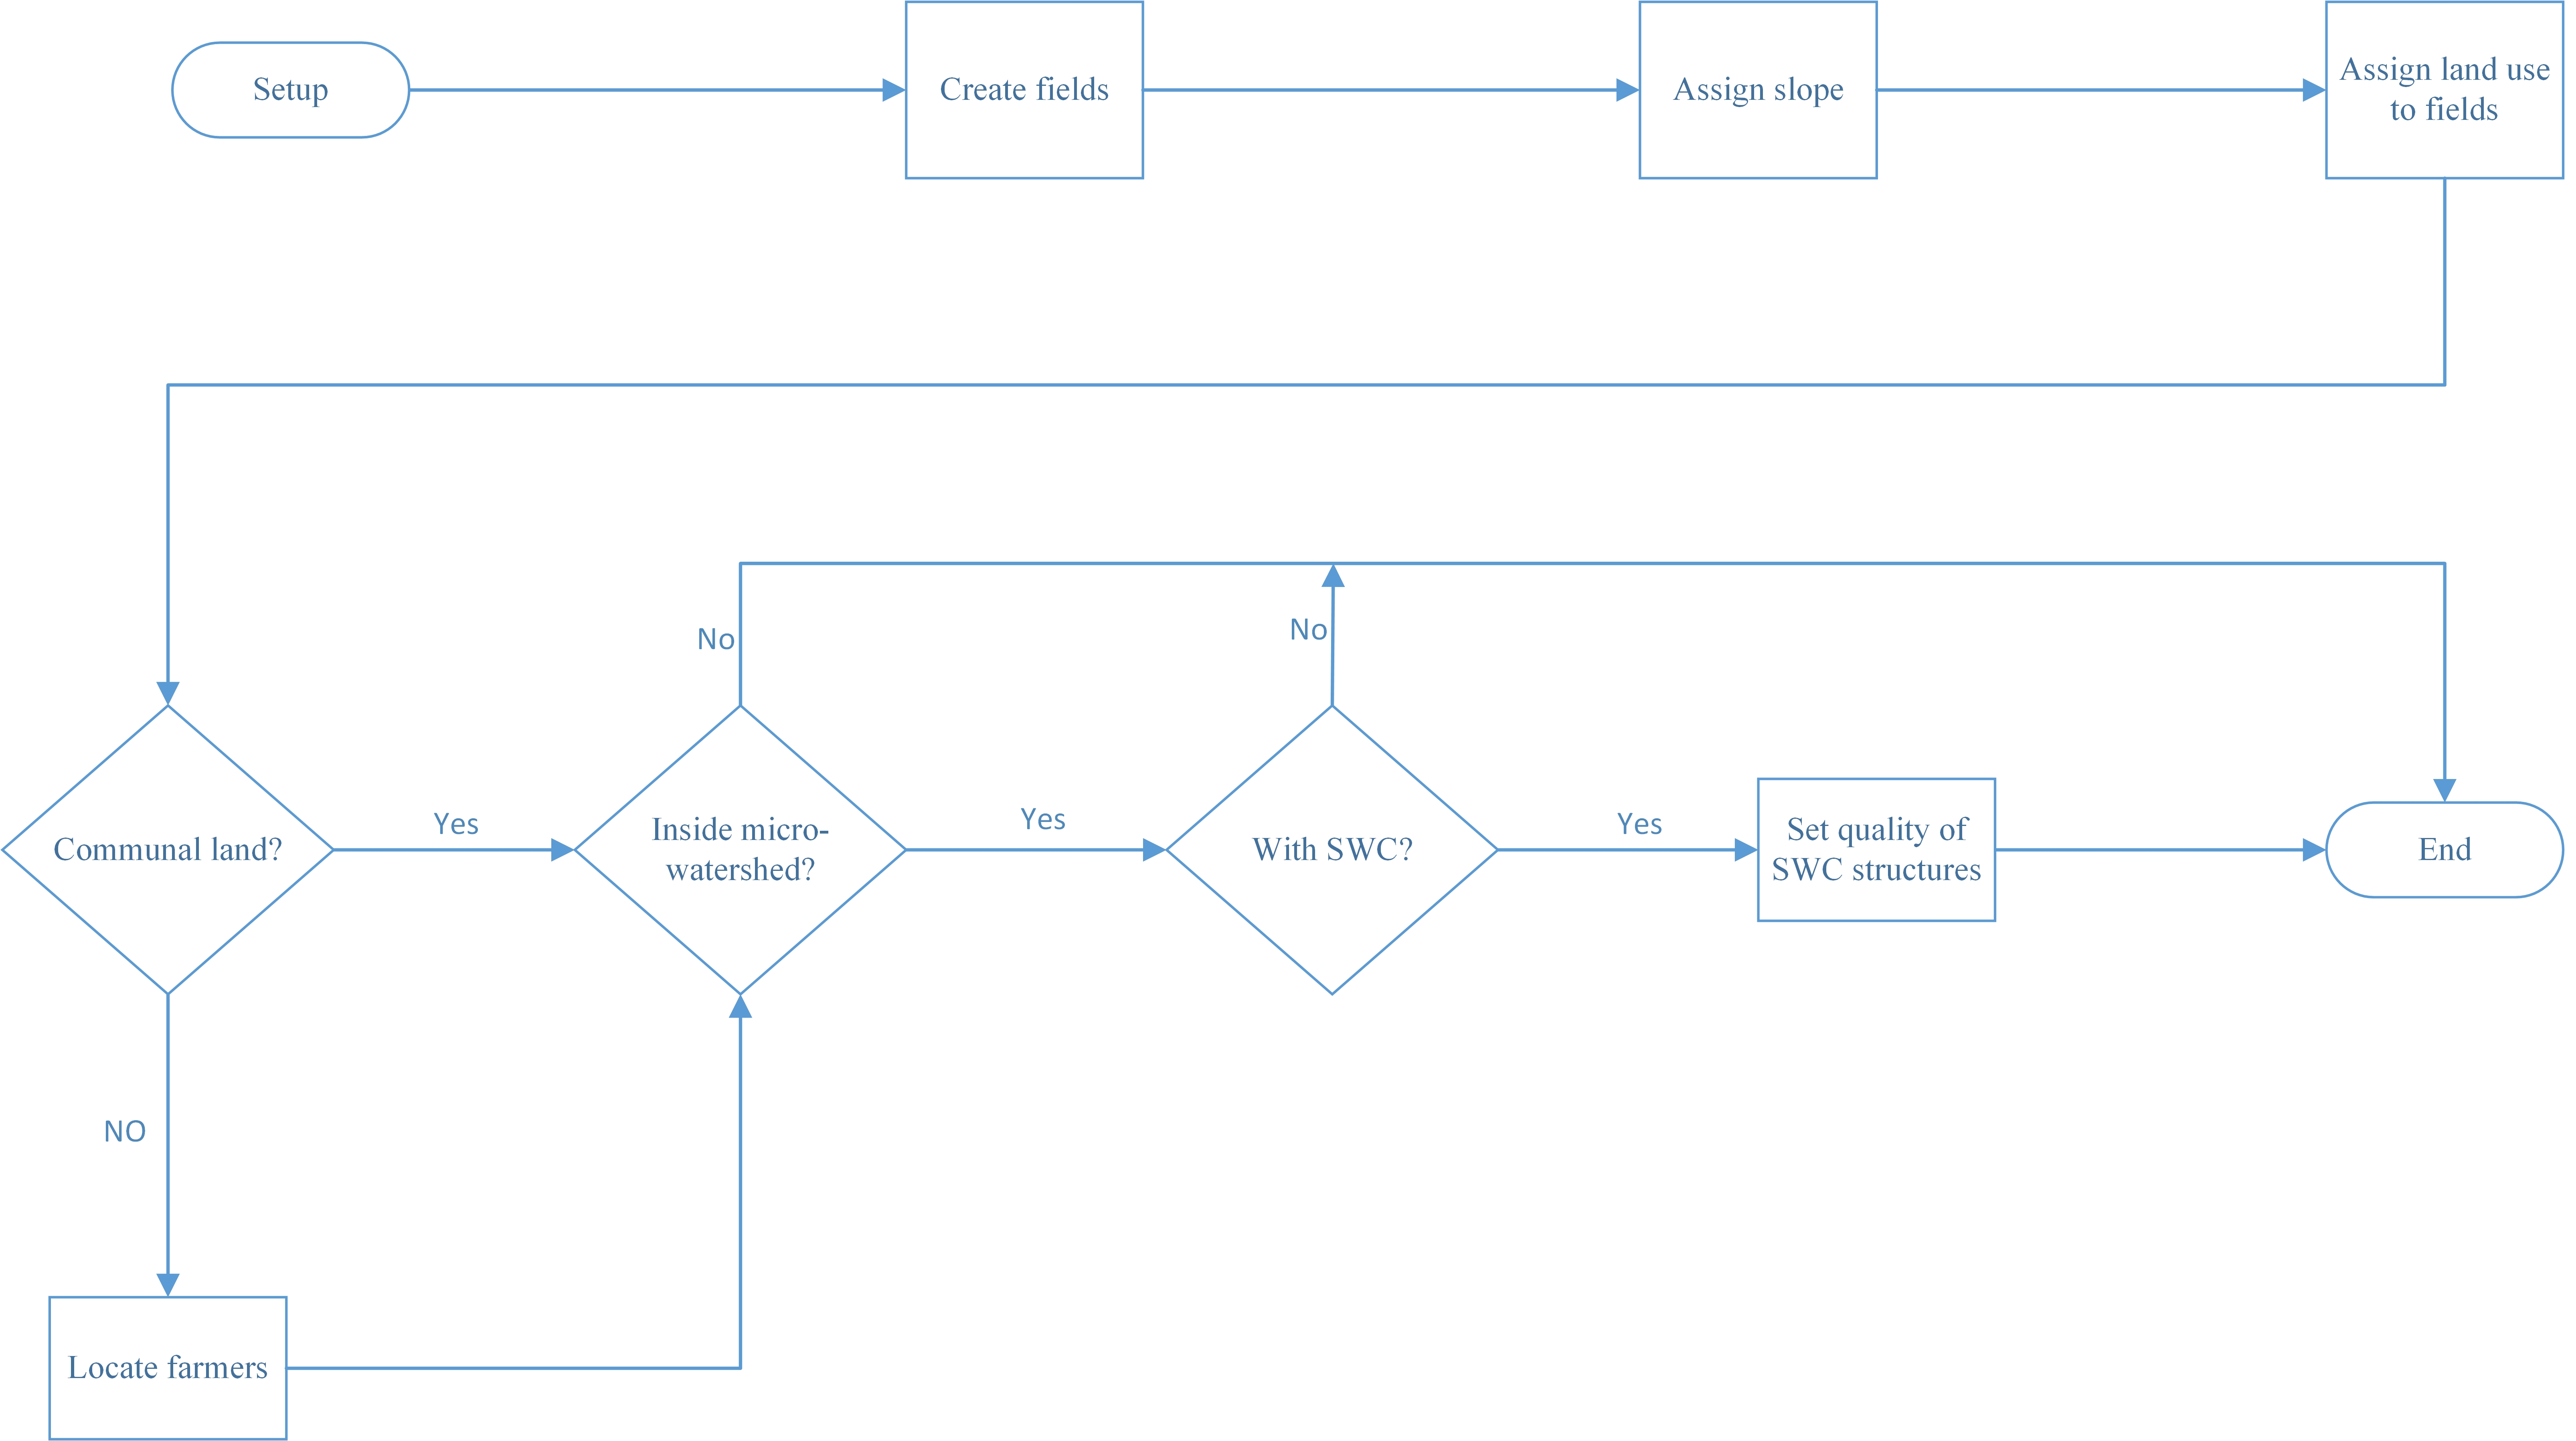
The physical environment is initialized in the model following the steps shown in Figure 2.
The farmers are created and randomly distributed to farmland (see Table 2 for state variables of the farmers). All farmers own farmland in their vicinity. Some are members of micro-watershed associations. The values of most state variables were assigned to farmers randomly based on normal distributions with mean and standard deviations collected from the Kebeles. Income was set by initiating the model in 2011/12 and average income in 2015/16 was used as initial value for scenario analysis (see https://doi.org/10.25937/e62c-x304).
The Kebele administrator has two static state variables: position and commitment-Kebele-administrator (showing the commitment of Kebele administrator to exert its responsibilities). The extension workers have two similar static state variables: position and commitment-extension-workers (showing the commitment of the extension workers to exert their responsibilities). Kebele administrator and extension workers were placed around the centre of the physical environment, and the values of their state variables (i.e., commitment) were set based on qualitative data collected from key informants and RPG (see Table 2).
| State variables | Values | Descriptions | Sources |
|---|---|---|---|
| position (static) | Coordinates | Randomly distributed at initialization to fields on farmland | Authors’ judgment |
| own-farmland (static) | Patch-Id | Each farmer owns the fields or farmland in their vicinity; set based on average farm size of the three Kebeles | Household survey (Assefa et al. 2021b) |
| education (static) | 0-10 | Shows the class farmers completed (0 = Illiterate, 10 = 10 and above); randomly distributed at initialization | Household survey (Assefa et al. 2021b) |
| extent-off-farmparticipation (static) | 0-10 | Shows the extent to which the farmer participates in off-farm activities; randomly distributed at initialization | Household survey (Assefa et al. 2021b) |
| degree-participation-local- organizations (static) | 0-10 | The extent to which the farmer participates in different local organizations; randomly distributed at initialization | Household survey (Assefa et al. 2021b) |
| perceived-performance- Kebele-administrator (static) | 0-10 | Shows farmer’s perception of the commitment of Kebele administrator; randomly distributed at initialization | RPG |
| income (dynamic) | ≥0 | Initial wealth (stock) of the farmer (birr); randomly distributed at initialization. Income initiated in 2011/12 using farm size (3000 birr per 0.25 ha) and average income in 2015/16 | Household survey (Assefa et al. 2021b) |
| social capital (dynamic) | 0-10 | Shows the position or status of the farmer in the Kebele; randomly distributed at initialization | Household survey (Assefa et al. 2021b) |
| perception-watershed (dynamic) | 0-10 | Shows farmer’s perception of the problem of watershed degradation and future benefits of the program; randomly distributed at initialization | Household survey (Assefa et al. 2021b) |
| extent-off-farm-participation (static) | 0-10 | Shows the extent to which the farmer participates in off-farm activities; randomly distributed at initialization | Household survey (Assefa et al. 2021b) and RPG (Assefa et al. 2021a) |
| membership-watershed -association (dynamic) | True/ False | Shows whether this farmer is a member of a micro-watershed association or not | Household survey (Assefa et al. 2021b) |
| commitment-member -micro-watersheds (dynamic) | 0-10 | Shows the commitment of members of micro-watershed associations; randomly distributed at initialization | Key informant interviews (Assefa et al. 2021b) and RPG (Assefa et al. 2021a) |
| measures (dynamic) | praise, no measure, aware, reprimand, punish | Shows the measure taken against this farmer by Kebele administrator. "No measure" at initialization | Key informant interviews (Assefa et al. 2021b) and RPG (Assefa et al. 2021a) |
| Kebele administrator | |||
| position (static) | Coordinates | Randomly placed around centre | Authors’ judgment |
| commitment-of-Kebele -administrator (static) | 0 – 10 | Shows the commitment of Kebele administrator | Key informant interviews (Assefa et al. 2021b) and RPG (Assefa et al. 2021a) |
| Extension workers | |||
| position (static) | Coordinates | Randomly placed around centre | Authors’ judgment |
| commitment-of-extension- workers (static) | 0 – 10 | Shows the commitment of extension workers | Key informant interviews (Assefa et al. 2021b) and RPG (Assefa et al. 2021a) |
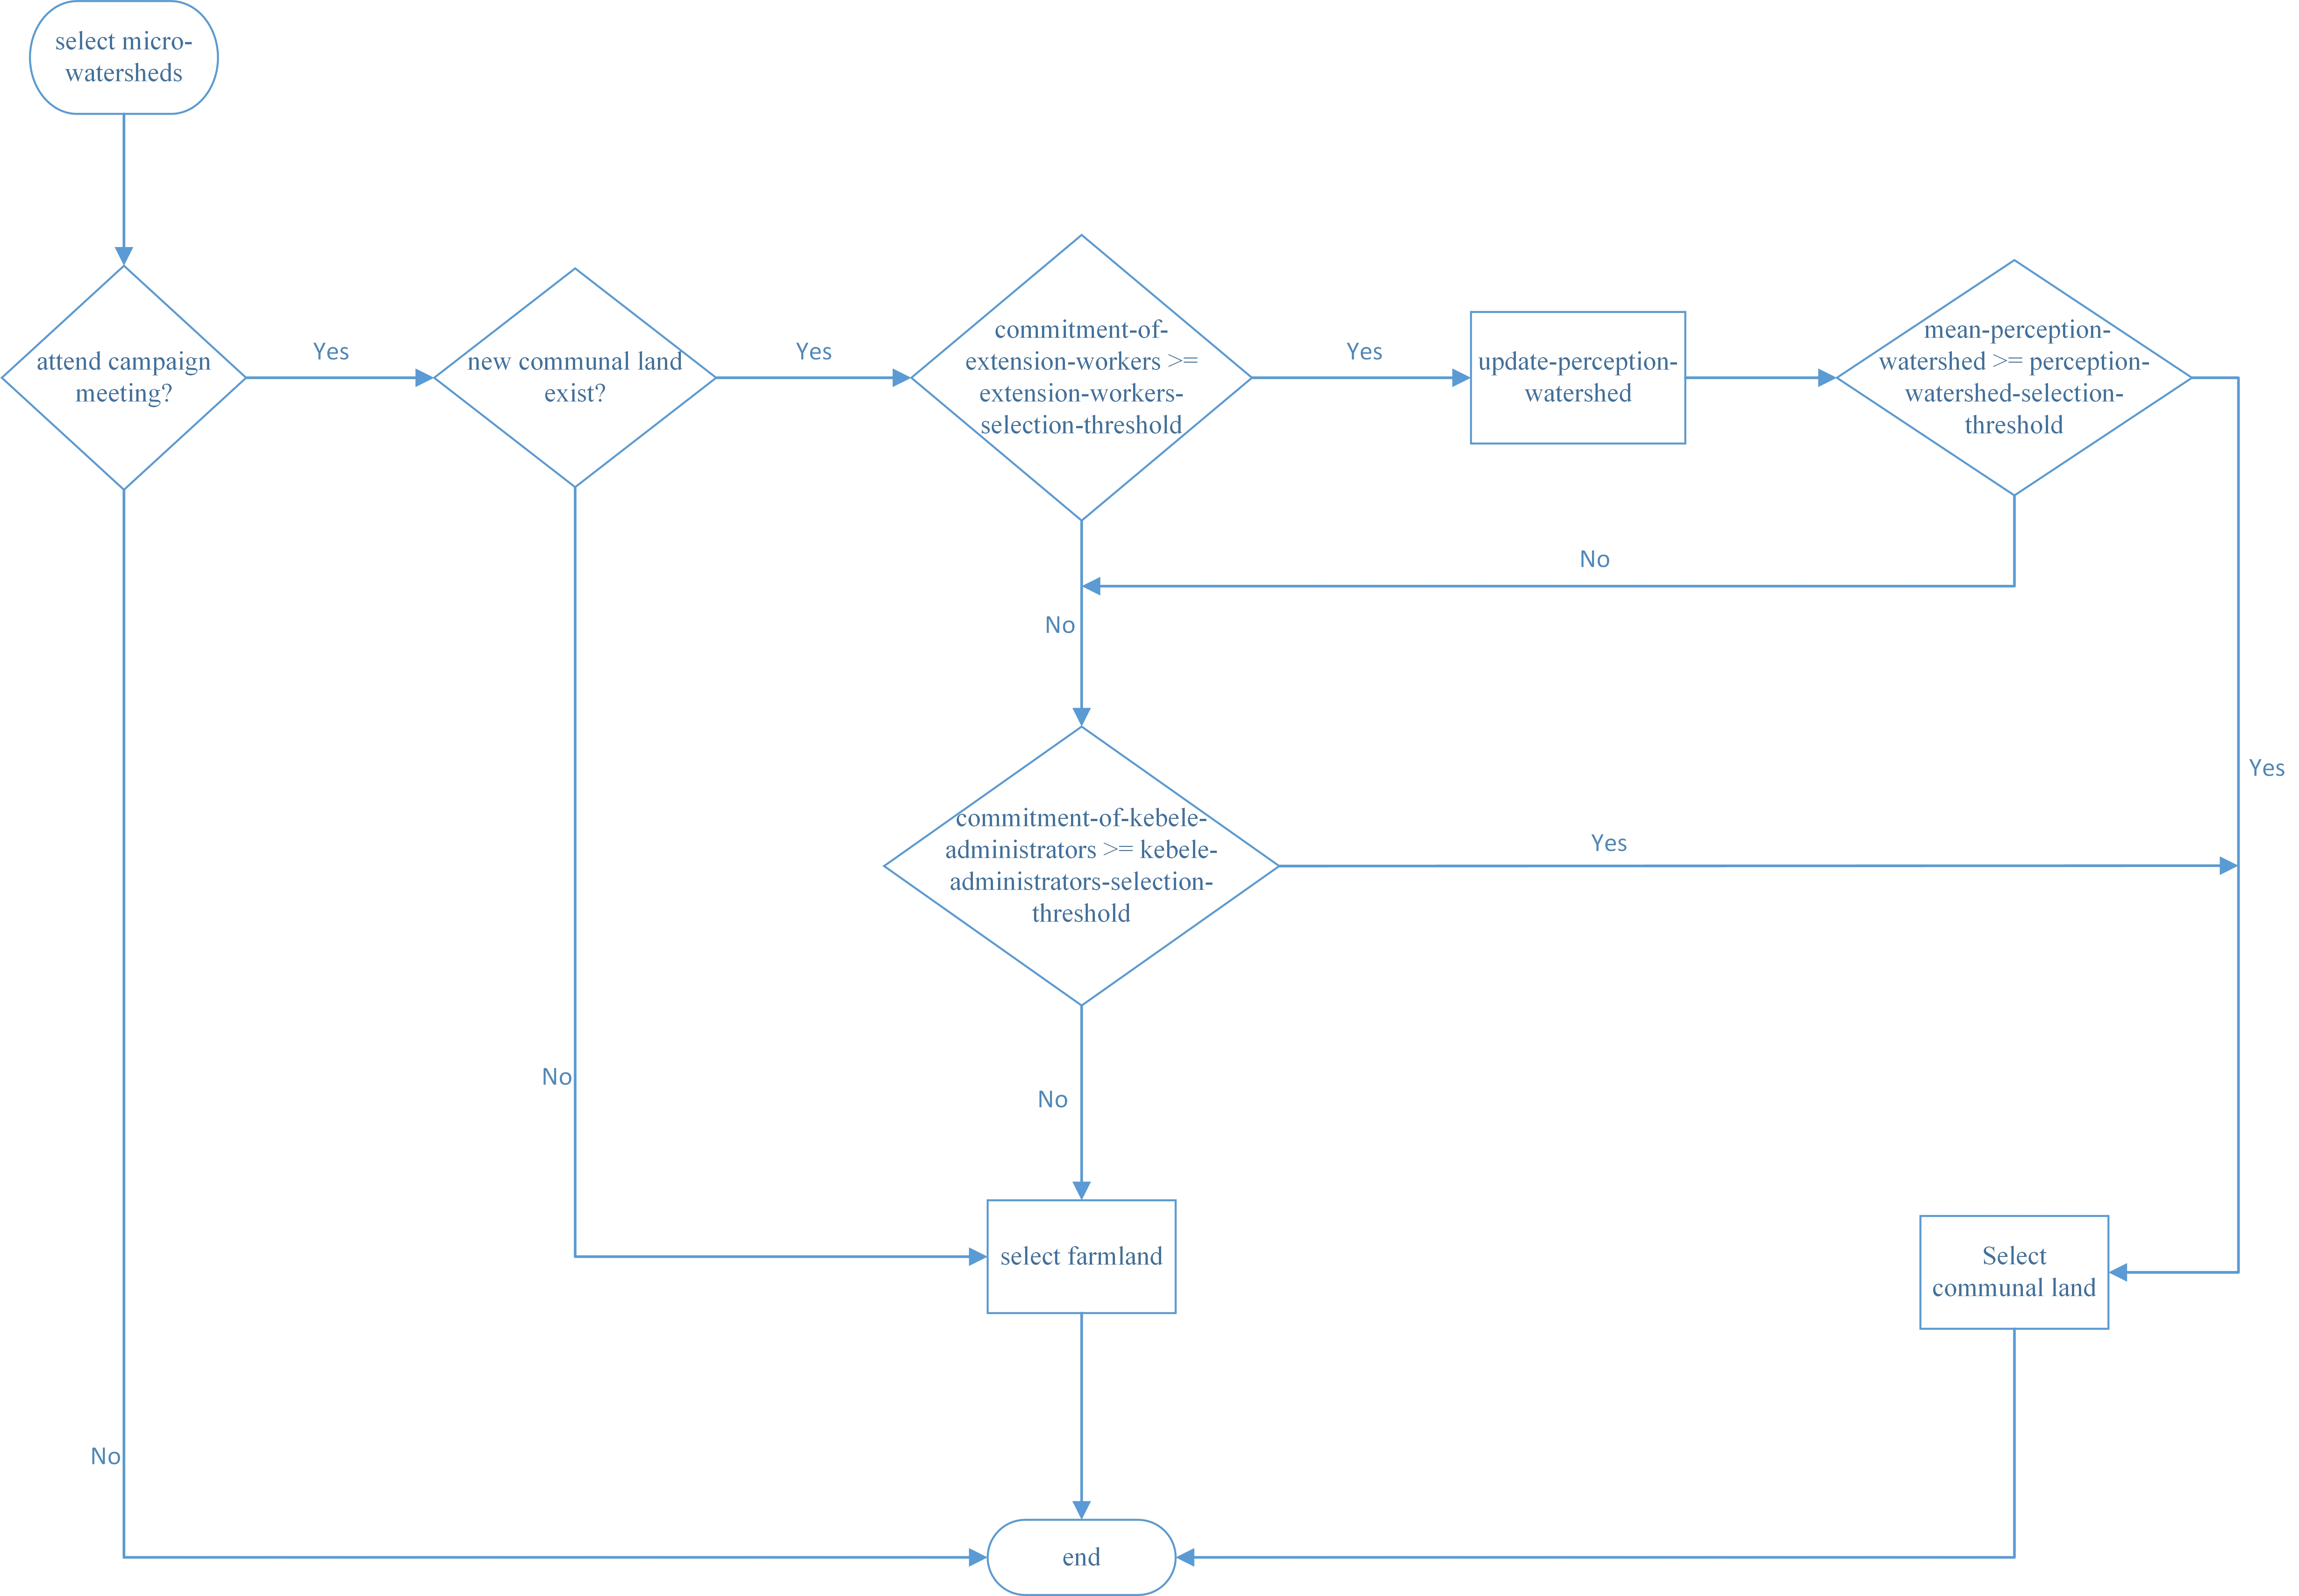
The model has three key processes: (1) selection of new micro-watersheds to be developed, (2) construction of SWC structures through campaign works, and (3) maintenance decisions, where agents interact based on their roles and responsibilities (see Figure 3 for farmers’ decision-making behaviour).
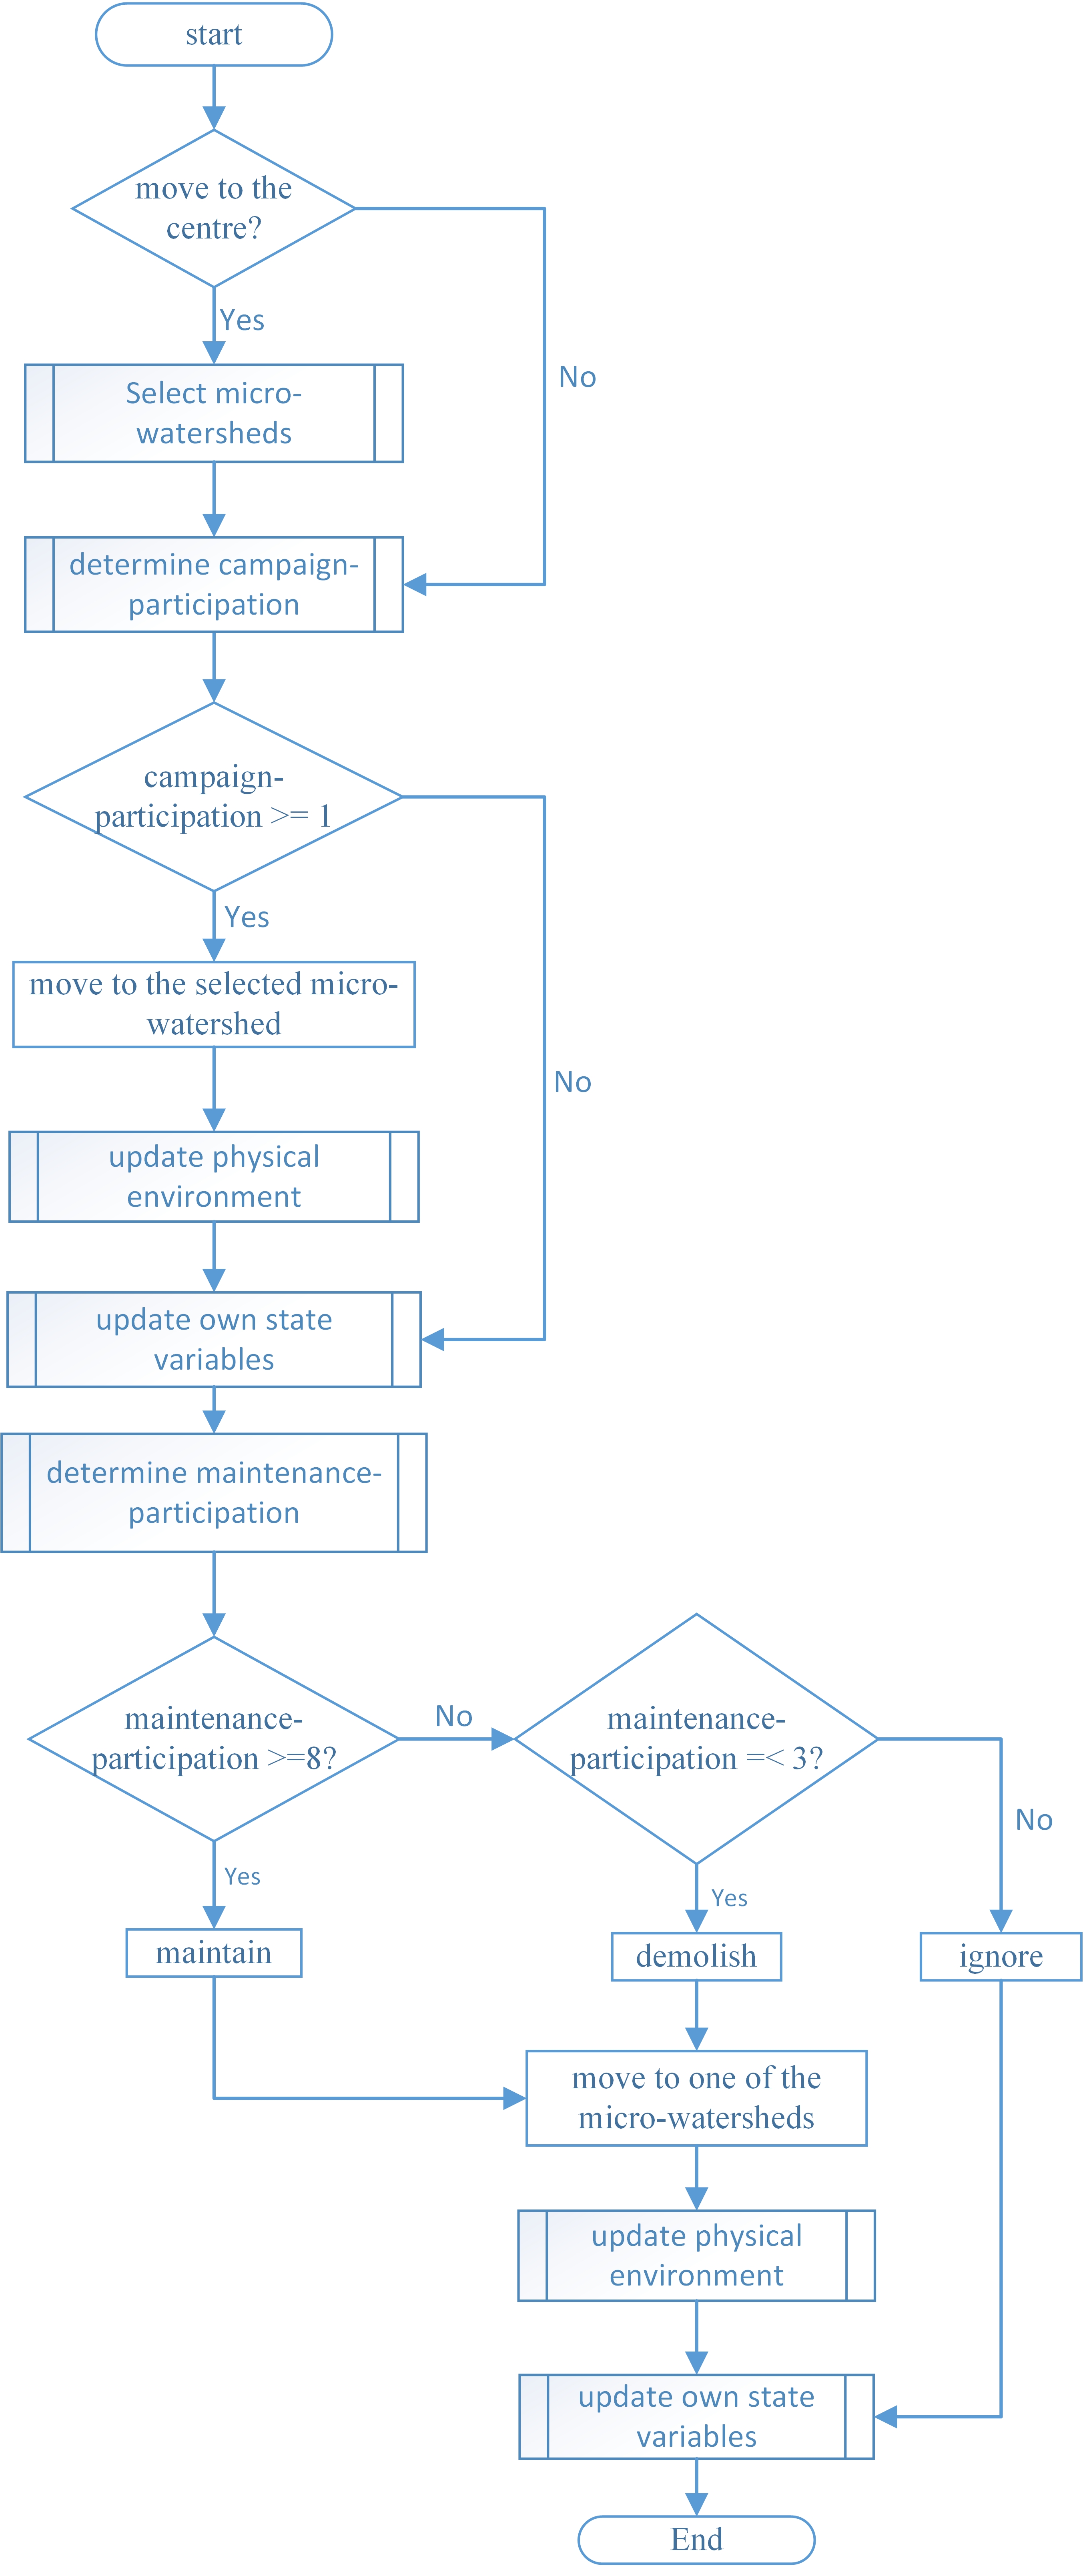
Each time step or year, the agents meet to select a new micro-watershed (see Appendix B for flowchart of farmers’ decision-making during the selection of new micro-watersheds). The movement of farmers to the meeting centre and their selection of technically viable (higher slope) fields depends on their perception-watershed. The movement of extension workers and Kebele administrator to the meeting centre depends on their commitment. The main objective of extension workers is to improve the farmers’ perception-watershed of the program so that they first select fields upstream (with steeper slopes). However, the influence of extension workers depends on their commitment. The Kebele administrator also aims to ensure the selection of fields upstream, before proceeding to the lower areas. Depending on his/her commitment, he/she has the authority to enforce the selection of particular fields.
During campaign works, the agents are expected to move to the newly selected micro-watershed to exert their responsibilities. Farmers randomly occupy fields in the selected micro-watershed to build SWC structures (see Appendix C for farmers’ campaign participation and its effect on the physical environment and farmers). They make decisions to participate in campaign works either due to their own attributes or by copying the decision of their neighbour with highest perception-watershed of the program. The extension workers randomly move in the selected micro-watershed to ensure the quality of SWC structures. At this stage, the Kebele administrator has dual roles: (1) take measures based on farmers’ level of participation, and (2) establish a new association when the micro-watershed is on communal land.
Based on their attributes, farmers could either decide to “maintain”, “ignore” or “demolish” SWC structures (see Appendix D for farmers’ maintenance decision and its effect on the physical environment and farmers). Farmers whose maintenance decision is “maintain” or “demolish” randomly move to the micro-watersheds to repair and remove the structures respectively. A farmer whose maintenance decision is “ignore” does not move. Ignored SWC structures decay over time. At this stage, the extension workers and Kebele administrator randomly move across all micro-watersheds to ensure maintenance quality of SWC structures and to take measures based on farmers’ decisions respectively. The movement of both extension workers and Kebele administrators depends on their commitment.
Each time step in the simulation represents one year, which updates the dynamic attributes of farmers, area of land covered with SWC structures, and quality of SWC structures. The simulation runs for 25 years, but this can be adjusted in the interface of the model. The random seed is used during sensitivity analysis, calibration of parameters, and scenario analysis.
Scenario definition
The scenarios are essentially modifications on the ongoing CBWM program and constitute motivating farmers, establishing and strengthening micro-watershed associations, introducing alternative livelihood opportunities for the poorer farmers, enhancing the commitment of local government actors, and integrating the above interventions. All the scenarios were obtained from previous analysis on the program (Assefa et al. 2021b, 2021a). They are framed as “what-if” situations with different initializations, rather than as pathways of how to evolve from the current program. They are described as follows using illustrative terms.
Default-scenario: Business as usual
This scenario is simulated to establish a baseline and compare this with other scenarios. It shows patterns of change in outcomes of the program in the current condition or without any modification. In this scenario, all variables of farmers, extension workers, and the Kebele administrator are fixed and all model parameters are set to the values for which the model is validated.
Motivation-scenario: Enhance farmers’ awareness and motivation through capacity building
In the CBWM program, the awareness and motivation of farmers influence their level of participation in all Kebeles and stages of the program (Assefa et al. 2021b, 2021a). This is best epitomized by farmers’ perception of watershed degradation and future benefits of the program and literacy education in the study Kebeles. In this scenario, farmers’ perception-watershed is set to the maximum value of 10 and the level of education was doubled. In addition, though there was a common understanding that punishing non-participating farmers is against the government directive, local government actors punish disobedient farmers (Assefa et al. 2021b). Considering that this approach is less likely to ensure genuine participation and intrinsic motivation, punishment is excluded from the model in this scenario.
Association-scenario: Establishing and strengthening micro-watershed associations
In the post-implementation stage of the CBWM program, micro-watersheds on communal land are handed over to associations, which are supposed to maintain, protect and use the micro-watersheds. In reality, in Qachachule-Guja, not a single micro-watershed was handed over to associations and there has not been any maintenance of the micro-watersheds. In other Kebeles, the associations rarely undertook maintenance due to their poor institutional, financial and technical capacities (Assefa et al. 2021b). To show the establishment of new micro-watershed associations n-new members is set at 10 (default number of members every year). In order to denote strengthening micro-watersheds associations, commitment-of-members is set at the maximum value of 10 at initialization. In the model, commitment-of-members is updated based on income from micro-watersheds (financial capacities), social capital among members (institutional capacities) and perception-watershed (technical capacities).
Livelihood-scenario: Introducing alternative livelihood opportunities
Out-migration for off-farm employment limited the availability of farmers to participate in the CBWM program (Assefa et al. 2021b, 2021a). Hence, it is important to integrate and diversify program activities for better local livelihood opportunities and minimize seasonal migration of farmers to other localities. This will enhance the willingness of farmers to genuinely participate in the program. In the livelihood-scenario, the poorer segment of farmers (total wealth <= 500 birr) receive additional income (500 birr) each year. Income minimizes farmers’ level of participation in off-farm activities in other localities and enhances their participation in the program.
Commitment-scenario: Enhancing the commitment of local government actors through capacity building
Capacity building of local government actors is essential to empower and motivate local leaders to develop their sense of ownership of the program so that they can motivate farmers to engage in the program and ensure quality constructions of SWC structures (Assefa et al. 2021b, 2021a). In this scenario, number-of-extension-workers is set to three (standard number) and both the commitment-of-extension-workers and commitment-of-Kebele-administrator are set at the maximum value of 10.
All-scenario: Integration of multiple interventions
This scenario involves integrating motivation-scenario, association-scenario, livelihood-scenario and commitment-scenario to assess the joint effect of these interventions.
Observed outcomes
The effect of scenarios on the performance of the CBWM program was evaluated in the three Kebeles using two model outcomes:
- Area of land covered with SWC structures: In this model, this outcome is reported in hectare. Patches with SWC structures quality score of greater than or equal to one (i.e., >= 1) are considered to have SWC structures.
- Quality of SWC structures: Average score of the quality of SWC structures on fields that SWC structures have been constructed on. The score ranges between 0 and 10 (0 = no SWC structures, 10 = highest quality).
Simulation procedure: Verification, sensitivity analysis, calibration and validation
Different strategies were employed to make the model “bug free” or ensure that it does what it is intended to do, including (1) employing multiple methods in the collection of empirical data that is used to setup the model, (2) using a number of intermediate outcomes and diagnostics, (3) testing the model with parameter values that are at the extremes of what is possible and ensure that the outcomes are reasonable, and (4) following both agents and patches during simulations to check that their behaviour is in line with expectations.
The simulation of the model starts in the year 2011/12 and ends in 2040/41. The period between 2011/12 and 2015/16 was used to calibrate the model using the data obtained through Google Earth Engine. One-at-a-time sensitivity analysis was used to get insight in how changes in parameter values influence model outcome by varying values of one parameter, while keeping values of other parameters at the default settings. Each configuration of input parameters was run 100 times to calculate a Sensitivity Score (SS) of each parameter (see https://doi.org/10.25937/e62c-x304 for calculation of SS). Parameters with a relatively high value of SS indicate processes that are important in the model, while those with low value of SS indicate relatively unimportant processes that could be left out of further sensitivity analysis (Railsback & Grimm 2012). SS was calculated for the three Kebeles using both area of land covered with SWC structures and quality of SWC structures (Table 3).
| Ararso-Bero | Sara-Areda | Qachachule-Guja | |||||
| No | Parameters | Area with SWC | Quality of SWC | Area with SWC | Quality of SWC | Area with SWC | Quality of SWC |
| 1 | perception-watershed selection-threshold* | -0.014 | 0.042 | 0.002 | -0.002 | -0.934 | -1.000 |
| 2 | kebele-administrators-move- campaign-threshold* | -0.590 | -0.753 | -0.642 | -0.861 | -0.068 | -0.020 |
| 3 | w-perceived-performance-kebele-administrators-maintenance** | 1.361 | 1.865 | 1.182 | 1.650 | 0.113 | 0.249 |
| 4 | w-off-farmparticipationmaintenance** | 1.466 | 2.193 | 1.411 | 1.941 | 0.399 | 0.776 |
| 5 | w-perception-watershed-maintenance** | 0.946 | 1.390 | 0.835 | 1.206 | 0.063 | 0.196 |
| 6 | maintenance-threshold*** | -3.151 | -4.789 | -2.910 | -4.067 | -0.594 | -1.277 |
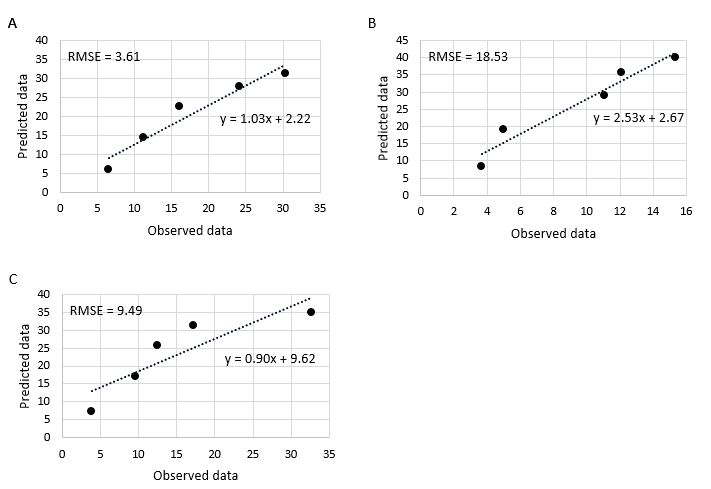
The most important (as determined by SS) and most uncertain (absence of reliable empirical data) parameters were calibrated to reduce their uncertainty. This involved finding good values for a few especially important parameters by assessing what parameter values cause the model to reproduce patterns observed in the real system. In this study, calibration was conducted by comparing observed data on area of land covered with SWC structures between 2011/12 and 2015/16 (Assefa et al. 2018) with data predicted by the model. Root Mean Square Error (RMSE) shows that the model adequately predicted the patterns of area of land covered with SWC structures in the Kebeles, particularly in Ararso-Bero (Figure 4).
The calibration of the model was followed by validation, which was conducted to determine if the model is an adequate representation of the real system. The conceptual model developed through a household survey, key informant interviews, and individual case studies was validated by conducting RPG to refine behaviour rules underpinning decisions of agents within the ABM. The scenarios are triggered in the year 2016/17, since empirical data used to setup the model was mostly collected in the year 2015/16.
Results
This section presents the effect that the six scenarios or management options have on the patterns of change of area of land covered and quality of SWC structures over 25 time-steps or years. It also presents the degree of influence of the scenarios on these outcomes in order of their importance. All the results represent an average of 100 simulation runs.
Patterns of change in model outcomes
The results of the scenario analysis showed that the area of land covered with SWC structures increased over time for all scenarios in all Kebeles, while the quality of SWC structures decreases - except for all-scenario in Ararso-Bero and Qachachule-Guja (Figure 5). This could be attributed to the construction of more SWC structures through annual campaign works, and yet limited maintenance and ownership of the structures. In addition, as shown in Figure 5, there was a steeper decline in quality of SWC structures at the beginning of the simulation (until 2020/21), because farmers mostly worked on communal land during this period, where maintenance of SWC structures is lower than on private farmland. Thus, maintenance of SWC structures on communal land is the main challenge and this suggests from the outset the need to integrate multiple interventions (all-scenario), focusing on enhancing the commitment of local government actors through capacity building (commitment-scenario) for better results.
Another notable result was that both the all-scenario and the commitment-scenario increase area of land covered with SWC structures linearly from the initial year and keep the quality of SWC structures around average in all Kebeles (Figure 5, Table 4). These scenarios gave higher outcomes compared to the default-scenario starting from the beginning of the simulation (for quality of SWC structures) and around 2030/31 during the mid of the simulation (for area of land covered). As shown in Table 4, the difference between outcomes from these scenarios and those of the default-scenario also increases over time. This suggests that the scenarios were important in both the short-term and long-term and their influence increased over time. It appears that enhancing the commitment of local government actors through capacity building increases achieving the outcomes faster, because the actors will effectively take their responsibilities in the CBWM program using different strategies, including control instruments.
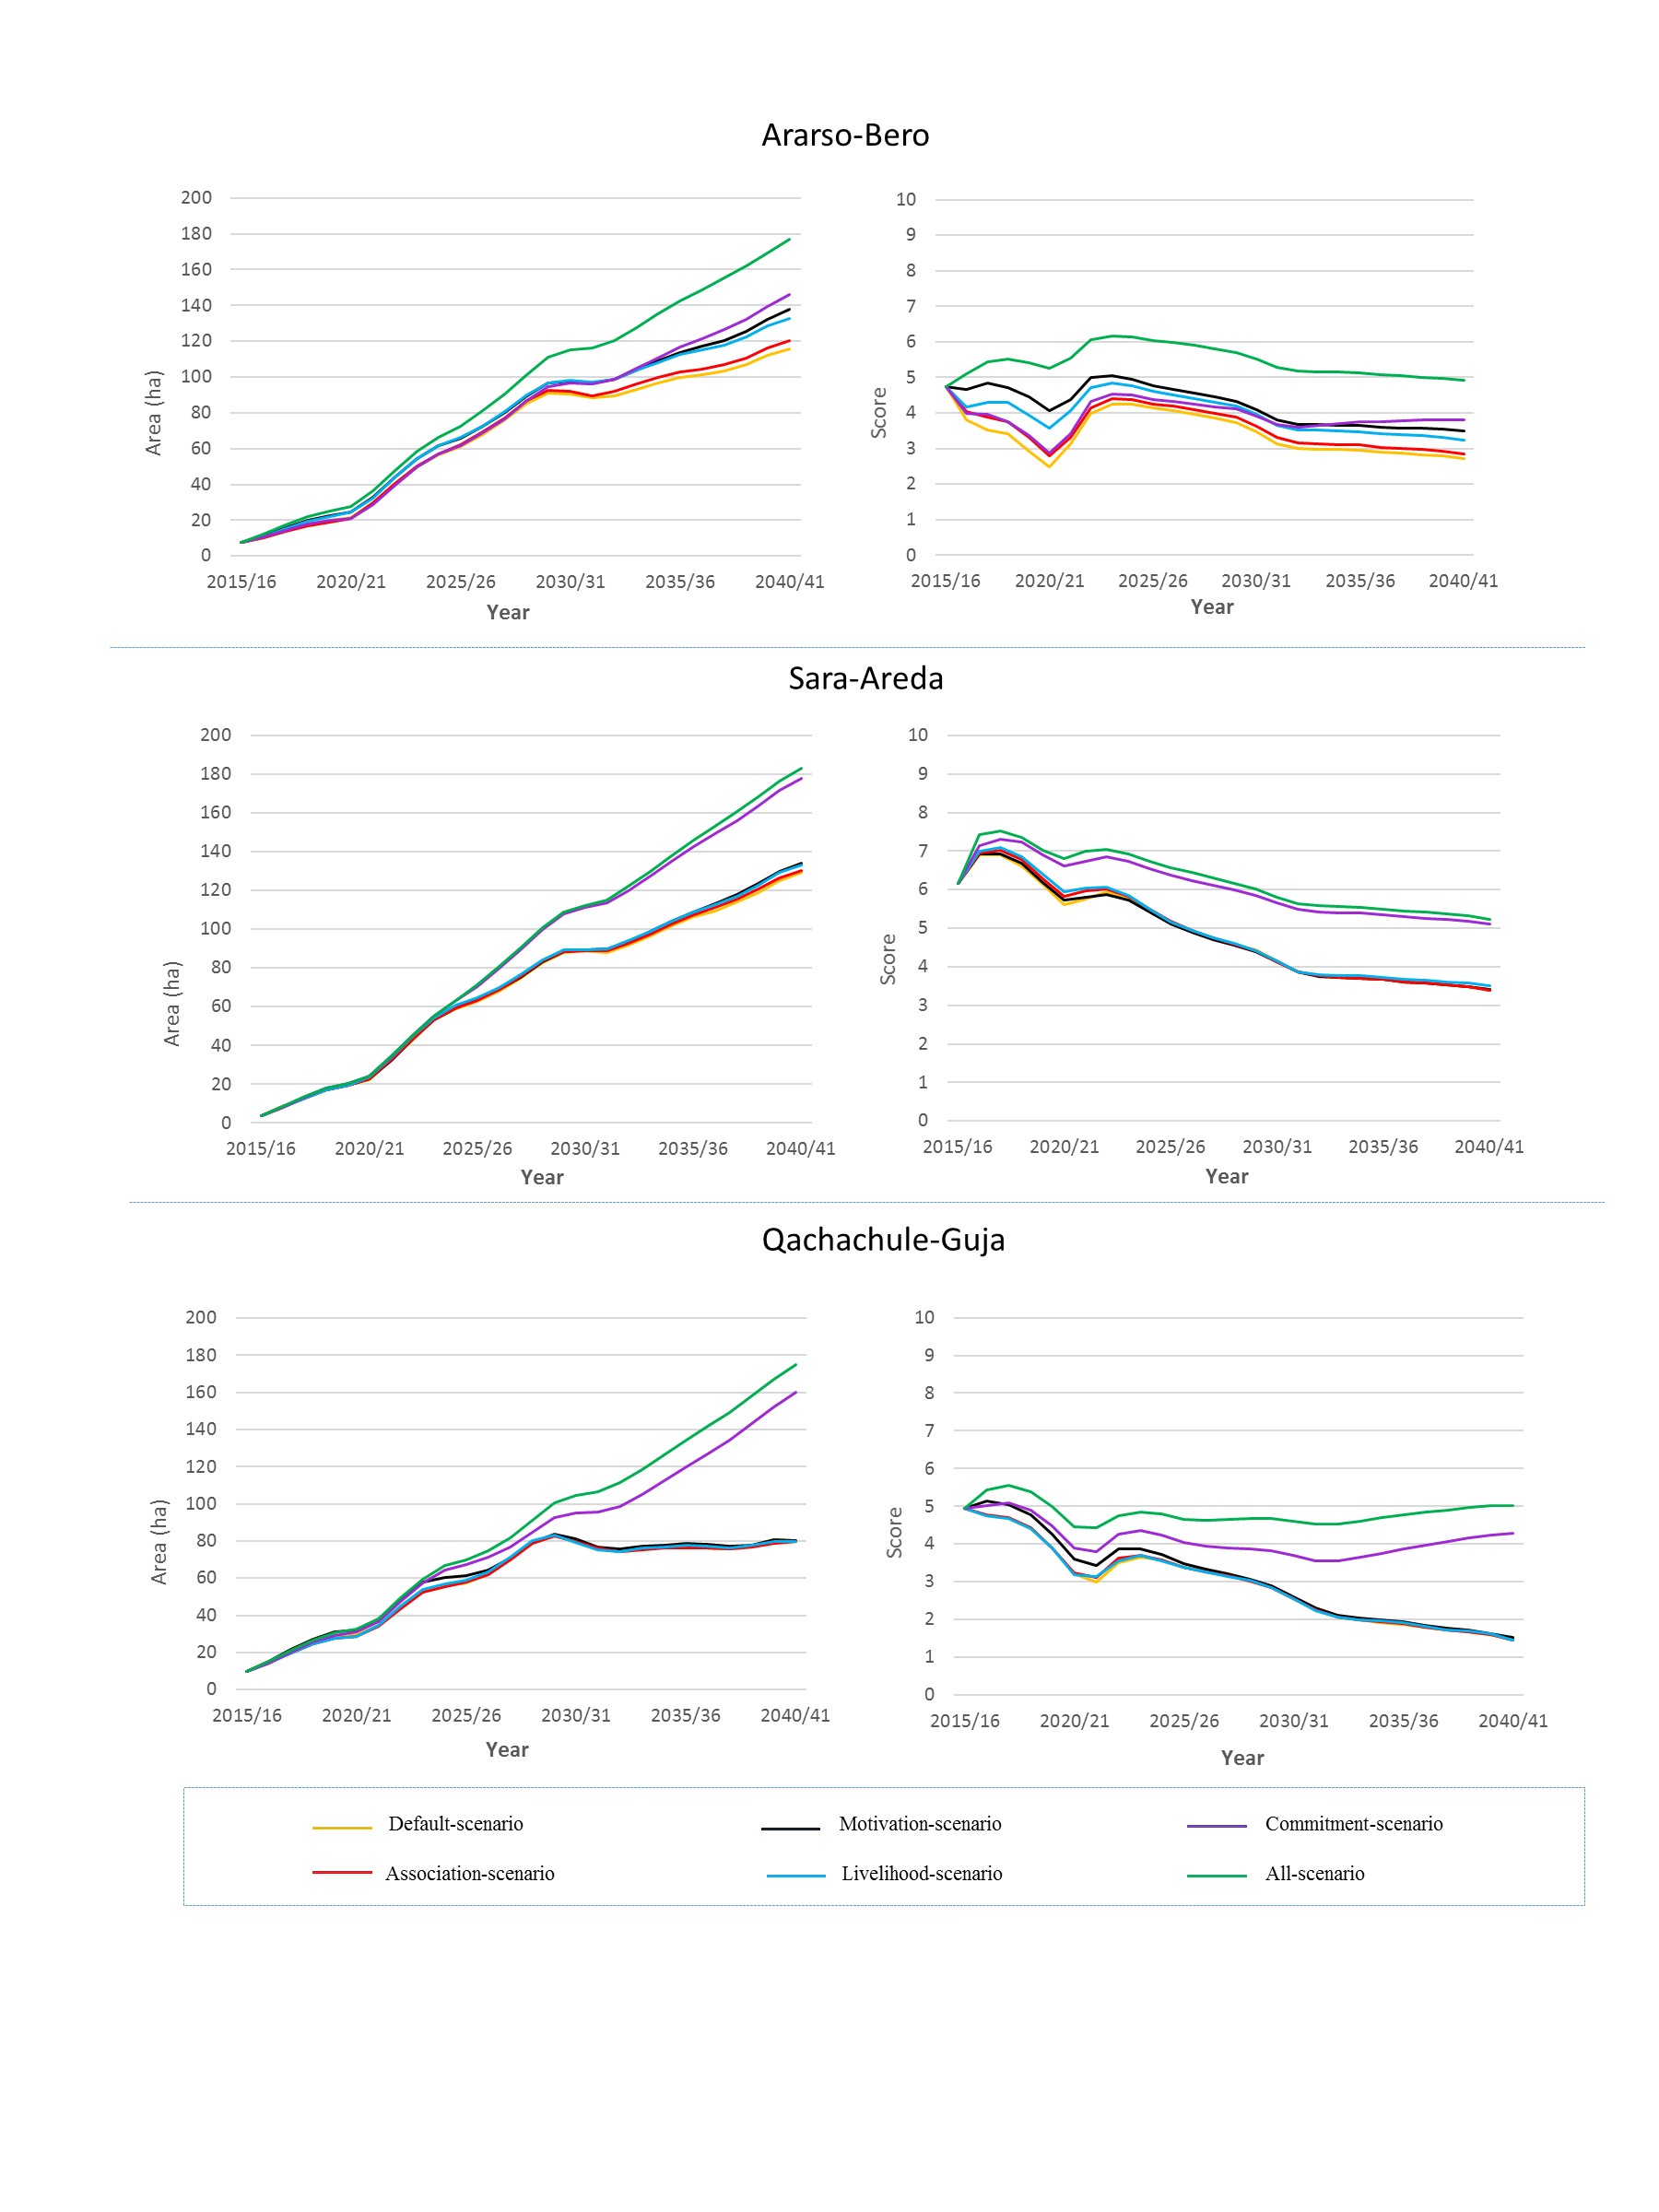
The patterns of change in area of land covered and quality of SWC structures under the motivation-scenario, livelihood-scenario, and association-scenario are similar to that observed during the default-scenario in Sara-Areda and Qachachule-Guja (Figure 5, Table 4). In Ararso-Bero, the area of land covered with SWC structures increases over that of the default-scenario after the mid of the simulation (2030/31). The quality of SWC structures, however, was consistently higher than that of the default-scenario from the beginning to the end of the simulation in this Kebele. In general, these scenarios affected the outcomes of the program in the long-term, because it took time to increase the required awareness and perceptions of farmers for action. Similarly, introducing livelihood opportunities for the poorer farmers considerably minimized out-migration for off-farm employment when farmers coupled this with income they obtained from SWC structures in the long-term.
| Scenarios | Ararso-Bero | Sara-Areda | Qachachule-Guja | Mean | ||||
| Area of land | Quality of SWC | Area of land | Quality of SWC | Area of land | Quality of SWC | Area of land | Quality of SWC | |
| Default-scenario | 35.3 | 0.6 | 38.6 | 1.2 | 23.6 | 1.0 | 32.3 | 0.9 |
| Association-scenario | 36.8 | 0.6 | 39.1 | 1.2 | 23.7 | 1.0 | 32.9 | 0.9 |
| Livelihood-scenario | 40.1 | 0.5 | 39.8 | 1.2 | 23.9 | 1.0 | 34.3 | 0.9 |
| Motivation-scenario | 40.8 | 0.5 | 40.1 | 1.2 | 23.3 | 1.1 | 34.4 | 0.9 |
| Commitment-cenario | 43.6 | 0.4 | 54.8 | 0.7 | 43.8 | 0.4 | 47.3 | 0.4 |
| All-scenario | 53.1 | 0.4 | 56.4 | 0.7 | 49.2 | 0.3 | 52.9 | 0.4 |
In summary, integrating multiple interventions and enhancing the commitment of local government actors are crucial to enhance maintenance of SWC structures, particularly on communal land and generate better outcomes both in the short-term and long-term; while investing in farmers, i.e., motivating farmers, introducing alternative livelihood opportunities for the poorer farmers, and establishing and strengthening micro-watershed associations result in better outcomes only in the long-term.
Effect of scenarios on model outcomes
All-scenario
Integrating multiple interventions created the highest impact in enhancing both area of land covered with and quality of SWC structures in all Kebeles. On average, under this scenario, the area of land covered with SWC structures increased by 171.3 ha, while the quality of the structures decreased by 3.3% over 25 years (Table 5). It appears that motivating farmers, establishing and strengthening micro-watershed associations, introducing alternative livelihood opportunities for the poor and enhancing the commitment of local government actors jointly are crucial to enhance outcomes of the program.
| Scenarios | Ararso-Bero | Sara-Areda | Qachachule-Guja | Mean | ||||
| Area of land | Quality of SWC | Area of land | Quality of SWC | Area of land | Quality of SWC | Area of land | Quality of SWC | |
| Default-scenario | 108.3 | -42.8 | 125.7 | -44.7 | 70.6 | -70.2 | 101.5 | -52.6 |
| Association-scenario | 112.7 | -39.9 | 126.7 | -45.0 | 69.9 | -70.5 | 103.1 | -51.8 |
| Livelihood-scenario | 125.3 | -31.8 | 129.4 | -43.3 | 70.1 | -70.4 | 108.3 | -48.5 |
| Motivation-scenario | 130.2 | -26.4 | 130.4 | -44.8 | 70.7 | -69.4 | 110.4 | -46.9 |
| Commitment-cenario | 138.7 | -20.1 | 174.1 | -17.3 | 150.3 | -13.6 | 154.4 | -17.0 |
| All-scenario | 169.5 | 3.6 | 179.4 | -15.1 | 165.5 | 1.5 | 171.3 | -3.3 |
Commitment-scenario
The commitment-scenario involved enhancing the commitment of local government actors through capacity building so that they effectively take-up their roles and responsibilities in the CBWM program. As shown in Table 5, the commitment-scenario is the second-best option to enhance both area of land covered and quality of SWC structures in all Kebeles. On average, under this scenario, the area of land covered with SWC structures increased by 154.4 ha, while the quality of structures decreased by 17.0% over 25 years (Table 5). Compared to the all-scenario, the contribution of the commitment-scenario is relatively lower in Ararso-Bero (Table 5), which would indicate the need to introduce additional interventions for better outcomes in this Kebele.
Motivation-scenario
As shown in Table 5, motivating farmers through voluntary instruments is the third important scenario to enhance program outcomes. On average, the motivation-scenario increased area of land covered with SWC structures by 110.4 ha, while it decreased the quality of the structures by 48.9% over 25 years. Among the Kebeles studied, the motivation-scenario had more added value compared to the default-scenario and generated better outcomes over the 25 years in Ararso-Bero (Table 5). The importance of this scenario could be related to the strong performance of Kebele administrators and extension workers, lower farmers’ perception of watershed degradation and future benefits of the program, and lower use of control instruments in this Kebele. In Sara-Areda, though change in outcomes over 25 years is more or less the same to Ararso-Bero (Table 5), this scenario has less added value compared to the default-scenario, because of a relatively better initial condition of this Kebele in terms of perception of watershed degradation and future benefits of the program. However, the lower effect of the motivation-scenario in Qachachule-Guja is related to poorer capacity of extension workers and Kebele administrators to exert their responsibilities in the CBWM program.
In general, the effect of the motivation-scenario was relatively higher in a context where the performance of local government actors is relatively strong and initial farmers’ awareness and motivation is lower. This scenario had less added value in localities that have been frequently using control instruments. This means the contribution of motivating farmers would be compromised if the performance of local government actors is either weak or if they use control instruments. Thus, voluntary instruments would have more added value if wisely employed together with control instruments that will be developed locally with the participation of farmers.
Livelihood-scenario
Introducing alternative livelihood opportunities for poorer farmers is the fourth important scenario to enhance outcomes of the program. On average, under this scenario, area of land covered with SWC structures increased by 108.3 ha, while the quality of SWC structures decreased by 48.5% over the 25 years. Although this scenario gave better outcomes over the 25 years in Sara-Areda, it had less added value compared to the default-scenario (Table 5). In Ararso-Bero, however, this scenario had more added value compared to the default-scenario and produces reasonable outcomes, perhaps because farmers seasonally migrate to other localities for off-farm employment due to their lower agricultural outputs and smaller land size.
Conversely, the effect of livelihood-scenario was the lowest in Qachachule-Guja as some farmers are not eligible for alternative livelihood opportunities because of their relatively higher income and lowest out-migration for off-farm employment. In this regard, the livelihood-scenario is a viable strategy in relatively poorer communities where farmers temporarily migrate to other localities in search of means of livelihood.
Association-scenario
Establishing and strengthening micro-watershed associations is the fifth important scenario in enhancing program outcomes. On average, under this scenario, land area covered with SWC structures increased by 103.3 ha, while the quality of SWC structures decreased by 51.8% over the 25 years. It appears that enhancing financial, institutional and technical capacities of the associations had marginal impact on the program outcomes. Particularly in Qachachule-Guja, the effect of this scenario was lower than that of default-scenario since the commitment of local government actors was weaker and members of the newly established associations were less likely to take their responsibilities without solid support and follow-up from these actors. The association-scenario had more added value compared to the default-scenario in Ararso-Bero, where performance of local government actors was strong and initial awareness and motivation of farmers was lower than other Kebeles.
From the lower contribution of the association-scenario, one could question the added value of establishing associations to ensure maintenance of SWC structures on communal land and to serve as benefit sharing mechanism. One possible reason for the lower contribution of this scenario are the limitations of already established associations, such as including very few farmers, limited economic benefits incurred from micro-watersheds and the fact that skills and experiences of members barely spread to non-members. Limitations while establishing new associations also play a role, especially failure to include real target groups, exclusion of non-members from decision-making and any short-term economic benefits and consequent violent conflict between members and non-members in some localities. However, the sustainability of SWC structures on communal land depends on the cooperation of non-members. In this regard, non-members’ sense of ownership of the micro-watersheds on communal land is crucial. This suggests the importance of establishing associations through transparent and participatory processes or devise other more viable or locally sensitive strategies for the maintenance of SWC structures on the treated communal micro-watersheds.
Default-scenario
This scenario simulated the effect of continuing with the current conditions. As shown in Table 5, the default-scenario resulted in the lowest outcomes compared to all alternative scenarios. Across the Kebeles, the area of land covered with SWC structures increased only by 70.6 ha in Qachachule-Guja over 25 years, compared to an increase of 125.7 ha in Sara-Areda and 108.3 ha in Ararso-Bero. Though the quality of SWC structures gradually declined from the beginning to the end of simulation in all Kebeles, the rate of decline was highest in Qachachule-Guja (70.2%), compared to Ararso-Bero (42.8%) and Sara-Areda (44.7%). Hence, continuing with the current conditions generated the lowest outcomes in Qachachule-Guja, where performance of Kebele administrators and extension workers was poorer and maintenance of SWC structures on communal land was lacking.
Overall, the scenario results showed that the default-scenario or doing business as usual created the lowest outcomes compared to other alternative scenarios, particularly where performance of local government actors was poorer and mechanisms for maintenance of SWC structures on communal land was lacking. More importantly, the gradual decline in quality of SWC structures under this scenario suggests that the structures was less effective in controlling water erosion and would be destroyed in the long-term. In this regard, continuing with the current conditions is less likely to ensure sustainability of SWC structures.
Summary of added value of alternative scenarios compared to default-scenario
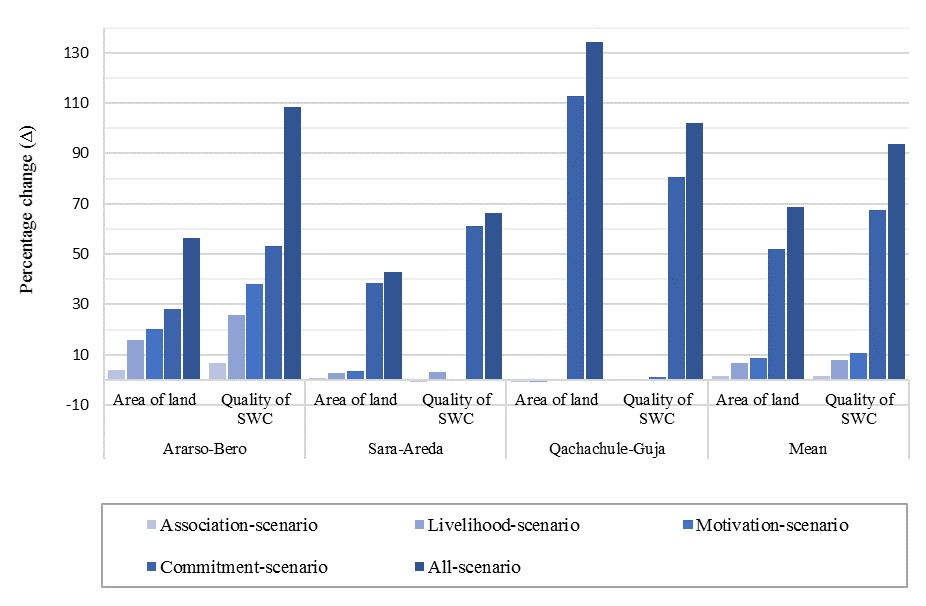
Percentage change between the alternative scenarios and the default-scenario was used to determine the added value or relative importance of implementing alternative scenarios. Overall, all alternative scenarios have some added value compared to the default-scenario or doing business as usual (Figure 6). Among the scenarios tested, all-scenario or integrating multiple interventions had highest added value in all Kebeles together and separately. On average, this scenario increased area of land covered with and quality of SWC structures by 68.77% and 93.73% respectively over default-scenario. Compared to the default-scenario, the effect of the all-scenario was particularly high in Qachachule-Guja, where it increased the area coverage and quality of SWC structures by 134.42% and 102.14% respectively. The second most important scenario was the commitment-scenario, which on average increased area coverage and quality of SWC structures by 52% and 68% respectively over the default-scenario. This scenario was the second most important in all the studied Kebeles compared to the default-scenario. The other three alternative scenarios, i.e., the motivation-scenario, livelihood-scenario, and the association-scenario were only important in Ararso-Bero (Figure 6), where local government performance was strong, initial awareness and motivation of farmers was lower and where farmers seasonally migrate to other localities for off-farm employment. In other Kebeles, these scenarios had less added-value.
Discussion and Conclusions
The main objective of this study was to explore conditions that enhance the outcomes of the Campaign-Based Watershed Management (CBWM) program by using an empirically based Agent-Based Model in Boset District, Ethiopia. The model analysed the extent to which six scenarios enhanced the area of land covered with Soil and Water Conservation (SWC) structures and their quality. The results of the scenario analysis revealed that integrating multiple interventions, including enhancing the commitment of local government actors, motivating farmers, introducing alternative livelihood opportunities for the poor and establishing and strengthening micro-watershed associations result in better outcomes. This confirms the widely held views that watershed management initiatives should not only focus on conservation of natural resources, but also on building the capacity of local institutions and the livelihood of the people concerned (Kerr 2007; Shiferaw et al. 2009). Such interventions are more likely to ensure collective action for watershed management, spreading of the SWC structures to other localities and sense of ownership of the structures among local actors (Darghouth et al. 2005), as well as having spillover effects to other similar sectors (Abi et al. 2019). The main challenge, however, is that implementing these strategies requires considerable resources and collaboration among various actors (higher government authorities, sectoral offices), which is lacking in the current CBWM program in the country (Abi 2019).
The scenario analysis showed that capacity building of local government actors is a more efficient strategy, since it produces reasonable outcomes and yet requires lower investment compared to integrating multiple interventions. Similar to integrating multiple interventions, this strategy has spillover effects as the local government actors are also responsible for other extension services, empowers local government actors, enhances maintenance of SWC structures particularly on communal land, and generates better outcomes both in the short-term and long-term. Hence, the local governance is crucial in the collective watershed management initiatives (Araral 2009; Nagendra & Ostrom 2014; Ratner et al. 2013) and in the CBWM program in particular (Wolka 2014).
However, consistent with Assefa et al. (2021b) and Assefa et al. (2021a), motivating farmers and establishing and strengthening micro-watershed associations in isolation are important where performance of local government actors is strong, and initial awareness and motivation of farmers is lower. Introducing alternative livelihood opportunities is crucial where poorer farmers seasonally migrate to other localities for off-farm employment, as also shown by Wondimagegnhu & Zeleke (2017) and Assefa et al. (2021b). Unlike approaches focusing on restoring natural resources for better rural livelihoods (Darghouth et al. 2008; Kerr 2007; Shiferaw et al. 2009), this strategy emphasizes the importance of local livelihood diversification for poorer seasonal migrants so that they are enabled to contribute to natural resource conservation. Even so, these strategies create better outcomes only in the long-term. Among the scenarios tested, doing business as usual or continuing with the current condition resulted in the lowest outcomes and was less likely to ensure sustainability of SWC structures. This confirms results from studies that question the sustainability of the ongoing CBWM program in the country (e.g., Snyder et al. 2014; Assefa et al. 2021b, 2021a), without adapting or addressing key limitations of the program (Abi et al. 2019).
Concerning better outcomes and sustainability, we should stress the need to modify or adapt the CBWM program, with a stronger focus on enhancing the commitment of local government actors through capacity buildings: trainings, experience sharing, follow-up and technical support in the field, providing logistics and allocating adequate budgets in the study area and other similar localities. Capacity building empowers local government actors to plan and more efficiently implement SWC structures in consultation with other actors, particularly farmers. These actors could motivate farmers through voluntary instruments, establish and strengthen micro-watershed associations or devise other strategies for maintenance of SWC structures, and even contribute to the creation of local livelihood opportunities for the poorer farmers with other actors. More importantly, capacity building creates an opportunity to implement local need-based adaptations into the program, with actors who are capable to assess the limitations of the program and who feel more ownership and commitment.
As such this study contributes to the literature on watershed management by exploring conditions that enhance the outcomes and sustainability of a collective action initiative. More importantly, the ABM model can be used as a toolkit to further analyse the CBWM program and other similar collective watershed management initiatives and support their improvement. However, it is crucial to note that the study was conducted in only three adjacent Kebeles of Boset District. The main focus was to assess the performance of the CBWM program in localities that have broader agro-ecological and socio-economic similarity. Exploring the experiences of different regions and agro-ecologies could help to gather a more complete and representative dataset at the Regional and National level. In addition, during the scenario analysis, the study employed only two outcomes of the program: area of land covered with SWC structures and the quality of these SWC structures. The effects of the program on biophysical conditions, including soil erosion, soil fertility, moisture retention, vegetation cover, agricultural production and productivity are not included. More importantly, the study did not analyse the effect of various scenarios on socio-economic outcomes for the farmers, such as food security, income, social cohesion, and social inequality. This could help to analyse and adopt scenarios that enhance both socio-economic conditions and biophysical conditions for sustainable watershed management. Finally, the scenario analysis was not used in actors’ workshops to enhance discussions, social learning and collective decisions on more feasible management strategy that satisfies the interests of the actors.
Model Documentation
The computer model was created in NetLogo v6.2 (Wilensky 1999). The “Overview, Design concepts, and Details” (ODD) protocol (Grimm et al. 2010) and the model code can be found at: https://doi.org/10.25937/e62c-x304. Both the ODD protocol and model code are useful to replicate the results presented in this paper and extend the model design.Acknowledgments
We are indebted to the Netherlands Fellowship Program (NUFFIC) for financial support [grant number CF09971]. We furthermore wish to thank our sources of data; government officials, experts, and farmers who provide crucial data to develop the ABM model.Appendix
A: System Parameters
| No | Parameters | Default | Range | Functions | Sources |
|---|---|---|---|---|---|
| 1 | Number of farmers | 180 | 100 – 250 | Initial number of farmers | Authors’ judgment |
| 2 | n-new-members-association | 10 | 0 – 30 | Number of farmers organized to form a new micro-watershed association every year | Authors’ judgment |
| 3 | maximum-participation-cost | 600 | 300 – 1000 | The amount of money (birr) a farmer loses because of his highest possible level of participation | Authors’ judgment |
| 5 | income-poor-threshold | 500 | 0 – 1000 | Money (birr) below which farmers are considered to be poor and eligible for alternative livelihood activity | Authors’ judgment |
| 6 | extension-workers-move-selection-threshold | 3 | 0 – 10 | Score above which extension workers move to attend meeting with other agents to select new micro-watershed | Authors’ judgment |
| 7 | extension-workers-move-selection-threshold | 7 | 0 – 10 | Score above which extension workers are able to enhance farmers’ perception of watershed degradation and future benefits of the program | Authors’ judgment |
| 8 | kebele-administrators-move-selection-threshold | 3 | 0 – 10 | Score above which Kebele administrators move to attend meetings with other agents to select new micro-watershed | Authors’ judgment |
| 9 | kebele-administrators-selection-threshold | 6 | 0 – 10 | Score above which Kebele administrators oblige farmers to select their preferred type of micro-watershed (farmland vs communal land) | Authors’ judgment |
| 10 | perception-watershed-move-selection | 5 | 0 – 10 | Score above which farmers move to attend meetings with other agents to select new microwatersheds | Authors’ judgment |
| 11 | perception-watershed-selection-threshold | 7 | 0 – 10 | Score above which farmers decide to select their preferred type of micro-watershed (farmland vs communal land) | Calibration |
| 12* | w-perceived-performance-kebele-administrator-campaign | 0.240 | 0 – 1 | Relative influence of farmers’ perceived performance of Kebele administrator during campaign participation | Household survey (Assefa et al. 2021b) |
| 13 | w-off-farm-participation-campaign | 0.385 | 0 – 1 | Relative influence of the extent of participation in off- farm-activities during campaign participation | Household survey (Assefa et al. 2021b) |
| 14 | w-distance-watershed-campaign | 0.096 | 0 – 1 | Relative influence of distance from micro-watersheds during campaign participation | Household survey (Assefa et al. 2021b) |
| 15 | w-education-campaign | 0.141 | 0 – 1 | Relative influence of education during campaign participation | Household survey (Assefa et al. 2021b) |
| 16 | w-social-capital-campaign | 0.085 | 0 – 1 | Relative influence of social capital during campaign participation | Household survey (Assefa et al. 2021b) |
| 17 | w-degree-participation-local-organizations-campaign | 0.039 | 0 – 1 | Relative influence of degree of participation in local organizations during campaign participation | Household survey (Assefa et al. 2021b) |
| 18* | w-perception-watershed-campaign | 0.012 | 0 – 1 | Relative influence of perception of watershed degradation and future benefits of the program during campaign works | Household survey (Assefa et al. 2021b) |
| 19 | extension-workers-move-campaign-threshold | 5 | 0 – 10 | Score above which extension workers move to newly selected micro-watershed during campaign participation | Authors' judgement |
| 20 | kebele-administrators-move-campaign-threshold | 7 | 0 – 10 | Score above which Kebele administrators move to newly selected micro-watershed during campaign participation | Calibration |
| 21** | w-perceived-performance-kebele-administrator-maintenance | 0.289 | 0 – 1 | Relative influence of farmers’ perceived performance of Kebele administrator during maintenance participation | Calibration |
| 22 | w-off-farm-participation-maintenance | 0.385 | 0 – 1 | Relative influence of extent of participation in off-farm activities during maintenance activities | Calibration |
| 23 | w-distance-watershed-maintenance | 0.104 | 0 – 1 | Relative influence of distance from micro-watersheds during maintenance participation | Household survey (Assefa et al. 2021b) |
| 24 | w-degree-participation-local-organizations-maintenance | 0.022 | 0 – 1 | Relative influence of degree of participation in local organizations during maintenance participation | Household survey (Assefa et al. 2021b) |
| 25** | w-perception-watershed-maintenance | 0.200 | 0 – 1 | Relative influence of perception of watershed degradation and future benefits of the program during maintenance participation | Calibration |
| 26 | extension-workers-move-maintenance-threshold | 8 | 0 – 10 | Score above which extension workers move to already developed micro-watershed during maintenance participation | Authors' judgement |
| 27 | kebele-administrators-move-maintenance-threshold | 8 | 0 – 10 | Score above which Kebele administrators move to already developed micro-watershed during maintenance participation | Authors' judgement |
| 28 | maintenance-threshold | 9 | 5 – 10 | Score above which farmers decide to maintain SWC structures | Calibration |
| 29 | demolition-threshold | 3 | 0 – 5 | Score below which farmers decide to demolish SWC structures | RPG (Assefa et al. 2021a) |
| 30 | min-members-commitment-threshold | 3 | 0 – 5 | Level of commitment of members of micro-watershed associations below which campaign and maintenance participations is relatively lower | Authors' judgement |
| 31 | max-members-commitment-threshold | 8 | 5 – 10 | Level of commitment of members of micro-watershed associations above which campaign and maintenance participations is relatively higher | Authors' judgement |
| 32 | min-social-relation-threshold | 3 | 0 – 5 | Level of social relation below which commitment of members of micro-watershed associations is relatively lower | Authors' judgement |
| 33 | max-social-relation-threshold | 8 | 5 – 10 | Level of social relation above which commitment of members of micro-watershed associations is relatively higher | Authors' judgement |
| 34 | chance-measure-campaign | 90 | 50 – 100 | Probability that Kebele administrators take measures during campaign participation | RPG (Assefa et al. 2021a) |
| 35 | chance-measure-maintenance | 80 | 50 – 100 | Probability that Kebele administrators take measures during maintenance participation | RPG (Assefa et al. 2021a) |
| 36 | perception-influence-neighbour-threshold | 9 | 0 – 10 | The level of farmers’ perception of watershed degradation and future benefits of the program above which he /she directly influences neighbours’ campaign participation | Authors' judgement |
| *The sum from number 12 to 18 is 1. **Similarly the sum from number 21 to 25 is 1 | |||||
B
C: Campaign-Participation and its Effect on the Physical Environment and State Variables of Farmers
Determine campaign-participation (Pc)
Farmer’s participation in campaign works is the result of two key factors: (1) effect of farmer’s own attributes and (2) effect of decision of neighbours. The first key factor includes seven factors that influence farmer’s participation in campaign works, i.e. campaign-participation (Pc), which is given as:
| \[ \begin{aligned} Pc = \; & perceived \; performance \; kebele \;administrator * w \; perceived \;performance \; kebele \\ & \; administrator \;campaign + (10 - extent\;off\;farm\;participation) * w\;off\;farm\; \\ & participation\;campaign + (10 - distance\;micro\;watershed\;campaign) * w\;distance \\ & \;watershed\;campaign + education * w\;education\;campaign + degree\;participation\; \\ & local\;organizations * w\;degree\;participation\;local\;organizations\;campaign + social\; \\ & capital * w\;social\;capital\;campaign + perception\;watershed * w\;perception\; \\ & watershed\;campaign \end{aligned}\] | \[(1)\] |
Distance-micro-watershed-campaign indicates distance between the farmer’s position and the micro-watersheds selected for campaign works at this particular time-step. Pc is higher for members of micro-watershed associations. The second key factor shows a sitation where farmers directly copy Pc of a neighbour with highest awareness, i.e. perception-watershed \(\geq\) 9. Pc of each farmer ranges between 0 and 10. Average Pc is calculated as:
| \[ Average \; Pc = \frac{\sum Pc}{number \; of \; farmers}\] | \[(2)\] |
Update physical environment due to campaign-participation
Area of land covered with SWC structures: Calculation of area of land covered with SWC structures was preceded by determination of lengths of SWC structures constructed through campaign works (lengths-SWC-campaign). Lengths-SWC-campaign = Pc * 0.003 km. This means a farmer constructs 0.003 km for each campaign-participation score, which is assumed to be 3 workdays. The total lengths of SWC structures constructed (total-lengths-SWC-campaign) by the farmers is sum of lengths-SWC-campaign.
The area of communal land covered with SWC structures due to campaign works is given as:
| \[ Communal \; SWC \; Cover \; Campaign = \frac{0.001 km * total \; lengths \; SWC \; campaign * 100 *4}{0.15 \; ha}\] | \[(3)\] |
Similarly, the area of farmland covered with SWC structures due to campaign works is given as:
| \[ Farmland \; SWC \; Cover \; Campaign = \frac{0.001 km * total \; lengths \; SWC \; campaign * 100 *4}{0.1\ \; ha}\] | \[(4)\] |
In both Equation 3 and Equation 4, 0.001 km is width of SWC structures, 100*4 is to convert km2 to 0.25 ha, and 0.15 ha and 0.11 ha indicate average recommended SWC structures on communal land and farmland per hectare respectively. The area of land covered due to campaign-participation (i.e. communal-SWC-cover-campaign and farmland-SWC-cover-campaign), updates two state variables of fields: communal-swc-cover? and farmland-swc-cover?.
Quality of SWC structures: The quality of SWC structures that the farmers construct through campaign works depends on the presence of extension workers in their vicinity to give technical support. If extension workers are nearby, the quality-SWC will be 10, if not 9.
Update dynamic state variables of farmers due to campaign-participation
Perception-watershed and social-capital: Crucial to update farmer’s perception-watershed and social-capital is a measure taken against this farmer after campaign works. A measure taken by Kebele administrator is a function of his/her commitment (commitment-of-kebele-administrator), measure taken by kebele administrator at previous time step, and farmer’s distance-from-average-participation (Pc - average Pc). If commitment-of-kebele-administrator \(\geq\) kebele-administrators-move-campaign-threshold; the Kebele administrator will randomly move in the selected micro-watershed, take measures against farmers that update perception-watershed and social-capital. However, Kebele administrators do not always take measures. There is 90% chance that Kebele administrator takes measures that influence perception-watershed and social-capital.
Membership-watershed-association: The establishment of new micro-watershed association is dependent on the commitment-of-kebele-administrator and when the farmers select and develop micro-watershed on communal land. Hence, if commitment-of-kebele-administrator \(\geq\) kebele-administrators-move-campaign-threshold and the new micro-watershed is on communal land; then select some farmers (n-new-members-association) randomly to be a member of a new micro-watershed.
Income-campaign: Farmers participate in campaign works without any form of remuneration. Both their campaign-participation (\(Pc\)), and punishment have negative effect. Hence, income-campaign is given as (10 is maximum \(Pc\)):
| \[ Income \; campaign = - (campaign \; participation \; cost + campaign \; punishment \; cost)\] | \[(5)\] |
| \[ campaign \; participation \; cost = \frac{Pc}{10} * maximum \; participation \; cost\] | \[(6)\] |
| \[ campaign \; punishment \; cost = maximum \; punishment - (\frac{Pc}{10}* maximum \; punishment)\] | \[(7)\] |
Perceived-performance-kebele-administrator: After campaign works, farmers evaluate performance of the Kebele administrator, by updating their perceived-performance-kebele-administrator. Farmers’ update their perceived-performance-kebele-administrator by assessing commitment-of-kebele-administrator and average Pc of farmers.
D: Maintenance-Participation and its Effect on the Physical Environment and State Variables of Farmers
Determine maintenance-participation (Pm)
Maintenance of SWC structures involves labor contribution, strictly observing rules and regulations, and protecting micro-watersheds from disturbances. Thus, all farmers make maintenance decisions on the already constructed structures. Farmer’s participation in maintenance activities or maintenance-participation (\(Pm\)) (0-10) is the result of six factors.
| \[ \begin{aligned} Pm = & perceived \;performance\;kebele\;administrator * w\;perceived\;performance\;kebele\\ & administrator\;maintenance + (10 - extent\;off\;farm\;participation) * w\;off\;farm\\ & participation\;maintenance + (10 - distance\;communal\;watershed\;maintenance) * w \\ & distance\;watershed\;maintenance + degree\;participation\;local\;organizations * w\;degree \\ &participation \;local\;organizations\;maintenance + perception\;watershed * w\;perception\\ &watershed\;maintenance \end{aligned}\] | \[(8)\] |
However, \(Pm\) is higher for members of micro-watershed associations. For convenience, \(Pm\) of each farmer is converted to three maintenance decisions: maintain (\(Pm \geq 8\)), ignore (\(3 < Pm < 8\)), and demolish (\(Pm \leq 3\)). The average \(Pm\) of the farmers is given as:
| \[ Average \; Pm = \frac{\sum Pm}{number \; of \; farmers}\] | \[(9)\] |
Update physical environment due to maintenance-participation
Area of land covered with SWC structures: The area of land covered with SWC structures at the end of each time step is the result of farmers’ maintenance decision: “maintain”, “ignore”, or “demolish”. This means maintenance decision updates two state variables of fields: communal-swc-cover? and farmland-swc-cover?. Farmers with “maintain” decision contribute labor, strictly observe rules and regulations pertaining to maintenance of SWC structures (e.g., not directly destroying or exposing the structures for destruction), and protecting micro-watersheds from disturbances. However, labor contribution for maintenance of SWC structures on communal land is carried out only by members of micro-watershed associations, i.e., members maintain their own watershed (own-watershed). Farmers first maintain SWC structures with lower quality. Members also ensure area closure or guard micro-watersheds on communal land, but first own-watershed. Non-members, on the other hand, are expected to strictly observe rules and regulations pertaining to maintenance of SWC structures and protecting the micro-watersheds from disturbances. In other words, a highly motivated nonmember also ensure area closure or guard micro-watersheds on communal land. However, each farmer is responsible for the maintenance of SWC structures constructed on his/her farmland (own-farmland). Ignored SWC structures decay over time. Farmers with demolish decision remove SWC structures from fields, but starts with higher quality.
Quality of SWC structures: The quality of SWC structures changes based on the maintenance decision of farmers. Maintenance decision updates quality-SWC. If extension workers are nearby, a farmer with “maintain” decision set quality-SWC at 10, if not 9. The quality of ignored SWC structures decline by 1 every time step. A farmer with “demolish” decision, set quality-SWC 0.
Update dynamic state variables of farmers due to maintenance-participation
Perception-watershed and social-capital: After maintenance decision, the farmer’s perception-watershed and social-capital are updated because of measures taken (measures) by Kebele administrator. Measures taken (measures) by Kebele administrators are functions of their commitment (commitment-of-kebele-administrator), measures taken (measures) by kebele administrator at previous time step, and distance-from-average-participation, which is given as: \(Pm\)– average \(Pm\). If commitment-of-kebele-administrator \(\geq\) kebele-administrator-move-maintenance-threshold; the Kebele administrator randomly moves throughout all micro-watersheds, take measures that update perception-watershed and social-capital. However, Kebele administrators do not always take measures. There is 80% chance that Kebele administrator takes measures. In addition, confrontation between a farmer whose maintenance decision is “maintain” or ensuring area closure or guard micro-watersheds on communal land, and those with maintenance decision of “demolish” leads to a decline in social-capital of the latter.
Income: At the end of each time step, income is updated. Income is a function of income change due to campaign-participation (income-campaign), income change due to maintenance-participation (income-maintenance), income obtained from structures constructed on communal land as a member of micro-watershed association (income-own-watershed), and income obtained from farmland if SWC is constructed on own-farmland (income-own-farmland). These incomes are dependent on the SWC-quality of the fields. Income-maintenance is determined based on maintenance decision of farmers.
For farmers with maintenance decision “maintain”, income-maintenance is given as (10 is maximum \(Pm\)):
| \[ income \;maintenance = - \frac{Pm}{10}* maximum \;participation \; cost\] | \[(10)\] |
For farmers that were punished by Kebele administrator, i.e. measure = “punish”, income-maintenance is given as (10 is maximum \(Pm\)):
| \[ income\;maintenance = maximum\;punishment - (\frac{Pm}{10} * maximum\;punishment)\] | \[(11)\] |
Off-farm-participation: At the end of each time step, farmer’s level of off-farm-participation is updated based on his/her amount of income obtained from SWC structures, i.e. income-own-watershed and income-own-farmland. The more farmers obtain income from SWC structures, the more their participation in off-farm activities decreases.
Commitment-member-micro-watersheds: Farmers who are members of micro-watershed associations update their commitment, i.e. commitment-member-micro-watershed at the end of each time step. The commitment of a farmer is a function of his current perception-watershed, social-capital, and income-own-watershed.
Perceived-performance-kebele-administrator: Farmers update their perception of performance of Kebele administrators, i.e. perceived-performance-kebele-administrator at the end of each time step. Farmers update their perceived-performance-kebele-administrator by assessing commitment-of-kebele-administrator and average maintenance-participation of farmers.
References
ABI, M. (2019). Exploring the scaling-up of sustainable land management in the Central Highlands of Ethiopia. Doctoral Thesis: Wageningen University, the Netherlands.
ABI, M., Kessler, A., Oosterveer, P., & Tolossa, D. (2019). Adapting the current mass mobilization approach in Ethiopia to enhance its impact on sustainable land management: Lessons from the Sago-Kara watershed. Environmental Management. [doi:10.1016/j.jenvman.2019.109336]
ADIMASSU, Z., Kessler, A., & Hengsdijk, H. (2012). Exploring determinants of farmers’ investments in land management in the Central Rift Valley of Ethiopia. Applied Geography, 35, 191–198. [doi:10.1016/j.apgeog.2012.07.004]
AN, L. (2012). Modeling human decisions in coupled human and natural systems: Review of agent-based models. Ecological Modeling, 229, 25–36. [doi:10.1016/j.ecolmodel.2011.07.010]
ARARAL, E. (2009). What explains collective action in the Commons? Theory and evidence from the Philippines. World Development, 37(3), 687–697. [doi:10.1016/j.worlddev.2008.08.002]
ASSEFA, S., Kessler, A., & Fleskens, L. (2018). Assessing farmers’ willingness to participate in campaign-Based watershed management: Experiences from Boset District, Ethiopia. Sustainability, 10, 4460. [doi:10.3390/su10124460]
ASSEFA, S., Kessler, A., & Fleskens, L. (2021a). Exploring decision-making in campaign-Based watershed management using a role-Playing game in Boset District, Ethiopia. Agricultural Systems, 190, 103124. [doi:10.1016/j.agsy.2021.103124]
ASSEFA, S., Kessler, A., & Fleskens, L. (2021b). Factors affecting farmers’ decisions to participate in campaign-based watershed management program in Boset District, Ethiopia. Land Use Policy (Submitted).
BALKE, T., & Gilbert, N. (2013). Description of the actor calibration. Technical report, Deliverable 4.2 of the ePolicy EU FP7 Project. Available at: http://cordis.europa.eu/docs/projects/cnect/7/288147/080/deliverables/001-deliverable42.pdf.
BDAO, Boset District Agriculture Office. (2015). The performance of Kebeles by their natural resource conservation. Boset District, Ethiopia, pp. 26
BDFEDO, Boset District Finance and Economic Development Office. (2012). Physical and socioeconomic profile of Boset district. Boset District, Ethiopia.
CAMPO, P., Bousquet, F., & Villanueva, T. (2010). Modelling with stakeholders within a development project. Environmental Modeling and Software, 25(11), 1302–1321. [doi:10.1016/j.envsoft.2010.01.005]
CLARK, R., & Holmes, J. (2010). Improving input from research to environmental policy: Challenges of structure and culture. Science and Public Policy, 37(10), 751–764. [doi:10.3152/030234210x534887]
CSA, Central Statistical Agency. (2013). Population projection of Ethiopia for all regions at district level from 2014-2017. Addis Abeba, Ethiopia.
DARGHOUTH, S., Ward, C., Gambarelli, G., Styger, E., & Roux, J. (2008). Watershed management approaches, policies, and operations: Lessons for scaling up. Washington D.C: Water Sector Board Discussion Paper, pp.164. Available at: https://openknowledge.worldbank.org/handle/10986/17240?locale-attribute=fr.
DARGHOUTH, S., Ward, C., Gambarelli, G., Styger, E., Roux, L., J.Desta, Carucci, V., Wendem-Agenehu, A., & Abebe, Y. (2005). Community-based participatory watershed development: A guideline. Addis Ababa, Ethiopia: Ministry of Agriculture and Rural Development, pp. 62.
FLESKENS, L., Nainggolan, D., & Stringer, C. (2014). An exploration of scenarios to support sustainable land management using integrated environmental-socioeconomic models. Environmental Management, 54, 1005–1021. [doi:10.1007/s00267-013-0202-x]
GARCÍA-BARRIOS, L., GARCÍA-BARRIOS, R., Waterman, A., & Cruz-Morales, J. (2011). Social dilemmas and individual/group coordination strategies in a complex rural land-use game. International Journal of the Commons, 5(2), 364–387.
GEBRESELASSIE, S., Kirui, O., & Mirzabaev, A. (2015). Economics of land degradation and improvement in Ethiopia. In E. Nkonya, A. Mirzabaev, & J. von Braun (Eds.), Economics of land degradation and improvement – A global assessment for sustainable development (pp. 401–430). Springer International Publishing. [doi:10.1007/978-3-319-19168-3_14]
GHORBANI, A., Bots, P., Dignum, V., & Dijkema, G. (2013). MAIA: A framework for developing agent-Based social simulations. Journal of Artificial Societies and Social Simulation, 16(2), 9: https://www.jasss.org/16/2/9.html. [doi:10.18564/jasss.2166]
GILBERT, N., & Troitzsch, K. (2005). Simulation for the Social Scientist. New York, NY: McGraw-Hill Education.
GRIMM, V., Berger, U., DeAngelis, D., Polhill, G., Giske, J., & Railsback, S. (2010). The ODD protocol: A review and first update. Ecological Modeling, 221(23), 2760–2768. [doi:10.1016/j.ecolmodel.2010.08.019]
GROENEVELD, J., Müller, B., Buchmann, C. M., Dressler, G., Guo, C., Hase, J. N., Hofmann, F., John, F., Klassert, C., Lauf, T., Liebelt, V., Nolzen, H., Pannicke, N., Schulze, J., Weise, H., & Schwarz, N. (2017). Theoretical foundations of human decision-making in agent-based land use models: A review. Environmental Modelling and Software, 87, 39–48. [doi:10.1016/j.envsoft.2016.10.008]
HAILEGIORGIS, A., Crooks, A., & Cioiffi-Revilla, C. (2018). An agent-Based model of rural households’ adaptation to climate change. Journal of Artificial Societies and Social Simulation, 21(4), 4: https://www.jasss.org/21/1/4.html. [doi:10.18564/jasss.3812]
HAREGEWEYN, N., Tsunekawa, A., Nyssen, J., Poesen, J., Tsubo, M., Meshesha, D., Schütt, B., Adgo, E., & Tegegne, F. (2015). Soil erosion and conversation in Ethiopia: A review. Progress in Physical Geography: Earth and Environment, 39(6), 1–25. [doi:10.1177/0309133315598725]
JAGER, W., Janssen, A., Vries, D., Greef, D., & Vlek, J. (2000). Behavior in commons dilemmas: Homo economicus and homo psychologicus in an ecological-economic model. Ecological Economics, 35(3), 357–379. [doi:10.1016/s0921-8009(00)00220-2]
JOHNSON, P., Balke, T., & Gilbert, N. (2014). Report on the policy instruments considered and their likely effectiveness. Technical report, Deliverable 4.3 of the ePolicy EU FP7 Project. Available at: http://www.epolicy-project.eu/sites/default/files/public/D4.3.pdf.
KAUFMANN, P., Stagl, S., & Franks, W. (2009). Simulating the diffusion of organic farming practices in two New EU Member States. Ecological Economics, 68(10), 2580–2593. [doi:10.1016/j.ecolecon.2009.04.001]
KELLY, R. A., Jakeman, A. J., Barreteau, O., Borsuk, M. E., ElSawah, S., Hamilton, S. H., Henriksen, H. J., Kuikka, S., Maier, H. R., Rizzoli, A. E., van Delden, H., & Voinov, A. A. (2013). Selecting among five common modelling approaches for integrated environmental assessment and management. Environmental Modelling and Software, 47, 159–181.
KERR, J. (2007). Watershed management: Lessons from common property theory. International Journal of the Commons, 1(1), 89–109. [doi:10.18352/ijc.8]
MATTHEWS, R., Gilbert, N., Roach, A., Polhill, J., & Gotts, N. (2007). Agent-based land-use models: A review of applications. Landscape Ecology, 22(10), 1447–1459. [doi:10.1007/s10980-007-9135-1]
MESHESHA, D. T., Tsunekawa, A., Tsubo, M., & Haregeweyn, N. (2012). Dynamics and hotspots of soil erosion and management scenarios of the Central Rift Valley of Ethiopia. International Journal of Sediment Research, 27, 84–99. [doi:10.1016/s1001-6279(12)60018-3]
MESHESHA, D. T., Tsunekawa, A., Tsubo, M., Haregeweyn, N., & Adgo, E. (2014). Drop size distribution and kinetic energy load of rainfall events in the highlands of the Central Rift Valley, Ethiopia. Hydrological Sciences Journal, 59, 2203–2215. [doi:10.1080/02626667.2013.865030]
NAGENDRA, H., & Ostrom, E. (2014). Applying the social-ecological system framework to the diagnosis of urban lake commons in Bangalore, India. Ecology and Society, 19(2), 67. [doi:10.5751/es-06582-190267]
NAIVINIT, W., Le Page, C., Trébuil, G., & Gajaseni, N. (2010). Participatory agent based modeling and simulation of rice production and labor migrations in Northeast Thailand. Environmental Modeling and Software, 25(11), 1345–1358. [doi:10.1016/j.envsoft.2010.01.012]
PAK, M., & Brieva, D. (2010). Designing and implementing a role-Playing game: A tool to explain factors, decision-making and landscape transformation. Environmental Modeling and Software, 25(11), 1322–1333.
PARKER, C., & Meretsky, V. (2004). Measuring pattern outcomes in an agent-based model of edge-effect externalities using spatial metrics. Agriculture, Ecosystem and Environment, 101(2–3), 233–250. [doi:10.1016/j.agee.2003.09.007]
PARKER, D. C., Manson, S. M., Janssen, M. A., Hofmann, M. J., & Deadman, P. (2003). Multi-agent systems for the simulation of land-use and land-cover change: A review. Annals of the Association of American Geographers, 93, 314–337. [doi:10.1111/1467-8306.9302004]
POTEETE, A. R., Janssen, M. A., & Ostrom, E. (2010). Working Together: Collective Action, the Commons, and Multiple Methods in Practice. Princeton, NJ: Princeton University Press.
RAILSBACK, S., & Grimm, V. (2012). Agent-Based and Individual-Based Modeling: A practical Introduction. Princeton, NJ: Princeton University Press.
RATNER, B. D., Meinzen-Dick, R., Hellin, J., Mapedza, E., Unruh, J., Veening, W., Haglund, E., C., M., & Bruch, C. (2013). Addressing conflict through collective action in natural resource management: A synthesis of experience.Washington, D.C: CAPRi Working Paper No. 112. [doi:10.18352/ijc.768]
SCHILL, C., Wijermans, N., Schlaijter, M., & Lindahl, T. (2016). Cooperation is not enough: Exploring social-ecological micro-foundations for sustainable common-pool resource use. PloS One, 11(8), e0157796. [doi:10.1371/journal.pone.0157796]
SCHULZE, J., Müller, B., Groeneveld, J., & Grimm, V. (2017). Agent-Based modelling of social-Ecological systems: Achievements, challenges, and a way forward. Journal of Artificial Societies and Social Simulation, 20(2), 8: https://www.jasss.org/20/2/8.html. [doi:10.18564/jasss.3423]
SEIDL, R. (2015). A functional-dynamic reflection on participatory processes in modeling projects. Ambio, 44(8), 750–765. [doi:10.1007/s13280-015-0670-8]
SHIFERAW, B., Kebede, T., & Reddy, V. R. (2009). Enabling institutions, collective action and watershed management in semi-arid India: Effects on natural resources and rural poverty. Beijing, China: Contributed paper prepared for presentation at the International Association of Agricultural Economists’ Conference. [doi:10.9783/9780812207873.149]
SMAJGL, A. (2010). Challenging beliefs through multi-level participatory modelling in Indonesia. Environmental Modeling and Software, 25(11), 1470–1476. [doi:10.1016/j.envsoft.2010.04.008]
SNYDER, K., Ludi, E., Cullen, B., Tucker, J., Zeleke, A., & Duncan, A. (2014). Participation and performance: Decentralized planning and implementation in Ethiopia. Public Administration and Development, 34, 83–95. [doi:10.1002/pad.1680]
TESHOME, A., de Graaff, J., & Kessler, A. (2016). Investments in land management in the northwestern highlands of Ethiopia: The role of social capital. Land Use Policy, 57, 215–228. [doi:10.1016/j.landusepol.2016.05.019]
VALBUENA, D., Verburg, H., & Bregt, K. (2008). A method to define a typology for agent-based analysis in regional land-use research. Agriculture Ecosystems and Environment, 128(1–2), 27–36. [doi:10.1016/j.agee.2008.04.015]
WILENSKY, U. (1999). NetLogo.
WOLKA, K. (2014). Effects of soil and water conservation measures and challenges for its adoption: Ethiopia in focus. Journal of Environmental Science and Technology, 7(4), 185–199. [doi:10.3923/jest.2014.185.199]
WONDIMAGEGNHU, B., & Zeleke, M. (2017). Determinants of rural out-migration in Habru District of Northeast Ethiopia. International Journal of Population Research, 2017, 4691723. [doi:10.1155/2017/4691723]