Job Done? Future Modeling Challenges After 20 Years of Work on Bounded-Confidence Models

, ,
and
aDalian University of Technology, China; bKarlsruhe Institute of Technology, Germany; cUniversity of Groningen, Netherlands
Journal of Artificial
Societies and Social Simulation 26 (4) 8
<https://www.jasss.org/26/4/8.html>
DOI: 10.18564/jasss.5137
Received: 06-Dec-2022 Accepted: 13-Apr-2023 Published: 31-Oct-2023
Abstract
Since the first publication of the bounded-confidence models 20 years ago, hundreds of articles studying this class of social-influence models have been written. Bounded-confidence models proposed an intriguing solution to a pervasive research puzzle and have helped unveil and explain intriguing phenomena. Here, we reflect about remaining research problems and future modeling challenges, arguing that there remain counter-intuitive model implications to be understood. To illustrate that there remain uncovered model challenges, we extend the bounded-confidence model. We assume assimilative influence when agents connected by positive relationships hold sufficiently similar opinions, adopting the core assumption of the bounded-confidence models. We combine this with another influential modeling approach, the notion that if agents connected by a negative social relationship disagree too much, opinion differences increase due to repulsive influence. This allows us to vary the relative strength of assimilation and repulsion in the influence dynamics, also allowing for the possibility that neither occurs in a particular interaction. Simulation experiments reveal three surprising findings: Counter the intuition that stronger assimilation decreases opinion diversity, we show that in the presence of repulsion, intensifying the strength of assimilation can actually generate more opinion bipolarization. Second, we show that if repulsion becomes weaker this may still result in more bipolarization. Third, it turns out that more negative social relationships between or within subgroups can result in less bipolarization. We demonstrate these effects in very simple and highly stylized settings, in order to show that intuition fails to capture the complexity arising from the interplay of assimilative and repulsive influence even in these simple settings. We discuss implications of our findings for the ongoing debate about societal conditions fostering bipolarization, including in particular the design of personalized online social networks. Further, we address how our results may inform future work comparing and integrating alternative models of social-influence dynamics.Introduction
Bounded-confidence models have a central place in the social-influence modeling literature (Deffuant et al. 2000; Hegselmann & Krause 2002). Since their publication 20 years ago, they have been studied in hundreds of publications and have generated numerous novel and counter-intuitive insights (Hegselmann & Krause 2015; Kurahashi-Nakamura et al. 2016). Most prominently, these models provided a simple but intriguing solution to a longstanding problem formulated by Robert Abelson (1964), showing that the inevitable march towards perfect consensus generated by earlier social-influence models can be stopped by the simple assumption that influence is limited to encounters between agents with sufficiently similar opinions. The outcome can be fragmentation, an opinion distribution with multiple modes with relatively moderate opinions. Yet, researchers also noted that bounded-confidence models could not readily capture opinion bipolarization, that is opinion distributions with two modes located at increasingly extreme positions and increasing intergroup disagreement. Given the strong interest in explaining bipolarization (Levin et al. 2021), fueled by current societal trends, this has led researchers to search for alternative modeling approaches. An important approach to overcome this problem adds the assumption of repulsion (Jager & Amblard 2005; Macy et al. 2003). That is, it is not only assumed that there is zero influence when interaction partners disagree too much. It is also added that influence can even turn negative or, repulsive, in that agents increase opinion differences to sources of influence they disagree with too much. The assumption of repulsion has been subject to various empirical tests. While outcomes are mixed (Liu & Srivastava 2015; Takács et al. 2016), there is growing evidence for repulsive social influence in online contexts (Bail et al. 2018; Keijzer 2022; Kozitsin 2023).
The aim of this contribution to the special issues on the anniversary of the bounded-confidence models is to show that there remain uncovered research challenges to the literature on social-influence models. Rather than looking back at earlier research, we seek to point to implications of bounded-confidence models that have not been explored sufficiently. In particular, we demonstrate here that combining the assumption of bounded confidence and the assumption of repulsive influence generates a series of new and highly counter-intuitive dynamics. We conclude that despite 20 years of highly productive research from various disciplines, the bounded-confidence model and its elaborations are far from being sufficiently understood. We discuss approaches to continue research on and with bounded-confidence models in future work.
To this end, we analyze a model combining assimilative influence with bounded confidence and repulsion, extending a model proposed by Jager & Amblard (2005). Our main addition to this earlier model is the inclusion of heterogeneous network ties. In our model, there is assimilative social influence when two network nodes are connected by a positive tie and when they are sufficiently similar. Repulsion, in contrast, is activated when two nodes are connected by a negative social relationship and when opinion differences exceed a given threshold. In our analyses, we vary the structure of the social network as well as the parameters governing when opinions are sufficiently similar or dissimilar to trigger assimilative influence or repulsion.
We restrict our analyses to highly stylized and very simple settings, assuming very small populations, simple network structures, very specific initial opinion distributions, and a synchronous updating schedule. While these assumptions should create a setting where it is easy to anticipate model behavior based on intuition, we show that intuition actually fails. In particular, we show that the conjunction of assimilative and repulsive influence generates the following counter-intuitive results:
- Increasing the space for assimilative influence by increasing the necessary opinion difference needed to deactivate assimilative influence can lead to more and not less opinion bipolarization.
- Decreasing the space for repulsive influence by increasing the necessary opinion difference to activate repulsion can lead to more and not less opinion bipolarization.
- More negative social relationships between subgroups in a population can lead to less opinion bipolarization.
- More negative social relationships within subgroups of a population can lead to less opinion bipolarization.
The remainder of this contribution is organized as follows. In Section 2, we summarize the bounded-confidence model and our extension including repulsive influence. Next, the results of our simulation experiments are presented in Section 3. We start with a short analysis of the bounded-confidence model to summarize its core implications. Subsequently, we discuss the findings derived from our extension of the bounded-confidence model. In the concluding section, we reflect on the implications for future research on social-influence processes.
The Model
The classical bounded-confidence model
Bounded confidence models capture the dynamics arising from repeated opinion communication in a social network, where the nodes of the network represent individuals, and the edges between the nodes represent influence relationships between individuals. Suppose a social network has \(n\) individuals, and at each point \(t\) in time, the opinions of individuals are \(x_i(t)\in[0,1]\). At given time steps, individuals’ opinions are updated based on their own previous opinion and the influence of the opinions of their network neighbors. The core assumption across different versions of the bounded confidence model is that when the opinion of a network neighbor is sufficiently close, agents are influenced to adapt their opinion by moving closer toward the opinion of that network neighbor. Two classical versions of bounded confidence can be distinguished in the literature, the model proposed by Deffuant, Weissbuch, and co-authors (Deffuant et al. 2000), and the model proposed by Hegselmann and Krause (Hegselmann & Krause 2002; Krause 2000).
We focus here on the version developed by Hegselmann and Krause. Their model assumes synchronous updating, such that in one time step all agents simultaneously move their opinions towards the average opinion of all network neighbors whose opinion falls within their range of confidence. Equation (1) formalizes this assumption.
| \[ \ x_i(t+1)=\alpha_{i1}x_1(t)+\alpha_{i2}x_2(t)+\dots+\alpha_{in}x_n(t) \,\] | \[(1)\] |
Equation 1 implies that an individual’s opinion moves towards the arithmetic mean of the opinions of all network neighbors whose prior opinions fall within i’s range of confidence. The opinion influence weight \(\alpha_{ij}\) is a time-varying quantity, as influence dynamics may change the number of individuals within i’s range of confidence.
Based on these assumptions, researchers have conducted numerous mathematical and computational analyses, largely supporting the result that when there is no strong variation in the distribution of confidence levels and when there are no individuals who are not open to influence in the social network, the type of opinion distribution (e.g. consensus, fragmentation or polarization) to which dynamics converge is largely determined by the average level of confidence \(\epsilon\) (Hegselmann 2020). As the level of individuals’ confidence \(\epsilon\) decreases, individual opinions will typically be more fragmented. The number of individuals \(n\) in the social network and the convergence parameters \(\alpha\) only affect the rate of convergence of group opinions. At the same time, earlier work has shown that the model also can produce many counter-intuitive results even for simple settings (Hegselmann 2020).
While research on the bounded confidence model has generated many important insights into the conditions for different outcomes of complex collective opinion dynamics driven by simple individual-level processes, it remains an open question how model dynamics change when combined with another frequently studied micro-level process, repulsive influence. One reason to explore this question is the increasing importance of online social interaction. Due to the rapid development of the Internet, the way people communicate has changed dramatically, and people can now be more exposed to divergent and discrepant sources of information, not being limited to communication among acquaintances (Keijzer et al. 2018). In social media, people are not only influenced by similar opinions, but can also be repelled by strongly different opinions (Bail et al. 2018; Kozitsin 2023). As a consequence, models that only take into account assimilative influence from sufficiently similar sources may not be able to capture how this affects online opinion dynamics.
Adding repulsion to bounded-confidence models
Here, we extend the bounded-confidence model, including two thresholds to filter the neighbors in the network whose opinions are similar to the individual’s own and thus have a assimilative influence on him, and those whose opinions are more different and thus have a repulsive influence on him. At the same time, we draw on the assumption of synchronous update of individual opinions, inspired by Hegselmann & Krause (Hegselmann & Krause 2002; Krause 2000). The central advantage of synchronous updating for the purpose of our analysis is that it turns the dynamics we study deterministic and, thus, independent of the ordering of opinion updates. This makes it easier to understand why the model has the counter-intuitive implications we present.
Consider a social network with \(N\) nodes representing the agents. The social relationships between agents are represented by a matrix \(C\). There are three types of relationships between individuals: positive links (\(c_{ij}=1\)), negative links (\(c_{ij}=-1\)) and no link (\(c_{ij}=0\)). The links are undirected, that is \(c_{ij}=c_{ji}\), and no individual is connected to him/herself, i.e., \(c_{ii}=0\). Every agent is described by an opinion \(x_i(t)\in[0,1]\). The set \(x(t)=\lbrace{x_1(t),x_2(t),\ldots,x_n(t)\rbrace}\) describes the distribution of opinions in the population.
To specify the social influence dynamics, we distinguish for any given point in time two subsets of the set of neighbors an individual has. For ease of exposition, let’s call these subsets “influential friends” and “influential foes”. Influential friends of individual \(i\) are neighbors who are positively linked to \(i\) and whose opinions do not differ by more than \(\epsilon_T\) from \(i\)’s opinion. This threshold has been adopted from the bounded-confidence model. That is, like in the bounded-confidence model only influential friends exert assimilative influence on \(i\)’s opinion. Influential foes, in contrast, are neighbors of \(i\) who are negatively linked to \(i\) and hold an opinion that differs by more than \(\epsilon_R\) from \(i\)’s opinion. Influential foes exert repulsive influence on i’s opinion. Accordingly, we denote \(\epsilon_R\) the repulsion threshold. More precisely, the corresponding two subsets are defined as follows.
| \[ \begin{aligned} \ A^+_{i}(t)=\{j\mid sign(\epsilon_T-\left| x_i(t)-x_j(t)\right|) \geq 0 \land c_{ij}=+1\}\, \\ \ A^-_{i}(t)=\{j\mid sign(\epsilon_R-\left| x_i(t)-x_j(t)\right|) \leq 0 \land c_{ij}=-1\}\, %\ A^-_{ij}(t)=\{j\mid sign(\left| \land x_i(t)-x_j(t)\right|-\epsilon_R)\cdot c_{ij=-1} < 0\}\, \end{aligned}\] | \[(2)\] |
\(A^+_{i}(t)\) denotes the set of neighbors who exert assimilative influence on individual \(i\in N\) at time \(t\), and \(A^-_{i}(t)\) denotes the set of neighbors with repulsive influence on individual \(i\). We selected neighbors that positively and negatively influenced individual \(i\) by the threshold parameters \(\epsilon_T\) and \(\epsilon_R\), respectively. Notice that unlike earlier literature (Jager & Amblard 2005), we do not require that the repulsion threshold (\(\epsilon_R\)) must be greater than the trust threshold (\(\epsilon_T\)). While this assumption would be reasonable if all network relations have the same valence, in our model it can be of interest to assume that individuals will have less tolerance for disagreement when they have a negative relation to a source of influence, as compared to disagreement with positive source of influence. In other words, we are interested in exploring what happens if larger disagreement is needed to make an individual ignore the opinion of a positively connected neighbor than would be needed to let an individual be negatively influenced by the opinion of a negatively connected neighbor.
To further specify the model dynamics, we compute separately the net pull \(X^{+}\) on \(i\)’s opinion exerted by the aggregation of the influences from all influential friends and the net push \(X^{-}\) exerted by the aggregation of the influences of all influential foes, at a given time point. Equation 3 formalizes this as follows.
| \[ \begin{aligned} \ X^{+}_{i}(t)=\sum_{j\in A^{+}_{i},i\neq j}\ (x_{j}(t)-x_{i}(t)) \\ \ X^{-}_{i}(t)=\sum_{j\in A^{-}_{i},i\neq j}\ (x_{j}(t)-x_{i}(t))\, \end{aligned}\] | \[(3)\] |
Individual opinions in the network are pulled towards the average opinion of influential friends, and the larger the proportion of influential friends among all neighbors, the stronger this attraction becomes. At the same time, individuals’ opinions are pushed away from the average opinion of influential foes. The larger the proportion of influential foes among all neighbors, the stronger this push will be. Note that this push is limited by the bounds of the opinion scale.
To be able to control the extent to which the combined influence of influential friends and enemies changes an individual’s opinion at a given time step, we introduce a parameter \(\lambda\) that controls the impact of these influences relative to the individual’s prior opinion. Individual’s opinions are updated as specified in Equation 4, where \(n_i\) denotes the number of neighbors of agent \(i\).
| \[ \ x_i(t+1)=x_i(t)+\frac{\lambda}{n_i} \cdot(X^{+}_i(t)-X^{-}_i(t)) \,\] | \[(4)\] |
When repulsion is very strong, Equation 4 can imply that the updated opinion adopts values beyond the bounds of the opinion scale. To assure that opinions always remained within these bounds, we included that opinions adopt a value on the respective bound, whenever this happened.
Results
To quantify the degree of opinion bipolarization in the simulated opinion dynamics, we use the bipolarization index proposed in earlier work (Flache & Mäs 2008), but in a slightly adapted version (Flache 2019). It captures the degree to which opinions in the population fall apart into two evenly-sized fragments with maximal disagreement between and maximal agreement within the fragments. Technically, the bipolarization of the opinions \(P_t\) is obtained by calculating the variance of the opinion distances of all pairs of agents in the population, as detailed in Equation 5. In Equation 5, \(\bar{d(t)}\) represents the average opinion difference in all pairs of agents in the entire population. When the opinion difference between all agents is zero, the group has reached a consensus, which corresponds to (\(P_t=0\)). If the population consists of two maximally distant factions of equal size, then \(P_t=1\).
| \[\ P_t=\frac{4}{N^2}{\textstyle \sum_{ij}^{i\in N,j\in N}}(\left| x_i(t)-x_j(t)\right|-\bar{d(t)})^2 \, \] | \[(5)\] |
The classical bounded confidence model
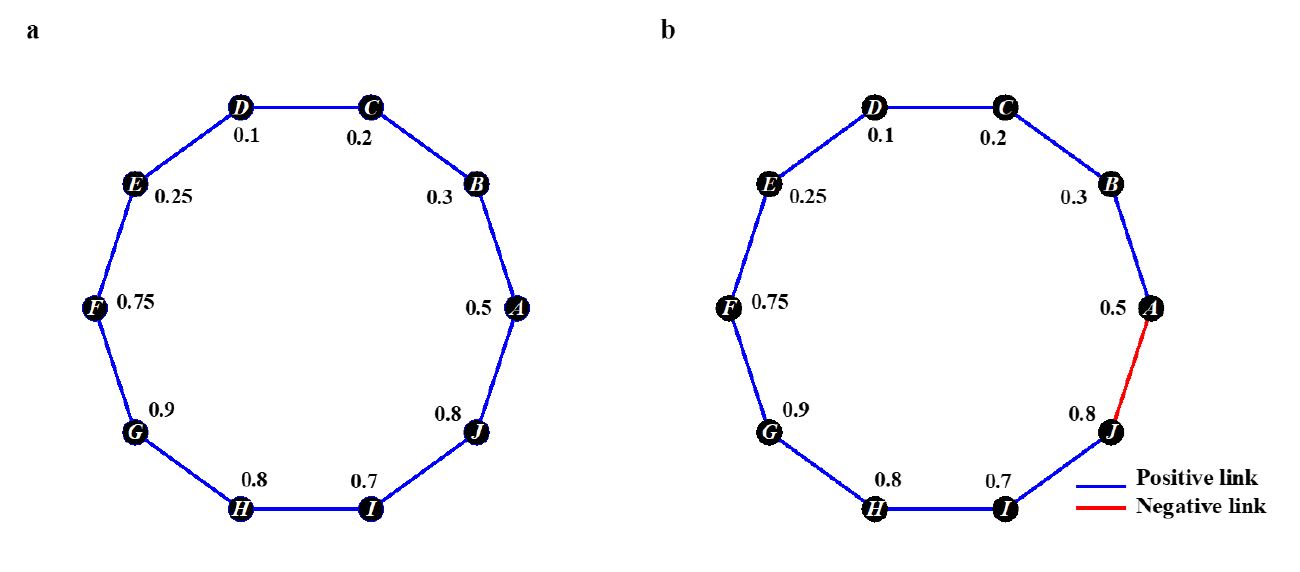
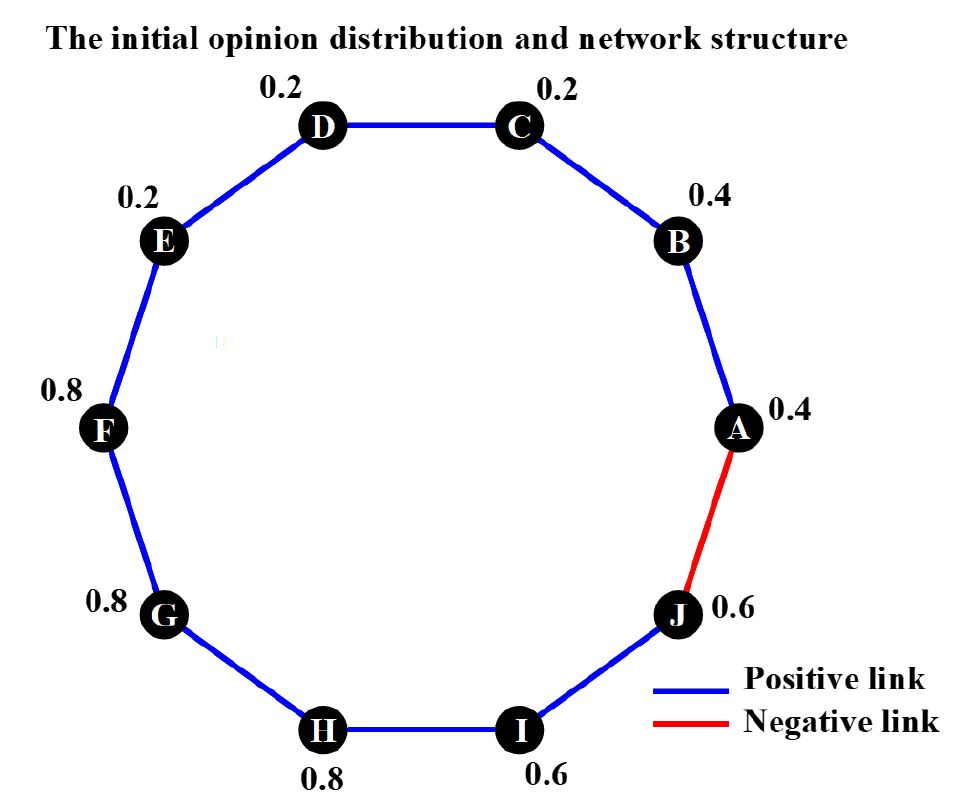
We start our analyses with the classical bounded-confidence model, to illustrate that already this classical model generates counter-intuitive effects and to demonstrate one of the main differences of our model compared to the bounded thresholds model. To this end, we used the simple ring network shown in Panel a of Figure 1. The values printed next to the ten nodes show the initial opinion of each agent. We assigned the initial opinions in such a way that already at the outset two subsets of agents can be distinguished. While agents \(A\) to \(E\) hold opinions smaller or equal to \(x_i(0)=0.5\), the opinions of agents \(F\) to \(J\) exceed this value, which creates a potential faultline for opinion bipolarization.
In Figure 2, we show opinion trajectories generated by the bounded-confidence model under three different values of the parameter \(\epsilon_T\). Each line shows the opinion trajectory of an agent. The colors of the ten lines in each panel correspond to agents’ initial opinions. The Figure provides two insights. First, it shows that also according to the bounded-confidence model, the relationship between the openness to assimilative social influence and the final degree of opinion bipolarization is not monotone, a counter-intuitive effect that has been described in earlier work and that is present even in this very simple setting (Deffuant 2006; Hegselmann 2020; Lorenz 2006; Mathias et al. 2016). On the one hand, comparing Panels a and c, one finds that giving assimilative influence more space by increasing the maximal width of the confidence interval, generates consensus. In Panel a, assimilative influence is activated between agents who do not disagree by more than \(\epsilon_T=0.1\) scale units. As a consequence, influence is restricted to two subsets of agents: agents \(B\), \(C\), \(D\), \(E\) and agents \(F\), \(G\), \(H\), \(I\), \(J\). Within the subsets, agents reach a local consensus. In addition, agent \(A\) disagrees too much with both of his contacts and, as a consequence, does not join either of the subgroups. In sum, the dynamic reaches a steady state with three stable fragments. In Panel c, in contrast, the high openness to assimilative influence (\(\epsilon_T=0.3\)) leads to fast opinion convergence also between the two subgroups, a force that is stronger than local convergence. The final outcome is a global consensus.
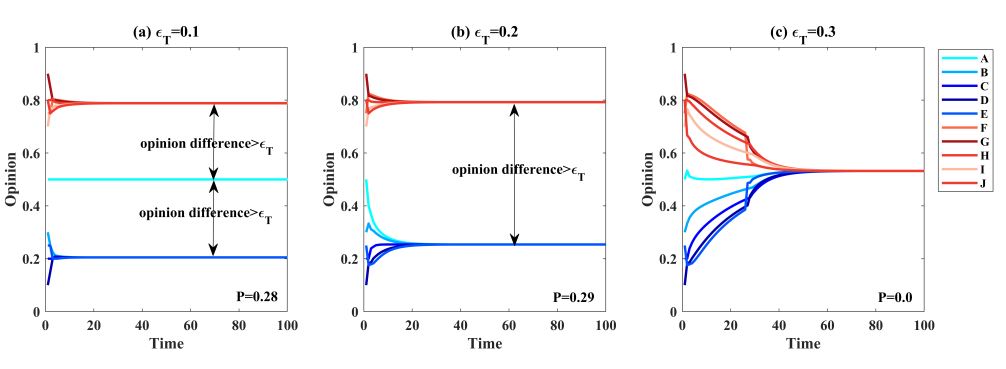
Counter-intuition, however, the highest degree of bipolarization is observed under an intermediate value of \(\epsilon_T=0.2\) (see Panel b), where assimilative influence is still generating local convergence and the emergence of two subgroups. In addition, agent \(A\) is now sufficiently similar to agent \(B\) and, thus, joins the subgroup of \(B\). The final degree of opinion bipolarization is slightly higher than in Panel a, because agent \(A\) grew perfectly similar to agents \(B\), \(C\), \(D\), \(E\) and, in addition, more dissimilar to the other subgroup´s members. This counter-intuitive effect is relatively small, but it demonstrates that also the classical bounded-confidence model can display complex behaviors even in very simple settings.
The second insight illustrated by Figure 2 is that the bounded-confidence assumption alone does not suffice to generate maximal opinion bipolarization in this setting. While bipolarization did slightly increase in Panels a and b from an initial value of \(P_t=.24\) to \(P_t=.28\) and \(P_t=.29\), respectively, a population will never fall apart into two maximally extreme subgroups unless there are already at the outset of the dynamics agents with maximally extreme opinions and zero openness to influence (Hegselmann & Krause 2002). In fact, while increasing \(\epsilon_T\) from 0.1 to 0.2 reduced the number of subgroups from three to two, the distance between the two big subgroups remained unchanged. In search for microlevel assumptions that can generate increasing and maximal bipolarization, modelers added further assumptions to the model.
More assimilative influence can increase bipolarization
One approach to induce increasing as well as maximal bipolarization is to add the assumption of repulsive influence. Panel b of Figure 1 shows the same social network as Panel a with one difference: we added a negative link between agents \(A\) and \(J\). This intensified the initial faultline between the two subgroups, since it adds the possibility for repulsive influence between the two subgroups observed under the bounded-thresholds model. Agents’ initial opinions remained unchanged, however.
Figure 3 shows opinion trajectories generated by the model combining assimilative and repulsive influence. We kept the parameter governing the amount of repulsive influence constant at \(\epsilon_R=0.5\) and varied only the amount of assimilative influence. The dynamics shown in Panels a (\(\epsilon_T=0.15\)) and d (\(\epsilon_T=0.5\)) are very similar to the ones generated by the bounded-confidence model, because repulsive influence is possible only between agents \(A\) and \(J\), and their opinions never differed by more than \(\epsilon_R=0.5\) in these dynamics. When assimilative influence is very restricted (Panel a), the model generates again an opinion distribution with two fragmented subgroups and agent \(A\) in the center. With very strong assimilative influence (Panel d), the population again reaches consensus.
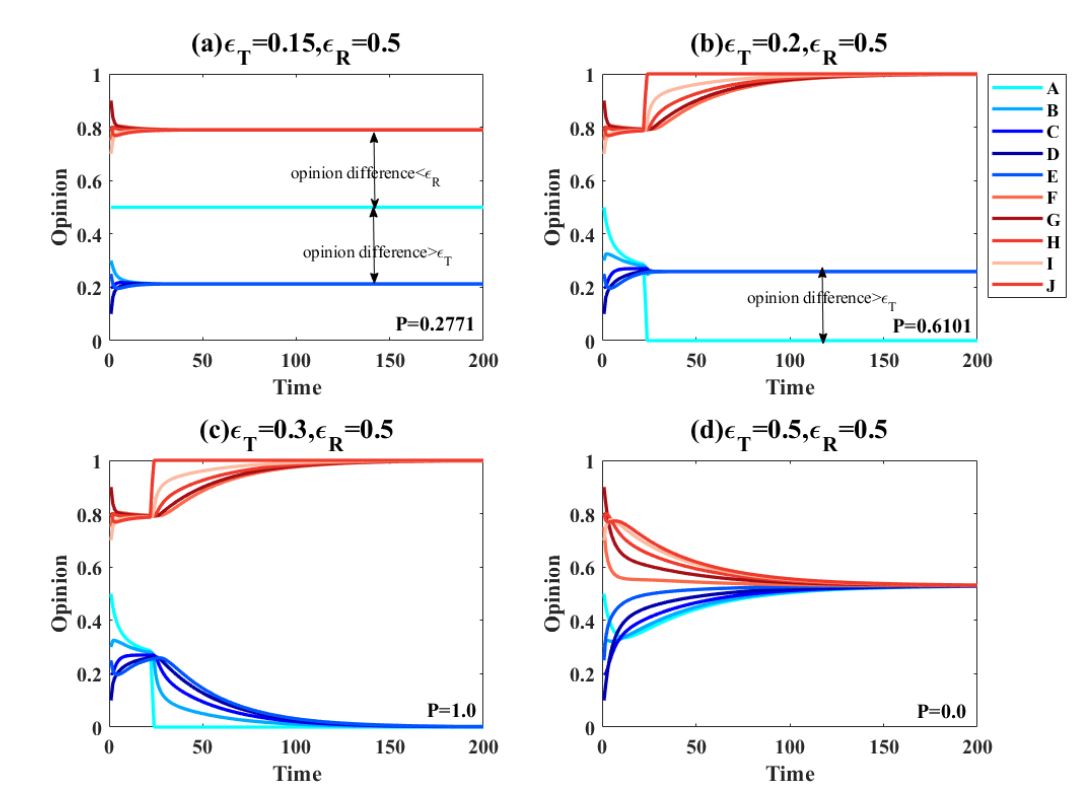
Counter-intuition, Figure 3 shows that increasing the trust threshold from 0.15 (Panel a) to 0.2 (Panel b), results in a higher degree of bipolarization. Increasing the trust threshold makes the conditions for assimilative influence less restrictive. Intuitively, one could expect this to reduce bipolarization. However, this causes Agent \(A\) to join the subgroup with opinions below 0.5, which pulls Agent \(A\) away from Agent \(J\) until the opinion difference between the two agents exceeds the repulsion threshold \(\epsilon_R\). As a consequence, Agents \(A\) and \(J\) adopt more extreme opinions, moving closer to the poles of the opinion scale. However, only in the subgroup of Agents \(J\) assimilative influence leads the other subgroup members to also adopt extreme opinions. This is because the opinion differences between Agent \(J\) and the members of his subgroup are smaller than the trust threshold. In contrast, the opinion of Agent \(A\) differs by more than the threshold value \(\epsilon_R\) from the opinions of the members of his subgroup. In equilibrium, the population is characterized by an extreme group, a single agent at the opposite pole of the opinion scale and a second subgroup with non-extreme opinion values.
When the trust threshold is further increased to 0.3 (Panel c), even the maximal degree of opinion bipolarization is generated. The dynamics are very similar to those of Panel d, but the increased trust threshold implies that Agent \(A\) now manages to also pull his subgroup to the opinion pole.
The four runs illustrate two mechanisms generating a counter-intuitive effect of increasing assimilative influence. First, increasing assimilative influence can contribute to bipolarization, because it fosters local opinion convergence and the emergence of distinct subgroups. Importantly, when opinions converge locally, opinion differences between agents joining different subgroups can grow. If these agents have a negative relationship, repulsion can be activated and lead agents in opposing subgroups to adopt increasingly distant views. Thus, assimilative influence can generate opinion distributions that activate repulsion. Second, once repulsion has generated extremists, assimilative influence can motivate friends of extremists to also adopt extreme opinions and contribute to strong bipolarization.
Next, we tested whether this non-monotonous effect of increasing the trust threshold generalizes to a broader section of the parameter space. The heat map shown in Figure 4 informs about the level of bipolarization in the equilibrium outcomes induced when values of the trust and the repulsion threshold are varied independently across the entire range of feasible values [0,1]. All runs were conducted with the network and the initial opinions shown in Panel b of Figure 1.
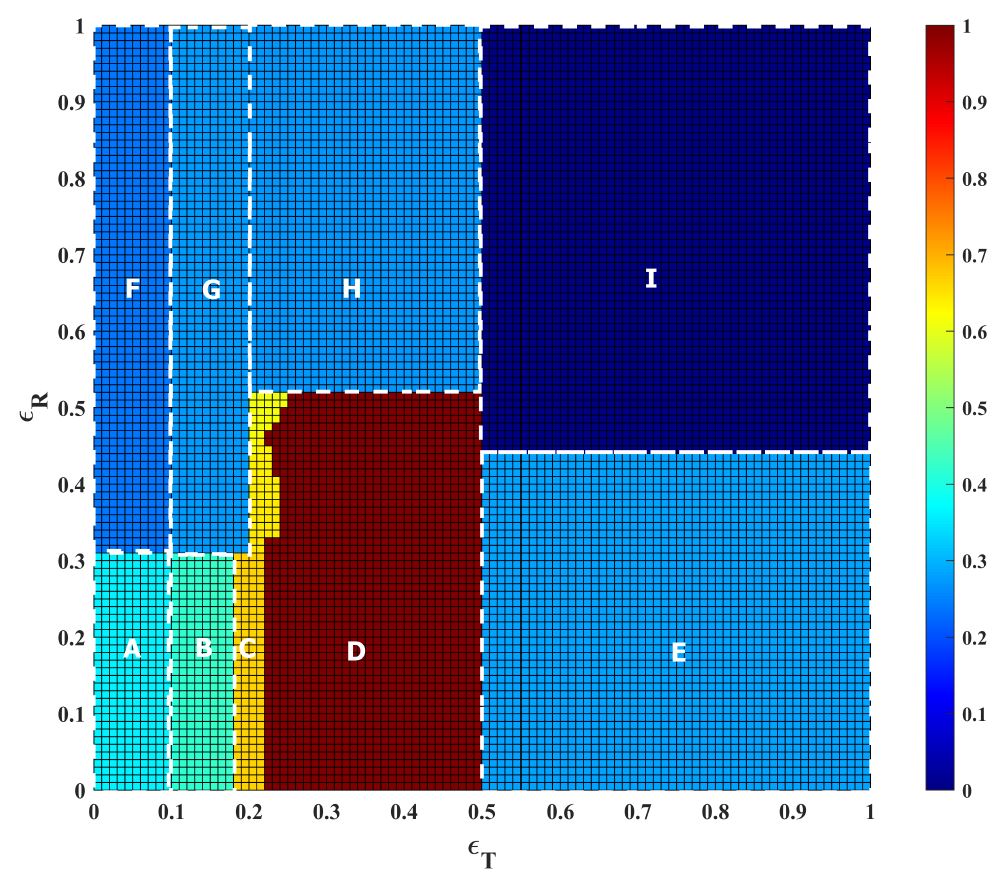
We can distinguish nine qualitatively different phases in the parameter space inspected in this experiment. Runs representing four of theses phases have been shown in Figure 3. These runs represent points on a horizontal slice through the heat map at \(\epsilon_R=0.5\). Area F in the heat map is trivial, since neither assimilative nor repulsive influence is activated. This is because the initial opinions of all agents connected by a positive link differ by more than the trust threshold. Likewise, the two agents connected by the negative link differ by less than the repulsion threshold. Area G corresponds to Panel a in Figure 3. The yellow area (C) shows the parameter combinations leading to a dynamic similar to the one shown in Panel b. Area D corresponds to Panel c and Area I to Panel d. The remaining areas (A, B, H, E) are addressed in Appendix A.
In a nutshell, the heat map of Figure 4 shows that our observation that more assimilative social influence can result in growing bipolarization is not restricted to very specific parameter values.
Less repulsion can generate more bipolarization
Another counter-intuitive effect can be observed when the amount of repulsive influence is manipulated. Intuitively, one would expect that bipolarization is a more likely outcome of opinion dynamics when there is more repulsive influence. This intuition is incomplete, however. To demonstrate this, Figure 6 shows opinion trajectories generated under four different values of the repulsion parameter \(\epsilon_R\). The trust threshold was fixed at \(\epsilon_T=0.22\). We also slightly adjusted the initial opinion distribution, as shown in Figure 5. Also this new initial setup is characterized by an initial faultline. The main change, however, was to decrease the opinion difference between the two agents connected by a negative tie.
In Panel a of Figure 6, we show the run with the strongest repulsive influence. Here, agents \(A\) and \(J\) are increasing their opinion distance whenever their opinions differ by more than 0.1. Accordingly, the figure shows how bipolarization quickly rises in this dynamic. Agents \(A\) and \(J\) move to opposite poles within a few time steps. Next, they exert assimilative influence on their positive network contacts, sparking a chain of opinion moves of the remaining agents until all agents are maximally extreme.
For the dynamics shown in Panel b, the repulsion threshold was set to 0.22, which implements weaker repulsion. In fact, since agents \(A\) and \(J\) initially disagree by 0.2 units of the opinion scale and since repulsion is activated only when opinion distance exceeds the repulsive threshold of 0.22, there is no repulsion at the outset. What is more, the two positive network contacts of \(A\) and \(J\) hold the same initial opinion as the two agents \(B\) and \(I\) (see Figure 5), which implies that \(A\) and \(J\) do not change opinion in the first time step. Only in the second time step - after the opinions of \(B\) and \(I\) had moved closer to the extremes - \(A\) and \(J\) develop more extreme opinions as the result of assimilative influence from influential friends. The consequence is that their opinions now differ by more than the repulsion threshold, which results in a strong push toward the nearest pole of the opinion scale. In the meantime, assimilative influence has generated a local convergence of opinions within the two subgroups. This pulls back agents \(B\) and \(I\), who do not follow \(A\) and \(J\) quickly enough. At some moment, \(A\) and \(J\) even grew too dissimilar to their positive network contacts. The end result is an opinion distribution with two non-extreme clusters of agents and two isolated extremists.
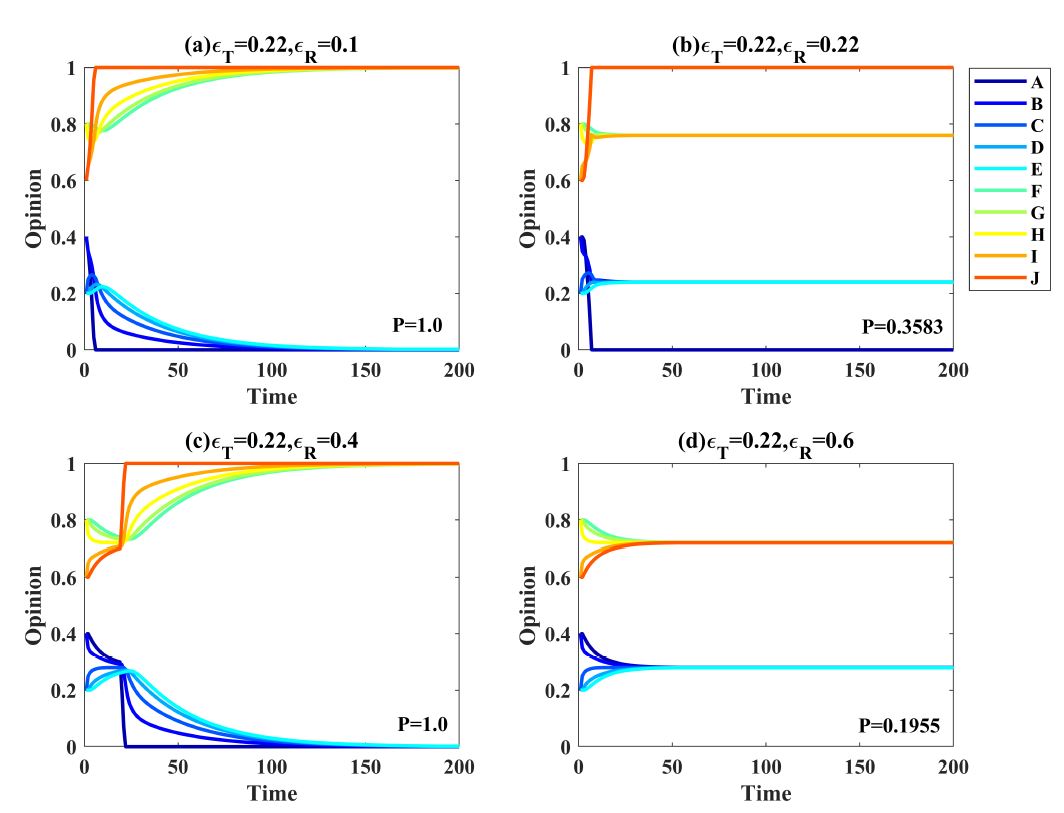
Panel c shows a counter-intuitive dynamic, since it shows more bipolarization compared to Panel b despite less repulsive influence (\(\epsilon_R=0.4\)). Since repulsion between \(A\) and \(J\) is activated only when their opinions differ by more than 0.4, there is only assimilation at the beginning of the dynamics. This generates local convergence and the emergence of two very homogeneous clusters. However, similar to the dynamics shown in Panel b of Figure 3, local convergence also increases the opinion differences between \(A\) and \(J\) to a degree that repulsion is activated. When this happens, the two agents start developing increasingly extreme opinions. Unlike in the dynamics with stronger repulsion (Panel b), two homogeneous local subgroups had formed already and \(A\) and \(J\) were part of one of them. As a consequence, \(A\) and \(J\) are subsequently dragging the remaining members of their local subgroup with them while being pushed to opposite extremes by their mutual repulsion.
Finally, Panel d shows the lowest degree of bipolarization, an outcome that is expected given that there is little repulsion. In fact, the opinion difference between \(A\) and \(J\) never exceeds the threshold of 0.6 in this dynamic. The trust threshold is not large enough to make the opinions converge between \(E\) and \(F\), thus two stable opinion clusters form.
In sum, a comparison of Panel b and c highlights that more repulsive influence can generate less opinion bipolarization. This happens because weaker repulsive influence gives room for assimilative influence and the emergence of local clusters. Local convergence can activate repulsion, which affects not only the agents who experience repulsion but also the other members of local clusters. Under a stronger repulsion, this dynamic does not unfold when agents affected by repulsion develop extreme opinions so fast that they disagree too much with other members of their own cluster to drag them with them.
In Figure 7, we again show for which combinations of \(\epsilon_T\) and \(\epsilon_R\) qualitatively different outcomes emerge for the initial situation depicted by Figure 5. The four dynamics shown in Figure 6 correspond to a vertical slice from the bottom to the top through this heat map at \(\epsilon_T=0.22\). The heat map shows a large phase of maximal bipolarization in equilibrium (see Area C). The dynamics that lead to this equilibrium, however, are not the same under all parameter combinations included in this phase, as we have already seen in Panels a and c of Figure 6. In both cases, the model generates maximal bipolarization, but only in the run shown in Panel c, there is an intermediate period with two subgroups holding non-extreme opinions.
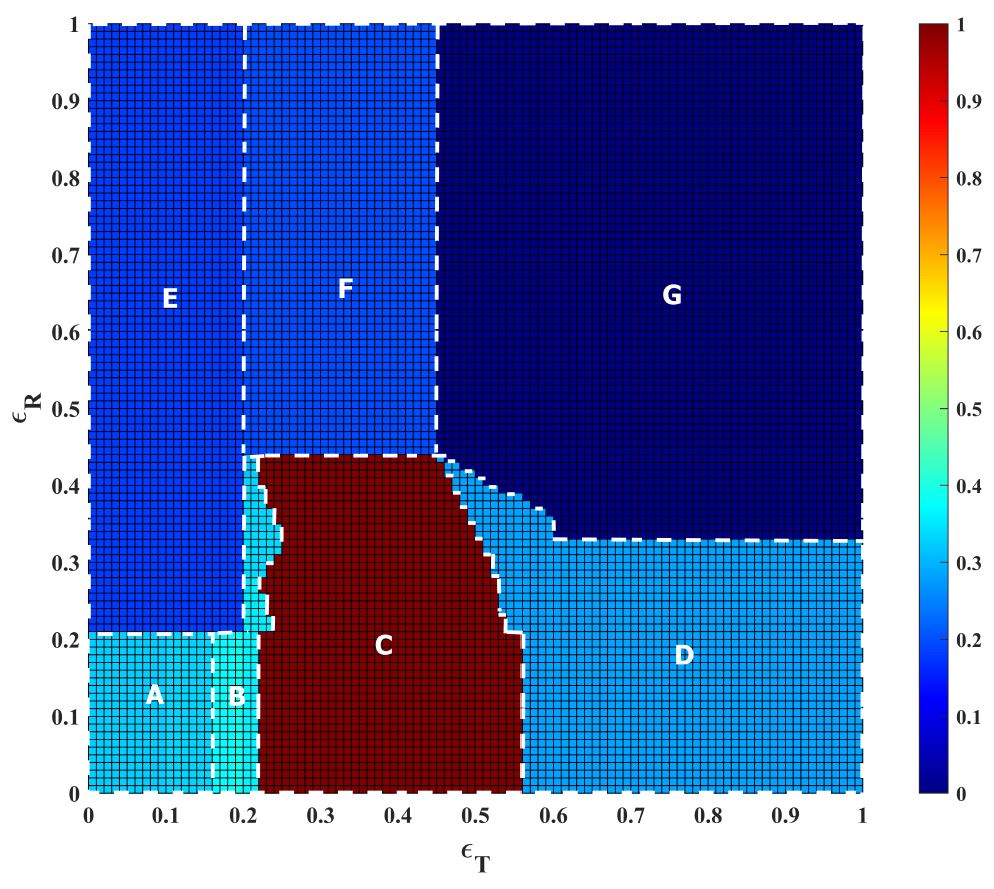
Importantly, the heat map shows that when one moves at \(\epsilon_T=0.22\) vertically from bottom to the top through the heat map, one actually leaves Phase B twice and enters Phase C. This is the phase illustrated by Panel b in Figure 6. Thus, bipolarization increases despite weaker repulsive influence. The heat map, however, also reveals that this counter-intuitive effect can be observed only in a restricted range of values of parameter \(\epsilon_T\). We show below, however, further evidence for this effect.
Another finding from this second heat map is that there is again support for the first counter-intuitive effect. When slicing horizontally through the heat map for instance at \(\epsilon_R=0.3\), bipolarization increases when Phase B is left and Phase C is entered, despite stronger assimilative influence.
Area F in the heat map corresponds to Panel d of 6. The remaining areas are addressed in Appendix B.
More negative links between subgroups generate less bipolarization
Intuitively, one would expect that bipolarization should be more likely when there are more negative social relationships in a network, a prediction relating to the debate about the difference between ideological and affective polarization (Finkel et al. 2012; Iyengar et al. 2019). While the concept of ideological polarization captures what we denote here as opinion bipolarization, affective polarization describes a state in which subgroups in a population have developed negative feelings towards the other subgroup. Intuitively, one would expect that more negative relationships between members of different subgroups would contribute to opinion bipolarization. Again, one can show that this intuition is incomplete.
To demonstrate this, we compared opinion dynamics emerging in the two networks shown in Figure 8. The initial opinion distribution and the network shown in Panel a is identical to the network analyzed in the previous section (see Figure 5). The only difference between the two networks shown in Panels a and b is the two additional negative links which connect agents from different subgroups in the initial opinion distribution, linking \(A\) with \(I\), and \(B\) with \(J\) respectively.
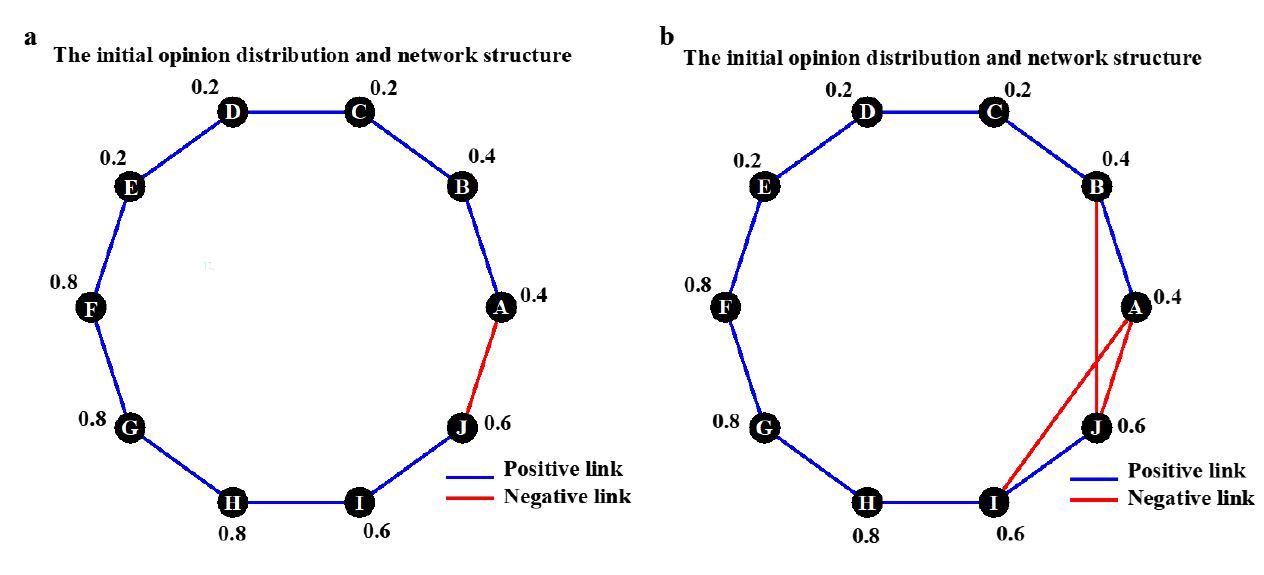
Figure 9 shows the opinion dynamics generated on the two networks. The dynamics shown in Panel a is the same as the dynamics shown in Panel c of Figure 6. Here, agents \(A\) and \(J\) exert repulsive influence on each other and, subsequently, pull their subgroups with them to the poles of the opinion scale. Strikingly, Panel b reveals that this bipolarization dynamic does not evolve when there are additional negative links between the two subgroups. This effect emerges because the repulsive influence is actually never activated in this run. According to the mathematical equations 3 and 4, the strength of the assimilative influence depends on the relative share of positive and negative links an agent has. Since agents \(A\) and \(J\) have twice as many negative links as positive links in the network of Panel b, the strength of positive influence is weaker. As a consequence agents \(A\) and \(J\) are pulled less by their friends towards more extreme opinions. The consequence is that the opinion distance between the two subgroups never exceeds the repulsion threshold and repulsion is never activated. Likewise, the trust threshold is not large enough to make agents E and F converge toward each other, which results in two opinion clusters at steady state.
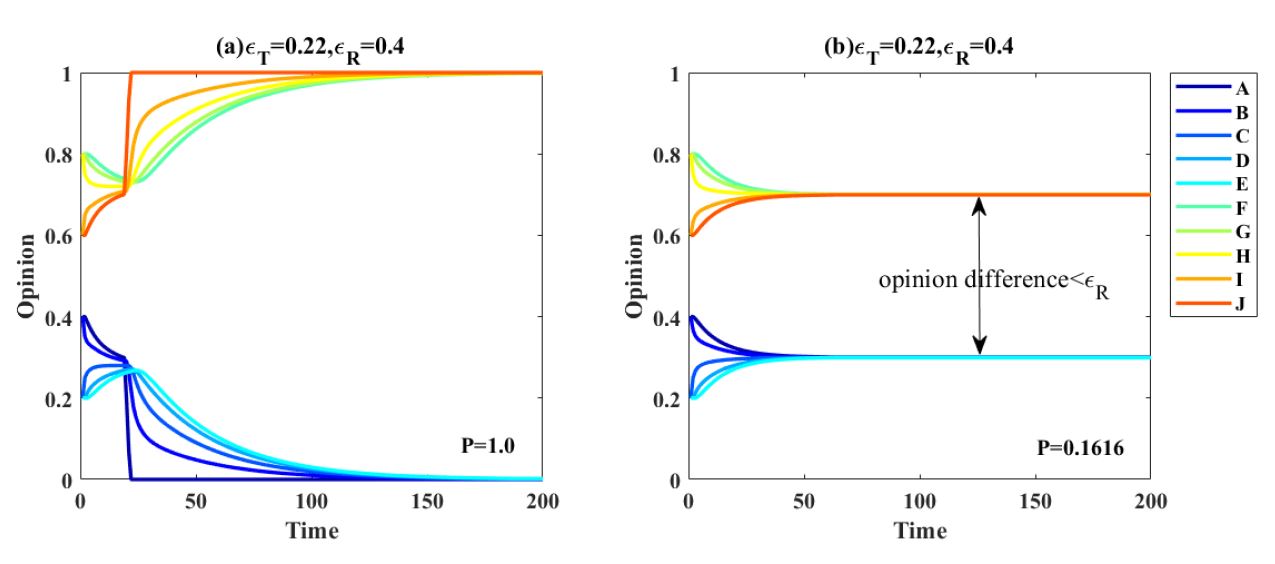
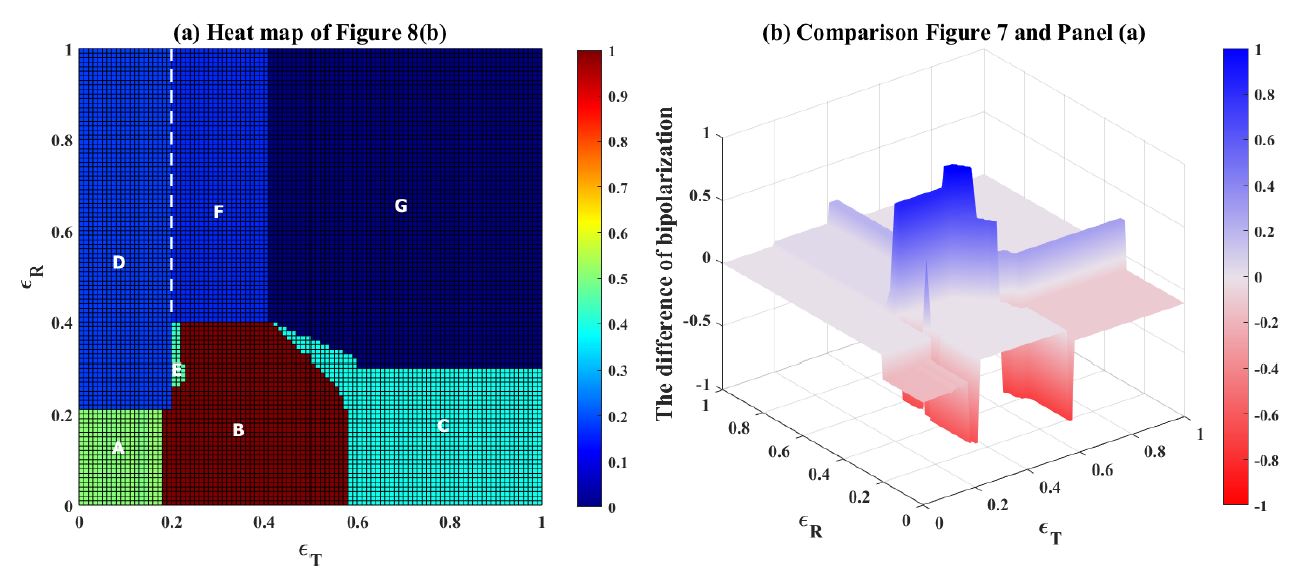
Figure 10 depicts in Panel a heat map revealing all phases generated by the model when the two negative links are added. In Appendix C, we show typical opinion trajectories for all areas of the heat map. Comparing Panel a to the heat map from the previous section (see Figure 7), one can observe that adding the two negative links often increases bipolarization, which is in line with the intuitive prediction. In particular the red area showing the phase of the maximal degree of bipolarization is bigger with the two negative links. However, this is not always the case. To visualize this, we included in Panel b a graph reporting the difference between the measured degree of bipolarization in the runs without (see Figure 7) and the runs with the added links (Panel b). Positive values and blue shades indicate lower bipolarization when the additional negative links are present. Values below zero and red shades depict higher bipolarization when the negative links are included. While the area where bipolarization rises due to the inclusion of the negative links is relatively small, Panel b shows that polarization increases under various combinations of the two parameters.
More negative links within subgroups generate less polarization
In the previous section, we showed how adding two negative links connecting members of the two different subgroups changes dynamics. We found that this can lead to a decrease in bipolarization. To test whether this will be different when negative links are added within rather than between subgroups, we conducted another experiment. We added to the network of Figure 11 (panel a) two different negative links, one within each of the two subgroups. Panel b of Figure 11 shows where we added the two negative ties. They connect agents A and J with a member of their respective subgroup. This time different intuitions would be possible. On the one hand, more negative links could be expected to increase bipolarization. On the other hand, negative links within subgroups may hamper convergence within the subgroups which, in turn, could make it less likely that repulsive interactions between negatively connected members of the different subgroups (here \(A\) and \(J\)) will be triggered. Thus, one could also expect bipolarization to decline.
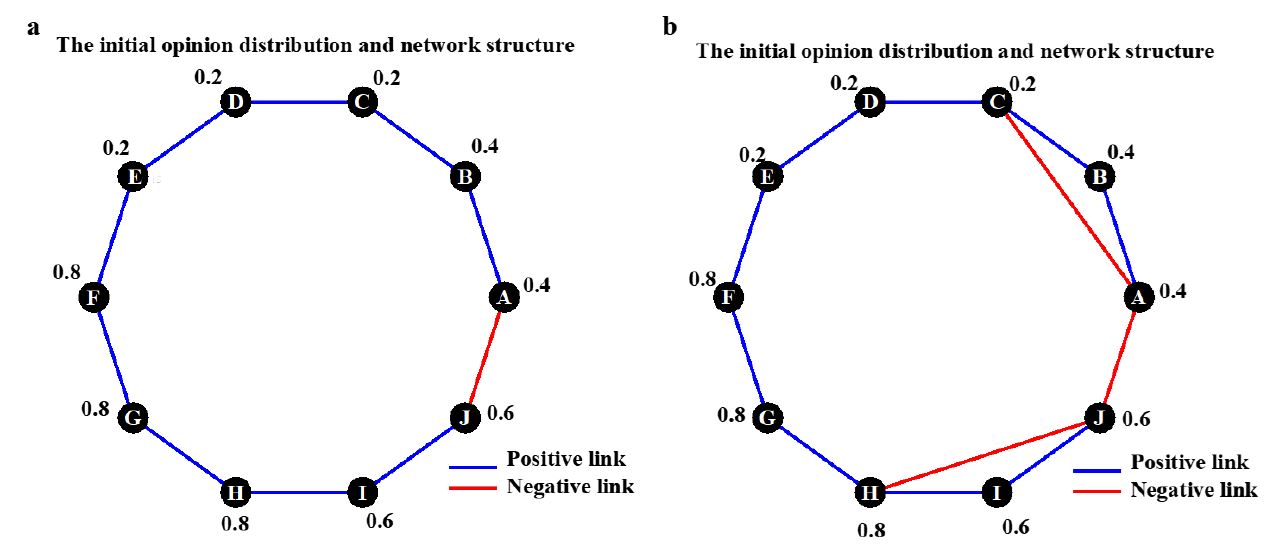
Figure 12 shows two opinion trajectories. For comparison, the run in Panel a is the same as the run from Panel a in Figure 6. The dynamics shown in Panel b emerge when the two negative links are added within the subgroups, all other things being equal.
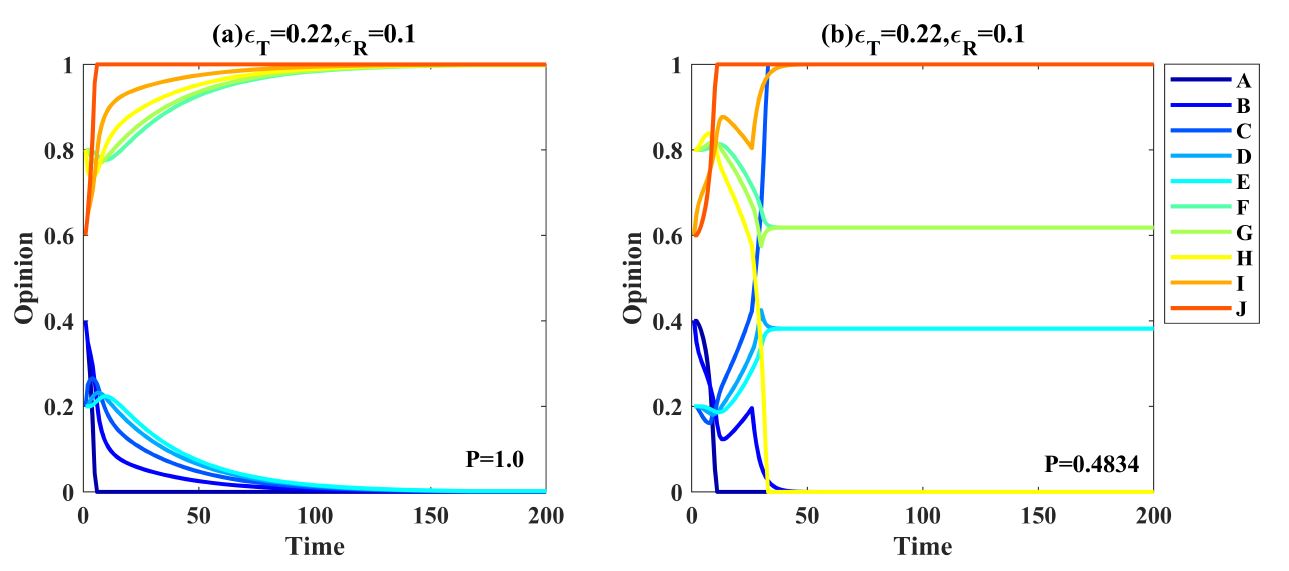
The dynamics shown in Panel b are complex. The first phase of the dynamic is characterized by opinion shifts towards the closest opinion pole by agents \(A\) and \(B\), as well as agents \(I\) and \(J\). This results from repulsion caused by the negative link between \(A\) and \(J\) and the assimilative influence from the respective subgroup. After eight steps of opinion updates, opinions within each of the two subgroups have grown very similar while the opinion distance between the emergent subgroups has risen to about 0.6. In fact, the maximal pairwise opinion distance within each subgroup (\(A\)-\(E\), and \(F\)-\(J\)) has decreased to 0.067, which is smaller than the repulsion threshold. At this moment, the two added negative links are not activated. However, due to the repulsive influence between them, agents \(A\) and \(J\) keep developing increasingly extreme opinions and move away from their subgroups. This has important consequences for agents \(C\) and \(H\), the two agents with the added negative links to \(A\) and \(J\). After 9 steps of opinion updates, they have grown too different to \(A\) and \(J\) and start moving away from \(A\) and \(J\) and towards more moderate opinions. They also manage to drag the other members of their subgroups (\(B\) \(D\) \(E\), and \(F\) \(G\) \(I\)) with them. After further opinion updates, however, agents \(B\) and \(I\), who have positive links to two subgroups members with the negative links, grow too dissimilar to \(C\) and \(H\). As a consequence, they stop following \(C\) and \(H\) and move back in the direction of agents \(A\) and \(J\). Subsequently, \(C\) and \(H\) continue developing increasingly extreme opinions and eventually join the two extremists from the opposite subgroup. The remaining two agents of each subgroup form a local consensus at moderate opinions.
In a nutshell, dynamics generate an opinion distribution with two groups at the opinion poles and two small groups with moderate opinions. This pattern is characterized by a much lower degree of bipolarization than the results shown in panel (a), even though negative links were added. It emerges because the two agents with the added negative links (agents \(C\) and \(H\)) join the respective other subgroup. In addition, assimilative influence makes these agents tear their subgroup apart. They pull a part of their subgroup with them until they grow too different from their extreme subgroup members. Thus, also in this scenario, a combination of assimilative and repulsive influence is responsible for the complex dynamics.
Figure 13 contains in Panel a the heat map reporting the degree of bipolarization emerging under all combinations of parameters \(\epsilon_T\) and \(\epsilon_R\) when the two negative links are added within the subgroups. In panel b, red areas identify phases with lower bipolarization emerging when the two negative network links are added, which shows that the dynamics shown in Panel b of Figure 12 are characteristic for a considerable part of the parameter space. Again, we refer to the Appendix for a detailed discussion of the trajectories of each phase (see Appendix D).
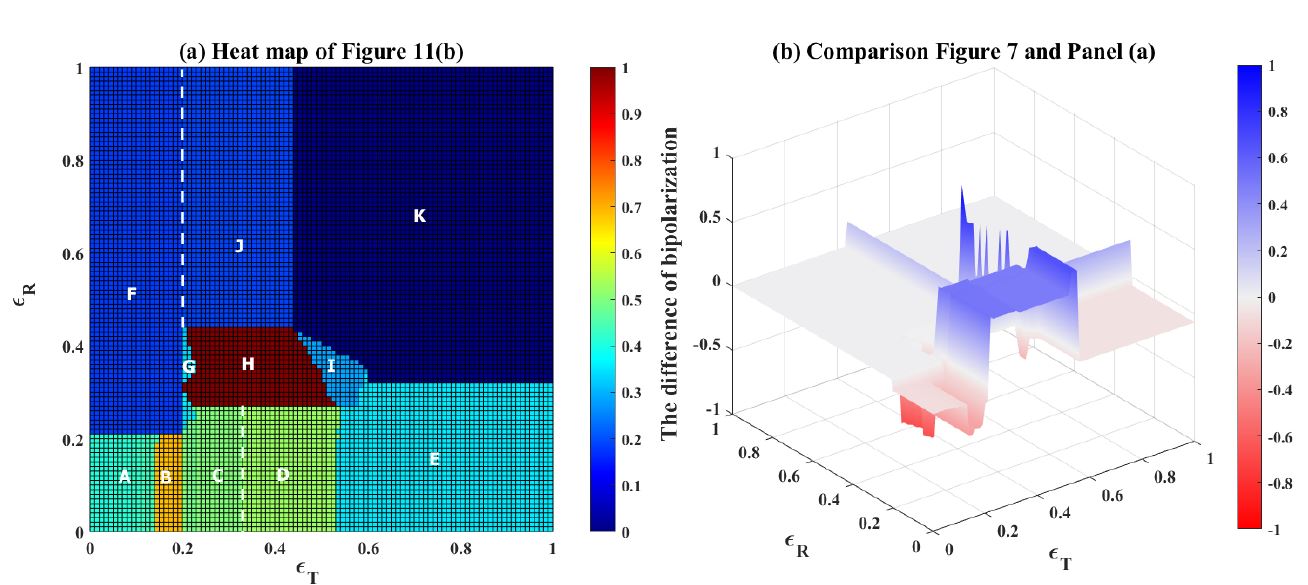
Visual comparison of the heat map in Panel a with the heat map of Figure 7 shows that the phase with maximal bipolarization (see blue area in Panel b) is substantially smaller when the two negative links within the subgroups are added. Strikingly, the difference is found when \(\epsilon_R\) adopts low values, which implements very strong repulsive influence. Weaker repulsive influence results also here in stronger bipolarization, providing additional support for the second counter-intuitive finding. The reason is that the two added negative links are not activated when repulsive influence is weaker. As a consequence, the two subgroups remain cohesive and all members of a subgroup move together to the respective pole of the opinion scale. When repulsion is stronger, the subgroups fall apart and the final opinion distribution also has two peaks close to the center of the opinion scale.
Discussion
The aim of this contribution to the JASSS special-issue on the anniversary of the bounded-confidence models was to reflect on the state of the literature that these models have contributed to. Rather than summarizing the vast body of literature that has emerged in the past 20 years, we sought to illustrate that there remain challenges for modelers. In particular, we showed that a simple model combining the assumption of bounded-confidence with the assumption of repulsion generates several counter-intuitive and intriguing dynamics even in very simple and stylized settings. Our main conclusion is that despite 20 years of intensive and rigorous modeling work with contributions from disciplines as diverse as sociology, social psychology, economics, mathematics, and physics, there are still complex model dynamics that deserve attention by modelers. Bounded-confidence modeling is a great success, but the job is not done since even relatively simple model extensions reveal new and unexpected dynamics.
While our modeling work allowed us to illustrate that even in seemingly simple scenarios, complex and unexpected dynamics can emerge, it seems difficult to derive precise general conclusions about the effects of bounded-confidence and repulsion acting in tandem. Our study here pointed to one important type of dynamic: assimilative influence based on sufficient initial similarity between agents with bounded confidence can lead to a divergence of opinions between initial subgroups that is large enough to trigger repulsive interactions if there are negative links between these subgroups. Thus, paradoxically, assimilation can result in more repulsion, and stronger bipolarization. Future work is needed to study the robustness of our findings to changes in the size of the populations, the structure of the network, networks with directed rather than undirected ties, and heterogeneity in the agents, further extending studies like (Flache & Mäs 2008; Jager & Amblard 2005).
What is more, theoretical models need to be empirically calibrated and carefully tailored to empirical settings in order to derive valid conclusions about real-life settings. Our findings illustrate that sometimes even small changes in the parameters governing assimilative and repulsive influence can move the simple systems we created into a qualitatively different phase. Accordingly, we echo Flache et al. (2017)’s ((2017)) call for more empirical research on social influence in order to determine the relative strength of the different influence processes and identify conditions that may or may not trigger a particular influence process. This empirical work, however, needs to go hand in hand with modeling work. In a prominent study of Twitter-users, for instance, Bail et al. (2018) found support for repulsive influence, observing that US-users supporting the Republican party grew even more conservative after having been exposed to a bot retweeting liberal content. They conclude that “attempts to introduce people to a broad range of opposing political views on a social media site such as Twitter might be not only be ineffective but counterproductive”. Our modeling findings challenge this conclusion, showing that the observation of repulsive influence does not allow one to draw direct conclusions about the collective opinion dynamics even in very simple settings. Drawing conclusions about real settings as complex as online social networks requires rigorous modeling (Keijzer & Mäs 2022).
Our findings furthermore suggest that modelers of social-influence dynamics should invest more into the systematic integration of competing models. In their review of the state of the modeling literature, Flache et al. (2017) criticized that too often modelers develop their own independent model without comparison to existing models. While we reiterate this call for more model comparison, our findings also show that an integration of potentially competing models into a single framework can be fruitful. We have shown, for instance, that local convergence generated by assimilative influence in conjunction with bounded confidence can create opinion distributions that trigger off repulsion in settings where there was no repulsion initially. Such interactions between model assumptions remain unexplored when models are compared but not integrated. Integrating competing models into a single framework, however, is challenging since models need to remain simple in order to facilitate comprehension of their implications. The highly stylized examples presented here served as tools to demonstrate counter-intuitive effects in a way that one can still understand them. The KISS-principle remains an important guidance for making counter-intuitive findings intuitive. Thus, despite our call for more elaborate models, we stress that modelers should strive for simplicity. Once simple models have been understood, abstraction can be reduced gradually (Flache & de Matos Fernandes 2021; Lindenberg 1992).
Our main message that bounded-confidence models and their extensions still have unexplored and counter-intuitive implications also points to another realm of future research on social-influence dynamics in networks: applications to real opinion dynamics. There is, for instance, public and scholarly debate about opinion dynamics emerging on online social networks and the contribution of so-called “filter bubbles” to opinion bipolarization. Critics of filter bubbles argue that personalization algorithms installed on online-social networks isolate users from content challenging their opinions, which could generate opinion fragmentation (Keijzer & Mäs 2022). A counter-argument adopted, for instance by Facebook-CEO Mark Zuckerberg (2017), is that personalization also leads to less contact between users who disagree and, may therefore prevent repulsive influence between them. Filter bubbles may, thus, actually prevent bipolarization. The intuition underlying these seemingly conflicting lines of thought is that assimilative influence is a force decreasing opinion differences and that repulsive influence fosters bipolarization. Our analyses have shown that this intuition is incomplete and that sometimes the exact opposite may be true. While our analyses are built on engineered and highly unrealistic settings, they show that even in these seemingly trivial settings, dynamics and their outcomes are hard to anticipate based on intuition alone. Elsewhere, we have demonstrated how this finding remains robust when some of the simplistic assumptions we adopted here are relaxed and more complex network structures, larger populations, and randomized initial opinion distributions are applied (Liu et al. 2023). Yet even those models remain highly simplistic compared to real online social networks. Our work thus highlights that it is problematic to base predictions about opinion dynamics in such much larger and even more complex settings on intuition. The literature on social-influence dynamics shows that formalized theories like the bounded-confidence models allow one to rigorously capture the complexity arising from assimilative and repulsive influence. So far, the debate about the design of digital communication technology, like online social networks has not made sufficient use of this methodology and the existing insights from the literature on social influence dynamics that the bounded-confidence models have inspired (Keijzer & Mäs 2021; Waldrop 2021).
Acknowledgements
This work was partly supported by the National Natural Science Foundation of China under Grants 72371052 and 71871042(to HX). SL gratefully acknowledges the financial support provided by the China Scholarship Council (CSC) through the program for public postgraduates of national construction high-level universities (202006060168).MM acknowledges support by the InfoXpand project (031L0300B) funded by the Federal Ministry of Education and Research of Germany and support by the Netherlands Institute for Advanced Studies in the Humanities and Social Sciences (NIAS) and the Lorentz Center for funding the Lorentz-NIAS Theme Group "Social Media for Digital Democracy" that informed this work. AF acknowledges financial support by the Netherlands Organization for Scientific Research (NWO) under the 2018 ORA grant ToRealSim (464.18.112).Appendix A: Opinion trajectories for all phases of Figure 4
Figure 4 shows that the model combining assimilative and repulsive influence generates nine different opinion distributions depending on the values assigned to the parameters \(\epsilon_T\) and \(\epsilon_R\). To demonstrate that increasing the amount of assimilative influence can generate more bipolarization, it was not necessary to discuss all nine phases. Therefore, we show here (see Figure 14) opinion trajectories for each of the nine phases. In Figure 14, the letter identifying a specific subpanel corresponds to the capital letter assigned to the respective phase shown in Figure 4.
The trajectories shown in Panels g, c, d, and i of Figure 14 have been discussed in the main text (Figure 3) and are not addressed here again. Panel f is the least interesting phase, as there are no opinion dynamics in this phase. This is because \(\epsilon_T\) is too small to allow assimilative influence and \(\epsilon_R\) is too high to activate repulsive influence.
The opinion trajectories shown in Panel a are also characterized by very limited changes, because the very low value assigned to \(\epsilon_T\) and the initial opinions of the agents imply that there is no assimilative influence. However, \(\epsilon_R\) is sufficiently low to activate repulsive influence between agents \(A\) and \(J\). These two agents, as a consequence, adopt maximally extreme opinions. In Panel b’s run, there is more assimilative influence than in the run shown in Panel a, which leads to the formation of two homogeneous clusters. Agents \(A\) and \(J\), however, adopt also in this run maximally extreme opinions. The run of Panel h is characterized by a sufficiently strong assimilative influence to generate local opinion convergence and the formation of two subgroups. Repulsive influence between agents \(A\) and \(J\) in not activated due to the high value of parameter \(\epsilon_R\).
A surprising opinion distribution emerges in the run shown in Panel e. Here, there is strong assimilative and strong repulsive influence. The outcome is a uniform opinion distribution with one agent at each pole of the scale and the remaining agents forming a chain connecting the two extremists. This so-called multiplex equilibrium (Flache & Mäs 2008) emerges because repulsive influence makes agents \(A\) and \(J\) adopt extreme opinions. Each of them, however, also exerts assimilative social influence on their respective friend (agents \(B\) and \(I\)). Furthermore, assimilative influence is so strong, that the assimilative social influence between agents connected by a positive link is never deactivated. The result is that agents with only positive links are always pulled with equal force into two opposite directions and, as a consequence, do not change opinions.
Appendix B: Opinion trajectories for all phases of Figure 7
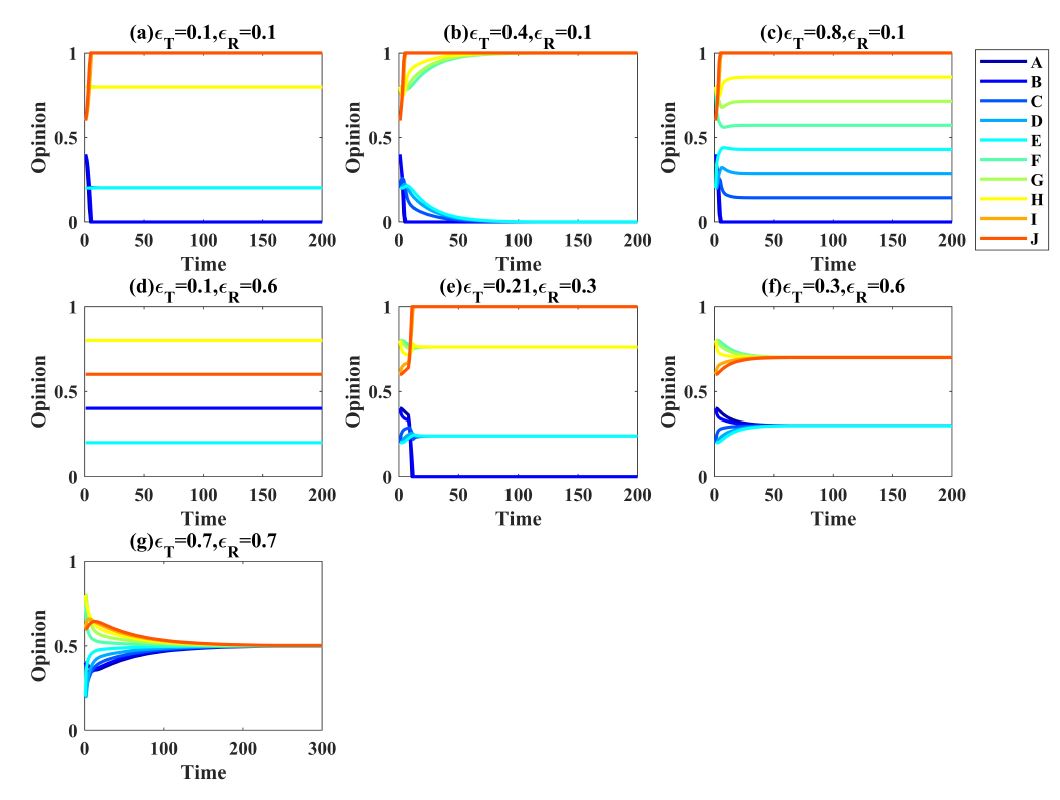
Figure 7 from the main text shows that the model combining assimilative and repulsive influence generates seven different phases when applied to the network shown in Figure 5. In Figure 15, we show typical opinion trajectories for all phases. Phases B, C, and F are described in the main text. Here, we describe the remaining phases.
Panel a shows a typical run under very weak assimilative influence and very strong repulsive influence. The latter implies that the negative link between Agents \(A\) and \(J\) is activated and that the two agents adopt extreme opinions. The very restricted assimilative influence, however, implies that for no pair of agents, opinion distance is small enough to activate assimilative influence. As a consequence, Agents \(B\) to \(I\) never adjust their opinions.
Panel d shows another example of the dynamic where agents \(A\) and \(J\) adopt maximally extreme and opposite opinions and the remaining agents adopt opinions forming a chain between the two extremists. Like in the run of Panel e in Figure 14, this outcome emerges because there repulsive influence between agents \(A\) and \(J\) is activated from the beginning on and because assimilative influence is always active on all positive links.
Panel e represents a phase where agents do not change opinions, because both assimilative and repulsive influence is too weak and actually never activated. Finally, Panel d shows typical dynamics when repulsive influence is weak and never activated, but assimilative influence is very strong. The result is perfect consensus.
Appendix C: Opinion trajectories for all phases of Figure 10
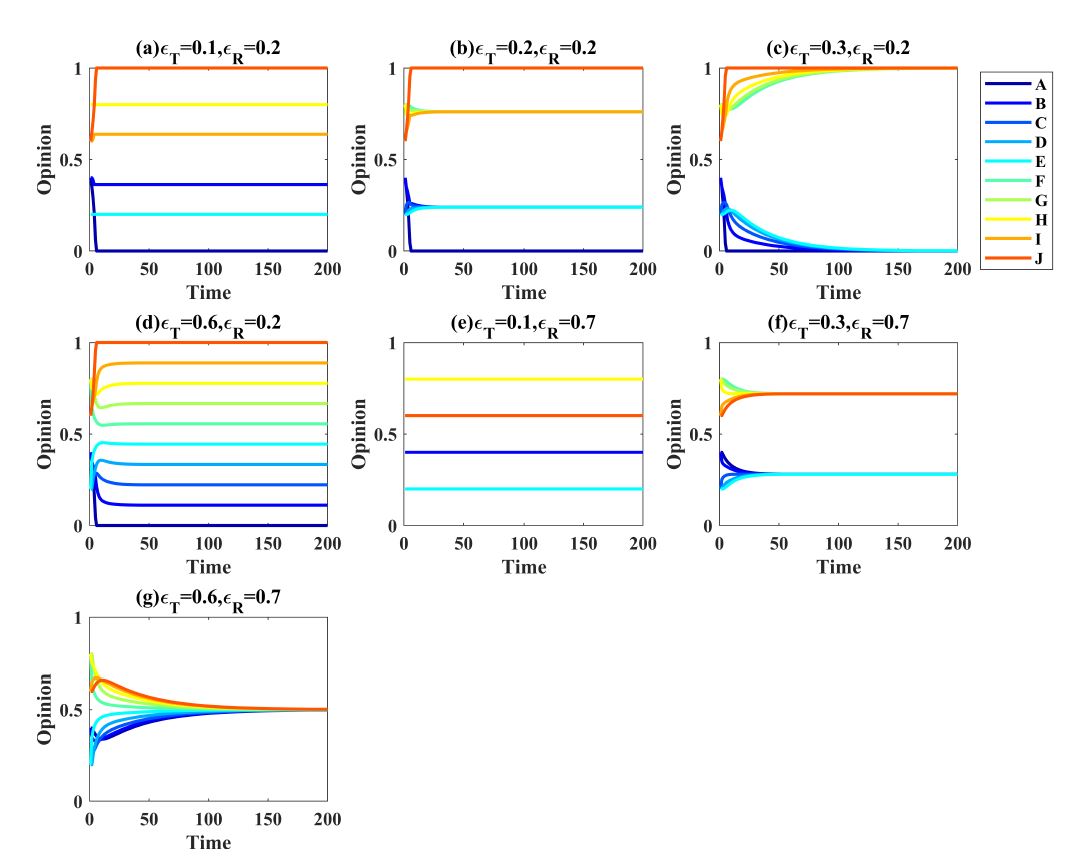
Figure 10 from the main text shows that the model combining assimilative and repulsive influence generates seven phases when assuming the network and initial opinions shown in Panel b of Figure 8. Here, we show in Figure 16 opinion trajectories for each phase. Phase E has been discussed in the main text already. The remaining phases are described here.
Panel a is representative for runs with highly restricted assimilative influence and strong repulsive influence. Agents \(A\) and \(B\), on the one hand, and agents \(I\) and \(J\) are negatively influenced by their negative network contacts. As a consequence, all four agents adopt extreme opinions. The remaining agents never change opinions, because of the very restricted assimilative influence, which is never activated.
The dynamics shown in Panel b end in maximal bipolarization. Also in this run, the very strong repulsive influence leads \(A\) and \(B\), as well as \(I\) and \(J\) to adopt extreme views. Unlike in Panel a, however, assimilative influence is also very strong. As a consequence, agents \(C\) to \(H\) join the extremists belonging to their respective subgroup.
Panel c is representative for runs where assimilative influence is even stronger. Now, there is even influence between agents \(E\) and \(F\). Since \(A\) and \(B\), as well as \(I\) and \(J\) again adopt extreme opinions, and all positive links result in assimilative influence, we observe an equilibrium with two agents on each pole of the scale and the remaining agents adopting opinions forming a chain connecting the poles.
Panel d shows a typical dynamic when both repulsive and assimilative influence is too restricted. There are no opinion changes.
Panel f is representative for parameter combinations with weak repulsive influence and moderate assimilative influence. The assimilative influence is sufficiently strong to generate local opinion convergence but too weak to foster global consensus. Repulsive influence is never activated.
Panel g shows a run where there is no repulsion but very strong assimilative influence. The result is a perfect consensus.
Appendix D: Opinion trajectories for all phases of Figure 13
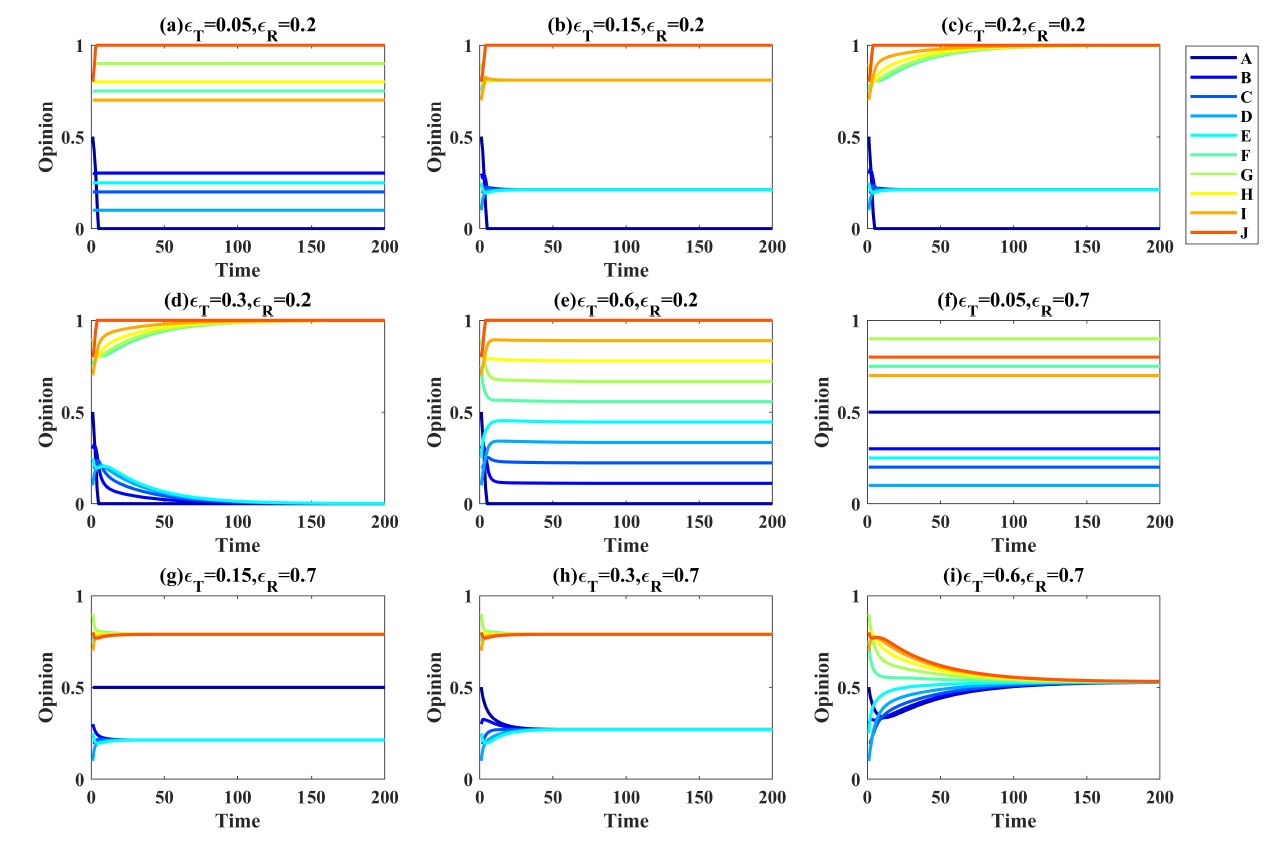
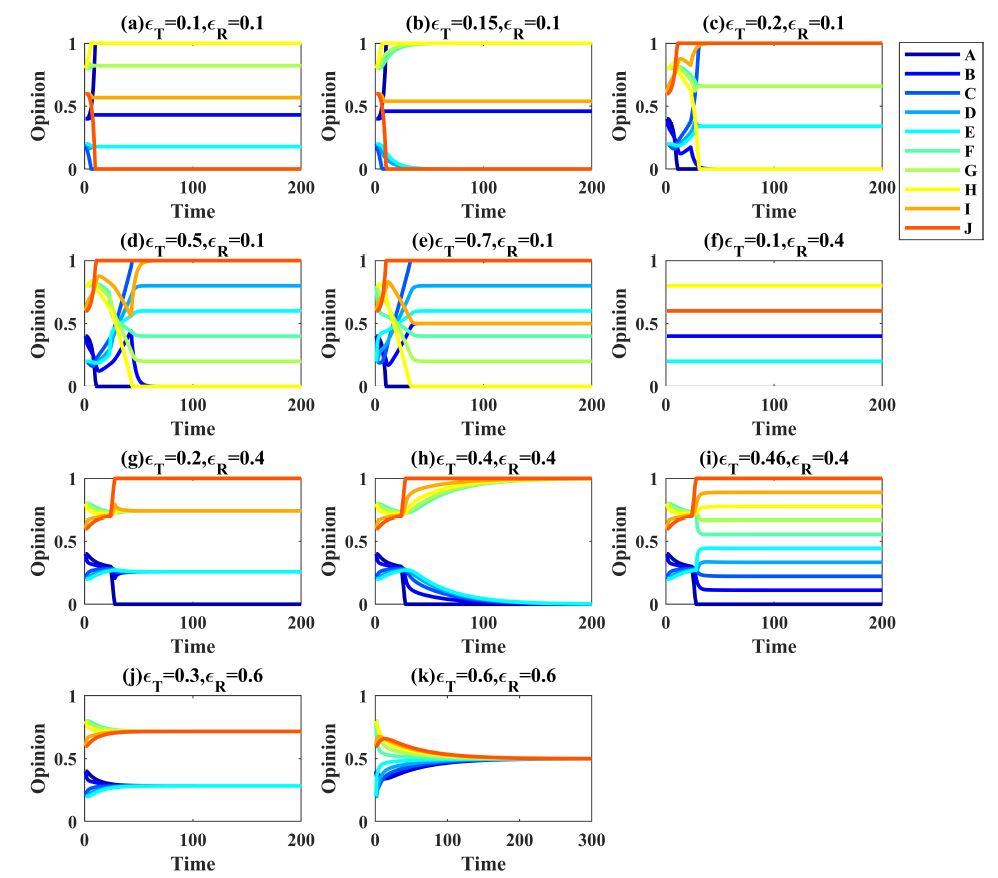
Figure 13 from the main text shows that the model combining assimilative and repulsive influence generates eleven phases when assuming the network and initial opinions shown in Panel b of Figure 11. Here, we show in Figure 17 opinion trajectories for each phase.
The run shown in Panel a represents the combination of weak assimilative influence and strong repulsion. Agents \(A\) and \(J\), the two agents who connect the two subgroups with a negative link, do not change their opinions initially, because repulsive influence exerted on them by their two negative links push them into opposite directions. Agents \(C\) and \(H\), however, are pushed by \(A\) and \(J\) towards the poles of the opinion scale. The closer they come to the respective pole the stronger the push on \(A\) and \(J\) and the faster the two will move to opposite pole. This is a dynamic we have not observed before. The two agents who connected the two subgroups with a negative link that often causes bipolarization are adopting opinions on the pole opposite to opinions of their initial subgroup. The remaining agents hardly change opinions because of the weak assimilative influence.
The phase represented by Panel b is similar to the phase of Panel a, but assimilative influence is slightly stronger. The dynamics are similar to the run from Panel a, with the exception that agents \(D\) and \(E\), and \(F\) and \(G\) are adopting extreme opinions, because the assimilative influence exerted by \(C\) and \(I\) is sufficiently strong.
Panel c shows a run from the same phase as the run shown in Panel b of Figure 12 from the main text. The only difference is that, unlike in the run presented in the main text, the four agents with non-extreme opinions develop a local consensus on a moderate position. This happens because assimilative influence is slightly higher. We assigned the two runs to the same phase because in equilibrium the difference in bipolarization is very small, as Figure 13 reveals.
Panel d is similar to the Panel c. The central difference is that assimilative influence is so strong that the positive link between agents \(E\) and \(F\) is activated while they are indirectly dragged towards more moderate opinions by \(C\) and \(H\). As a consequence, they prevent \(D\) and \(G\) from developing more extreme opinions. The end result is an opinion distribution with three agents on each pole and four agents forming a chain connecting the poles.
Panel e represents runs with an even stronger assimilative influence. The dynamics are very similar as the ones shown in Panel d with one exception. Agents \(B\) and \(I\), the two agents with positive links to the subgroup members connected by a negative link are more influenced by both actors. In Panel d, \(B\) and \(I\) joined one of their neighbors when the other grew too dissimilar. With the stronger assimilative influence, \(B\) and \(I\) now remain influenced by both neighbors and adopt opinions in the center of the opinion scale, being pulled with equal strength in opposite directions.
The phase represented by Panel f is characterized by too weak assimilative influence and too weak repulsion to generate any opinion changes. Increasing assimilative influence (see Panel g), generates local convergence and the emergence of two subgroups. Again, one can observe how assimilative influence implies that opinion differences between agents \(A\) and \(J\) grow and at some moment exceed the repulsion threshold. As a consequence \(A\) and \(J\) adopt maximally extreme opinions.
When assimilative influence is further increased, dynamics illustrated in Panel h emerge. These dynamics are actually very similar to the ones from Panel g. However, the increased assimilative influence implies that the two subgroups are joining the two extremists. This is a replication of the first counter-intuitive finding: sometimes more assimilative influence generates stronger bipolarization.
To generate the run shown in Panel i, assimilative influence was further increased. At the beginning, dynamics are similar to those in Panels g and h: local convergence generates two clusters. Plus, repulsive influence between agents \(A\) and \(J\) leads them to adopt maximally extreme opinions. However, unlike in the other two panels, dynamics lead again to the equilibrium where the remaining agents form a chain connecting the two extremists. This happens because the local convergence also decreased the opinion differences between agents \(E\) and \(F\). Since, assimilative influence is stronger than before, the two agents start influencing each other and adopt more similar opinions. Since they exert assimilative influence on \(D\) and \(G\), the population fans out and and covers the complete opinion scale.
The phase represented by Panel j is characterized by moderate assimilative influence and very weak repulsion. The consequence is local convergence into two groups that differ too much to generate consensus. In Panel k is generated when assimilative influence is very strong and repulsion weak. This generates perfect consensus.
References
ABELSON, R. P. (1964). Mathematical models of the distribution of attitudes under controversy. In N. Frederiksen & H. Gulliksen (Eds.), Contributions to Mathematical Psychology (pp. 141–160). New York, NY: Holt, Reinehart; Winston.
BAIL, C. A., Argyle, L. P., Brown, T. W., Bumpus, J. P., Chen, H., Hunzaker, M. F., Lee, J., Mann, M., Merhout, F., & Volfovsky, A. (2018). Exposure to opposing views on social media can increase political polarization. Proceedings of the National Academy of Sciences, 115(37), 9216–9221. [doi:10.1073/pnas.1804840115]
DEFFUANT, G. (2006). Comparing extremism propagation patterns in continuous opinion models. Journal of Artificial Societies and Social Simulation, 9(3), 8.
DEFFUANT, G., Neau, D., Amblard, F., & Weisbuch, G. (2000). Mixing beliefs among interacting agents. Advances in Complex Systems, 03(01n04), 87–98. [doi:10.1142/s0219525900000078]
FINKEL, E. J., Eastwick, P. W., Karney, B. R., Reis, H. T., & Sprecher, S. (2012). Online dating: A critical analysis from the perspective of psychological science. Psychological Science in the Public Interest, 13(1), 3–66. [doi:10.1177/1529100612436522]
FLACHE, A., & de Matos Fernandes, C. A. (2021). Agent-based computational models. In G. Manzo (Ed.), Research Handbook on Analytical Sociology (pp. 453–473). Cheltenham, UK: Edward Elgar. [doi:10.4337/9781789906851.00033]
FLACHE, A., & Mäs, M. (2008). How to get the timing right. A computational model of the effects of the timing of contacts on team cohesion in demographically diverse teams. Computational and Mathematical Organization Theory, 14(1), 23–51. [doi:10.1007/s10588-008-9019-1]
FLACHE, A., Mäs, M., Feliciani, T., Chattoe-Brown, E., Deffuant, G., Huet, S., & Lorenz, J. (2017). Models of social influence: Towards the next frontiers. Journal of Artificial Societies and Social Simulation, 20(4), 2. [doi:10.18564/jasss.3521]
HEGSELMANN, R. (2020). Polarization and radicalization in the bounded confidence model: A computer-Aided speculation. In V. Buskens, R. Corten, & C. Snijders (Eds.), Advances in the Sociology of Trust and Cooperation: Theory, Experiment, and Field Studies (pp. 199–228). Berlin: De Gruyter. [doi:10.1515/9783110647495-009]
HEGSELMANN, R., & Krause, U. (2002). Opinion dynamics and bounded confidence models, analysis and simulation. Journal of Artificial Societies and Social Simulation, 5(3), 2.
HEGSELMANN, R., & Krause, U. (2015). Opinion dynamics under the influence of radical groups, charismatic leaders, and other constant signals: A simple unifying model. Networks & Heterogeneous Media, 10(3), 477–509. [doi:10.3934/nhm.2015.10.477]
IYENGAR, S., Lelkes, Y., Levendusky, M., Malhotra, N., & Westwood, S. J. (2019). The origins and consequences of affective polarization in the United States. Annual Review of Political Science, 22(1), 129–146. [doi:10.1146/annurev-polisci-051117-073034]
JAGER, W., & Amblard, F. (2005). Uniformity, bipolarization and pluriformity captured as generic stylized behavior with an agent-based simulation model of attitude change. Computational & Mathematical Organization Theory, 10(4), 295–303. [doi:10.1007/s10588-005-6282-2]
KEIJZER, M. (2022). Opinion dynamics in online social media. PhD Thesis, University of Groningen. Available at: https://doi.org/10.33612/diss.196882523
KEIJZER, M. A., & Mäs, M. (2021). The strength of weak bots. Online Social Networks and Media, 21, 100106. [doi:10.1016/j.osnem.2020.100106]
KEIJZER, M. A., & Mäs, M. (2022). The complex link between filter bubbles and opinion polarization. Data Science, 5(2), 139–166. https://content.iospress.com/articles/data-science/ds220054 [doi:10.3233/ds-220054]
KEIJZER, M. A., Mäs, M., & Flache, A. (2018). Communication in online social networks fosters cultural isolation. Complexity, 2018, 9502872. [doi:10.1155/2018/9502872]
KOZITSIN, I. V. (2023). Opinion dynamics of online social network users: A micro-level analysis. The Journal of Mathematical Sociology, 47(1), 1–41. [doi:10.1080/0022250x.2021.1956917]
KRAUSE, U. (2000). A discrete nonlinear and non-autonomous model of consensus formation. In S. Elaydi, J. Popenda, & J. Rakowski (Eds.), Communications in Difference Equations: Proceedings of the Fourth International Conference on Difference Equations (pp. 227–236). Amsterdam: CRC Press.
KURAHASHI-NAKAMURA, T., Mäs, M., & Lorenz, J. (2016). Robust clustering in generalized bounded confidence models. Journal of Artificial Societies and Social Simulation, 19(4), 7. [doi:10.18564/jasss.3220]
LEVIN, S. A., Milner, H. V., & Perrings, C. (2021). The dynamics of political polarization. Proceedings of the National Academy of Sciences, 118(50), e2116950118. [doi:10.1073/pnas.2116950118]
LINDENBERG, S. (1992). The method of decreasing abstraction. In J. S. Coleman & T. J. Fararo (Eds.), Rational Choice Theory: Advocacy and Critique (pp. 3–20). Thousand Oaks, CA: Sage.
LIU, C. C., & Srivastava, S. B. (2015). Pulling closer and moving apart: Interaction, identity, and influence in the U.S. senate, 1973 to 2009. American Sociological Review, 80(1), 192–217. [doi:10.1177/0003122414564182]
LIU, S., Mäs, M., Haoxiang, X., & Flache, A. (2023). When intuition fails: The complex effects of assimilative and repulsive influence on opinion polarization. Advances in Complex Systems, 25(08), 2250011. [doi:10.1142/s0219525922500114]
LORENZ, J. (2006). Consensus strikes back in the Hegselmann-Krause model of continuous opinion dynamics under bounded confidence. Journal of Artificial Societies and Social Simulation, 9(1), 8.
MACY, M. W., Kitts, J. A., Flache, A., & Benard, S. (2003). Polarization in dynamic networks: A Hopfield model of emergent structure. In R. Breiger, K. Carley, & P. Pattison (Eds.), Dynamic Social Network Modeling and Analysis: Workshop Summary and Papers (pp. 163–173). Washington, DC: The National Academies Press.
MATHIAS, J.-D., Huet, S., & Deffuant, G. (2016). Bounded confidence model with fixed uncertainties and extremists: The opinions can keep fluctuating indefinitely. Journal of Artificial Societies and Social Simulation, 19(1), 6. [doi:10.18564/jasss.2967]
TAKÁCS, K., Flache, A., & Mäs, M. (2016). Discrepancy and disliking do not induce negative opinion shifts. PloS One, 11(6), e0157948.
WALDROP, M. M. (2021). Modeling the power of polarization. Proceedings of the National Academy of Sciences, 118(37), e2114484118.
ZUCKERBERG, M. (2017). Building global community. Available at: https://www.facebook.com/notes/mark-zuckerberg/building-global-community/10154544292806634