An Agent-Based Model of Cultural Change for a Low-Carbon Transition

,
and
aInstitute of Environmental Science and Technology, Universitat Autònoma de Barcelona, Spain; bESCP Business School, Spain
Journal of Artificial
Societies and Social Simulation 27 (1) 13![]()
<https://www.jasss.org/27/1/13.html>
DOI: 10.18564/jasss.5291
Received: 27-Feb-2023 Accepted: 08-Nov-2023 Published: 31-Jan-2024
Abstract
Meeting climate goals requires radical changes in the consumption behaviour of individuals. This necessitates an understanding of how the diffusion of low-carbon behaviour will occur. The speed and interdependency of these changes in behavioural choices may be modulated by individuals’ culture. We develop an agent-based model to study how behavioural decarbonisation interacts with longer-term cultural change, composed of individuals with multiple behaviours that evolve due to imperfect social learning in a social network. Using the definition of culture as socially transmitted information, we represent individuals’ environmental identity as an aggregation of attitudes towards multiple relevant behaviours. The strength of interaction between individuals is determined by the similarity in their environmental identity, leading to inter-behavioural dependency and spillovers in green attitudes. Our results show that the initial distribution of agent attitudes towards behaviours and asymmetries in social learning, such as confirmation bias, are the main drivers of model dynamics, helping to generate awareness of what roadblocks may appear to deep decarbonisation. To assess the impact of culture beyond a purely diffusive regime, we introduce green influencers as a minority of individuals who broadcast a green attitude. The greatest emissions reduction is achieved with the inclusion of culture, relative to a behavioural independence case, and with low confirmation bias. However, green influencers fail to achieve deep behavioural decarbonisation through solely voluntary action. We identify areas for further research regarding how culture, through inter-behavioural dependence, may be leveraged for climate policy.Introduction
The behavioural choices that compose an individual’s lifestyle can greatly affect their carbon footprint (Wynes & Nicholas 2017). Therefore, changes in individual consumption form an important part of reducing global greenhouse gas emissions. Theoretical models of behavioural change can provide insight into what barriers and drivers exist to the adoption of low-carbon lifestyles (Niamir et al. 2020). A crucial element in the study of a transition towards low-carbon lifestyles is how quickly behaviours in a population, and even culture itself, will change. A good understanding of the relation between culture and behaviours can help to avoid potential lock-in toward brown alternatives (Buenstorf & Cordes 2008; Burton & Farstad 2020). Especially of interest is building an awareness of what cultural barriers may appear due to said interaction (Carattini et al. 2018).
Models of opinion dynamics can give insight into associated processes of polarization versus consensus formation (Deffuant et al. 2002), and transitions between these regimes (Castellano et al. 2000; Helfmann et al. 2021). The descriptive power of these models can be further enhanced through the inclusion of frameworks such as cultural evolution. This is particularly true for the role of repeated social learning amongst direct, oblique and peer connections in a social network and of biased transmission of behaviours. The first and second cases represent the influence of overlapping generations, whilst the second and third reflect the impact of non-direct-blood relations, such as with wider members of a community.
The application of cultural evolution to the issue of transition studies is a nascent area of research (Buenstorf & Cordes 2008; Davis et al. 2018; Kaaronen & Strelkovskii 2020). It lacks detail on the spread of multiple traits simultaneously over the same population. A multi-dimensional perspective is important due to the breadth of lifestyle changes required for deep decarbonisation. For example, Andersson & Nässén (2023) give empirical evidence for positive spillovers between intra-personal behaviours such as choosing to not fly, not owning a car, following a vegan diet, and not owning a semi-detached house. However not all environmentally related behaviours are equally subject to social influence. Furthermore, this multi-dimensional approach centres the role of inter-behaviour spill-overs in adoption dynamics, where the uptake of one green behaviour may lead to a self-perception of a greater green identity (Lacasse 2016), with a stronger environmental identity making pro-environmental behaviour more probable (van der Werff et al. 2014).
Our primary research question is: how does pro-environmental diffusion of behaviour interact with longer-term cultural evolution on a path to a low-carbon economy? We address this through answering three sub-questions: Firstly, how do culture and behavioural diffusion interact? Secondly, what is the longer-term impact of cultural change? Thirdly, what are the mechanisms behind behavioural decarbonisation? To study social interactions, which include bounded rationality of individuals, the use of agent-based models (ABM) is appropriate (Castro et al. 2020; Railsback & Grimm 2019; Savin et al. 2023). Agents have internal properties as well as rules of interaction. These models reproduce complex behaviour from local microeconomic interactions (Epstein & Axtell 1996), which allows for the simulation of a wide variety of phenomena (Kaaronen & Strelkovskii 2020; Kraan et al. 2019; Rai & Robinson 2015; Waring et al. 2015) including the diffusion of cultural traits in a population (Axelrod 1997). Thus, ABMs lend themselves well to the study of cultural and behavioural change as these processes occur through the progressive accumulation of social interactions.
Cultural Change and Identity
Definitions of culture are almost as wide-ranging as the heterogeneity found in the culture itself. To produce an informative model of lifestyle change we require an instrumental and easily interpretable definition of culture. A core element of many definitions is social spreading, with Durham (1991) describing culture as a “system of symbolically encoded conceptual phenomena that are socially and historically transmitted within and between populations”. Similarly, evolutionary (Boyd & Richerson 1988; Henrich & McElreath 2003; Mesoudi 2016), economic (Bezin 2019; Bisin & Verdier 2001) or physics-based models (Axelrod 1997; Epstein & Axtell 1996; Kuperman 2006) represent culture as an abstract property or trait of an individual which can spread in a population. Whilst this definition may lack consideration of factors such as geographic location (Gupta & Ferguson 1992) and how the micro-process of cultural transmission occurs (Kashima 2008), it narrows the scope of what interactions, information or objects may be considered as culture.
Culture can provide the framework within which “strategies to respond to problems are devised and implemented” (Adger et al. 2013). This response component is especially of interest when considering solutions to the climate crisis. Information bubble filters (Geschke et al. 2019) or false consensus biases (Drews et al. 2022) can affect to whom, and what, individuals pay attention. This can slow down social tipping processes if there is a disconnect between the understood and real consequences of current pro-environmental behaviours (Wynes & Nicholas 2017). Due to these biases, there may be heterogeneity in the quantity of information and length of exposure individuals require to change course concerning their environmental identity. This resistance to respond to new stimuli can be conceived of as cultural inertia. These preferences may change much more slowly over time thereby limiting the effectiveness of climate policy (Davis et al. 2018), achieving only shallow decarbonisation.
To study the impact of culture on an individual’s behaviour we require a model of how their culture changes over time. Cultural evolution is a Darwinian process explaining how long-term population-level changes in culture occur (Boyd & Richerson 1988). It is constructed from three components: variation, fitness and inheritance. Cultural traits such as words and ideas exhibit variation (principle of variation). These in turn have differing rates of reproduction or transmission depending on the environment (principle of fitness). Finally, the traits present in a population provide a pool from which new generations can learn. As a result of social learning, there is a correlation between historical cultural traits and those of the next generation (principle of inheritance). Social learning refers to knowledge acquisition through the involvement of others, e.g., imitation (Mesoudi 2016).
Existing computational models of cultural evolution can describe the spread of a single cultural trait (Boyd & Richerson 1988; Henrich 2001; Kaaronen & Strelkovskii 2020), where an agent’s cultural parameter may change through individual and social learning, as well as through interactions with cultural niche infrastructure. Alternatively, the non-cultural-evolutionary model of Epstein & Axtell (1996) represents a “cultural chromosome” in the form of a set-length binary string called a cultural tag. This multi-dimensional tag represents a set of cultural attributes that an agent possesses. Here agents belong to one of two cultural groups depending on the majority of either 1s or 0s in the cultural tag. It is important to note that there is no consideration of where in the string these digits lie, only the quantity of each value matters. Thus two agents may belong to the same cultural group with a very distinct set of cultural attributes. Furthermore, Axelrod (1997) assigns culture as “the set of individual attributes that are subject to social influence”. Here, agents are limited with whom they can interact based on a vector of cultural features, each feature having a set of possible discrete values.
To produce a more specific and verifiable model of cultural change we further narrow our focus to studying the change of identities relevant to environmental behaviours. The background of an individual’s environmental identity can affect the decisions made regarding whether to engage or not, in certain behaviours (van der Werff et al. 2013). Identities are independent of the behavioural outcomes of an individual’s decision-making process. Instead, they are self-defining, such that two agents may behave very differently but may identify themselves with the same group if they hold the same attitude towards said behaviours (Smaldino 2019).
When considering several related behaviours, we take the approximation that identity is an outgrowth of culture (Grimson 2010). This reduces the scope of what is necessary to consider when modelling the dynamics of culture and limits the generality of our model as it only applies in conditions of proximity between behaviours when one might expect a person to be acting under the same identity. Additionally, this approximation facilitates the comparison and use of empirical data regarding environmental identities and attitudes, such as in Nigbur et al. (2010). In contrast, validation and parameterisation of a purely cultural model would require more abstract data which would be harder to measure given the broader scope of the subject. Identities are not fixed and may change due to different contexts and evolution over time (Fielding & Hornsey 2016). Additionally, individuals cannot express their full identities in social interactions as these are too rich; only certain subsets are represented, depending on the social context and interaction setting (Smaldino 2019). We do not attempt to model how changing environments and decisions can cause particular identities to dominate in a behavioural decision process. Instead, we fix the context by only considering environmentally related behaviours, such as deciding to reduce home energy use or whether to install domestic solar panels. This highlights the influence of several behaviours on an individual’s environmental identity.
Model Components
General structure of the model
To address our research questions, we produce an ABM of changes in individuals’ lifestyles by considering their evolving behavioural choices. The model structure is shown in Figure 1. Individuals have a set of environmental behavioural traits that spread through a fixed Watts–Strogatz graph via social interactions with their ego-network. These exchanges are mediated by transmission biases informing from whom an individual learns and how much attention is paid. The influence of individuals on each other is a function of their similarity in environmental identity, where we represent environmental identity computationally by aggregating past agent attitudes towards multiple environmentally related behaviours. To perform a behaviour, agents must both have a sufficiently positive attitude toward a behaviour and overcome a corresponding threshold. This threshold structure, where the desire to perform a behaviour does not equal its enactment, allows for a lack of coherence between attitudes and actual emissions. This leads to a disconnect between what people believe and what they do, such that the social network as whole desires greener behaviours but only a minority performs them. Subsequently, we outline the justification and assumptions underlying model components.
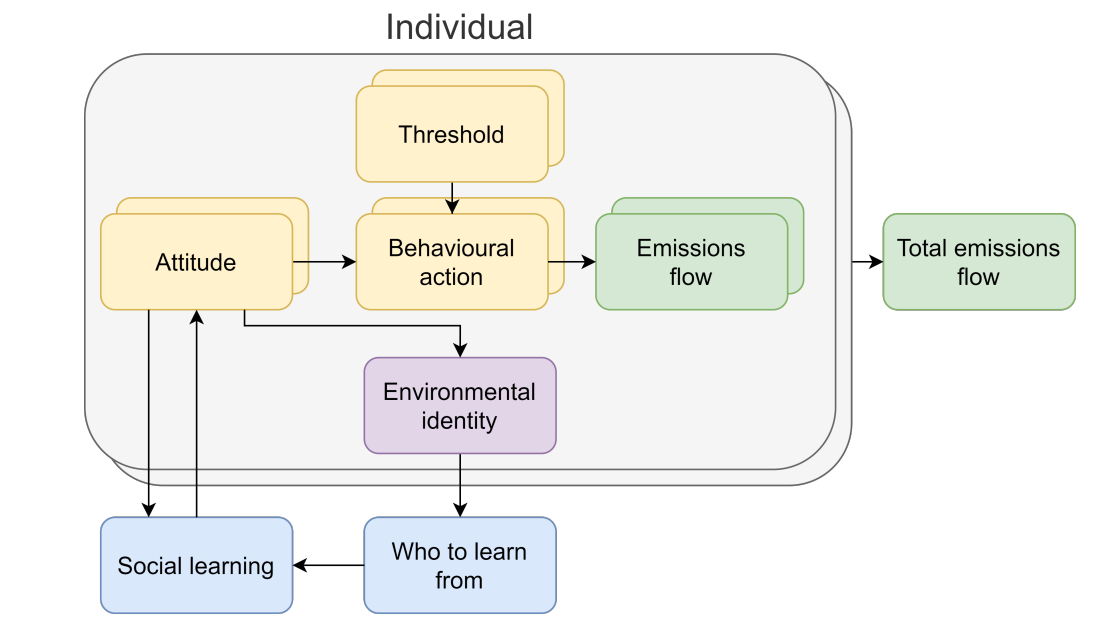
To evaluate the impact of individual decisions on overall emissions we require a measure of whether individuals act on their intentions and opinions towards “greener” behavioural alternatives. This process is represented in the yellow containers in Figure 1. An intention or favourable attitude towards a behavioural option is not sufficient; one must also have the means or control to do so according to the Theory of Planned Behaviour (TPB) (Ajzen 1991). This theory may be used to study motivations behind pro-environmental social behaviours, such as in Nigbur et al. (2010) which empirically investigates participation in recycling programmes. Alternatively, Niamir et al. (2018) use the TPB within an empirically based ABM, where agents must overcome several barriers along the road to undertaking one of three possible pro-environmental behaviours.
Taking inspiration from the TPB, we model the extent to or frequency with which a behaviour is performed as a balance between a socially influenced behavioural attitude against a static threshold. Each behaviour is represented as a one-dimensional continuous parameter between extremes of a zero-emissions green choice and maximally emissive brown reference. Individuals \(n = \{1,...,N\}\), each have multiple environmentally relevant behaviours \(m = \{1,...,M\}\) that evolve over discrete generic time \(t\). These behaviours represent abstract environmentally related actions such as the decision to install solar energy panels, whether to choose a brown or green energy provider, cycling to work but only if weather conditions are suitable or flying less but not entirely stopping. For each behaviour \(m\), the continuous value \(B_{t,n,m} \in [-1,1]\) is an index that represents the extent to which or frequency with which a behaviour is performed. Modelling this way is a compromise between representing the detail of context-dependent behavioural decisions and maintaining an abstract generality of the behaviours chosen. Put explicitly, the behavioural value \(B_{t,n,m}\) is determined by two continuous variables: the individual’s attitude \(A_{t,n,m} \in [0,1]\) towards the behaviour and the threshold or barrier of entry for performing a behaviour \(T_{n,m} \in [0,1]\). A value of \(A_{t,n,m} = 1\) is the “greenest” attitude and \(A_{t,n,m} = 0\) the “brownest” or most indifferent to environmental impacts, and similarly \(T_{n,m} = 1\) is the highest barrier of entry and \(T_{n,m} = 0\) the lowest. Therefore the behavioural value \(B_{t,n,m}\) is given by
| \[ B_{t,n,m} = A_{t,n,m} - T_{n,m},\] | \[(1)\] |
The total emissions \(E_{t}\) produced by the population of size \(N\) is given by the summation over each of the multiple behaviours performed by each individual,
| \[ E_{t} = \sum\limits^{N}_{n = 1} \sum\limits^{M}_{m = 1} \frac{1 - B_{t,n,m}}{2},\] | \[(2)\] |
A dynamic model of culture using environmental identity
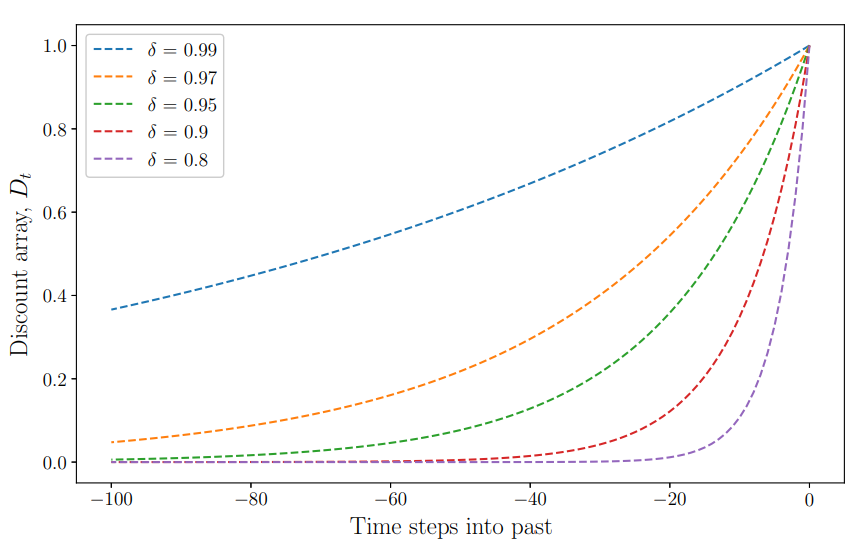
We represent three key aspects of identity. Firstly the slower, longer-term change process of environmental identity driven by a faster behavioural diffusion process, secondly, the central role of socially transmitted information and finally the cyclic, self-defining, nature of identity. Concerning this third point, agent identity is defined not through the behaviours an agent performs but instead through their opinion or attitude toward said behaviours. This self-defining process is highlighted in the lower loop of Figure 1. Here, we create bidirectional causal relations between agent attitudes and identity (Schaller & Muthukrishna 2021) such that identity “becomes what the constituting agents make it to be” (Fáth & Sarvary 2005). However, these attitudes towards environmentally related behaviours are themselves determined through social information exchanges, so that we conform to the definition previously laid out. Furthermore, the longer-term change process is captured through a weighted average of previous behavioural attitudes. How far this moving average reaches back in time is determined by a cultural inertia parameter, with a greater value meaning agents are influenced by past opinions for a longer time (Konc et al. 2022). The weighting is given by a hyperbolic discounting factor (Laibson 1997; Loewenstein & Prelec 1992; Yi et al. 2006), such that current identities are influenced by recent history with diminishing importance the further back in time is considered.
We adapt the cultural chromosome proposed by Epstein & Axtell (1996) considering multiple continuous attitudes towards related environmental behaviours that determine a single identity variable. We distinguish ourselves from single-parameter diffusion models by adding internal dynamics to our identity parameter through this mean behavioural attitude. Therefore identity is represented as an aggregate of all behavioural attitudes of an individual over time with a discount factor putting greater value on more recent behavioural attitudes. In particular we define the environmental identity \(I_{n}\) of agent \(n\) at time \(t\) as:
| \[ I_{t,n} = \Biggr[\frac{1}{\sum\limits^{\rho}_{s = 0}\delta^{s}} \Biggr] \sum\limits^{\rho}_{s = 0}\delta^{s}\bar{A}_{t - s,n},\] | \[(3)\] |
| \[ \bar{A}_{t,n} = \frac{1}{M}\sum\limits^{M}_{m= 1}A_{t,n,m},\] | \[(4)\] |
Information diffusion through imperfect imitation
Interactions within a social network play a greater role in changing attitudes towards more socially susceptible behaviours that contribute to conspicuous consumption. For example, the domestic installation of solar panels has been shown to increase the likelihood of adoption by others in neighbourhoods (Baranzini et al. 2017; Bollinger & Gillingham 2012; Carattini et al. 2018; Rai & Robinson 2015). On the other hand, behaviours that are less socially susceptible, such as reductions in domestic energy use, may be harder to influence through social interactions alone. However, even these behaviours may be nudged in a “greener” direction through the introduction of descriptive and injunctive social norms (Davis et al. 2018; Schultz et al. 2007). The attitude of individuals towards \(M\) behaviours, which each differ in social susceptibility \(\phi_m\), varies according to their past attitudes and the social influence of their ego-network. This means individuals form an attitude towards a given behaviour through a cumulative process of repeated social interactions. The evolution of individuals’ attitudes is given by:
| \[ A_{t+1,n,m} = [1 - \phi_{m}]A_{t,n,m} + [\phi_{m}]S_{t,n,m},\] | \[(5)\] |
In forming opinions the influence of our ego-network is paramount as often one cannot rely on one’s judgement solely. Opinion dynamics models aim to explain how the attitude of an individual within a group may evolve through social interaction where opinions are exchanged. In constructing an equation for social dynamics of behavioural attitudes, we consider literature from non-Bayesian opinion dynamics models using finite social networks. For a detailed literature review of social influence and opinion dynamics models see Mason et al. (2007), Castellano et al. (2009), Acemoglu & Ozdaglar (2011) and Grabisch & Rusinowska (2020).
Now we formally elaborate on the blue components in Figure 1 to model the influence of social learning on individuals’ attitudes towards environmentally relevant behaviours. A key distinction between models is whether they use continuous or binary opinion parameters. Moreover, the issue of whether a single opinion or a high-dimensional vector of opinions is considered may also be used to draw lines of division. For example, Schelling (1969) and Granovetter (1978) are pre-eminent cases of binary single opinion models that, whilst consisting of simple inter-agent rules of interaction, describe complex social phenomena. On the other hand, DeGroot (1974) uses a continuous opinion for each agent which is updated in discrete time steps using a mean of all other agents.
We implement a multi-dimensional continuous model inspired by DeGroot (1974) to represent social learning in our model, with a weighted mean to aggregate the impact of each agent’s ego-network. To model the imperfection of social transmission we add a Gaussian error \(\varepsilon = G(0,\sigma^2_{\varepsilon})\). A separate transmission error is applied to each of the \(M\) behaviours after an individual has aggregated the attitudes of their ego-network. Thus, the social learning component is given by:
| \[ S_{t,n,m} = \left[ \sum\limits^{K_n}_{k=1}\alpha_{t,n,k}A_{t,k,m} \right] + \varepsilon_{t,n,m},\] | \[(6)\] |
Homophily and asymmetric weightings in a social network
In the model, social interactions occur between individuals within a Watts–Strogatz graph with a small-world property and a mean number of connections \(K\) per individual (Watts & Strogatz 1998). This choice of graph is due to their pervasive nature in real-world physical social networks. Watts–Strogatz graphs begin by placing \(N\) individuals in a ring and then attaching \(K\) links between an individual and those other individuals closest to them. In this state the network has an extremely high degree of homophily and clustering as ego-networks overlap significantly. Subsequently, using a probabilistic re-wiring \(p_r\) of connections between two adjacent nodes to a third long-distance one we can introduce long-distance or weak ties (Granovetter 1973). This greatly reduces the average shortest path length while only marginally reducing the clustering of the network, achieving the small-world property.
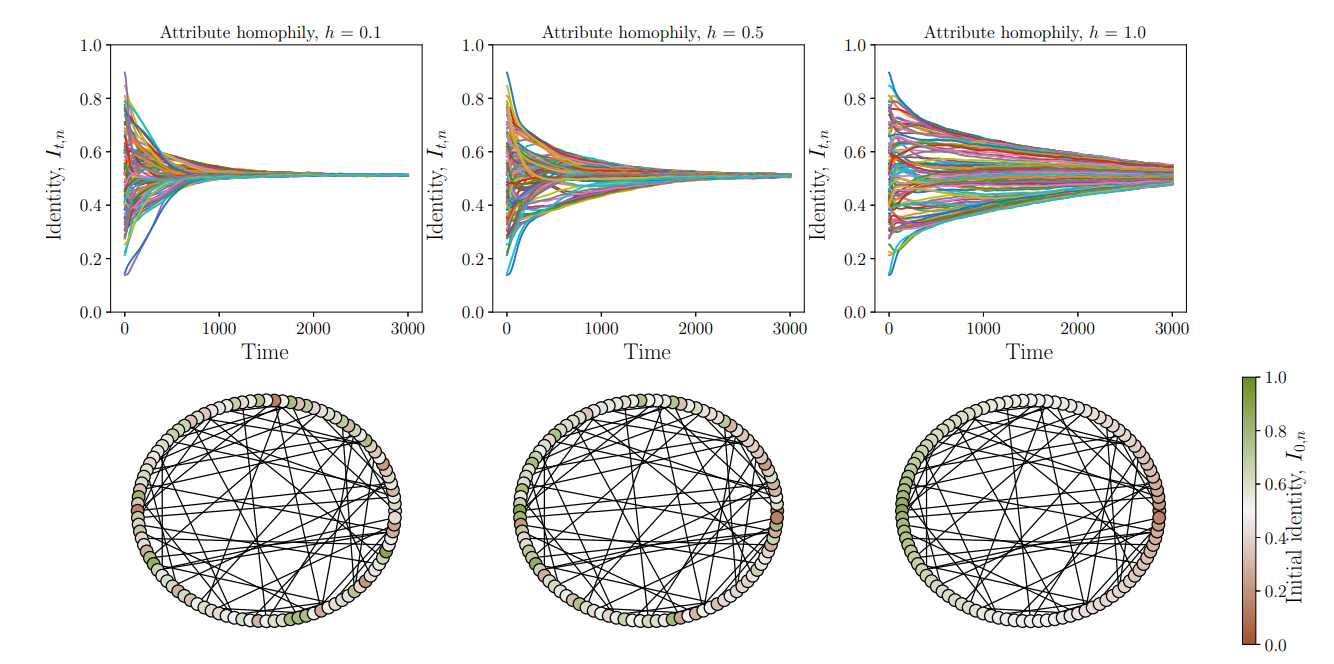
We generate attribute homophily in the network by placing individuals next to those with initial environmental identities that are most similar (Kapeller et al. 2019). The attribute homophily parameter \(h\) measures to what degree an individual’s position in the network is a function of their identity. In the case of perfect attribute homophily, individuals are surrounded by ego-networks that are like-minded in terms of environmental identity. However, for heterogeneous initial identity values and Watts–Strogatz network, this forms a circle with an approximately constant gradient in identity, accounting for stochastic variations from the generating Beta distribution. This is shown in the third column of the second row of Figure 6. The degree of attribute homophily may then be varied discretely using a Fisher-Yates shuffle algorithm (Fisher & Yates 1953), where random pairs of individuals swap places in the network. For our implementation, an attribute homophily parameter \(h = 0\) means no pair swaps occur, whilst \(h=1\) results in \(N\) random swaps.
Boyd & Richerson (1988) model the notion that peoples’ choices of whom to learn new traits from are not random. A confirmation bias is content-dependent where more attention is paid to information that reinforces current opinions (Lord et al. 1979; Nickerson 1998). Furthermore, individuals that identify with a particular group tend to assimilate their norms. In a parallel fashion, they distance themselves from out-group individuals (Fielding & Hornsey 2016). This forms a key component of the model by Axelrod (1997), where individuals interact more with those who are similar to them. This causes them to share more similarities and hence leads to further interactions. In the bounded confidence (Hegselmann et al. 2002) or relative agreement (Deffuant et al. 2002) models, proximity in opinion or distance may be used to represent this phenomenon. Likewise, Konc & Savin (2019) use an opinion distance which is framed as a confirmation bias. Furthermore, in Deffuant et al. (2000), agents may only interact if their vectors of opinions are sufficiently alike. They highlight the parallels with genetic transmission processes in that “reproduction only occurs if genome distance is smaller than a given threshold”. Limitations in contact between groups can allow for minority opinions or ideologies to persist amongst an overwhelming majority (van den Bergh et al. 2019).
We replicate the stylised fact of interactions leading to further interactions found in Axelrod (1997) by basing the strength of agent opinion exchange on the similarity of their environmental identity. Following Konc & Savin (2019), we use a combination of an exponential form and confirmation bias to vary how much agents may interact with those of distinct identities. Greater values of confirmation bias mean that an agent pays attention to a rapidly shrinking sub-network within the ego-network. Partly inspired by Brock & Hommes (1998) use of discrete choice models, our social network weighting matrix \(\alpha_{t,n,k}\) is given by the softmax function:
| \[ \alpha_{t,n,k} = \frac{e^{-\theta|I_{t,n} - I_{t,k}|}}{\sum\limits^{K_n}_{j \neq n}e^{-\theta|I_{t,n} - I_{t,j}|}},\] | \[(7)\] |
The external influence of an agent in an ego-network can change an individual’s attitude towards a certain environmentally-related behaviour. This in turn leads to a changing environmental identity which strengthens this social relation, leading to further behavioural change. The intermediary role played by identity can produce new behavioural dynamics compared to a reference case in which behavioural attitudes evolve through independent social interactions. The greater the degree to which a behaviour is socially influenced, determined by \(\phi_{m}\), the more it is susceptible to outside shocks, driving behavioural change.
Baseline experimental set-up
When exploring model dynamics we typically study the case of \(N = 200\) individuals for \(\tau = 3000\) time steps. Note that we envision a single period being between one week and a day, however, for a theoretical model like this, is not strictly necessary. A Watts–Strogatz network is used with a mean node degree \(K = 20\) giving a typical network density \(\approx0.1\) (the ratio of actual to potential inter-agent links). The parameters required to run the model, and the test case ranges explored in the sensitivity analysis, are summarised in Table 1 with variables shown in Table 2.
| Parameter Name | Symbol | Definition | Range | Comments |
|---|---|---|---|---|
| Number of individuals | \(N\) | Total number of individuals in the social network | ||
| Number of behaviours | \(M\) | Behaviours modelled per agent | ||
| Mean node degree | \(K\) | Mean number of members of ego-network | This must be less than the total possible number of connections given by \(N-1\). | |
| Cultural inertia | \(\rho\) | Number of timesteps over which past attitude states influence current identity state | A lower bound of \(1\) means that only the present is considered and an upper bound of \(3000\) is chosen as this must be \(\leq\tau\). | |
| Social learning error standard deviation | \(\sigma_{\varepsilon}\) | Standard deviation of Gaussian learning error representing the degree of perfect imitation | In proportion to the scale of the attitudes and thresholds of \([0,1]\) | |
| Discount factor | \(\delta\) | Decrease in relative importance between two adjacent moments in time | A value of \(0\) means only present attitudes affect identity, whilst \(1\) means all past timesteps considered equally | |
| Attribute homophily | \(h\) | Degree of identity homogeneity in the initial social network | \(h>1\) implies more switching of networks connections which may not necessarily lead to lower initital identity homophily | |
| Confirmation bias | \(\theta\) | How much agents only listen to members of their ego-network with similar identities | Set the lower bound as \(0\) as negative values mean that individuals seek out identities opposite to their own. | |
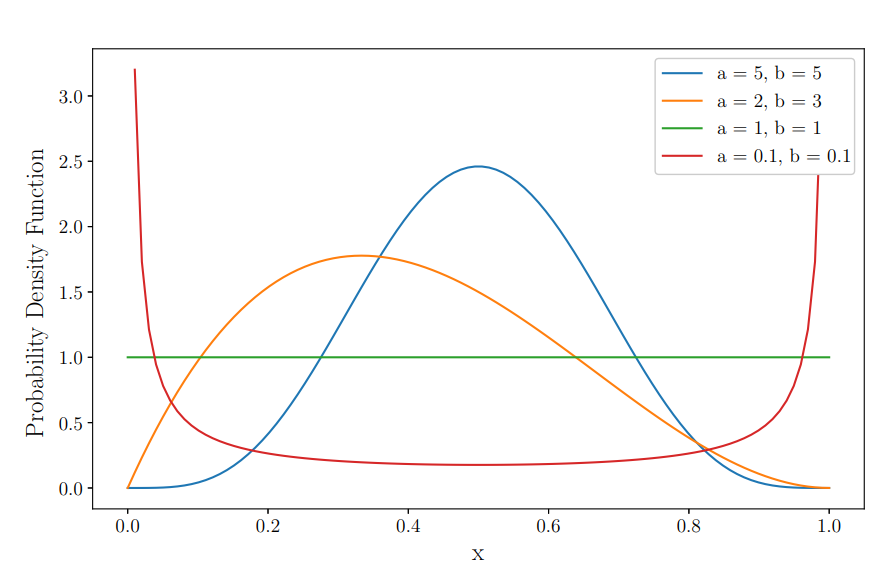
| Initial attitude and threshold Beta (a,b) | \(a_{A},b_{A},a_{T},b_{T}\) | \(a\) and \(b\) are the two inputs for the Beta distribution to generate initial distribution of agent attitudes and thresholds | Ranges allow for distributions representing polarisation and consensus in initial attitudes and thresholds | |
| Total time steps | \(\tau\) | Discrete simulation calculations | Not included in sensitivity analysis | |
| Conspicuous consumption factor | \(\phi_m\) | Behaviour specific social susceptibility, determines simulation speed | - 0.05 | Not included in sensitivity analysis to keep simulation speed constant |
| Probability of re-wiring | \(p_r\) | Likelihood that connection between agents are swapped to form long-distance or weak tie | Not included in sensitivity analysis to conserve small-world property |
| Variable Name | Symbol | Definition |
|---|---|---|
| Attitude | \(A_{t,n,m}\) | How much an agent wants to perform behaviour \(m\) |
| Threshold | \(T_{n,m}\) | How high the barrier of entry is to performing behaviour \(m\) |
| Behavioural value | \(B_{t,n,m}\) | To what extent or with what frequency behaviour \(m\) is performed |
| Total emissions flow | \(E_t\) | Sum of emissions flow due to \(N\) individuals each with \(M\) behaviours |
| Identity | \(I_{t,n,m}\) | Degree to which an agent associates themselves with a pro-environmental identity |
| Social learning component | \(S_{t,n,m}\) | The influence of agent \(n\)’s ego-network on their attitude towards behaviour \(m\) |
| Social network weighting | \(\alpha_{t,n,k}\) | Matrix of inter-agent opinion importance |
| Node degree | \(K_{n}\) | Number of members of an individuals ego network. On average this is \(K\) but may vary due to network re-wiring |
It is important to note that given the softmax function form of Equation 7 for inter-agent weighting there is always some influence from an individual’s dis-similar ego-network. This means that given sufficient time (and low social learning error or perfect imitation) the population will reach a single consensus identity. However, the immediacy with which a transition to low-carbon lifestyles must occur does not allow for such an extended time frame. Therefore for all experimental runs, we fix the number of simulated timesteps at \(\tau = 3000\), as we are specifically interested in the identity dynamics of the model in short periods and the path dependency of consensus formation in the network. Furthermore, the rate at which behavioural change occurs is dictated by the conspicuous consumption parameter \(\phi_m\), with lower values leading to slower change. We assign different \(\phi_m\) values in the range \([0.01,0.05]\) to each of the \(M\) behaviours, this represents the varying social susceptibility of environmentally relevant behaviours. Therefore we exclude both the number of time steps and the conspicuous consumption parameter \(\phi_m\) from the sensitivity analysis.
Results
We first give an overview of the model outcomes through a study of the typical identity dynamics towards three metastable states. Due to the model’s complexity, exploring the entire parameter space is not feasible. Instead, we collate different kinds of phenomena produced by the model and explain them. In pursuit of this, we consider the processes of bifurcation, polarisation and consensus formation (Deffuant et al. 2002). Therefore, we also take a more detailed look at what model dynamics are induced by specific parameters. Additionally, we consider the effect of green influencers that act as fountains of green attitudes in the model, focusing on which components dictate the degree of behavioural decarbonisation. Finally, this is complemented by a sensitivity analysis to identify which parameters have the most impact on key outcome variables such as the variance in final identities of individuals, total emissions and relative change in emissions between the start and finish of an experiment.
Environmental identity dynamics
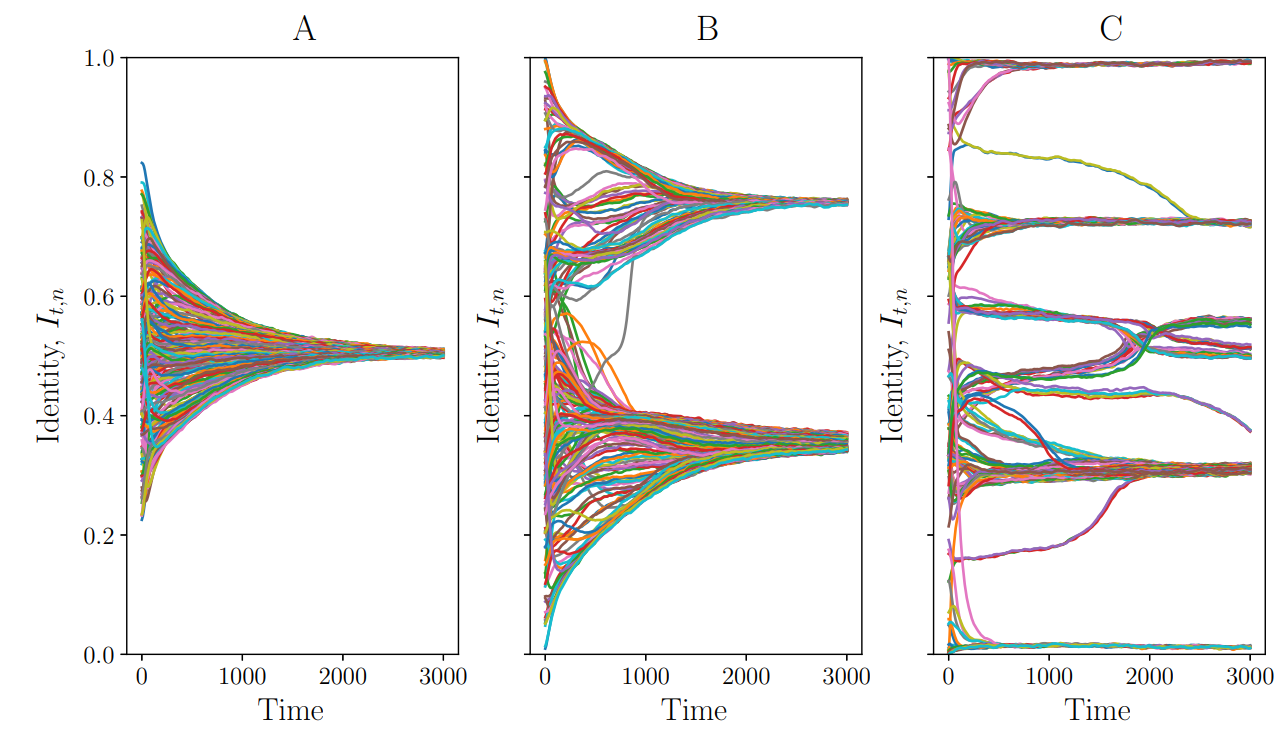
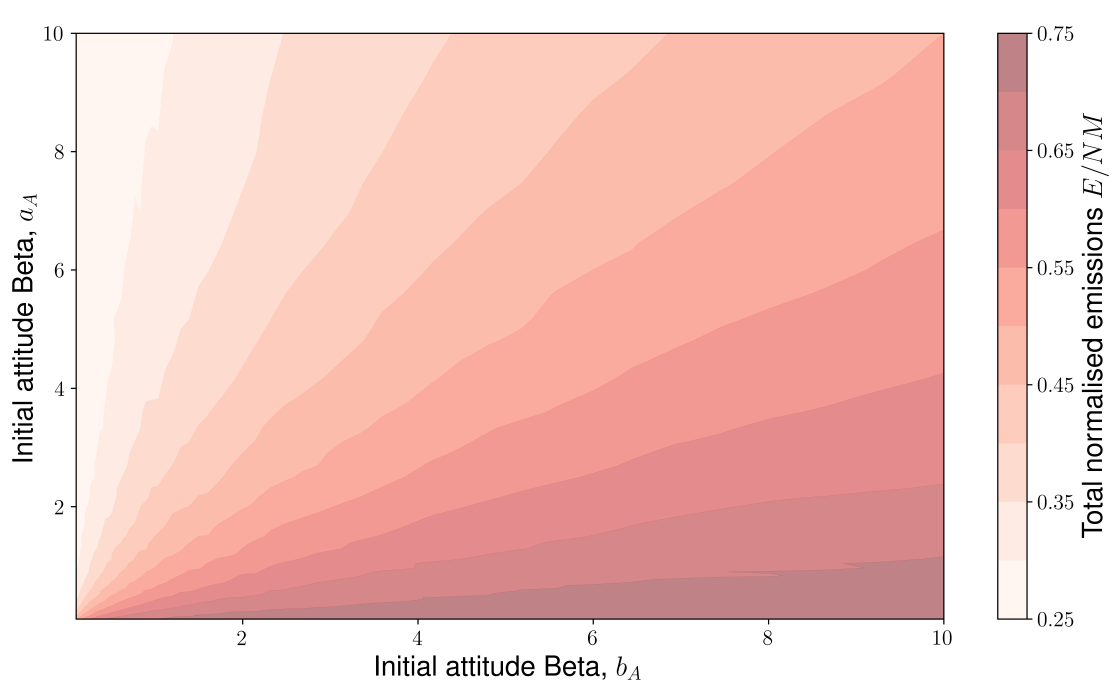
The identity dynamics produced by the model may be divided into three states as a function of the variance of final identities in the population. Examples of these different dynamics are shown in Figure 3, where each case is a time series of the identity dynamics of \(N = 200\) individuals. The experiments differ through variations of the Beta \(a_A\) and \(b_A\) parameters for individuals’ initial behavioural attitudes and confirmation bias \(\theta\). Case A (\(a_A = 2.0\), \(b_A = 2.0\), \(\theta = 10\)), represents the simplest model outcome, where approximatively normally distributed attribute values produced by large Beta distribution parameters, \(a_A,b_A >1\), lead to rapid consensus formation around a single population environmental identity. Decreasing Beta parameter values produce greater polarisation in initial conditions, in combination with large values of confirmation bias \(\theta > 10\), this leads to the formation of splinter identity subgroups within the population. These can form a two-identity state metastable state as can be seen in case B (\(a_A = 0.3\), \(b_A = 0.3\), \(\theta = 18\)). The greater the distance between these two-identity subgroups the slower the process of reconciliation occurs, and the greater the time frame required for consensus formation. Finally for sufficiently low values \(a_A,b_A < 0.1\) and large \(\theta\), see case C (\(a_A = 0.05\), \(b_A = 0.05\), \(\theta = 40\)), the population remains splintered in multiple information or “identity bubbles” of individuals who only interact with a small group. A more detailed breakdown of the relation between \(a_A,b_A\) and the total emissions may be found in the Appendix Figure 10, where lines of constant expectation value of the Beta distribution \(a_A/(a_A + b_A)\) are proportional to a constant level of emissions.
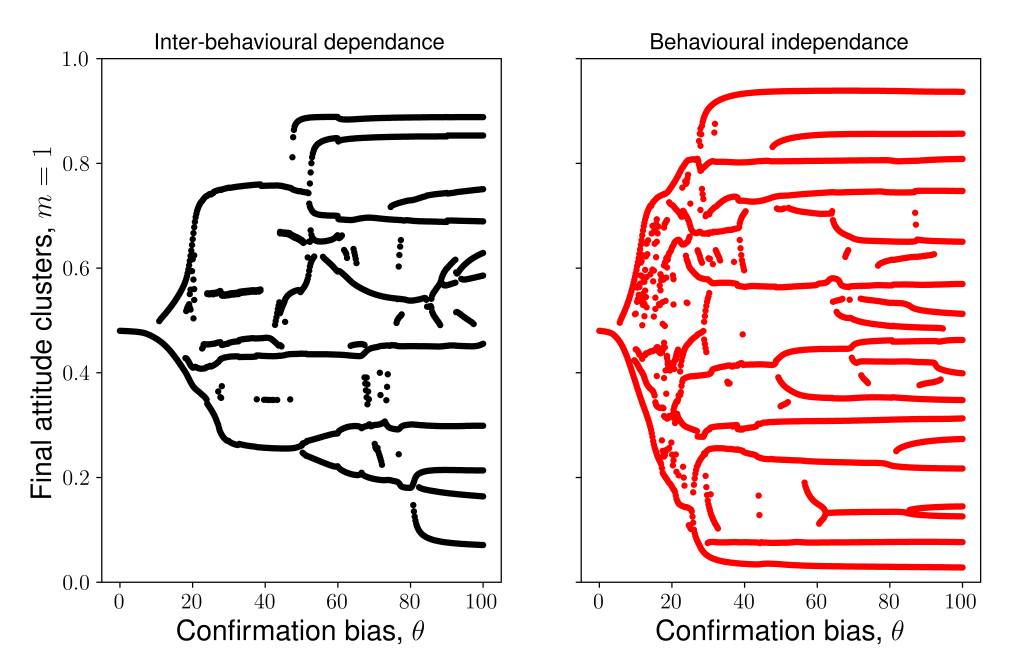
To further explore the effect of confirmation bias on identity dynamics we look at the bifurcation process of clusters of behavioural attitudes at the end of experiments. We use a Gaussian kernel density estimator to group individuals, measuring the location of these for increasing confirmation bias \(\theta\). The transitions between the three cases identified in Figure 3, are modulated by \(\theta\), as shown in the left of Figure 4. In the sub-figure we consider the effect of increasing confirmation bias on the location of final attitude clusters of the first, \(m = 1\), of a total of three behaviours, \(M = 3\). The location of these attitude clusters is determined using a Gaussian kernel density estimator with a bandwidth of \(0.01\). All experiments use the same initial seed to account for stochastic effects. For the same degree of polarisation in initial attitudes, larger values of \(\theta\) produce greater identity fragmentation. Sufficiently high values of \(\theta\) lead to splintering, in the style of case \(C\).
A key cornerstone of the model is the role of cultural identity in the diffusion of pro-environmental behaviours. To investigate this effect we perform the same bifurcation analysis in the case of behavioural independence, see right Figure 4. For these experiments, the social network weighting \(\alpha_{t,n,k}\) is now determined by the behavioural attitude distance, \(|A_{t,n,m} - A_{t,k,m}|\), not the identity as in Equation 7. This results in one weighting matrix for each \(M\) behaviours, \(\alpha_{t,n,k,m}\). In this scenario, the fragmentation in attitudes occurs at much lower values of confirmation bias. Moreover, for these low confirmation bias values, identity allows for the formation of larger, more behaviourally heterogeneous, groups relative to the behavioural independence case. Therefore identity stimulates the convergence of opinions by allowing individuals of more diverse behavioural backgrounds to relate themselves better to their peers and imitate their behaviour.
Impact of model components
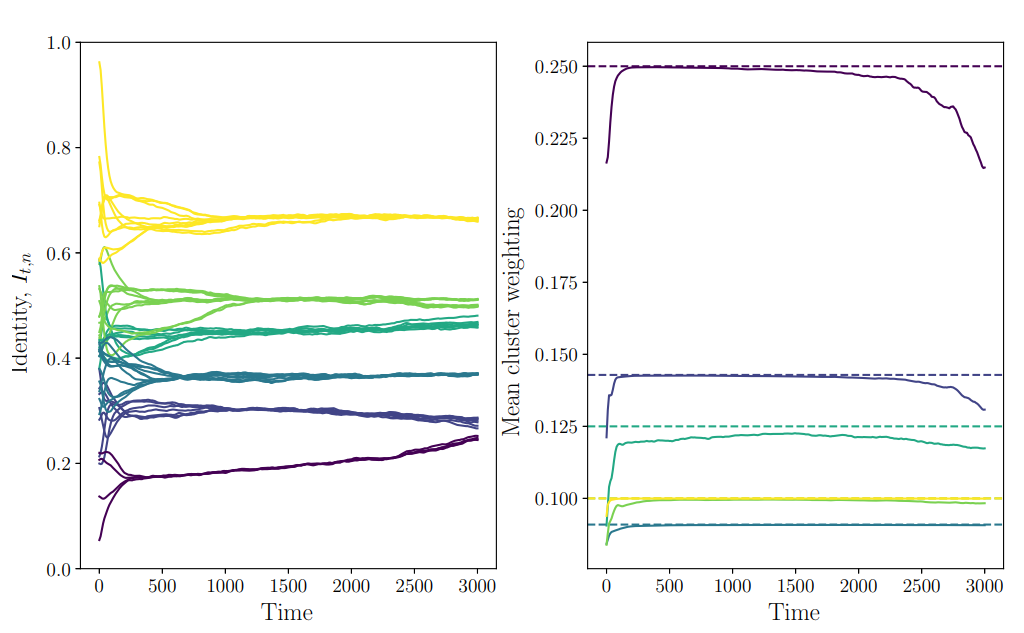
To study how the frequency with which individuals update their identity can impact identity dynamics, we consider three cases. The first case, static uniform weighting, represents a society in which individuals value the opinion of all their ego-network members in the Watts–Strogatz network equally such that \(\alpha_{t,n,k} = 1/K_n\) and are unable to change their weighting over time. This is equivalent to having no confirmation bias, \(\theta = 0\). In the second case, static culturally determined weighting, individuals calculate their social network weighting once based on their initial identities, according to Equation 7. Similarly to the first case, this is fixed for subsequent time periods of the experiment. In the third case, dynamic cultural weighting, we update \(\alpha_{t,n,k}\) every time step, representing frequent social interactions. The columns in Figure 5 correspond to these three scenarios sequentially, whilst the top row gives the identity time series and the bottom row the step social network weighting matrix at the final time step. Each experiment is run for \(N = 50\) individuals so that the heterogeneity in the social network weighting matrix is more visible.
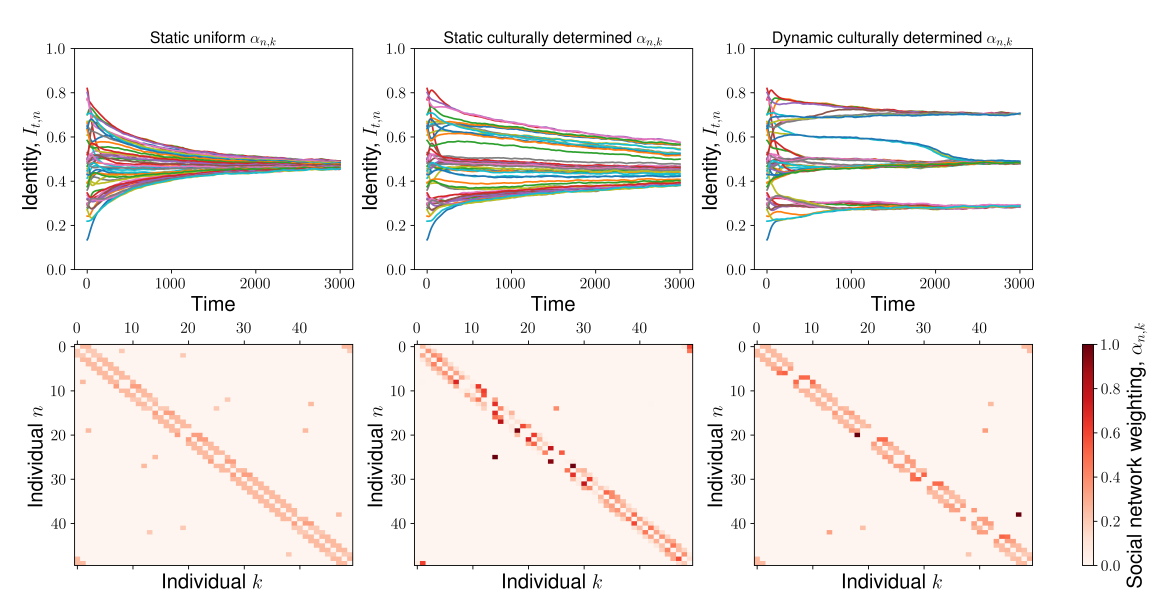
For the first and second cases, individuals reach a population identity consensus faster due to cross networks connections that “infect” each other with opposing views. In both cases individuals cannot update their social network weighting, meaning that new socially acquired information (which may conflict with their current attitudes) cannot be ignored. This demonstrates the strength of weak ties in breaking homophily effects. However, the pace of consensus formation in the second case is much slower as individuals pay less attention to weak ties, thus slowing the behavioural diffusion process. This is reflected in the \(\alpha_{n,k}\) values for the second column and row of Figure 5 where agents have very specific individuals to whom they pay attention. For frequent updating of \(\alpha_{t,n,k}\) agents can form “identity bubbles” which leads to the grouping of agents into strands that block out information resulting in a fractured identity spectrum by the end of the simulation. Interestingly, the social network weighting matrix at the final time step for this third case is similar to that of the first, uniform, weighting case. This suggests that these “identity bubbles” are within themselves uniformly distributed, with individuals paying equal attention to their peers but excluding those from the out-group, see Figure 11 in the Appendix. It is this stark distinction between in- and out-group individual weightings that sustains the identity strands and prevents global-, whilst enforcing local-, consensus formation.
Decreasing initial identity similarity between ego-network members leads to faster consensus formation as agents are exposed to those with distinct views, see Figure 6. Three experiments are run for identical initial conditions, crucially including graph structure, varying solely on the attribute homophily parameter \(h\) which dictates how mixed ego-networks are in the initial social network. A population size of \(N=100\) is used to highlight the differences in the initial identity network layout. Furthermore, the network structure is also the same, thus it is purely through reduced homophily that a societal identity consensus is reached faster, and not a greater presence of weak ties. This effect is stronger for greater initial values of attitude polarisation with \(a_A,b_A < 0.5\), as the initial identity distance between the “greener” and “browner” identity groupings is greater. Therefore by facilitating the mobility of individuals and exchange between people with distinct environmental views, to break up social network homophily, policy-makers can further foster consensus formation in pro-environmental behavioural choices.
Greater values of the discount factor \(\delta\) mean that there is a focus on recent events, thus changes in the model can occur faster as there is less influence from past behavioural attitudes. Variation in the cultural inertia parameter \(\rho\) was found to have little effect on the model culture. This lack of impact is because additional time steps included in the discount array, through greater values of \(\rho\), have an exponentially decreasing effect hence the cumulative sum of their influence can be negligible. Moreover, due to the autoregressive nature of Equation 5 current values of attitudes are strongly correlated with previous time steps. Therefore, larger values of \(\rho\) introduce relatively little extra variance into the past attitudes vector averaged in Equation 3.
Attitude change through green influencers
Up to now, we have explored identity dynamics under a purely diffusive regime. In the following let us consider how the model behaves when we introduce green influencers. These are modelled as a minority of individuals who actively promote green lifestyles (Chwialkowska 2019). We represent green influencers as having one behaviour, out of three (\(m = 1, M =3\)), which is not susceptible to social influence with a perfectly green attitude \(A_{t,n,1} = 1\), but behave as non-influencers individuals otherwise. Their inclusion increases the population by \(10\%\), from \(200\) to \(220\). To account for the larger population size we proportionally increase the average number of mean ego-network members, from \(K = 20\) to \(22\), to maintain a constant network density.
To assess the impact of these green influencers on final total emissions, and to exclude the drop in emissions due to simply introducing “greener” behavioural attitudes, we only measure behavioural emissions from non-influencers individuals. In the top panel of Figure 7, we consider four scenarios, varying whether or not to include green influencers and whether to include environmental identity (black) or not (red), through inter-behavioural dependence. The changes in inter-behavioural dependence are performed similarly to the experiments in Figure 4. Along the horizontal axis, we vary the mean initial attitudes of the population from “greener” to “browner”. In the case of including green influencers, this represents an increasing distance between the average attitude of non-influencers and that of perfectly green influencers. These scenarios are then run for low (\(\theta = 5\)) and high (\(\theta = 20\)) confirmation bias shown in the left and right columns. Moreover, in the bottom panel of Figure 7, we measure the relative change in emissions between experiments with and without green influencers, comparing the impact of including environmental identity (inter-behavioural dependence, black) or excluding it (behavioural independence, red). Note that we measure the intra-stochastic value emissions change. In both the top and bottom panels of Figure 7, the shaded area gives the maximum and minimum values of the measured attribute for \(10\) different initial stochastic values.
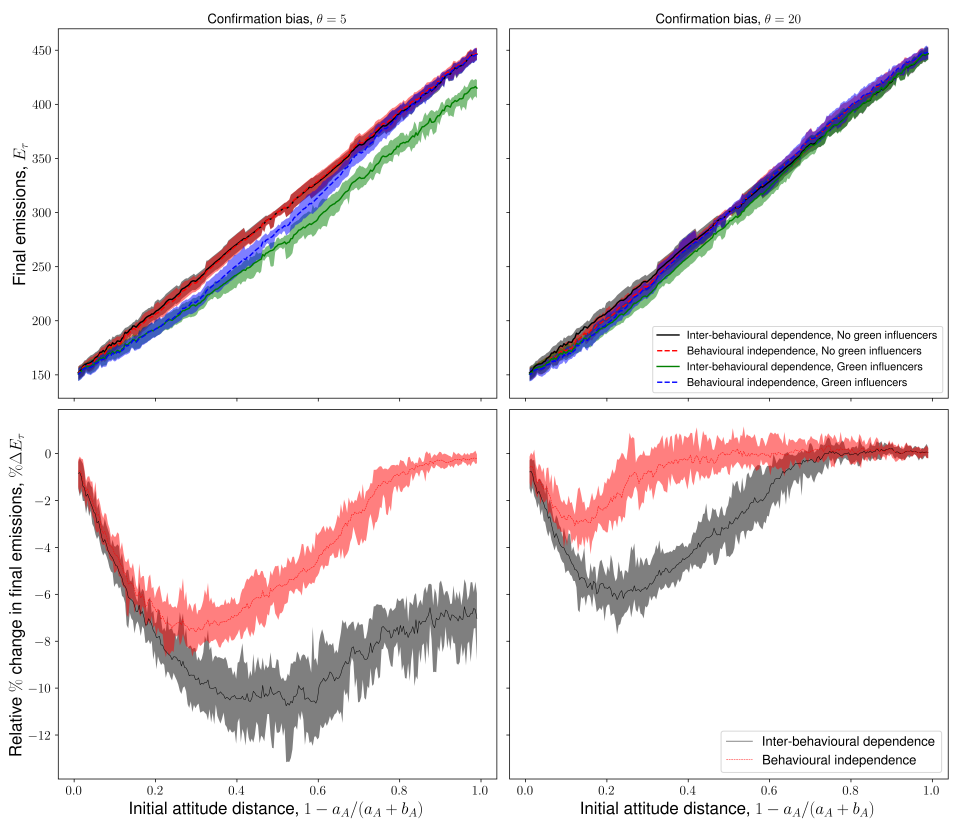
Beginning with the top panel of Figure 7, we can see that total emissions of non-influencers are primarily determined by their initial attitude preferences, as identified in the Appendix Figure 10. The bottom panel of Figure 7 indicated that the emissions reduction achieved by the introduction of green influencers is a function of the mean attitude distance, confirmation bias and behavioural interdependency. Moreover, this panel demonstrates the difficulty in achieving deep behavioural decarbonisation. The degree of emissions reduction decreases sharply as the attitude distance between green individuals and the rest of the population approaches zero. Therefore, deep decarbonisation was not achieved through the presence of green influencers alone due to the heterogeneous static behavioural thresholds of individuals.
The greater the distance between green influencers and the mean initial attitude of non-influencers individuals the larger the potential for behavioural emissions reduction. Furthermore, larger initial attitude distances lead to lower inter-agent weightings of green influencers, as defined in Equation 7. The combination of these two countervailing forces, greater decarbonisation potential but the lower weighting of green influencers in social interactions, at larger attitude distances between green influencers and non-influencers individuals, leads to a U-shaped curve in emissions reduction. In the case of inter-behavioural dependency, the peak of the curve occurs at an attitude distance of \(0.4\) and \(0.15\) for the low and high confirmation bias cases respectively.
In contrast, when there is behavioural independence, green influencers are too distant in the attitude space to have significant inter-agent weights with non-influencers individuals. In the case of behavioural inter-dependence, non-influencers are willing to listen to green influencers due to similarities in the non-green behaviours (\(m = 2,3\)). Green influencers can exploit this similarity in the environmental identity aggregate to spread their message. Additionally, under lower confirmation biases individuals are willing to listen to ego-network members with greater identity or attitude distance. With both behavioural inter-dependence and low confirmation biases this results in green influencers inducing decarbonisation over a broader range of attitude distances, as shown in the bottom panel of Figure 7. Moreover, because of this wide-ranging influence, the degree of decarbonisation is also stronger, as individuals feel the “pull” of green influencers further away in the attitude space. This results in a greater total number of impactful social interactions between them over the simulation period.
The limited behavioural decarbonisation achieved by the minority of green influencers (at best \(5-12\%\) emissions reduction) indicates the limit to what voluntary actions can achieve. This highlights the need for climate policies, such as carbon pricing or industry standards, which would reduce thresholds or barriers of entry to performing “greener” behaviours. Therefore, further research is required into the impact of said policies on behavioural emissions. Specifically, in the case of market-based instruments with incomplete emissions coverage, such as the EU-ETS (Foramitti et al. 2021), which may heterogeneously affect multiple green behaviours. Especially of interest is how policies targeting behavioural thresholds might synergise with those spreading “greener” attitudes, either through green influencers or information provision policies.
The peak of emission reduction at low distance in environmental attitudes indicates the need for an individual-specific tailored approach when providing green information. This would avoid alienating individuals who might not react to information provision policies if they are too green. Instead, the messaging would adjust for an initially brown but increasingly green society, thereby taking advantage of the emissions reduction peak. Jointly, this means that with greater behavioural inter-dependence and lower confirmation bias, an information provision policy would be targeting, and impacting, a greater part of society.
Sensitivity analysis
Sensitivity analysis reveals how much variation in specific inputs can affect output variation (Hamis et al. 2021), ensuring that results and conclusions drawn are contextualised (Ligmann-Zielinska et al. 2014). For this analysis, we use the Sobol (Sobol 2001) and Saltelli (Saltelli 2002) methods, implemented using the SALib python library (Herman & Usher 2017), run over \(76800\) experiments. The key indicators we use are final total emissions \(E/NM\), the variance in final identities of individuals \(\sigma^2_{I}\) and the change in total emissions between the start and end of each experiment, \(\Delta E/NM\). We normalise the total emissions \(E\) over agent number and behaviours to account for the scale effect on results of having a larger population that is more active. To account for the impact of stochasticity in the model (caused by initial attitude distribution, attribute homophily, re-wiring probability and imperfect social learning) we average output variables over multiple runs with different initial stochastic seeds.
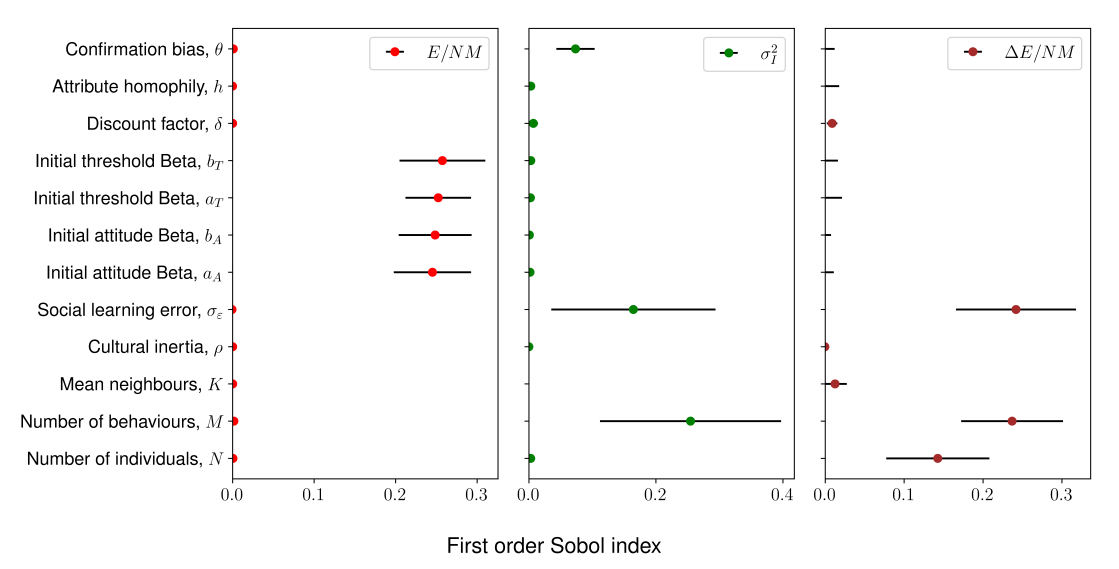
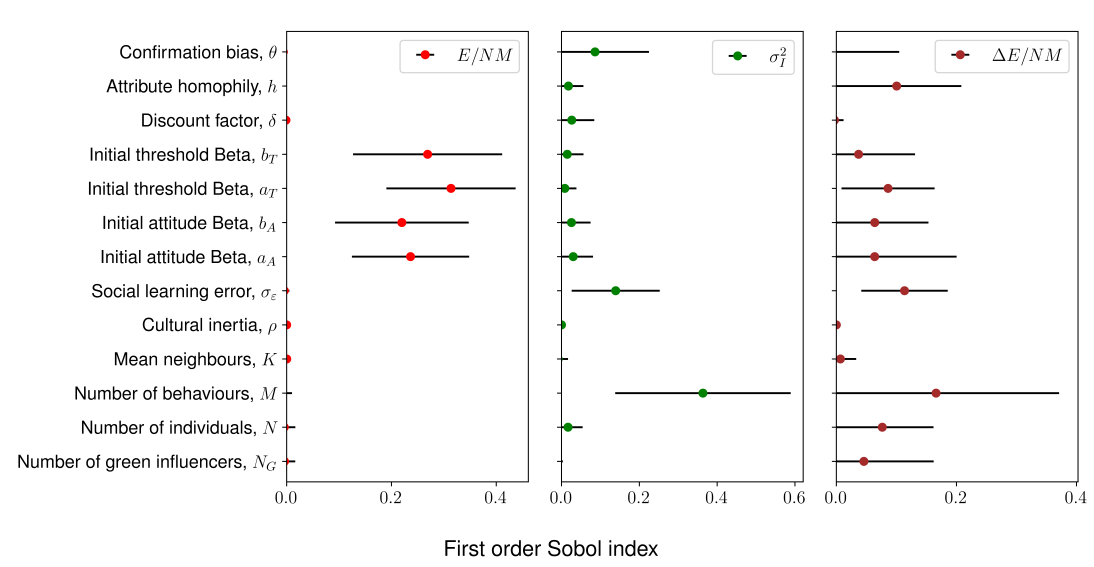
Figure 8 shows the results of this sensitivity analysis, where a greater first Sobol index value represents the greater relative importance of one parameter over others. The most influential parameters in determining the final model emissions are the initial distribution of behavioural attitudes \(a_A,b_B\) and thresholds parameters \(a_T,b_T\). This result is due to the linearity of Equations 1 and 2 in determining behavioural emission, and because our diffusive mechanism of social learning only allows for imitation and not innovation to more green (or brown) behaviours. The exact value of the final total emissions is strongly correlated with the initial identity distribution given in the Appendix Figure 10.
The variance of final identities is dominated by the number of behaviours \(M\), the social learning error \(\varepsilon\) and the confirmation bias \(\theta\). The fractional contribution of each behaviour to an individual’s identity decreases with an increasing number of behaviours \(M\). This means that for large \(M\) values, extreme attitudes have little effect on the identity of an individual. Hence, individuals can be similar in identity even if they differ substantially in a few specific behavioural attitudes, as their extremist attitudes are counter-balanced by their more moderate views in Equation 4. Alternatively put, for a fixed total time a larger number of behaviours M leads to faster consensus formation in identity, as individuals are influenced by attitudes from a wider range of people, since they cannot find close matches, so it is harder to form “identity bubbles”. In the case of social learning error, this simply increases the fundamental uncertainty each individual holds regarding their attitudes, which on the aggregate identity level leads to greater variability per individual, and by extension also at a population level. Greater confirmation bias \(\theta\) also acts to slow the diffusion of opinions in the network as individuals tend to listen to those who are very close to them in identity space.
The change in total emissions over the simulation period is driven by the social learning error, as this is the only means through which new information may be introduced into the population. Consequently, through Equation 6, the greater \(N\) and \(M\) the more of this misinformation is introduced per time step. The role of social learning error in determining emissions changes indicates room for policy intervention in the form of information provision through advertising or education, which is left for further research.
We run a similar sensitivity analysis for the case of including green influencers with a range tested of [1,100] with 1920 experiments shown in the Appendix Figure 12. We find that a similar set of parameters dominate the first order index of total emissions \(E/NM\) and identity variance \(\sigma^{2}_{I}\) as in Figure 8. However, in the case of emissions change \(\Delta E/NM\) there is a lower sensitivity to the social learning error \(\varepsilon\) and greater importance of the number of behaviours \(M\). With more behaviours, an individual’s environmental identity becomes less connected to a single perfectly pro-environmental norm promoted by green influencers, making normal individuals more receptive to their pro-environmental attitude message. Note that in this sensitivity analysis both the density of the network and the initial preferences vary unlike in Figure 7.
Limitations and Outlook
The representation of behaviours as a continuous parameter allows for a scale of emissions corresponding to the degree to which a pro-environmental behaviour is performed. However, behaviours such as investing in domestic solar energy are binary choices that occur once. Furthermore, the ability to perform one environmentally-related behaviour can be dependent on the past completion of another. For example, the choice to cycle to work requires that an individual already owns a bike. Thus, future empirically-based applications of the general model may want to modify the definition of the behavioural value \(B_{t,n,m}\) according to the nature of that behavioural choice.
Our model of environmental identity, as a time-weighted average, allows for the substitutability of behaviours. Consider the case of two individuals, each with two behaviours. The first has behavioural attitude values \(A_{t,1,m} = [0.5,0.5]\), and the second \(A_{t,2,m} = [0,1]\). Given the current formulation of Equation 3, these two would have the same environmental identity. The fact that two individuals, one of whom is entirely apathetic towards environmentally related behaviors while the other is a green and brown extremist, can be grouped under the same identity raises the need for further model refinement. To address this issue, one potential solution is to employ k-nearest neighbor classification based on behavioral attitude vectors, grouping individuals and assigning a representative environmental identity value to each group. Alternatively, a mechanism of internal dissonance (Dalege et al. 2018) could avoid the repeated interaction of individuals with conflicting attitudes.
An aspect of model dynamics that falls outside of the scope of this study is the role of what type of information is socially learnt. In the case of the first, we chose the diffusion of environmentally related attitudes \(A_{t,n,m}\) instead of the behavioural action \(B_{t,n,m}\). The imitation of a behavioural action instead of attitude would result in which descriptive norms are the dominant mediator in social interactions.
In this study, we consider solely networks with a small world property. The dynamic nature of the social network weighting between individuals then leads to the formation of "identity bubbles". Further study could investigate how different degree distributions in the social network can affect the propensity for these "identity bubbles" to occur. In addition, the impact on total emissions of the placement of "green influencers" within networks with high asymmetry in node degree, such as scale-free, could be an interesting research avenue.
We envision the model being used in conjunction with climate policies such as carbon pricing, industry standards or information provision. These would build on our study of green influencers, to produce dynamic behavioural thresholds and drive attitudes in the population towards a green consensus. Our model could inform how said policies leverage network effects or are inhibited by the “identity bubbles” previously highlighted. For example, the study of green influencers could be extended to include the decaying effect of information provision policies (Allcott & Rogers 2014).
Additionally, moral licensing effects could be included, whereby one green behavioural choice can cause negative spillovers in subsequent environmentally related decisions. This is especially of interest given the role of inter-behavioural effects on network attitude consensus highlighted in the model. The emissions of individuals due to behavioural choices do not directly contribute to model dynamics, see Figure 1. Therefore the underlying mechanics of behavioural interdependency due to culture with imperfect social learning could be generalised to study other systems such as healthy lifestyles.
Future work might analyse case studies for a particular country, period or group. Especially of interest would be studies involving larger behavioural changes, such as the mass adoption of cycling in Copenhagen in a similar fashion to Kaaronen & Strelkovskii (2020), but with a wider focus on how the adoption of these low-carbon behaviours affected other environmentally related behaviours (Andersson & Nässén 2023). This approach would provide empirical validation for our theoretical mode, complement the robustness of our conclusions derived from our large-scale sensitivity analysis of model parameters.
The introduction of exogenous dynamic thresholds might better represent the degree to which certain behavioural choices are cyclic, such as reduced domestic energy savings in winter or the increased inconvenience of cycling in harsh weather. Considering longer time scales, further research could introduce a missing link between behavioural emissions, environmental conditions and agent choices. This would make external conditions endogenous to agents’ choices and thus create a cycle of choices between actions and changes in the environment. This might lead to innovation towards “greener” behaviours and thus the emergence of pro-environmental culture in the model. This could lead to integration with the nascent literature on ABM approaches to Integrated Assessment Models(IAMs) (Lamperti et al. 2018; Safarzyńska & van den Bergh 2022), motivated by a need to provide greater detail in representations of agent heterogeneity (De Cian et al. 2020) in the context of demand-side emissions reduction.
Conclusions
In this article, we have developed and analysed an agent-based model of cultural dynamics. It describes how the diffusion of attitudes towards environmentally-related behaviours can interact with longer-term cultural change. To this end, the model incorporates a cultural evolutionary framework, where culture is defined as socially transmitted information. This is represented in the model as an environmental identity which consists of slow long-term change driven by a faster behavioural diffusion process, where we aggregate multiple behavioural attitudes of an individual over time with a discount factor. Individuals interact in a small-world Watts–Strogatz network through imperfect imitation of behavioural attitudes. The impact of culture is to mediate the strength of social interactions according to environmental identity similarity, inducing behavioural interdependence.
As our primary research question, we wanted to answer how pro-environmental diffusion of behaviour interacts with longer-term cultural evolution on a path to a low-carbon economy. How do culture and behavioural diffusion interact? What is the longer-term impact of cultural change? What are the mechanisms behind behavioural decarbonisation? Firstly, considering the interaction of culture and behavioural diffusion, we found that the presence of culture, as an environmental identity, helps stimulate consensus formation in behavioural attitudes in large groups, relative to the case of behavioural independence. This inter-behavioural dependence facilitates interactions between individuals who may differ in specific attitudes but hold similar identities in the aggregate of multiple behaviours. Secondly, the longer-term component of culture plays a small role in the model dynamics due to the autoregressive nature of how attitudes change over time. This meant that values of environmental identity in the more distant past were very similar to those in the near past, resulting in little impact of extending the period over which current environmental identity is evaluated. Thirdly, we find the extent of behavioural decarbonisation of individuals in the social network to be strongly dependent on the initial distribution of preferences in behavioural attitudes and thresholds. Imperfect social learning drives the change in total emissions between the start and end of experiments as it acts as the sole source of new information in the model. Our results indicate that the speed of consensus formation in environmental identity is strongly influenced by exposure to information from individuals with contrasting opinions. This may be derived from sources such as inter-behavioural spillovers, confirmation biases in social interactions or breaking of homophily effects.
We drive individuals’ attitudes towards greener outcomes through the addition of influencers who in one behaviour act as broadcasters of a perfectly green attitude. The inclusion of culture led to greater decarbonisation, compared to the behavioural independence case. In this scenario, green influencers overcame large distances in attitude between them and non-influencers, by leveraging similarities in the attitude aggregate to spread their message to a wider audience. The impact of green influencers was found to be greatest when the initial attitude distance between non-influencers and green influencers was small enough to allow the them to remain relevant in social interactions, but great enough for there to still be large behavioural decarbonisation potential through solely attitude change. This indicates the need for individual-specific information provision policies to avoid alienating those who might be inert to pro-environmental information if it is too green. Moreover, the failure of this green influencer minority in achieving deep decarbonisation, through solely voluntary action, indicates the need for further modelling to assess the impact of culture on carbon pricing or industry standards policies that would reduce barriers to performing “greener” behaviours.
Acknowledgements
This work has received funding from the European Union’s Horizon 2020 research and innovation programme under the Marie Skłodowska-Curie grant agreement No 956107, “Economic Policy in Complex Environments (EPOC)”.Model Documentation
The model is implemented in Python 3.9, and is available through the CoMSES Computational Model Library as “An agent-based model of cultural change for a low-carbon transition”: https://www.comses.net/codebase-release/e94d7f74-737f-45ff-ae24-5d2e15076a38/.Appendix
Notes
- The form of Equation 7 takes inspiration from a Boltzmann distribution \(e^{-\beta E}/Z\) (McQuarrie 2000), whereby the probability distribution of a statistical system occupying a state is proportional to the energy \(E\), of that state, and is normalised by the partition function \(Z\). In our model, the energy of a state is given by \(|I_n - I_k|\). Moreover, thermodynamic \(\beta\) is inversely proportional to temperature. With increasing temperature, particles have greater kinetic energy, hence can move around more and “interact” with other particles. From this perspective, the confirmation bias \(\theta\) can be seen as analogous to the inverse of temperature, such that increasing confirmation bias represents a system where individuals are “colder” to those different from them and pay less attention to their opinion. Whilst low values of confirmation bias correlate to an open society where individuals interact uniformly with their ego-network.↩︎
References
ACEMOGLU, D., & Ozdaglar, A. (2011). Opinion dynamics and learning in social networks. Dynamic Games and Applications, 1(1), 3–49. [doi:10.1007/s13235-010-0004-1]
ADGER, W. N., Barnett, J., Brown, K., Marshall, N., & O’brien, K. (2013). Cultural dimensions of climate change impacts and adaptation. Nature Climate Change, 3(2), 112–117. [doi:10.1038/nclimate1666]
AJZEN, I. (1991). The theory of planned behavior. Organizational Behavior and Human Decision Processes, 50(2), 179–211. [doi:10.1016/0749-5978(91)90020-t]
ALLCOTT, H., & Rogers, T. (2014). The short-run and long-run effects of behavioral interventions: Experimental evidence from energy conservation. American Economic Review, 104(10), 3003–3037. [doi:10.1257/aer.104.10.3003]
ANDERSSON, D., & Nässén, J. (2023). Measuring the direct and indirect effects of low-carbon lifestyles using consumption data. Journal of Cleaner Production, 386, 135739. [doi:10.1016/j.jclepro.2022.135739]
AXELROD, R. (1997). The dissemination of culture: A model with local convergence and global polarization. Journal of Conflict Resolution, 41(2), 203–226. [doi:10.1177/0022002797041002001]
BARANZINI, A., Carattini, S., & Peclat, M. (2017). What drives social contagion in the adoption of solar photovoltaic technology. Grantham Research Institute on Climate Change and the Environment, GRI Working Papers
BEZIN, E. (2019). The economics of green consumption, cultural transmission and sustainable technological change. Journal of Economic Theory, 181, 497–546. [doi:10.1016/j.jet.2019.03.005]
BISIN, A., & Verdier, T. (2001). The economics of cultural transmission and the dynamics of preferences. Journal of Economic Theory, 97(2), 298–319. [doi:10.1006/jeth.2000.2678]
BOLLINGER, B., & Gillingham, K. (2012). Peer effects in the diffusion of solar photovoltaic panels. Marketing Science, 31(6), 900–912. [doi:10.1287/mksc.1120.0727]
BOYD, R., & Richerson, P. J. (1988). Culture and the Evolutionary Process. Chicago, IL: University of Chicago Press.
BROCK, W. A., & Hommes, C. H. (1998). Heterogeneous beliefs and routes to chaos in a simple asset pricing model. Journal of Economic Dynamics and Control, 22(8-9), 1235–1274. [doi:10.1016/s0165-1889(98)00011-6]
BUENSTORF, G., & Cordes, C. (2008). Can sustainable consumption be learned? A model of cultural evolution. Ecological Economics, 67(4), 646–657. [doi:10.1016/j.ecolecon.2008.01.028]
BURTON, R. J., & Farstad, M. (2020). Cultural lock-in and mitigating greenhouse gas emissions: The case of dairy/beef farmers in Norway. Sociologia Ruralis, 60(1), 20–39. [doi:10.1111/soru.12277]
CASTELLANO, C., Fortunato, S., & Loreto, V. (2009). Statistical physics of social dynamics. Reviews of Modern Physics, 81(2), 591. [doi:10.1103/revmodphys.81.591]
CASTELLANO, C., Marsili, M., & Vespignani, A. (2000). Nonequilibrium phase transition in a model for social influence. Physical Review Letters, 85(16), 3536. [doi:10.1103/physrevlett.85.3536]
CASTRO, J., Drews, S., Exadaktylos, F., Foramitti, J., Klein, F., Konc, T., Savin, I., & van den Bergh, J. (2020). A review of agent-based modeling of climate-energy policy. Wiley Interdisciplinary Reviews: Climate Change, 11(4), e647. [doi:10.1002/wcc.647]
CHWIALKOWSKA, A. (2019). How sustainability influencers drive green lifestyle adoption on social media: The process of green lifestyle adoption explained through the lenses of the minority influence model and social learning theory. Management of Sustainable Development, 11(1), 33–42.
DALEGE, J., Borsboom, D., Harreveld, F. van, & van der Maas, H. L. (2018). The attitudinal entropy (AE) framework as a general theory of individual attitudes. Psychological Inquiry, 29(4), 175–193. [doi:10.1080/1047840x.2018.1537246]
DAVIS, T., Hennes, E. P., & Raymond, L. (2018). Cultural evolution of normative motivations for sustainable behaviour. Nature Sustainability, 1(5), 218–224. [doi:10.1038/s41893-018-0061-9]
DE Cian, E., Dasgupta, S., Hof, A. F., Sluisveld, M. A. van, Köhler, J., Pfluger, B., & Vuuren, D. P. van. (2020). Actors, decision-making, and institutions in quantitative system modelling. Technological Forecasting and Social Change, 151, 119480. [doi:10.1016/j.techfore.2018.10.004]
DEFFUANT, G., Amblard, F., Weisbuch, G., & Faure, T. (2002). How can extremism prevail? A study based on the relative agreement interaction model. Journal of Artificial Societies and Social Simulation, 5(4), 1. http://cogprints.org/4355/1/1.html
DEFFUANT, G., Neau, D., Amblard, F., & Weisbuch, G. (2000). Mixing beliefs among interacting agents. Advances in Complex Systems, 3(01n04), 87–98. [doi:10.1142/s0219525900000078]
DEGROOT, M. H. (1974). Reaching a consensus. Journal of the American Statistical Association, 69(345), 118–121. [doi:10.1080/01621459.1974.10480137]
DREWS, S., Savin, I., & van den Bergh, J. C. (2022). Biased perceptions of other people’s attitudes to carbon taxation. Energy Policy, 167, 113051. [doi:10.1016/j.enpol.2022.113051]
DURHAM, W. H. (1991). Coevolution: Genes, Culture, and Human Diversity. Stanford, CA: Stanford University Press.
EPSTEIN, J. M., & Axtell, R. (1996). Growing Artificial Societies: Social Science From the Bottom Up. Washington, DC: Brookings Institution Press.
FÁTH, G., & Sarvary, M. (2005). A renormalization group theory of cultural evolution. Physica A: Statistical Mechanics and Its Applications, 348, 611–629.
FISHER, R. A., & Yates, F. (1953). Statistical Tables for Biological, Agricultural and Medical Research. London: Hafner Publishing Company.
FORAMITTI, J., Savin, I., & van den Bergh, J. C. (2021). Regulation at the source? Comparing upstream and downstream climate policies. Technological Forecasting and Social Change, 172, 121060. [doi:10.1016/j.techfore.2021.121060]
GESCHKE, D., Lorenz, J., & Holtz, P. (2019). The triple-filter bubble: Using agent-based modelling to test a meta-theoretical framework for the emergence of filter bubbles and echo chambers. British Journal of Social Psychology, 58(1), 129–149. [doi:10.1111/bjso.12286]
GRABISCH, M., & Rusinowska, A. (2020). A survey on nonstrategic models of opinion dynamics. Games, 11(4), 65. [doi:10.3390/g11040065]
GRANOVETTER, M. (1978). Threshold models of collective behavior. American Journal of Sociology, 83(6), 1420–1443. [doi:10.1086/226707]
GRANOVETTER, M. S. (1973). The strength of weak ties. American Journal of Sociology, 78(6), 1360–1380. [doi:10.1086/225469]
GRIMSON, A. (2010). Culture and identity: Two different notions. Social Identities, 16(1), 61–77. [doi:10.1080/13504630903465894]
GUPTA, A., & Ferguson, J. (1992). Beyond "culture": Space, identity, and the politics of difference. Cultural Anthropology, 7(1), 6–23. [doi:10.1525/can.1992.7.1.02a00020]
HAMIS, S., Stratiev, S., & Powathil, G. G. (2021). Uncertainty and sensitivity analyses methods for agent-based mathematical models: An introductory review. The Physics of Cancer: Research Advances, 1–37. [doi:10.1142/9789811223495_0001]
HEGSELMANN, R., Krause, U., & others. (2002). Opinion dynamics and bounded confidence models, analysis, and simulation. Journal of Artificial Societies and Social Simulation, 5(3), 2. https://www.jasss.org/5/3/2.html [doi:10.18564/jasss.5257]
HELFMANN, L., Heitzig, J., Koltai, P., Kurths, J., & Schütte, C. (2021). Statistical analysis of tipping pathways in agent-based models. The European Physical Journal Special Topics, 230(16), 3249–3271. [doi:10.1140/epjs/s11734-021-00191-0]
HENRICH, J. (2001). Cultural transmission and the diffusion of innovations: Adoption dynamics indicate that biased cultural transmission is the predominate force in behavioral change. American Anthropologist, 103(4), 992–1013. [doi:10.1525/aa.2001.103.4.992]
HENRICH, J., & McElreath, R. (2003). The evolution of cultural evolution. Evolutionary Anthropology: Issues, News, and Reviews, 12(3), 123–135. [doi:10.1002/evan.10110]
HERMAN, J., & Usher, W. (2017). SALib: An open-source Python library for sensitivity analysis. The Journal of Open Source Software, 2(9). [doi:10.21105/joss.00097]
KAARONEN, R. O., & Strelkovskii, N. (2020). Cultural evolution of sustainable behaviors: Pro-environmental tipping points in an agent-based model. One Earth, 2(1), 85–97. [doi:10.1016/j.oneear.2020.01.003]
KAPELLER, M. L., Jäger, G., & Füllsack, M. (2019). Homophily in networked agent-based models: A method to generate homophilic attribute distributions to improve upon random distribution approaches. Computational Social Networks, 6(1), 1–18. [doi:10.1186/s40649-019-0070-5]
KONC, T., Drews, S., Savin, I., & van den Bergh, J. C. (2022). Co-dynamics of climate policy stringency and public support. Global Environmental Change, 74, 102528. [doi:10.1016/j.gloenvcha.2022.102528]
KRAAN, O., Dalderop, S., Kramer, G. J., & Nikolic, I. (2019). Jumping to a better world: An agent-based exploration of criticality in low-carbon energy transitions. Energy Research & Social Science, 47, 156–165. [doi:10.1016/j.erss.2018.08.024]
KUPERMAN, M. N. (2006). Cultural propagation on social networks. Physical Review E, 73(4), 046139.
LACASSE, K. (2016). Don’t be satisfied, identify! Strengthening positive spillover by connecting pro-environmental behaviors to an “environmentalist” label. Journal of Environmental Psychology, 48, 149–158. [doi:10.1016/j.jenvp.2016.09.006]
LAIBSON, D. (1997). Golden eggs and hyperbolic discounting. The Quarterly Journal of Economics, 112(2), 443–478. [doi:10.1162/003355397555253]
LAMPERTI, F., Dosi, G., Napoletano, M., Roventini, A., & Sapio, A. (2018). Faraway, so close: Coupled climate and economic dynamics in an agent-based integrated assessment model. Ecological Economics, 150, 315–339. [doi:10.1016/j.ecolecon.2018.03.023]
LIGMANN-ZIELINSKA, A., Kramer, D. B., Spence Cheruvelil, K., & Soranno, P. A. (2014). Using uncertainty and sensitivity analyses in socioecological agent-based models to improve their analytical performance and policy relevance. PLoS One, 9(10), e109779. [doi:10.1371/journal.pone.0109779]
LOEWENSTEIN, G., & Prelec, D. (1992). Anomalies in intertemporal choice: Evidence and an interpretation. The Quarterly Journal of Economics, 107(2), 573–597. [doi:10.2307/2118482]
LORD, C. G., Ross, L., & Lepper, M. R. (1979). Biased assimilation and attitude polarization: The effects of prior theories on subsequently considered evidence. Journal of Personality and Social Psychology, 37(11), 2098. [doi:10.1037/0022-3514.37.11.2098]
MASON, W. A., Conrey, F. R., & Smith, E. R. (2007). Situating social influence processes: Dynamic, multidirectional flows of influence within social networks. Personality and Social Psychology Review, 11(3), 279–300. [doi:10.1177/1088868307301032]
MCQUARRIE, D. A. (2000). Statistical Mechanics. New York, NY: Sterling Publishing Company.
MESOUDI, A. (2016). Cultural evolution: A review of theory, findings and controversies. Evolutionary Biology, 43(4), 481–497. [doi:10.1007/s11692-015-9320-0]
NIAMIR, L., Filatova, T., Voinov, A., & Bressers, H. (2018). Transition to low-carbon economy: Assessing cumulative impacts of individual behavioral changes. Energy Policy, 118, 325–345. [doi:10.1016/j.enpol.2018.03.045]
NIAMIR, L., Kiesewetter, G., Wagner, F., Schöpp, W., Filatova, T., Voinov, A., & Bressers, H. (2020). Assessing the macroeconomic impacts of individual behavioral changes on carbon emissions. Climatic Change, 158(2), 141–160. [doi:10.1007/s10584-019-02566-8]
NICKERSON, R. S. (1998). Confirmation bias: A ubiquitous phenomenon in many guises. Review of General Psychology, 2(2), 175–220. [doi:10.1037/1089-2680.2.2.175]
NIGBUR, D., Lyons, E., & Uzzell, D. (2010). Attitudes, norms, identity and environmental behaviour: Using an expanded theory of planned behaviour to predict participation in a kerbside recycling programme. British Journal of Social Psychology, 49(2), 259–284. [doi:10.1348/014466609x449395]
RAI, V., & Robinson, S. A. (2015). Agent-based modeling of energy technology adoption: Empirical integration of social, behavioral, economic, and environmental factors. Environmental Modelling & Software, 70, 163–177. [doi:10.1016/j.envsoft.2015.04.014]
RAILSBACK, S. F., & Grimm, V. (2019). Agent-Based and Individual-Based Modeling: A Practical Introduction. Princeton, NJ: Princeton University Press.
SAFARZYŃSKA, K., & van den Bergh, J. C. (2022). ABM-IAM: Optimal climate policy under bounded rationality and multiple inequalities. Environmental Research Letters, 17(9), 094022.
SALTELLI, A. (2002). Making best use of model evaluations to compute sensitivity indices. Computer Physics Communications, 145(2), 280–297. [doi:10.1016/s0010-4655(02)00280-1]
SAVIN, I., Creutzig, F., Filatova, T., Foramitti, J., Konc, T., Niamir, L., Safarzynska, K., & van den Bergh, J. (2023). Agent-based modeling to integrate elements from different disciplines for ambitious climate policy. Wiley Interdisciplinary Reviews: Climate Change, 14(2), e811. [doi:10.1002/wcc.811]
SCHALLER, M., & Muthukrishna, M. (2021). Modeling cultural change: Computational models of interpersonal influence dynamics can yield new insights about how cultures change, which cultures change more rapidly than others, and why. American Psychologist, 76(6), 1027. [doi:10.1037/amp0000797]
SCHELLING, T. C. (1969). Models of segregation. The American Economic Review, 59(2), 488–493.
SCHULTZ, P. W., Nolan, J. M., Cialdini, R. B., Goldstein, N. J., & Griskevicius, V. (2007). The constructive, destructive, and reconstructive power of social norms. Psychological Science, 18(5), 429–434. [doi:10.1111/j.1467-9280.2007.01917.x]
SOBOL, I. M. (2001). Global sensitivity indices for nonlinear mathematical models and their monte carlo estimates. Mathematics and Computers in Simulation, 55(1-3), 271–280.
VAN den Bergh, J. C., Savin, I., & Drews, S. (2019). Evolution of opinions in the growth-vs-environment debate: Extended replicator dynamics. Futures, 109, 84–100. [doi:10.1016/j.futures.2019.02.024]
VAN der Werff, E., Steg, L., & Keizer, K. (2013). It is a moral issue: The relationship between environmental self-identity, obligation-based intrinsic motivation and pro-environmental behaviour. Global Environmental Change, 23(5), 1258–1265. [doi:10.1016/j.gloenvcha.2013.07.018]
VAN der Werff, E., Steg, L., & Keizer, K. (2014). I am what I am, by looking past the present: The influence of biospheric values and past behavior on environmental self-identity. Environment and Behavior, 46(5), 626–657. [doi:10.1177/0013916512475209]
WARING, T. M., Kline Ann, M., Brooks, J. S., Goff, S. H., Gowdy, J., Janssen, M. A., Smaldino, P. E., & Jacquet, J. (2015). A multilevel evolutionary framework for sustainability analysis. Ecology and Society, 20(2). [doi:10.5751/es-07634-200234]
WATTS, D. J., & Strogatz, S. H. (1998). Collective dynamics of “small-world” networks. Nature, 393(6684), 440–442. [doi:10.1038/30918]
WYNES, S., & Nicholas, K. A. (2017). The climate mitigation gap: Education and government recommendations miss the most effective individual actions. Environmental Research Letters, 12(7), 074024. [doi:10.1088/1748-9326/aa7541]
YI, R., Gatchalian, K. M., & Bickel, W. K. (2006). Discounting of past outcomes. Experimental and Clinical Psychopharmacology, 14(3), 311. [doi:10.1037/1064-1297.14.3.311]