Can a Single Line of Code Change Society? Optimizing Engagement in Recommender Systems Necessarily Entails Systemic Risks for Global Information Flows, Opinion Dynamics and Social Structures

,
and
aCNRS, France; bEHESS, CNRS, France; cCNRS, Complex Systems Institute of Paris IdF, France; * these authors contributed equally;
Journal of Artificial
Societies and Social Simulation 27 (1) 9
<https://www.jasss.org/27/1/9.html>
DOI: 10.18564/jasss.5203
Received: 15-Apr-2023 Accepted: 01-Nov-2023 Published: 31-Jan-2024
Abstract
As the last few years have seen an increase in both online hostility and polarization, we need to move beyond the fact-checking reflex or the praise for better moderation on social networking sites (SNS) and investigate their impact on social structures and social cohesion. In particular, the role of recommender systems deployed by Very Large Online Platforms (VLOPs) such as Facebook or Twitter has been overlooked. This paper draws on the literature on cognitive science, digital media, and opinion dynamics to propose a faithful replica of the entanglement between recommender systems, opinion dynamics and users' cognitive bias on SNSs like Twitter that is calibrated over a large scale longitudinal database of tweets from political activists. This model makes it possible to compare the consequences of various recommendation algorithms on the social fabric, to quantify their interaction with some major cognitive bias. In particular, we demonstrate that the recommender systems that seek to solely maximize users' engagement necessarily lead to a polarization of the opinion landscape, to a concentration of social power in the hands of the most toxic users and to an overexposure of users to negative content (up to 300% for some of them), a phenomenon called algorithmic negativity bias. Toxic users are more than twice as numerous in the top 1% of the most influential users than in the overall population. Overall, our results highlight the systemic risks generated by certain implementations of recommender systems and the urgent need to comprehensively identify implementations of recommender systems harmful to individuals and society. This is a necessary step in setting up future regulations for systemic SNSs, such as the European Digital Services Act.Introduction
In January 2018, Facebook announced a change in its news feed, a recommender systems which is the main information source of its 2.2 billion users. The aim was to favor content that generates the most engagement: shares, comments, likes, etc. Unfortunately for the public debate, research in psychology shows that such content is, on average, more negative, a phenomenon called negativity bias (Rozin & Royzman 2001). The effects of this change are not long in coming. According to leaked internal Facebook documents (Hagey & Horwitz 2021; Zubrow 2021), exchanges between users have since then become more confrontational and misinformation more widespread. Meanwhile, the political polarization of the users increased due to the platform (Allcott et al. 2020). These changes were so radical and profound that both journalists and political parties felt forced to "skew negative in their communications on Facebook, with the downstream effect of leading them into more extreme policy positions".
This increase in polarization and hostility in on-line discussions has been observed on other Very Large Online Platforms (VLOP, as defined by the European Digital Services Act1). On Twitter for example, where user’s home timeline is by default governed by a recommender system since 2016 the proportion of negative tweets among French political messages raised from 31% in 2012 to more than 50% in 2022 (Mestre 2022). It has also been demonstrated (Vosoughi et al. 2018) that falsehood diffuses "significantly farther, faster, deeper, and more broadly than the truth" on this platform while having the strongest echo chamber effect (Gaumont et al. 2018), and consequently the stronger polarization effect.
Can changing few lines of code of a global recommender system qualitatively change human relationships and society as a whole? To what extent social media recommender systems are changing the structure of online public debates and social group formation processes on a global scale? These are fundamental questions for the sanity of our democracies at a time when polarization in on-line environments is known to spill-over off-line (Doherty et al. 2016). Moreover, at a time where countries like the European Union start to regulate the sector of digital services2 a scientific answer to these questions is more necessary than ever to implement evidence-based policies.
Previous studies have explored the societal impact of on-line social networking sites (SNSs) such as the impact of recommender systems on on-line social groups formation (Ramaciotti Morales & Cointet 2021; Santos et al. 2021), on-line social networks polarization (Tokita et al. 2021) or the impact of networks topologies on opinions dynamics (Baumann et al. 2020). But the impact of recommender systems on the coupling between opinion dynamics and social network formation is hardly addressed in literature. Moreover, when addressed, its estimation is rarely based on empirical data.
This paper fills this gap and provides a methodological framework that takes into account the entanglement between personalized recommender systems, human cognitive bias, opinion dynamics and social networks evolution while calibrating most parameters on empirical data. This framework makes it possible to explore the consequences of different recommendation system designs on the social fabric, and to quantify their interaction with certain major cognitive biases.
As a case study, we apply this methodological framework to a Twitter-like social network model calibrated with real big data from Twitter. We build a state-of-the-art opinion dynamics model and perform an empirical calibration and empirical validation of different components of this framework on a 500M political tweets database, published between 2016 and 2022. Next, we illustrate the impact of recommender systems on society by comparing four differently designed recommender systems based on behavioral, opinion, and network models calibrated on our Twitter data. Perspectives are given to extend this approach to other types of social networks.
This case study highlights the role of human cognitive biases and of the characteristics of new digital environments in the self-reinforcement processes that fragment opinion spaces and distort to a large extent Internet users’ perception of reality.
In particular, we show that, as soon as users have a slight negativity bias, recommendation systems that seek only to maximize user engagement exacerbate the polarization of opinions, concentrate social power in the hands of the most toxic users and lead to a systemic overexposure to negativity, a phenomenon called algorithmic negativity bias (Chavalarias 2022).
State-Of-The-Art
This paper bridges two distinct domains of research, opinion dynamics modeling on the one hand, and application of recommendation algorithms to social media on the other. In order to analyze the interactions between these two major fields of research, we carried out a bibliographical analysis of each of them using GarganText3 (Delanoë & Chavalarias 2023); and applied the methodology described in Chavalarias et al. (2021) to reconstruct the evolution of the research on opinion dynamics.
We took the Web of Science (WoS) as our reference bibliographic database4 and extracted titles and abstracts of published papers related to the following two queries:
- \(Q1\): "Opinion dynamics". 1,872 publications extracted on 2023-06-10,
- \(Q2\): ("recommender systems" OR "content recommendation") AND (Twitter OR facebook OR "social network" OR "online social media"). 1,267 publications extracted on 2023-06-11.
Opinion dynamics litterature
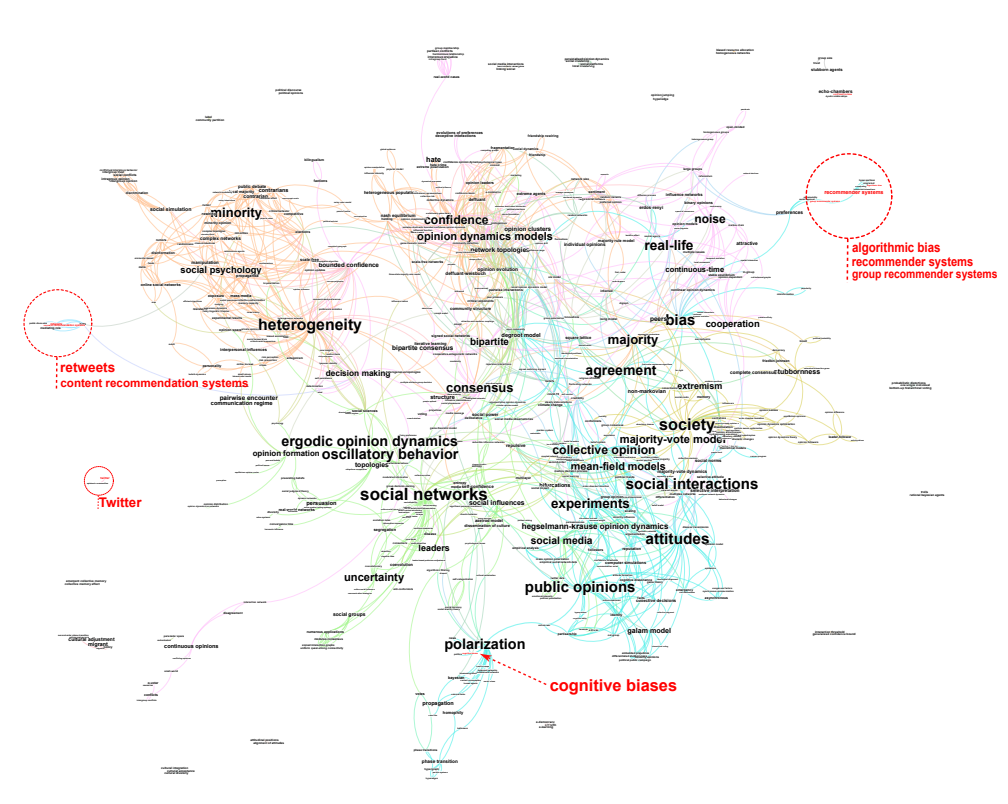
The literature on opinion dynamics is part of a more general field of research concerned with the study of social dynamics and collective behavior in the presence of social influence. This field comprises at least two distinct epistemic communities: an epistemic community mainly made up of mathematicians, computer scientists and physicists, which recognizes itself around the question of modeling opinion dynamics; and a community mainly made up of political scientists and game theorists, which recognizes itself around the question of modeling the evolution of preferences, beliefs and representations, phenomena grouped together under the name of cultural evolution. The modeling approaches of these two epistemic communities sometimes overlap. For example, Axelrod’s model of Dissemination of Culture (Axelrod 1997) can be reinterpreted in the semantics of opinion dynamics modeling as a population with discrete opinions in a multidimensional space, and a probability of interaction that is all the greater the more similar the agents are in terms of their traits. Although our paper is also relevant to the field of cultural evolution, we have focused our bibliometric analysis on the opinion dynamics epistemic community, which is the one with the strongest interactions with the recommender system community. The map of this research landscape is given Figure 3.
Pioneering research into the modeling of opinion dynamics stemmed from stochastic systems theory (DeGroot 1974; Holley & Liggett 1975). For example, DeGroot (1974) assumes that the opinion of an agent, which is modeled as a vector in a continuous space, is linearly influenced by all the others, which brings the problem back to the study of Markov chains. This static linear influence is however not realistic, as demonstrated for example by our case study on political opinions (cf. 5.11): the influence between two people tends to depend on their distance in the opinion landscape and thus cannot be approximated by a static linear combination of others’ opinions.
More sophisticated models for social influence, that can be assimilated to fusion processes, has since been introduced (see Dong et al. 2018 for a review). One of the most popular type of fusion processes, the bounded confidence model (Deffuant et al. 2000; Hegselmann & Krause 2002), echoes the famous confirmation bias in psychology (Klayman 1995) and stipulates that an agent is only influenced by agents whose opinion is sufficiently close to its own.
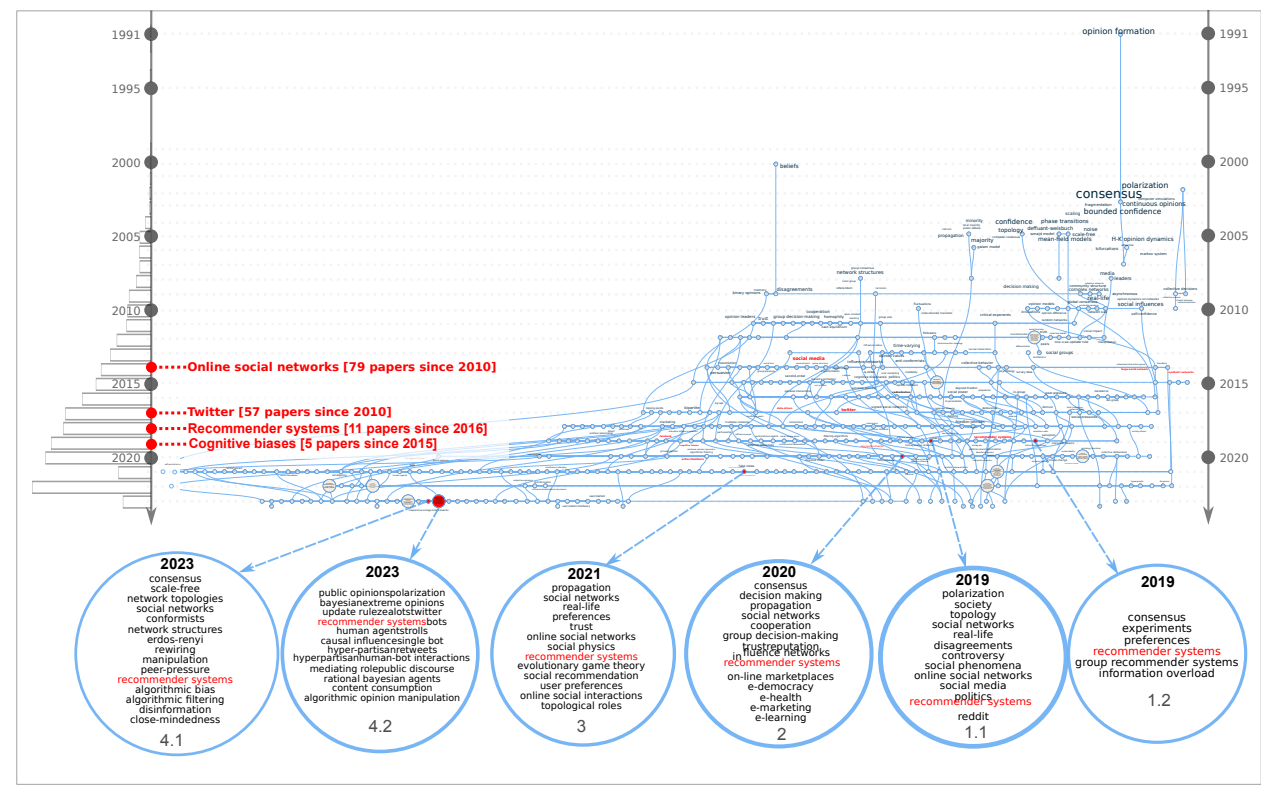
The bounded confidence and interaction threshold models gave birth to a large number of variations around concepts that can be spotted on the scientific landscape (Figure 1): different kinds of spatial embeddings, heterogeneous agents with regards to thresholds, confidence bound or time scales, multidimensional opinions, introduction of stubborn or contrarian agents, introduction of noise in the perception or action of the agents, etc. This effervescence of models can also be seen in the reconstruction of the evolution of this field with phylomemies (Figure 2), i.e., the year by year extraction of sub-domains and reconstruction of their lineage (Chavalarias et al. 2021). The many ramifications of this phylomemy stemming from the continuous introduction of new concepts and new combinations of concepts, underline the vitality of this field of research.
While these sophistications have been fruitful in illustrating phenomena such as consensus formation, polarization or fragmentation of public space, they remain for the most part on the theoretical plane, as do the majority of articles on social simulation (Troitzsch 2017). Until recently, this lack of empirical grounding was mainly due to the difficulty of characterizing opinion and interactions between users at scale. This situation is beginning to change with the advent of web-based social big data and the development of social mining methods. However, calibrating and testing opinion dynamics models on data is still considered as "hard" (see Peralta et al. 2022 for a review).
When it comes to the impact of recommender systems on opinion dynamics, research is even more at an emerging stage, with for example, only eight papers in the WoS matching the query "opinion dynamics" AND ("recommender systems" OR "content recommendation" OR recommenders), the oldest paper dating from 2015. Expression associated to this research are both on the periphery of the research landscape (Figure 1) and emerging in the phylomemy (Figure 2).
Before reviewing this tiny literature, it is worth mapping the entire literature on recommendation systems applied to social media in order to better qualify its interactions with the literature on opinion dynamics.
Recommender systems and social media litterature
The query ("recommender systems" OR "content recommendation") AND (Twitter OR Facebook OR "social network" OR "online social media") in the WoS identifies 1,267 papers, the oldest of which dates back to 2004, the year Facebook was founded. We can clearly see on the mapping of this literature (Figure 3) that it is mainly focused on a user-centric approach of recommender systems with the goal of either mitigating information overload, optimizing information retrieval or maximizing sales. Very little attention has been paid to the impact of these recommendation systems at the collective level, apart from the question of the diversity of products and content recommended.
The questions addressed in this literature focus mainly on predicting users’ behavior, improving the accuracy of the recommendations, build scalable algorithms, optimally use diverse user’s features like geolocalization or popularity, strengthen confidence in the recommendation system and between users, cold-start a recommendation system.
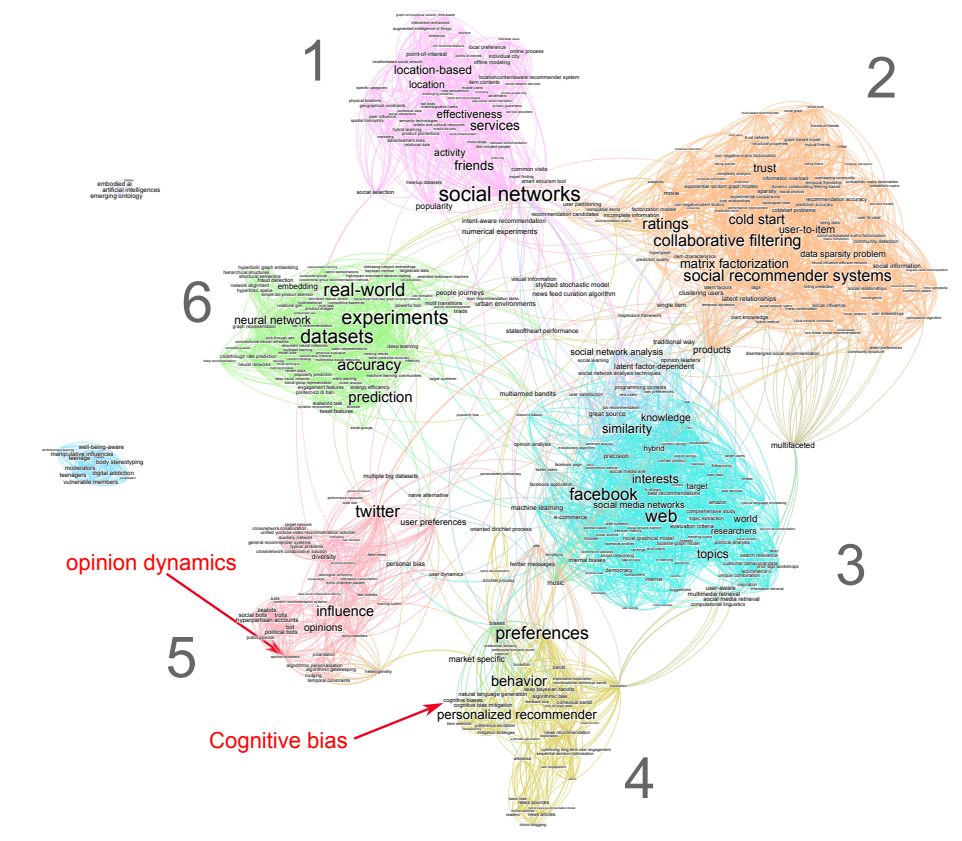
As we saw in the previous section, the question of the interaction between opinion dynamics and recommendation systems is a fairly recent one and appears on the periphery of the maps. It was first approached from the angle of improving recommendation systems performances (Castro et al. 2017; Jiang et al. 2015), e.g., rating predictions or adopting a broader point of view than that of the individual with group recommendation (Figure 3, topic 3). Later studies (Weng et al. 2023; Xiong et al. 2020) have developed finer models of opinion dynamics inside the recommender systems for the same purpose of evaluating rating predictions. They do not address the collective consequences of recommender systems on real-world opinion dynamics.
An other approach mixing recommender systems and opinion dynamics analyzes how these former can be manipulated by bots to influence social media users (Figure 3, topic 5). Pescetelli et al. (2022) have demonstrated that bots can shape public opinion indirectly, even without direct human-bot interaction, thanks to their influence on the very workings of a recommendation system. They examine the influence of these entities on shifting average population opinions and manipulating recommendation algorithms’ internal representations.
Recommender systems can also impact opinion dynamics through algorithmic personalization and filtering (Figure 3, topic 2). Cinus et al. (2022) have explored how different filtering algorithms employed by recommender systems can impact the formation of echo chambers, polarization, and the sharing of opinions within social networks while Perra & Rocha (2019) have simulated the interaction between opinion dynamics and recommenders on a simplified model with only 2 opinions. Rossi et al. (2022) demonstrated on simplistic opinion dynamics that "personalized recommendations typically drive users toward more extreme opinions." Symmetrically, Musco et al. (2018) have investigated how social recommender systems can be designed to mitigate polarization by making link recommendation.
(Sîrbu et al. 2019) have explored the impact on opinion distribution and polarization (Figure 3, topic 4) of a recommender systems that would make users, who change their opinion according to a bounded confidence model, to interact according to their opinion proximity (Figure 3, topic 4).
To conclude this literature review, of the dozen or so published articles referenced by the article databases that deal with the impact of recommender systems on the dynamics of opinions, only six address the collective effects of recommender systems on the distribution of opinions and/or the structure of social interactions.
To emphasize the contribution of this article in relation to this previous research, we have identified several features that a modeling approach should include to fully answer our research question, particularly in the case of recommender systems that learn from their users, as is the case for most systems in production. Table 1 summarizes how our paper compares with previous ones. Here are the features that we looked in each of those papers:
- Opinion distribution analysis. Analysis of the impact of recommender systems on opinion distribution.
- Learning recommender. One of the recommender studied in the paper is learning form user’s interactions with contents (similar to the rule of maximazing user’s engagement promoted by Facebook and other large online social networks).
- Recommendation based on content characteristics. Study of the effect of content recommendation on opinion dynamics by attributing different features to content circulating within the social network.
- Characterization of impact on information circulation. Among the papers that attribute different characteristics to information items, characterization of the qualitative effect of recommender systems on the distribution of these characteristics at global scale (e.g., toxic context overexposure or a global bias toward a particular political opinion). This evaluation is relevant only in case of recommendation based on content characteristics.
- Evolving network. Study of how networks are shaped by recommender systems through link recommendation and/or how users create and prune links to reduce dissonance between the content they receive and their opinion.
- Characterization of the structural effect. Characterization of the structural effect of recommender systems in terms of social network structure (who is connected with who, modularity, etc.). This evaluation is relevant only in case of evolving networks.
- Integrate biases. Integration of cognitive biases in the modeling of the agents decisions (other than the ubiquitous confirmation bias in opinion dynamics literature).
- Parameters calibration on empirical data. Calibration of model parameters on the data.
- Real-world opinion initialization. Initialization of the simulations with real-world opinions.
- Real-world networks initialization. Initialization of the simulations with real-world networks.
- Realistic fusion process. Evaluation of the chosen fusion process (opinion update rule) against real-world data.
- Validation of model predictions on empirical data. Comparison between the model’s prediction in terms of opinion dynamics and actual data.
- Long term evolution with synthetic graphs and counter-factual. Study with synthetic networks of the capacity of the model to reproduce the morphogenesis of real-world network or to produce other patterns in other conditions than those of real-networks.
- Characterization of the opinion distribution Study of the nature of opinion distribution with regard to communities (e.g., opinion diversity within communities)
- Recommenders comparison. Comparative study of different implementations of recommendation systems.
| This paper | (Musco et al. 2018) | (Perra & Rocha 2019) | (Sîrbu et al. 2019) | (Rossi et al. 2022) | (Cinus et al. 2022) | (Pescetelli et al. 2022) | |
|---|---|---|---|---|---|---|---|
| 1.Opinion distribution analysis | ✔ | ✔ | ✔ | ✔ | ✔ | ✔ | ✔ |
| 2. Learning recommender | ✔ | ✕ | ✕ | ✕ | ✕ | ✔ | ✔ |
| 3. Contents features | ✔ | ✕ | ✕ | ✕ | ✕ | ✕ | ✕ |
| 4. Information circulation assessment | ✔ | ✕ | - | - | - | - | - |
| 5. Evolving network | ✔ | ✔ | ✕ | ✕ | - | ✔ | ✕ |
| 6. Structural effect | ✔ | ✔ | - | - | - | ✔ | - |
| 7. Specific biases | ✔ | ✕ | ✕ | ✕ | ✕ | ✕ | ✔ |
| 8. Empirical data calibration | ✔ | ✕ | ✕ | ✕ | ✕ | ✕ | ✕ |
| 9. Real-world opinion initialisation | ✔ | ✔ | ✔ | ✕ | ✕ | ✕ | ✕ |
| 10. Real-world networks initialisation | ✔ | ✔ | ✔ | ✕ | ✕ | ✕ | ✕ |
| 11. Realistic fusion process | ✔ | ✕ | ✕ | ✕ | ✕ | ✕ | ✕ |
| 12. Test of predictions | ✔ | ✕ | ✕ | ✕ | ✕ | ✕ | ✕ |
| 13. Synthetic graphs | ✔ | ✔ | ✔ | - | ✕ | ✔ | - |
| 14.Recommenders comparison | ✔ | ✕ | ✔ | ✕ | ✕ | ✔ | ✕ |
| Total features covered | 14 | 6 | 5 | 1 | 1 | 6 | 3 |
As we shall see, this paper covers all fourteen of these characteristics, which no model in the current literature does. In particular, none of them is calibrated on empirical data while almost all our initial states and parameters are (cf. Table 2). Moreover, we demonstrate with sensibility analyses that the parameters that cannot be estimated have no consequence on the qualitative results of our model.
As for the consequences of recommender systems on opinion dynamics, while several of them address the issue of polarization, as we do, none addresses the issue of algorithmic negativity bias.
Our model provides both complementary results to the existing literature and new methods for calibrating existing models. It is also worth noting that we demonstrate empirically, at the same time, that the threshold interaction model used by most scholars should be implemented as a decreasing probability of interaction as a function of distance from another’s opinion, rather than as a bounded interval and that the confidence bound models should consider heterogeneous agents.
Framework Description
Let’s model the generic properties of online social networks in order to study the stylized phenomena associated with some of their key features. The detailed characteristics of SNSs varies from one platform to another but they all have some core features in common:
- [Publication] At anytime \(t\), a user \(i\) can publish a message \(m_i^t\),
- [Networking] Each user \(j\) can subscribe to \(i\)’s information diffusion network \(\mathcal{N}_i^d(t)\) (on some social networking sites subscriptions are open, on others they should be agreed by \(i\)).
- [Information] Each user \(i\) can read the messages produced by the set \(\mathcal{N}_i^r(t)\) of accounts they have subscribed to and eventually share them with their own subscribers \(\mathcal{N}_i^d(t)\).
Subscription networks between users of a social networking site can be represented by an evolving directed network \(\mathcal{N}(t)=\cup_i \{\mathcal{N}_i^d(t) \cup \mathcal{N}_i^r(t)\}=\{s_{ij}\}_{i,j}\) in which an edge \(s_{ij}\) exists when the user \(j\) has suscribed to \(i\)’s account (information flows from \(i\) to \(j\)). \(\mathcal{N}\) is the backbone of information circulation on such platforms. Its evolution is generally influenced by a social recommender system that suggests new "friends" to users.
The average number of subscriptions per user being quite high (e.g., \(>300\) on Facebook, \(>700\) on Twitter), most social networking sites implement a content recommender systems that helps any user \(i\) to find "the most relevant" messages among those produced by their social neighborhood \(\mathcal{N}_i^r(t)\). On platforms such as Facebook, Twitter, YouTube, LinkedIn, Instagram or TikTok, these content recommender systems consist of a personalized news feed \(\mathcal{F}_i\) that aggregates "relevant" messages in a stack. They constitute the main source of information for the users of these platforms (e.g., on Youtube the recommender is responsible for 70% of watch time5). Social recommendation and content systems shape users’ opinions through the constraints they place on the global flow of information as well as on the processes of social ties formation. Although being black boxes, we know that these recommender systems learn from the actions of their users according to some very generic objective function.
This being said, in order to model the interaction between human cognition, recommender systems, user’s opinions and social network evolution, we have to model three things:
- [Recommender system] The process of message sorting of news feed by the content recommender system,
- [User’s attention, cognitive bias and opinion dynamics] The user’s motivations to read and share a message, their potential cognitive bias, their opinion and its evolution after exposure to a message,
- [Network evolution] The way users decide to subscribe and unsubscribe to other accounts and the role of the social recommender system in this process.
We will include all these elements in a discrete time model where each time step will correspond to one day of interaction between users. Each of these elements is the object of a research field in its own right, so that it is not a question here of proposing advances on each of these dimensions. We will rather consider the state-of-the-art models for each of them in order to calibrate them on empirical data and study their interactions.
The content recommender system
A content recommender systems has access to a set of users’ characteristics, as for example the number of subscribers per user, the list of the accounts they have subscribed to, the number of shares per message, etc., and a set of messages’ features, as for example their number of shares or their sentiment. From these data, the recommender produces at each time step \(t\) and for each user \(i\) and ordered list of all messages produced by accounts from \(\mathcal{N}^r_i(t)\) to be displayed for reading.
The users
Users are described as entities with an internal state (their "opinion"), some interface with their environments (e.g., read some messages) and a repertoire of actions on the environment (publish a message, share a message, subscribe to a user’s account, etc.). For simplicity, we assume that the opinion dynamics is solely driven by the interactions among users. We will call "agent" this stylized representation of the users.
Users’ opinions
We built on the literature of non Bayesian opinion dynamics modeling (see Noorazar et al. 2020 for a review) and assign to each agent \(i\) at \(t\) an opinion \(o_i^t\) in a metric space \(\mathcal{O}\), and an opinion update function \(\mu_i: \mathcal{O}^2 \rightarrow \mathcal{O}\) that defines its propensity to change its opinion \(o_i\) after reading a message that conveys opinion \(o_j\) of agent \(j\). \(\mathcal{O}\) and \(\mu\) will be estimated empirically.
Users’ online activity
Many cognitive bias are worth to be studied in the perspective of the analysis of recommender systems’ impacts. In this paper, we will focus on two famous bias in psychology: the previously mentioned confirmation bias and the negativity bias (Epstein 2018; Knobloch-Westerwick et al. 2017; Rozin & Royzman 2001) — the propensity to give more importance to negative piece of information. Our aim in focusing on this second bias is to estimate the strength of the algorithmic negativity bias (Chavalarias 2022): the large scale over-exposition to negative contents due to the algorithmic machinery.
To quantify the algorithmic negativity bias effect, we attribute a valence to messages published by the agents, that can be either "negative" or "positive/neutral". Thus, at each time step \(t\), each agent \(i\) publishes \(n_i^p(t)\) new messages, assumed to perfectly reflect they view, and shares \(n_i^s(t)\) read messages authored by other agents. Among the \(n_i^p(t)\) published message, a fraction \(\nu_i^t\) of them are negative.
When scrolling in their timelines, an agents \(i\) is \(Bn_i\) more likely to stop and carefully read negative message than neutral/positive ones, leading to the following rules:
Network evolution
Opinions co-evolve with interaction networks in a feedback loop. The homophilic nature of human interactions indicates that users tend to interact and form relationships with people who are similar to them (McPherson et al. 2001), and cut social ties with people who happen to share content that is not aligned with their views. Besides this, SNSs usually suggest new connexions to users via social recommender systems that are most of the time based on structural similarities (e.g., mutual friends, see Tokita et al. 2021).
We will take into account these factors in a parsimonious yet realistic model of link formation and pruning. The network specifications at initialization of our simulations (connectivity, types of agents, etc.) will be determined empirically.
Links suppression (Rewiring rule 1)
Agents score their subscriptions to monitor the interest they have in maintaining them. For every subscription \(s_{ji}\) of \(i\) to \(j\), the disagreement \(\delta_{ij}(t) \geq 0\) of \(i\) with the content received through \(s_{ji}\) is initialized at \(0\) and updated at each time step according to \(\delta_{ij}(t+1)=\gamma\times \left(\delta_{ij}(t)+n_{ij}^t \lvert o_i^t - o_j^t\rvert\right)\), with \(\gamma<1\) being a daily discount factor and \(n_{ij}^t\) the number of messages read by \(i\) during time step \(t\) that have been authored or relayed by \(j\). If \(s_{ji}(t)=1\) and the disagreement \(\delta_{ij}(t)>\tau\), \(i\) will unsubscribe from \(j\), i.e., \(s_{ji}(t+1)=0\).
\(1/\gamma\) is a characteristic time of agents’ evolution that is difficult to estimate empirically. It will be set arbitrarily to a reasonable value. So will be the \(\tau\) which determination would depend on the knowledge of \(\gamma\). We have verified that our results do not depend on the precise knowledge of these two parameters by making few alternative simumations.
Links formation (Rewiring rule 2)
To maintain the connectivity measured empirically, we assume that when an agent breaks an edge with an unaligned user, it starts following a randomly chosen second neighbors (a rewiring mechanism often observed in SNSs, see Tokita et al. 2021).
Overall, the above defined set of rules allows us to study the feedback loops between the aforementioned cognitive biases and a learning recommender. On the one hand the recommender seeks to maximize the user engagement, on the other hand, the user is more likely to engage with content aligned with their existing belief and/or of negative nature. As a consequence, we can expect the recommender to be more and more biased as it learns users’ bias over time. The extent of these biases still remains to be assessed, however, as do the differences between different implementations of recommendation systems and their effect on the structure of social networks.
Instantiation of a Recommender System: The Example of Twitter
In order to understand the complex relation between the specific choice of a recommender systems and its systemic effects on opinion dynamics and social networks evolution, we apply thereafter the above described framework to the modeling of political opinion dynamics on Twitter. Passing, we find realistic parameter values that could be used to model the impact of other SNSs recommender systems.
At the time of the study, Twitter’s data availability, its widespread use — more than \(300\) millions of monthly active users worldwide— and its predominant role in political communication justify our choice to use it as our experimental field for testing the proposed framework. Moreover, as measured empirically, Twitter is also a digital media where negative contents are more viral than others (see Figure 24) and where the users themselves are biased towards the production of negative contents (see Figure 21). This raises the important question, both for public debate and for the well-being of users, of the extent to which this overflow of negativity is due to Twitter’s algorithmic architecture.
Briefly, Twitter is an online social network launched in 2006 allowing its users to exchange publicly 280 characters-long messages that are broadcasted to theirs "followers", users who subscribed the author’s account. Content is displayed to the users on a feed called Home timeline according to personalized recommendations. The messages are ranked by a machine learning algorithm predicting the likelihood the user will engage with the tweet. In the following, we will focus on the two main forms of engagement on Twitter (Twitter 2020): (1) the careful read of a tweet – which may requires a click to expand the content – (2) the retweet, i.e., the fact of republishing the message identically with the mention of its author, without any comment nor modification.
Despite that social influence extents well beyond retweet, empirical studies observed that retweets are more relevant to characterize people’s opinion and monitor its evolution, at least in a political context, than, for example, Twitter mentions (Conover et al. 2011; Garimella et al. 2018). It is indeed possible to predict with high accuracy the political orientations of political activists from their retweet data only (Gaumont et al. 2018). In what follows, the empirical applications of our framework will focus on retweets networks.
Choice of a recommender system
Several leaks as well as official announcements suggest that many social networking sites use the users’ engagement maximization as the objective function for their recommender systems. We will thereafter analyze the consequences of such objective functions on the social fabric.
Due its flexibility and efficiency, we implemented this optimization through XGBoost algorithm (Chen & Guestrin 2016).
Recommender systems fulfill their objectives by relying on certain inputs. Modeling such algorithm should thus define some type of data it has access to. The variety of input data used by commercial recommender systems is part of the domain of business secrecy such that little is known about which input data are really used. We will here select two broad categories of data that are likely to be used by commercial recommenders (cf. Xu & Yang 2012; Huszár et al. 2022):
- Sentiment analysis: the negative or positive/neutral nature of a tweets, as well as the proportion of negative content retweeted by the user in the past.
- Popularity assessment: the popularity of the tweet’s author i.e., average number of retweets to its messages, the number of time the message has been retweeted and the frequency at which the user retweets the author.
In order to investigate the consequences of the different input features, we will compare three different implementations of the recommender :
- Neg: use only input data from sentiment analysis,
- Pop: use only input data from popularity scores,
- PopNeg: use the combined features of the Neg and Pop algorithms.
To assess the effect of these three implementations of recommender systems on the social fabric, we will compare them to a neutral recommender systems, the reverse-chronological presentation of content, thereafter call Chrono. Chrono is often referred as non-algorithmic recommendation due to its simplicity.
Empirical Calibration
In this section, we fully calibrate our model using empirical data regarding French politics, collected on Twitter in autumn 2021 within the Politoscope project (Gaumont et al. 2018), a social macroscope for collective dynamics on Twitter. The summary of parameters calibration is given in Table 2. The Politoscope continuously collects since 2016 political tweets about French politics and makes it possible to select subsets of the most active users over any given period.
| Parameter | Description | Calibrated |
|---|---|---|
| \(\mathcal{O}\) | The metric space for opinions | ✔ (Figure 11) |
| \(\mathcal{N}^r(0)\&\mathcal{N}^d(0)\) | Initial state of information diffusion network (estimated with retweet network) | ✔ (Figure 11) |
| \(\boldsymbol{o}_i\) | Initial opinion of agent \(i\) in \([-1, +1]\) | ✔ (Figure 12) |
| \(\boldsymbol{NegBias}_{i}\) | \(\dagger\) Negativity bias for agent \(i\) | ✔ (Table 4) |
| \(\boldsymbol{\mu}_i\) | Functional form of the fusion process (opinions update) | ✔ (cf. Appendix) |
| \(\Delta_{op}\) | \(\ddagger\) Threshold & latitude of acceptance | ✔ (Figures 6 & 20) |
| \(\boldsymbol{\lambda}_i\) | Opinion update parameter for agent \(i\) | ✔ (Figure 13) |
| \(\boldsymbol{\theta}_i^{p}\) | Daily rate of publishing tweets for agent \(i\) | ✔ (Figure 18) |
| \(\boldsymbol{\theta}_i^{s}\) | Daily rate of publishing retweets for agent \(i\) | ✔ (Figure 18) |
| \(\boldsymbol{\nu}_i\) | Proportion of negative published tweets for agent \(i\) | ✔ (Figure 21 & 22) |
| \(\gamma\) | \(\star\) Discount factor on links disagrement scoring | alt. simulations check |
| \(\tau\) | \(\star\) Threshold for prunning dissonant links | alt. simulations check |
Network of users’ interactions
While accessing Twitter’s graph of followees-followers is possible through Twitter API, such a graph would be misleading if used in our model. Indeed, the content recommender effectively used on Twitter is already well trained, content from someone followed may never be shown to the user, distorting our simulation. To circumvent this limitation, we instead consider the empirical network \(\tilde{\mathcal{N}}\) of retweets and quotes combined. Such a network seems indeed to be a reasonable proxy to what is actually shown to the user by the platform. Considering quotes, and not only retweets, allows to include ideologically unaligned content as discussed below. Each of our simulations was initialized over the empirical network \(\tilde{\mathcal{N}}\) of interactions over the selected period.
Calibration of opinion space
We will henceforth understand the term "opinion" as an ideological positioning within the political arena, excluding de-facto political agnostics. Not all candidates having the same digital communication strategy, we will include in what follows only leaders having a significant presence on Twitter during the considered period.
The reconstruction of opinion spaces from SNSs data has been a very active field of research these last several years, with reconstructions in one (Barberá 2015; Briatte & Gallic 2015), two dimensional spaces (Chomel et al. 2022; Gaumont et al. 2018) or even in spaces with variable dimensions (Reyero et al. 2021). As for retweet networks, retweeting someone on a recurring basis has been demonstrated to be an indicator to some ideological alignment (Conover et al. 2011; Garimella et al. 2018; Gaumont et al. 2018).
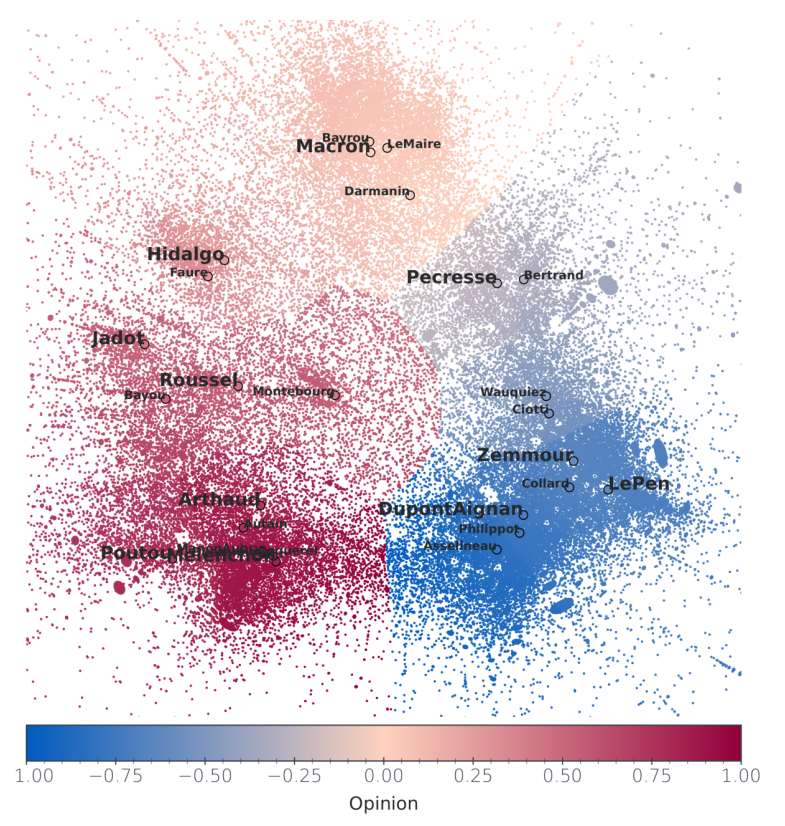
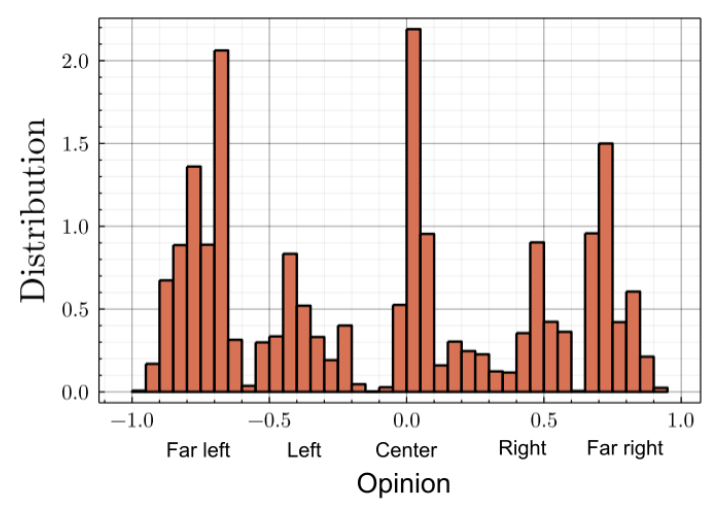
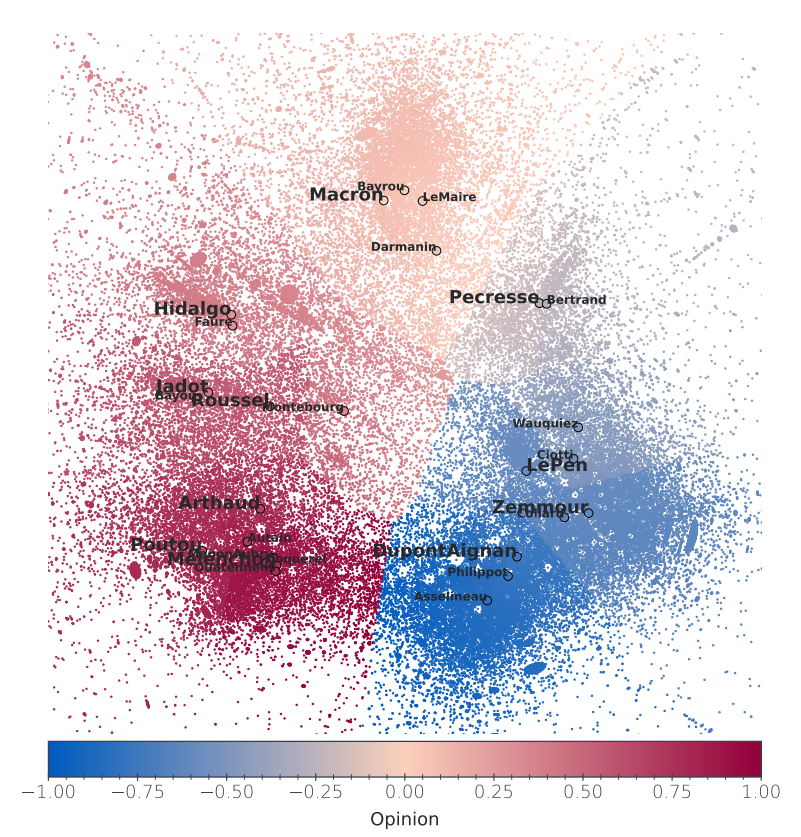
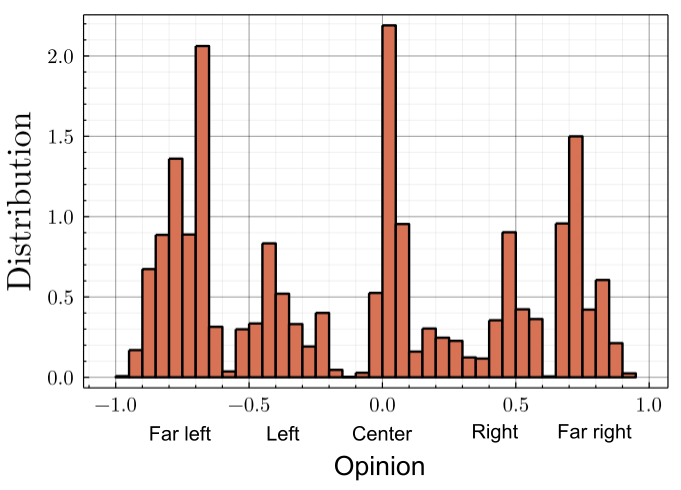
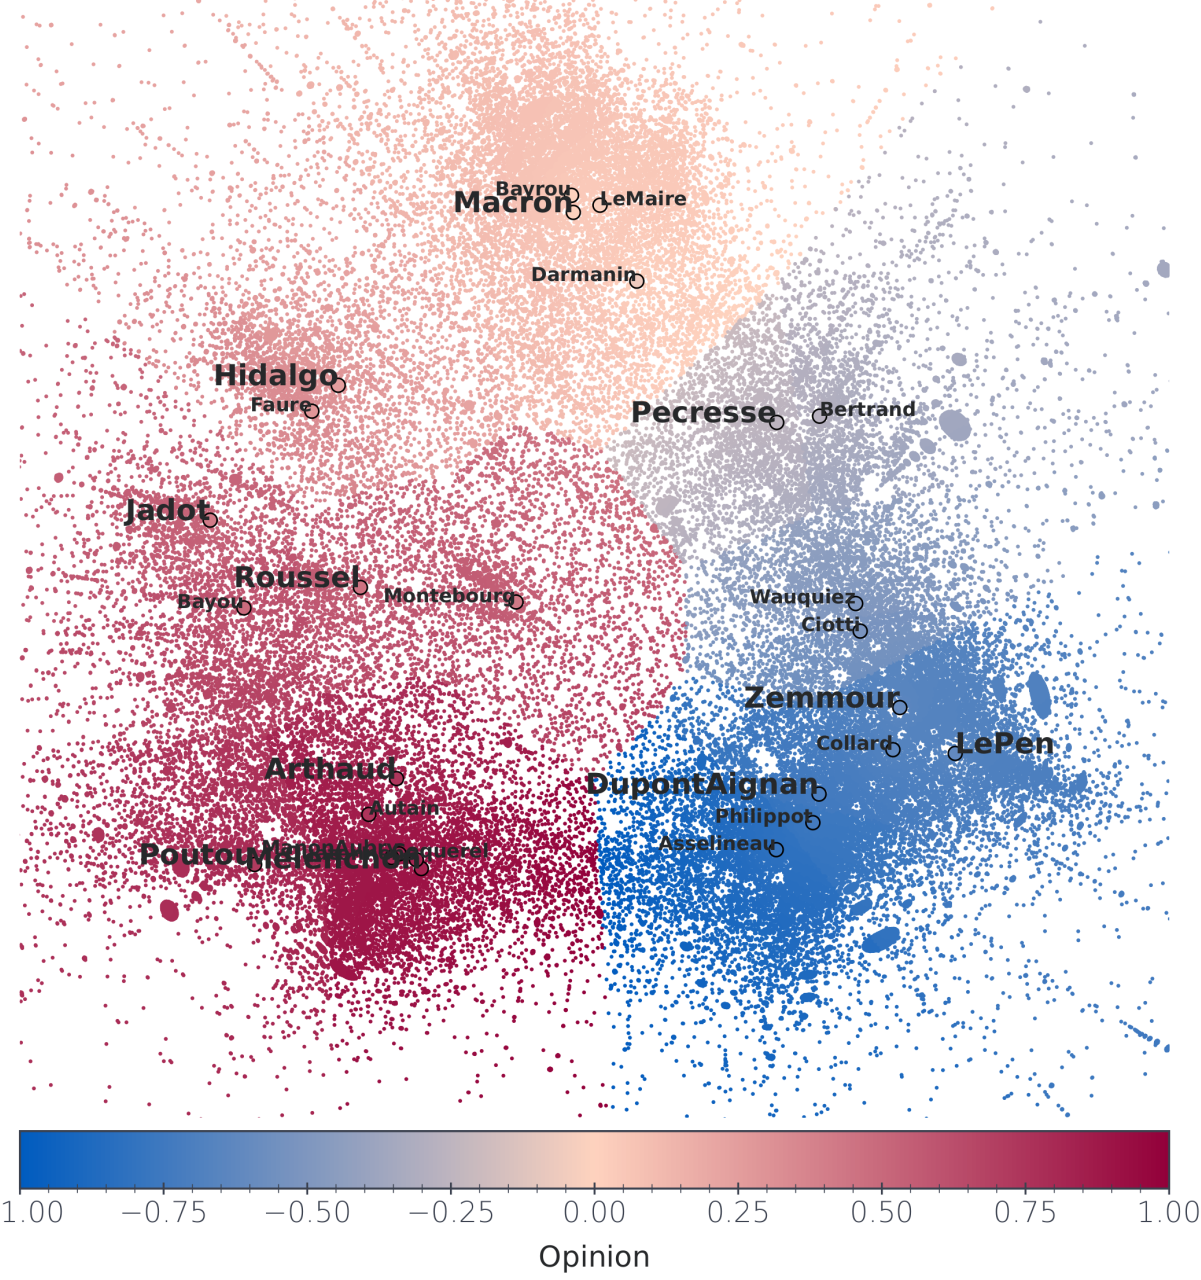
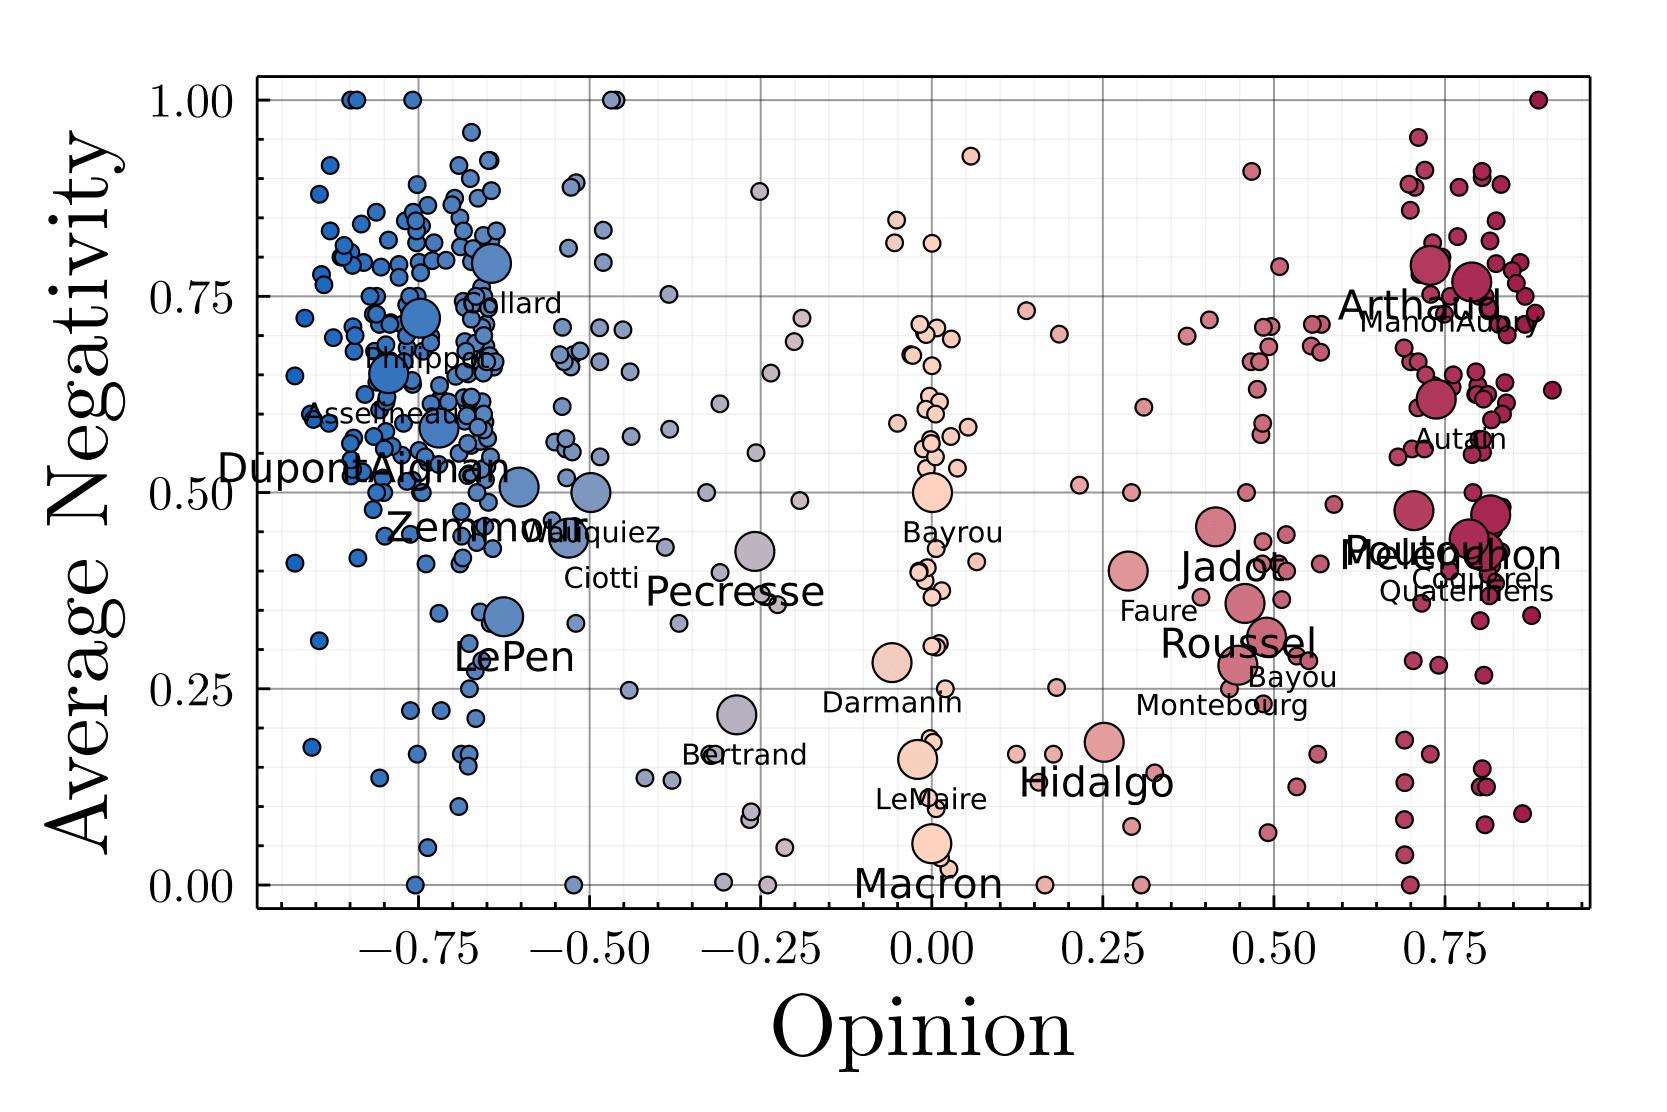
With a clustering analysis of political retweet graphs, Gaumont et al. (2018) achieved \(95\%\) accuracy over opinion’s classification, validating the use of the retweet graph for such a study6. The spatialization of the Politoscope retweet graph of autumn 2021 depicts a multi-polar circular political arena (cf. Figure 4) where the relative positions of the political leaders are in adequacy with the publicly depicted political scene. As discussed in SI.1, we used this spatialization to model the opinion space \(\mathcal{O}\) as a circular one dimensional metric space with \(o_i \in ]-1,+1]\), making it possible to initialize the opinion of our agents in \(\tilde{\mathcal{N}}\) with their empirical estimation (cf. Figure 5), compute the impact of the recommender’s suggestion on user’s opinion, and determine the global impact of different recommender systems on the distribution of the users’ opinions in \(\mathcal{O}\).
Calibration of agents’ opinion update
Having a metric space for the opinion space, we can build on the sizable literature on opinion dynamics (Deffuant et al. 2000; Jager & Amblard 2005; Noorazar et al. 2020). Thanks to the full history of user’s interaction from our Twitter dataset, and assuming for the sake of simplicity that the functional form of \(\mu\), the opinion update function, is the same for all agents, we determined the most likely \(\mu\) using symbolic regression. The regression was performed using genetic algorithms (Fortin et al. 2012) over the set \(\mathcal{F}\) of arithmetic and trigonometric functions7 as well as an implementation of the difference in the periodical opinion space.
The output of the empirical calibration is a linear function of opinion updating \(o_i^{t+1}\leftarrow o_i^t + \lambda_i(o_j^t - o_j^t)\) with \(\lambda_i \in \mathbf{R}\). We have thus demonstrated incidentally that this linear function, already widely used in the literature on opinion dynamics (Deffuant et al. 2000; Jager & Amblard 2005), is the one that best fits the empirical data among the set \(\mathcal{F}\) when assuming an homogeneous functional form for the opinion fusion process.
Because of our lack of information on tweets’ impression and given our opinion attribution method, we have decided to simplify the model by assuming that agents change their their opinion, i.e., ideological positioning, only when they retweet a message.
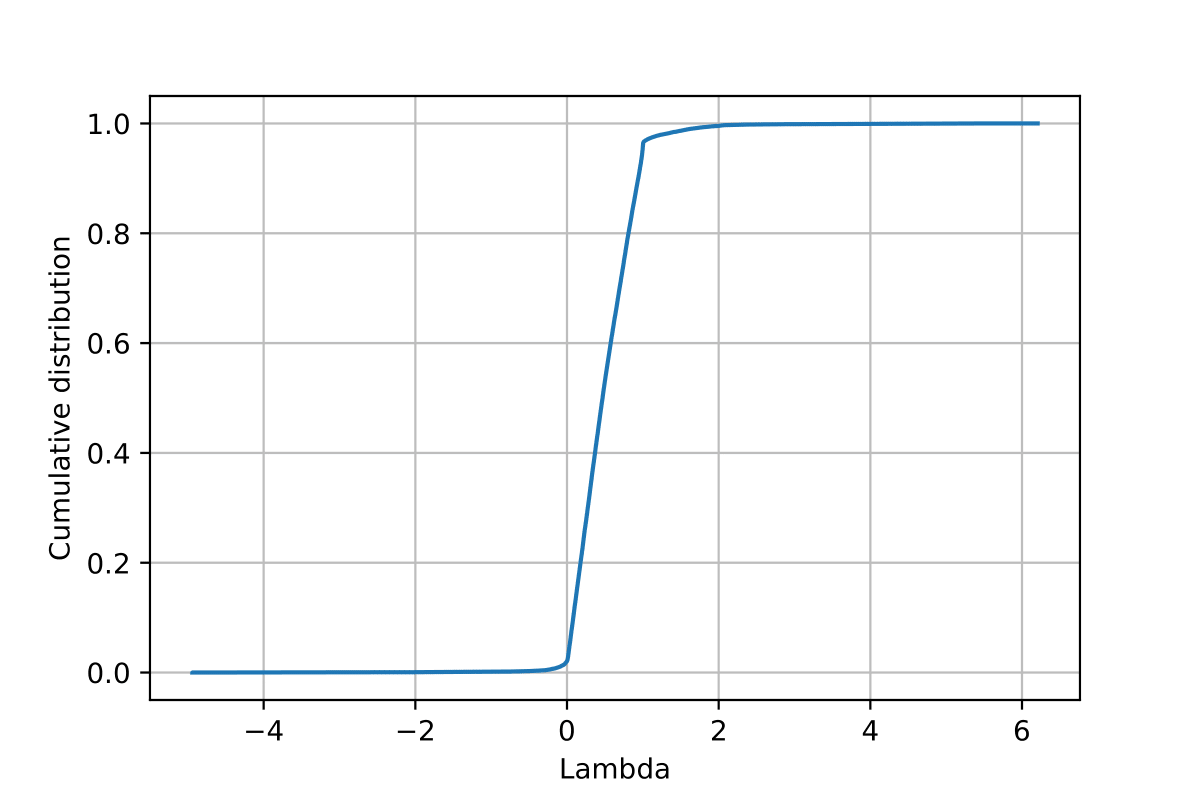
Then, we fitted for each agent the opinion update parameter \(\lambda_i\), which the absolute value reflects the influenceability of the agent, i.e., to what extent will they change opinion when retweeting someone else, using the list of daily messages effectively retweeted by the user (see the Appendix and Figure 13). This empirical calibration has led us to model a heterogeneous population with regard to the propensity to be influenced by others, and in passing constitutes a first data set for calibrating heterogeneous population models with regard to agents’ sensitivity to social influence.
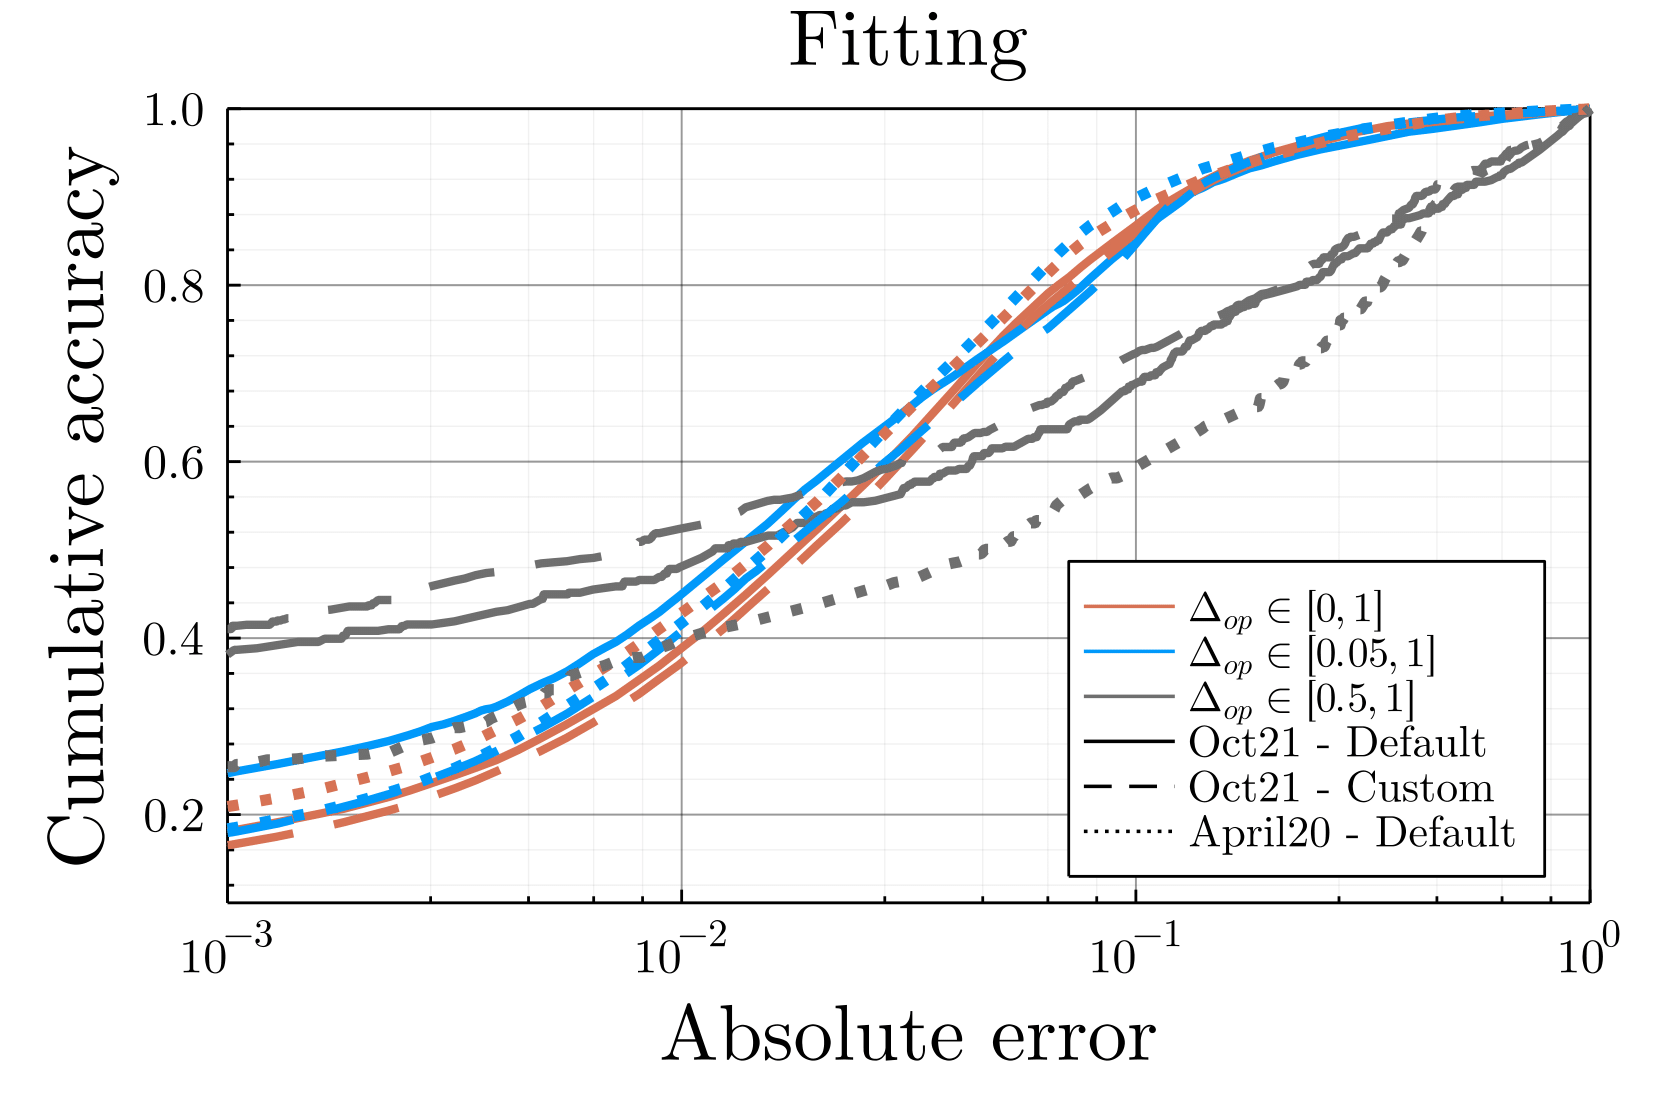
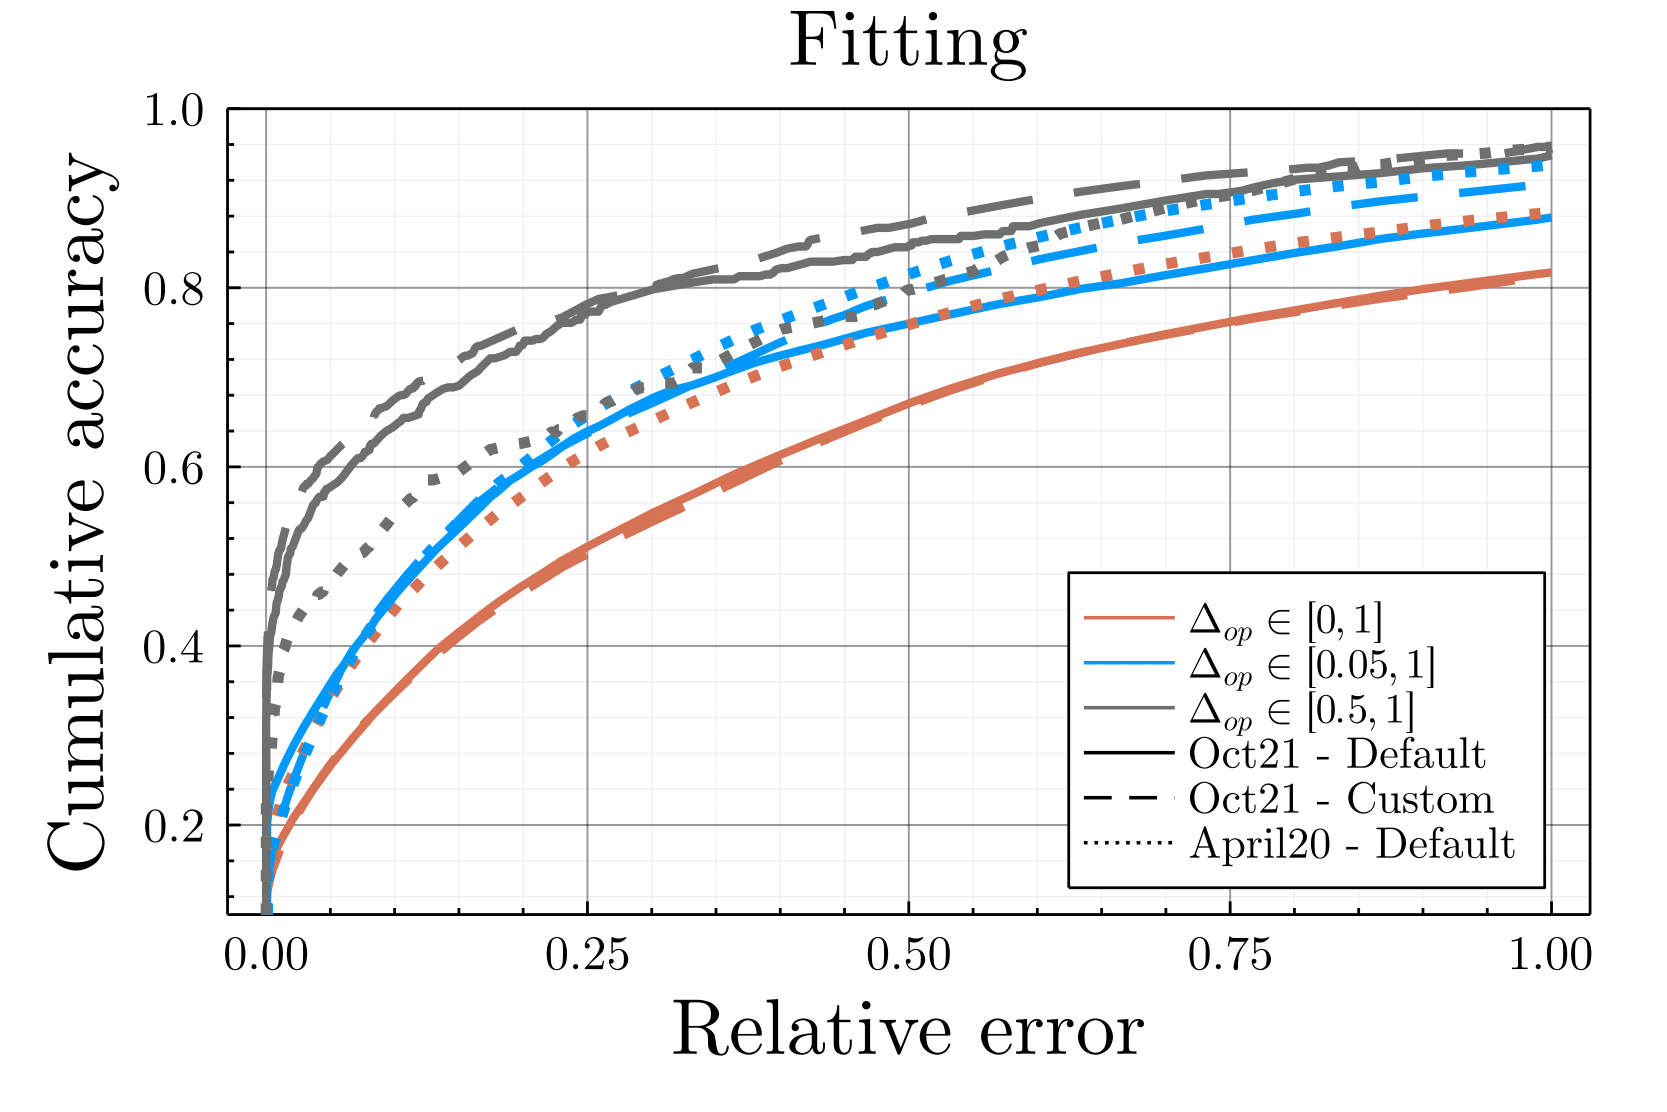
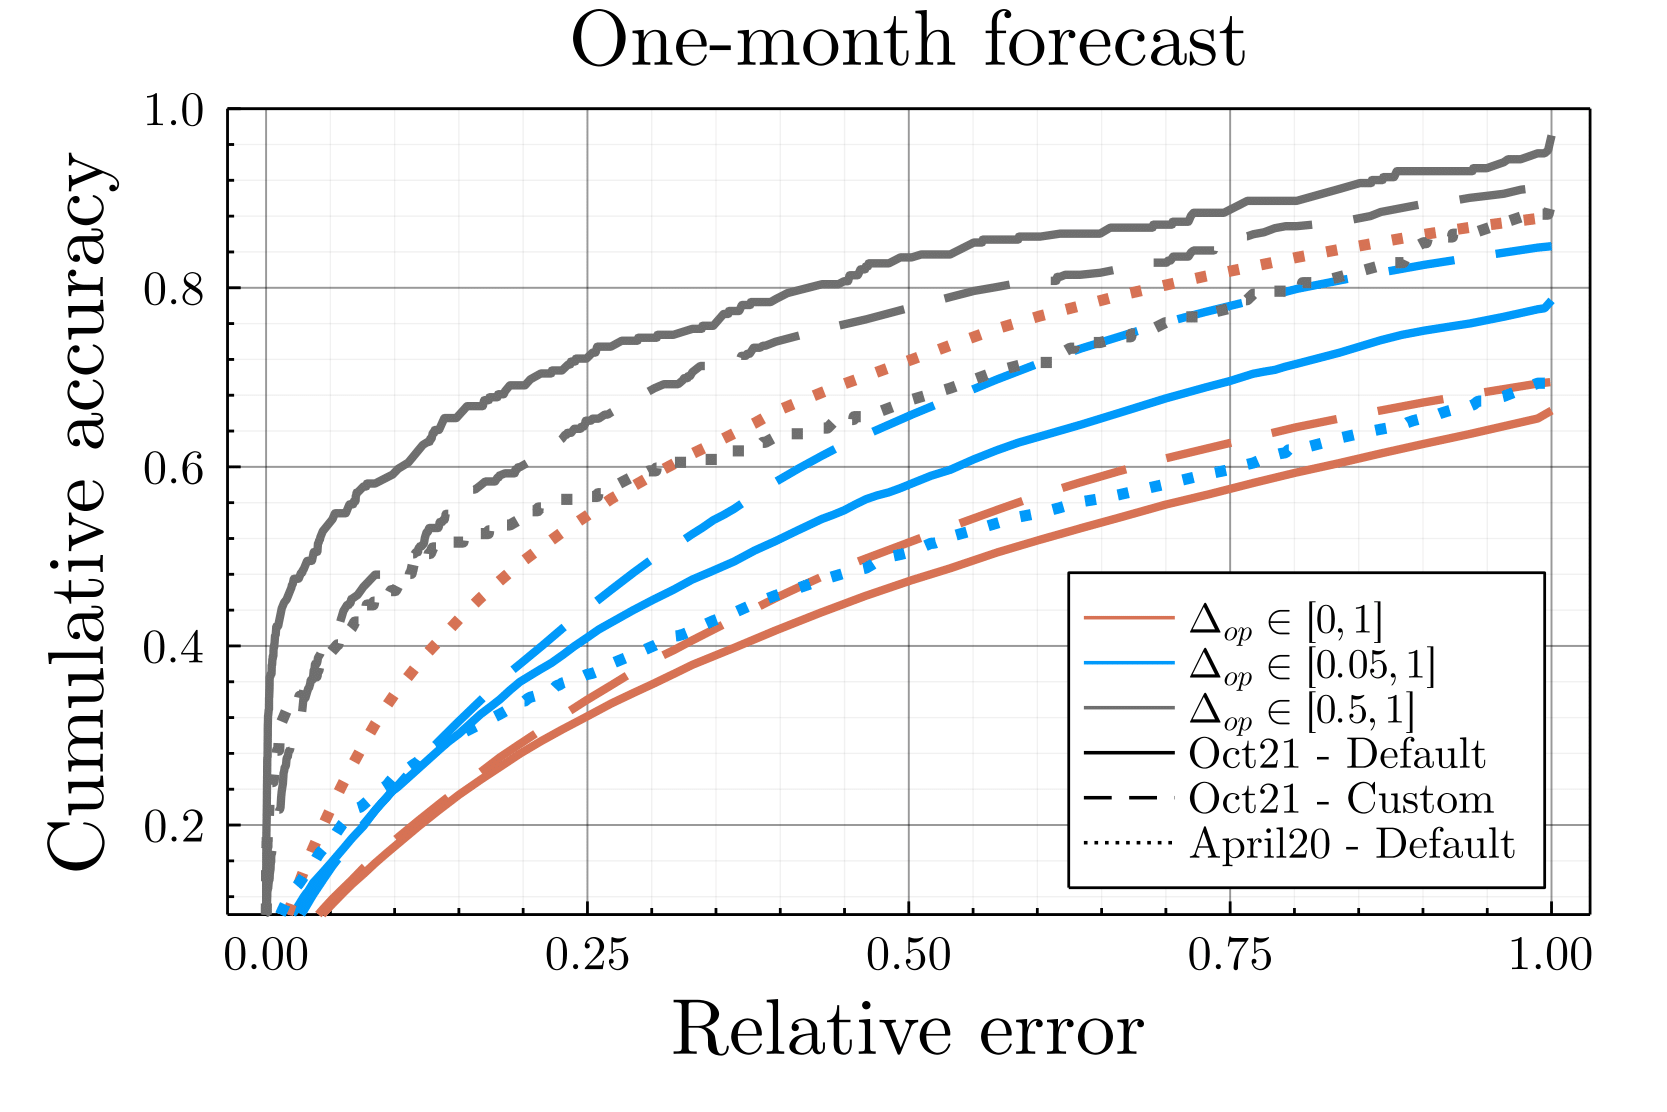
Such a fitting leads to a relatively high accuracy, with more than \(75\%\) of our final fitted opinions off by less than \(0.05\) after 30 iterations (corresponding to end of October, cf. Figure 11). Such fitting error is less than intra-communities opinion diversity. We should emphasize that the goal of the present work is not to accurately predict the opinion of online social media users, but only to provide a faithful simulation of online users’ behavior to study the consequences of algorithmic recommendation. In particular, users’ opinion are used within the simulation to determine the probability of retweeting a content, thus being off by \(0.05\) in opinion does not alter the behavior of the simulation. The only significant changes of opinion are the larger ones (\(\Delta_{op}>0.05\)), for which the fitted updates rules leads to a relative error less than \(25\%\) for more than \(60\%\) of the predictions, and even more accurate for particularly large displacements \(\Delta_{op}\in[0.5,1]\) (cf. Figure 16). To confirm the sanity of the used method, we considered other time periods, other graph spatialization settings and forecast the opinions one month (November) after the fitting, obtaining similar accuracy, as discussed in the Appendix (cf. Figure 17).
Calibration of agents’ activities
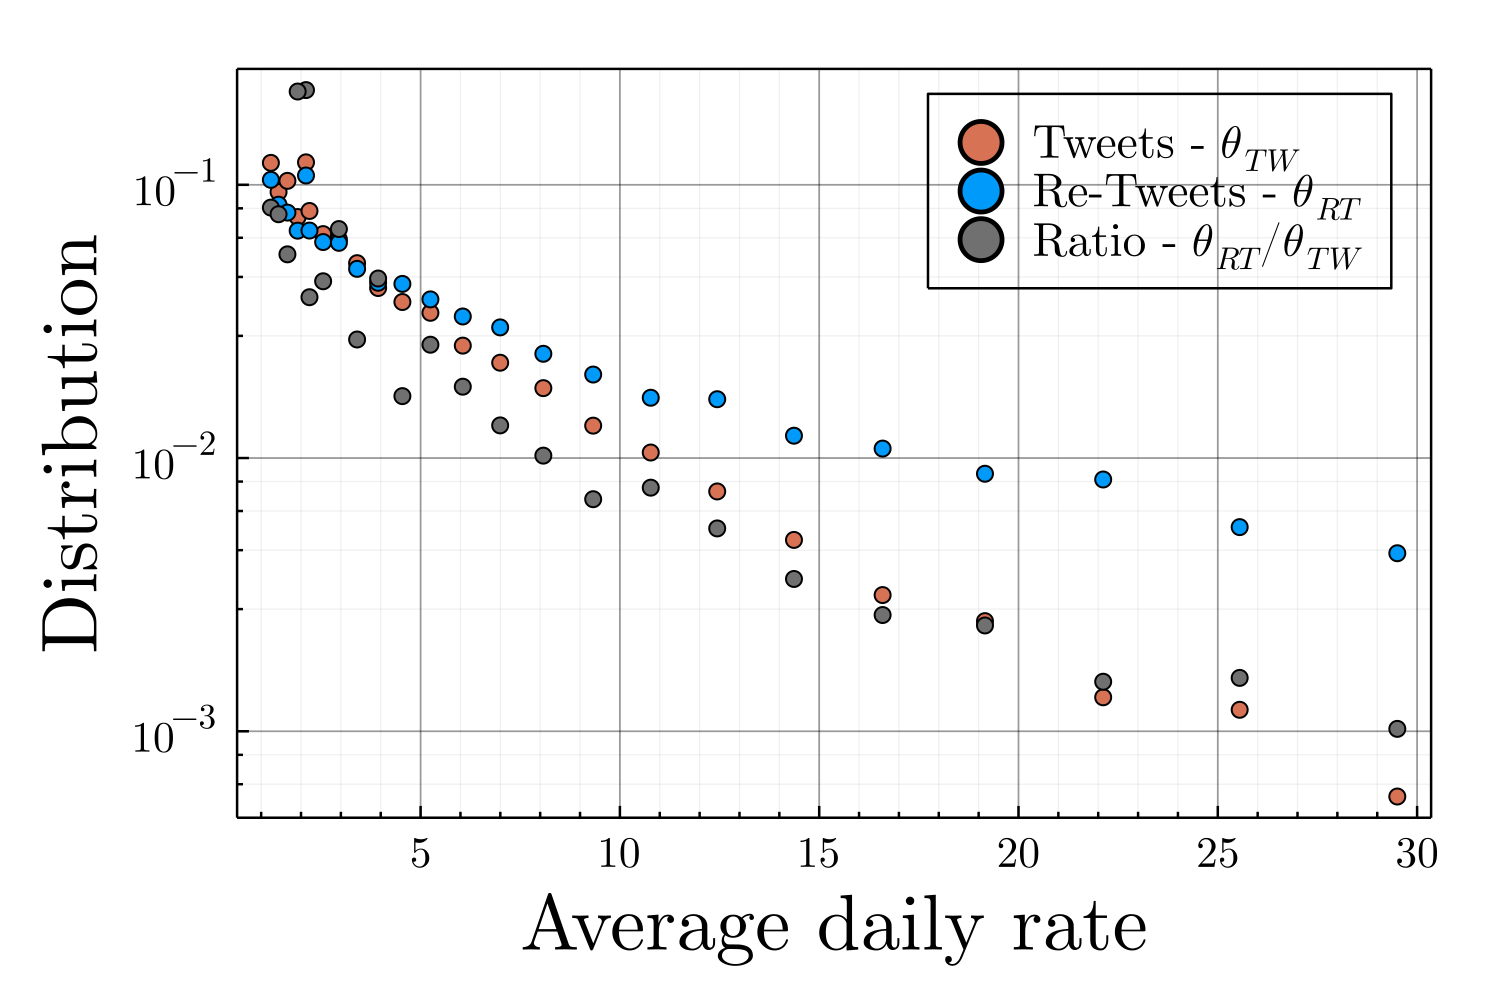
In absence of information specifying which messages are displayed on users’ screens, we hypothesize that users read messages until they reach their daily number of retweets or when they read all the messages from \(\mathcal{N}_i^r(t-1)\). We identified the \(110k\) most active users over the period of autumn 2021, get their political tweets and estimated their publication behaviors. The number of daily posted tweets (\(\tilde{n_i^p(t)}\), original publications) and retweets (\(\tilde{n_i^s(t)}\), shared publications) were exponentially distributed at the individual level (as already observed in Perra et al. 2012; Baumann et al. 2020). At the population level, the empirical exponential scales \(\tilde{\theta_{i}^p}\) and \(\tilde{\theta_{i}^s}\) for the different users were distributed according the distribution displayed on Figure 18. We build on these empirical observations to set the number of tweets and retweets of agent \(i\) in \(\tilde{\mathcal{N}}\) as independently drawn from two exponential distributions of empirically determined rates \(\tilde{\theta_{i}^p}\) and \(\tilde{\theta_{i}^s}\) respectively.
Latitude of acceptance
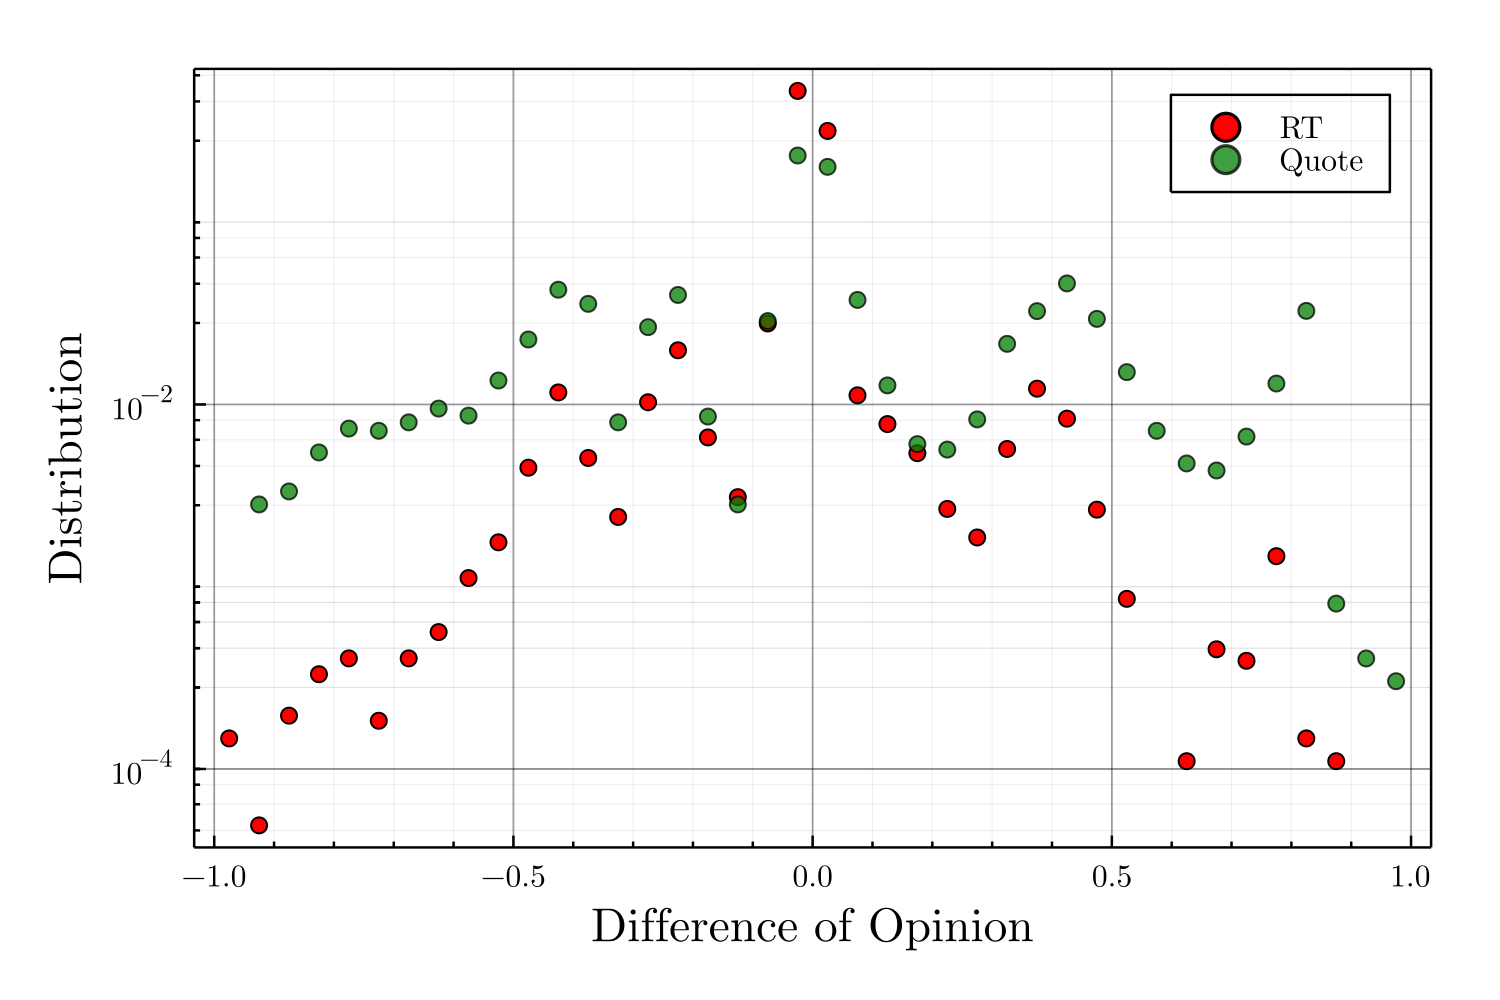
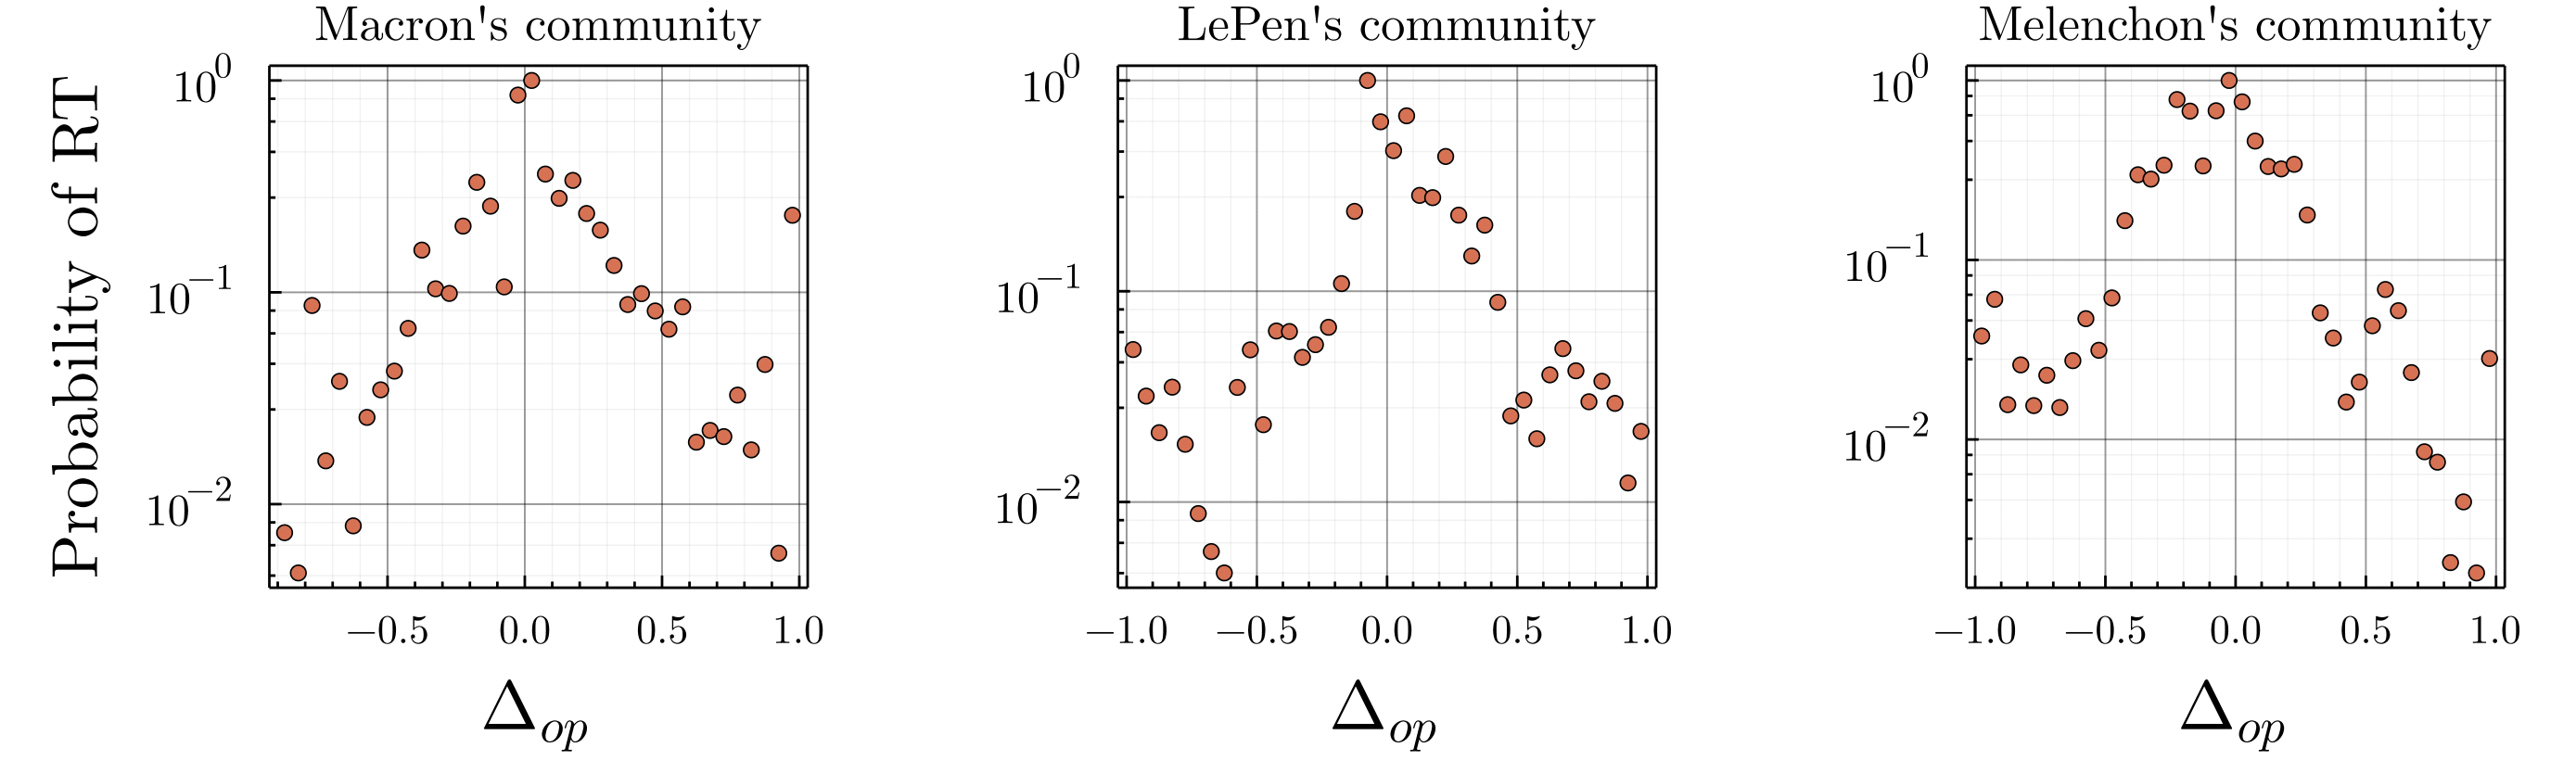
Once the opinions assigned, we determined the distribution of difference of opinion \(\Delta_{op}\) between a user and the authors of retweeted messages. In order to cancel the bias in the representation made by the platform (Huszár et al. 2022), as well as taking into account the different sizes and positions of the communities, we had to renormalize the distribution of difference of opinion as observed from the retweets with the patterns of publication on quoted tweets (cf. Appendix).
One notices on Figure 6, that the probability of retweeting a message decays roughly exponentially as the difference of opinion increases, with some refinement revealing political strategies. The asymmetry of the distributions illustrates how Emmanuel Macron community (center) tends to retweet content even further right than further left, while the opposite effect is noticed for left-wing leader Jean-Luc Mélenchon community (cf. Figure 20). After having determined such distributions for the whole range of opinions, we assigned to our simulated agent the distributions associated to their initial opinions.
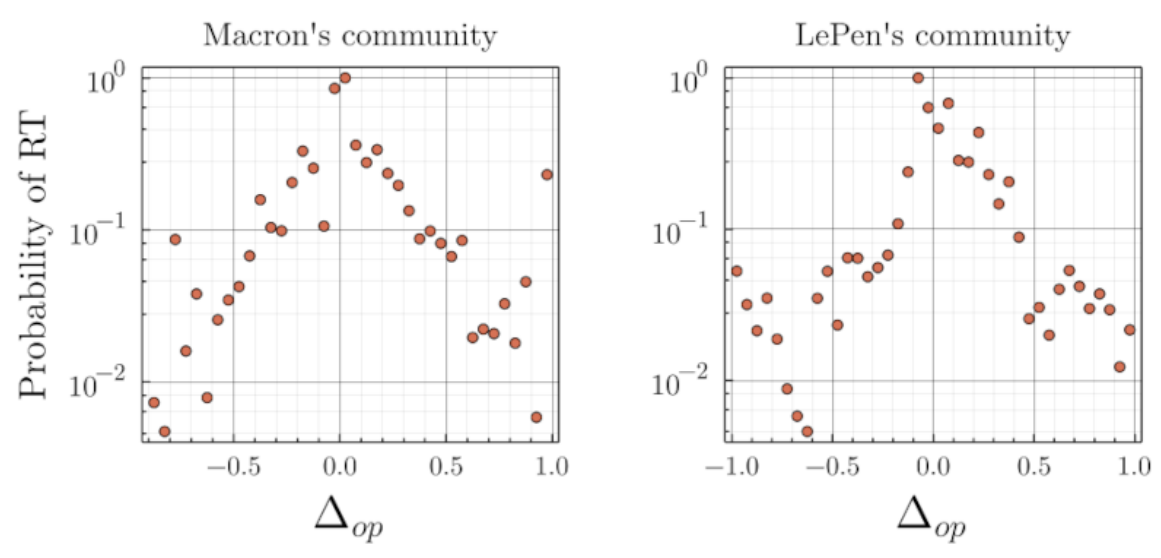
Note that this empirical calibration suggests that people are less likely to interact with, and thus be influenced by, individuals as the distance of those individuals’ opinions from their own increases. Consequently, it seems more sensible to model interpersonal influence as a decreasing probability of influence as a function of the distance of opinion between two people, rather than as a homogeneous influence within a bounded interval of opinion. Further empirical and experimental analysis would nevertheless be required to distinguish between the different models of influence.
Negativity
To calibrate negativity-related properties of our model, we performed a sentiment analysis on \(190k\) French political tweets exchanged by \(500\) unique users during October 2021. This analysis has been performed using the French version of the Bi-directional Encoders for Transformers, CamemBERT (Martin et al. 2020), fine-tuned on French Tweets.
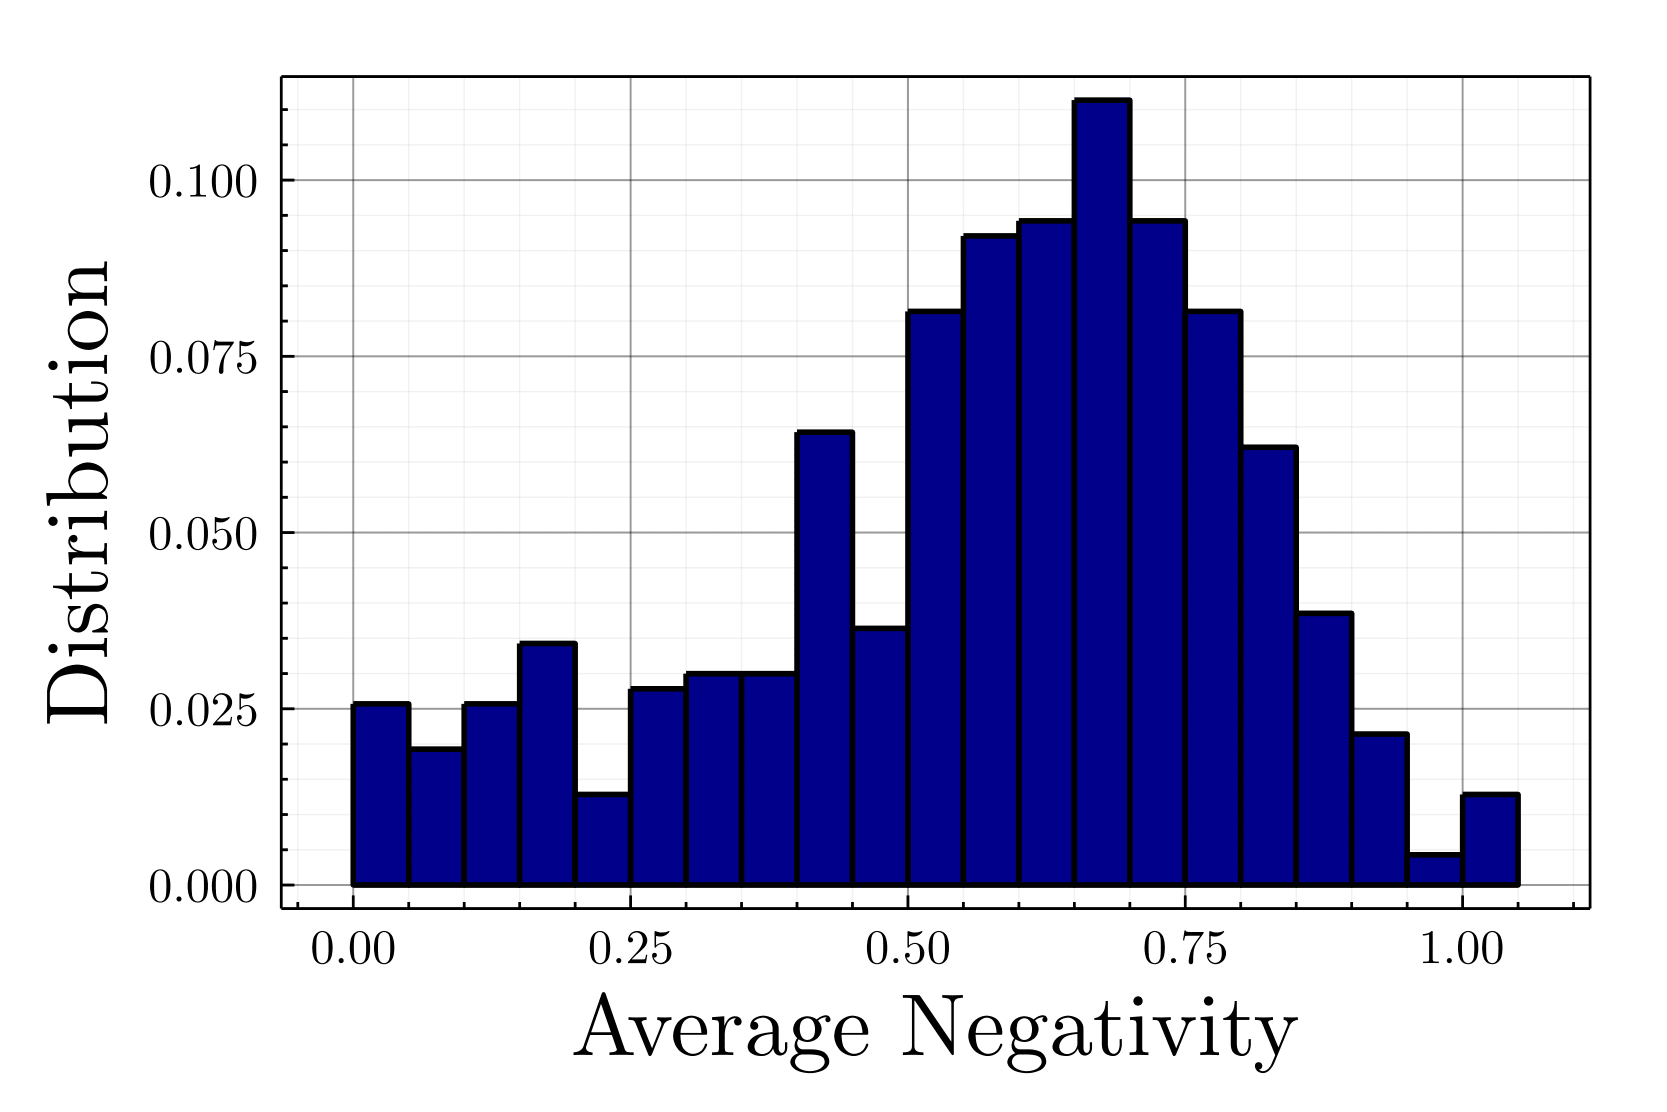
As displayed on Figure 21, the users having exchanged political content are heavily negative, half of them published more than 60% of negative messages, and a quarter more than 75%. Moreover, the correlation between the average negativity and the absolute value of opinion for political activits (more than 5 politcal tweets/month) equals 0.3 (\(p-value<10^{-9}\)), which means that the more extreme a political activist’s position, the more negative his or her statements (cf. Figure 22), a relevant observation for political science.
These empirical observations led us to attribute to our agents an intrinsic negativity \(\nu_i\), i.e., the proportion of negative content published, drawn from the empirical distribution as a function of their initial opinion, as well as a negativity bias, as indicated in the Appendix.
Evaluation of recommenders’ effects
In order to characterize the behavior of our agent-based model we hereby introduced metrics of particular interest:
- Algorithmic negativity bias \(\Gamma\):
- this is the negativity over-exposure generated by the recommender system defined as the ratio between the negativity in the perceived environment —the content of the timeline— and the negativity in the "real environment" i.e., in one’s in-neighborhood \(\mathcal{N}_i^r\).
- Newman’s modularity \(\mathcal{Q}\)
- (Leicht & Newman 2008): assessing the density of connections within a community.
- Diversity within a community \(\sigma_{X}^{intra}\):
- the standard deviation of an observable, such as the opinion, the intrinsic or perceived negativity, within a given cluster, normalized by the standard deviation of the observable within the overall population, averaged over the clusters.
with \(\mathcal{N}_k\) a cluster subgraph and \(\overline{X_k}\) the average of observable opinion/negativity with respect to the overall population.\[\sigma_{X}^{intra}=\frac{\sum_{k=1}^K \sqrt{\frac{1}{\lvert \mathcal{N}_k\rvert}\sum_{j \in \mathcal{N}_k }\left(X_j-\overline{X_k}\right)^2}}{K \sqrt{\frac{1}{\lvert \mathcal{N} \rvert}\sum_{j \in \mathcal{N} }\left(X_j-\overline{X}\right)^2}}\] \[(1)\]
- Diversity between communities: \(\sigma_{X}^{inter}\):
- the standard deviation of clusters’ observable –such as average opinion, intrinsic or perceived negativity– normalized by the diversity among the whole population, assessing the diversity of the different communities with respect to the overall population.
\[\sigma_{X}^{inter}=\frac{1}{ \sqrt{\frac{1}{N}\sum_{j \in G }(X_j-\overline{X})^2}} \sqrt{\frac{1}{K}\sum_{k=1}^K(X_k-\overline{X})^2}\] \[(2)\]
Pseudo-code for the recommendation algorithm implementation
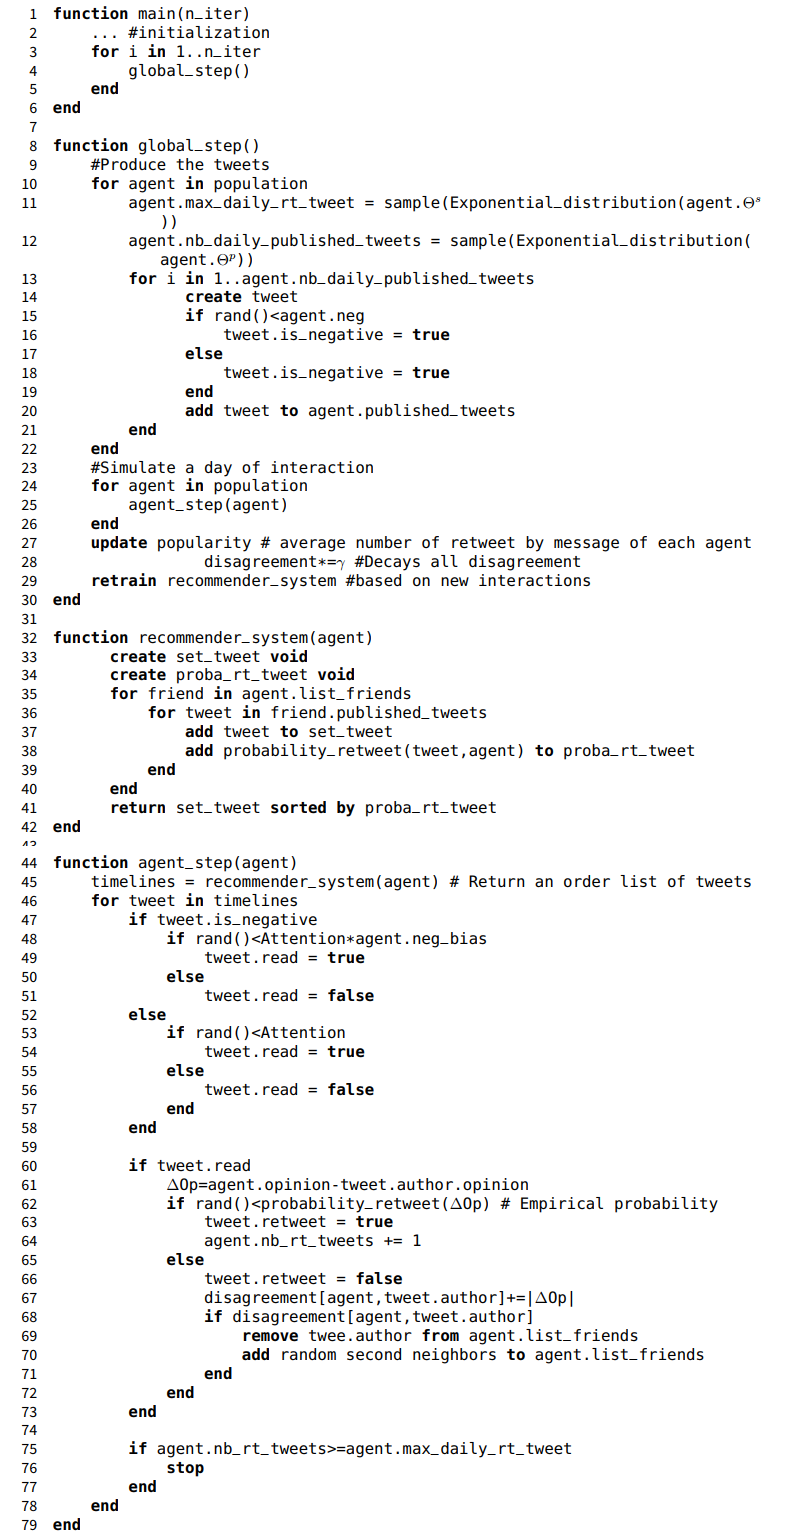
The code to replicate all the simulations and results presented in this paper is available as open source code on Bouchaud, Chavalarias, & Maziyar (2023). The pseudo-code for the implementation of the recommender systems is available in the Model Documentation Section to help the reader to better understand the different steps in this simulation.
Results
Assessing the impact of recommenders on negativity and opinion polarization with real-world networks
The model was initialized on real data with all parameters but two (cf. Table 2), which we know have no impact on the results, being empirically calibrated. We have simulated one month of interactions to estimate the activity and opinion evolution of each account in the real dataset, and analyzed the previously presented metrics. As for the account’s activity prediction, our framework being stochastic, none of the four recommender systems where able to predict low intensity interactions \(\leq10\) retweets/month), overestimating small weights with respect to the real distribution (see Figure 18). Nevertheless, for larger weights (\(> 10\) retweets/month), PopNeg faithfully matches the empirical distribution, while Pop overestimates large weights, as one may expect, and Chrono underestimates them.
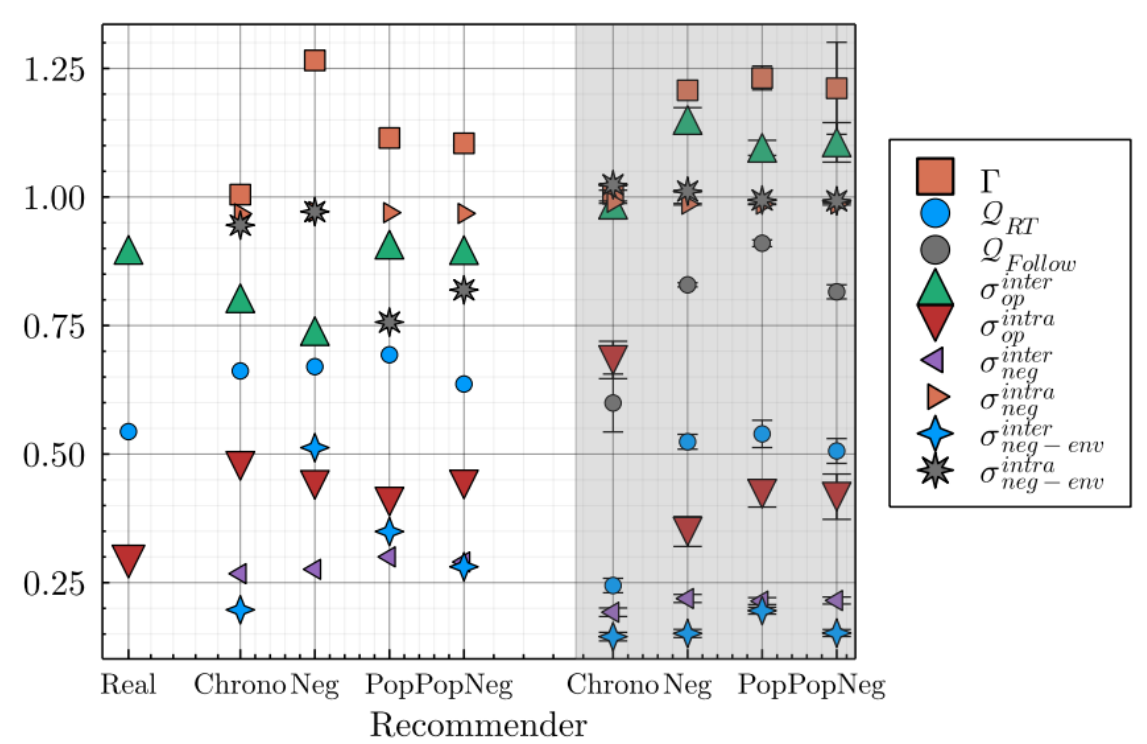
As displayed on Figure 7, the overexposure to negativity \(\Gamma\) is non-existent in chronological mode, as expected, while the three algorithmic recommenders lead users to be overexposed to negative content. The Neg recommender, solely based on negativity, leads to the highest overexposure, users are shown on average \(26\%\) more negative content that what they would have in the neutral Chrono mode. This is in line with empirical studies (Bouchaud, Chavalarias, & Panahi 2023) that have measured a \(+36\%\) overexposure of Twitter users to negative/toxic content due its recommender system on January 9 2023 and \(+48.7\%\) on Fev. 7 2023 (an increase due to Elon Musk’s takeover on October 2022 and the modification of the feed structure on January 13, 2023).
Within the population, the overexposure to negativity is extremely diverse, as depicted in Figure 8, with some users experiencing an overexposure of more than \(300\%\). This happens even to users with a large neighborhood and/or to users without any negative bias. For users with a small number of friends (less than 10), we notice a small (\(r=0.02\)) but significant (\(p<10^{-7}\)) correlation between the number of in-neighbors and the negativity overexposure. Indeed, as the number of friends increases, so does the size of the pool of message from which the recommender is picking from, allowing it to select the most engaging messages (that are most of the time the most negatives ones), leading to a higher negativity overexposure. Such results are a direct consequence of the feedback loop between human negativity bias and the engagement maximization goal hard-coded within the recommender.
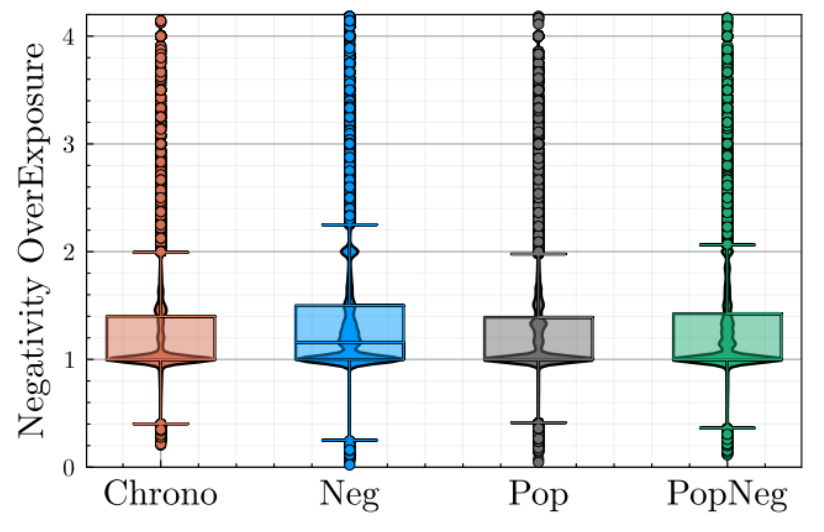
It’s important to note the wide variations in overexposure to negativity from one individual to another, because from an individual point of view, it can plunge some users into extremely toxic environments, disconnected from reality. This can have adverse consequences for their mental health and social relationships, as demonstrated, for example, during the COVID-19 pandemic (Levinsson et al. 2021), as well as being a direct consequence of the configuration of the recommendation system and therefore the responsibility of the platform.
The diversity of opinion depends of the recommender system, pointing to another harmful consequences for online sanity. Indeed, while Chrono and Neg lead to the same \(\sigma^{inter/intra}_{op}\), the two social modes, namely Pop & PopNeg, result into a higher fragmentation of the social fabric. The average diversity of opinion within clusters, \(\sigma^{intra}_{op}\), is poorer —but not as poor as empirically observed—, and the different clusters are centered around different opinions —higher \(\sigma^{inter}_{op}\), close to the empirically observed one.
In contrast, the modularity \(\mathcal{Q}_{RT}\) of the retweet graph revealed to be independent of the recommender, as well as the diversity of negativity within and between clusters \(\sigma^{inter/intra}_{neg}\), the graph structure being strongly constrained from the initialization
By looking at recommender features importance, we notice that the frequency of past interactions between the user and the author, is by far the most informative feature, another illustration of human confirmation bias, reinforced by the recommender. Similarly, the different clusters are, in these social modes, less diverse in perceived negativity \(\sigma^{intra}_{neg-env}\). The unequal perceived negativity, may partially justify the difference of acceptance latitude for the different opinion, but further experiment considering impressions information would be needed to assess the relation between perceived negativity and confirmation bias.
Assessing the impact of recommenders on the formation of social groups with synthetic networks
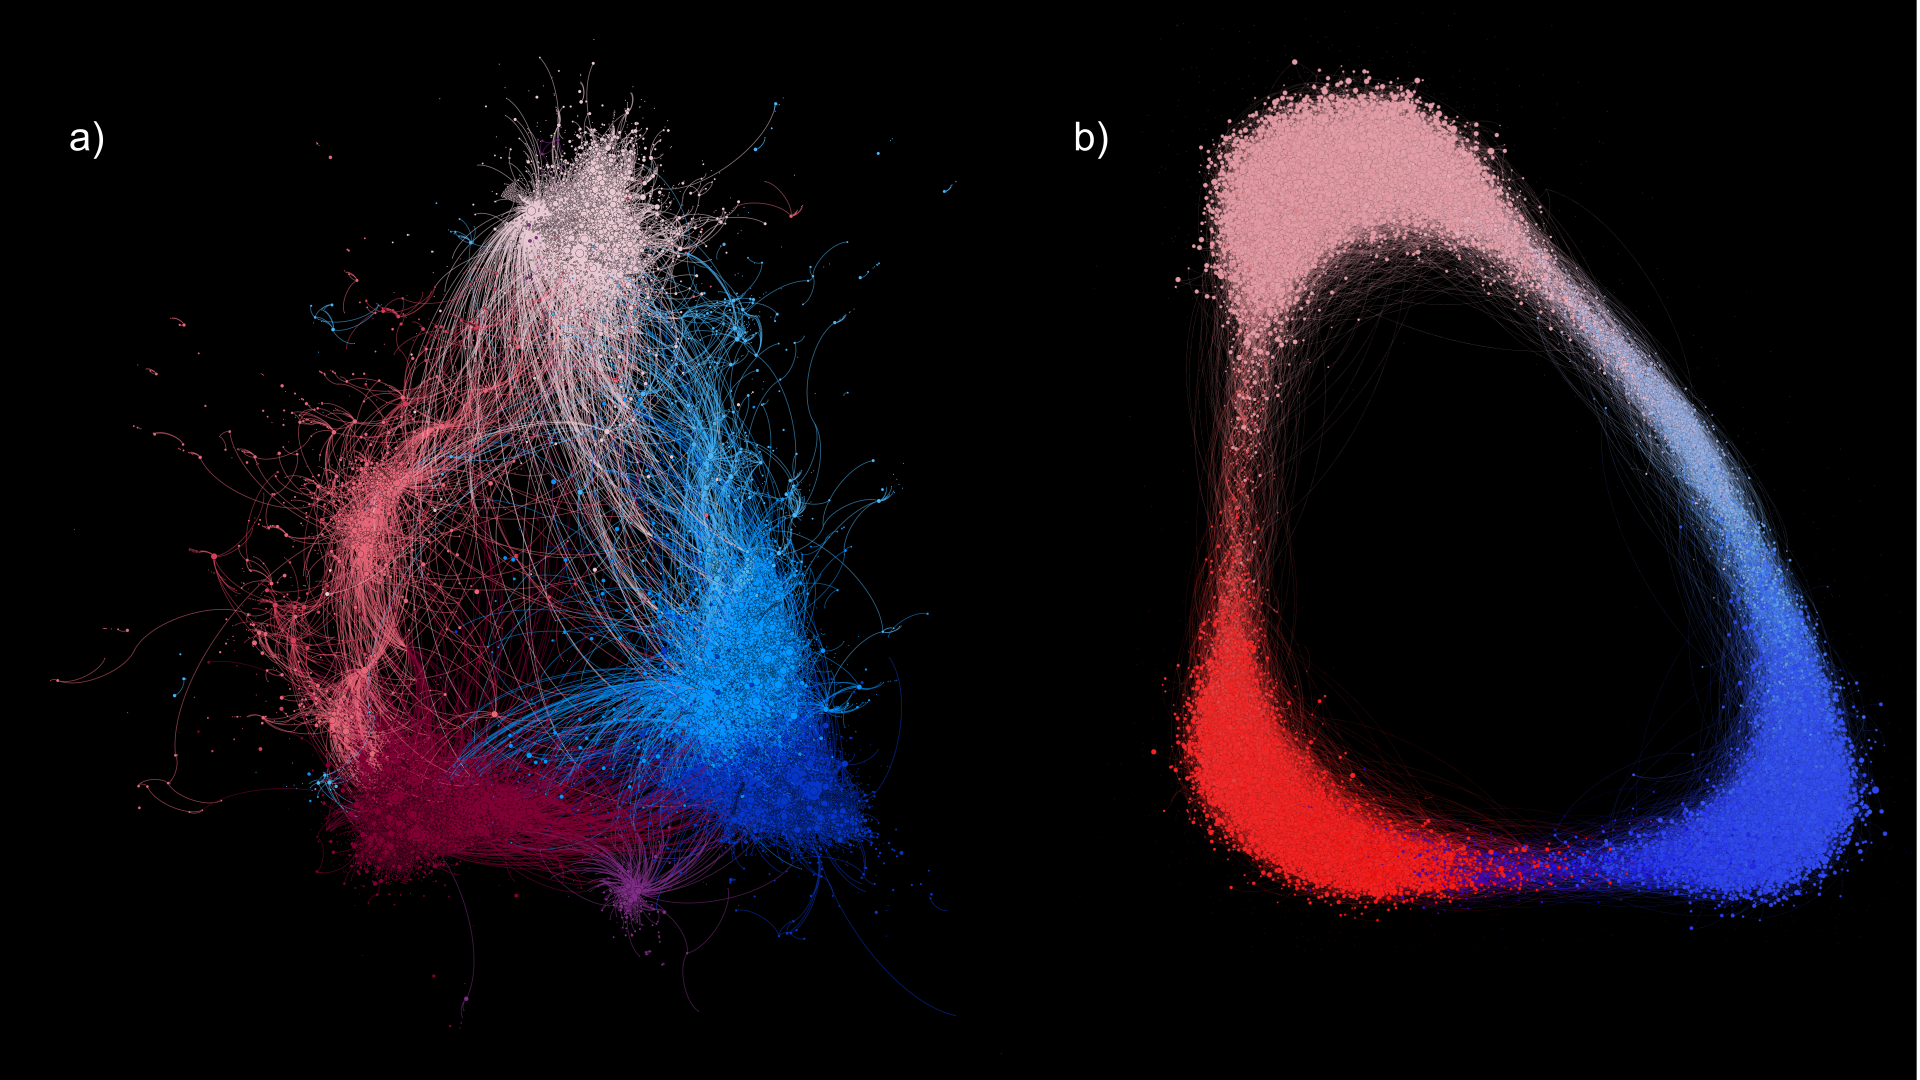
The previously considered empirical data are the product of years of social evolution, shaped by the platform’s recommenders. Thus by initializing the network of interactions with a real network, we miss most of the impact of the different recommender systems’ on social networks formation. In order to further investigate the consequences of the recommender on the social fabric, we hereby consider randomly initialized networks and analyze their evolution8. We drawn for \(25k\) agents the properties from the empirical distributions and considered an initial network of follow generated through the Barabási Albert model. Such networks do not aim to realistically mimics all real social networks features but only to provide a zero-th order starting point to illustrate the different consequences of the recommender.
The probability of retweeting a read message is set to decays exponentially with the difference of opinion with a mean of \(0.2\), to roughly match the empirical one, without specifying it too strongly to French political strategies. The empirical determination of \(\tau\) being impossible, without having access to what messages is shown to the users on a long time period, we arbitrarily fixed it \(0.5\) with a time discount factor of \(0.9\), corresponding to a time-scale of 10 days — by considering alternatives values, the qualitative results discussed below remains.
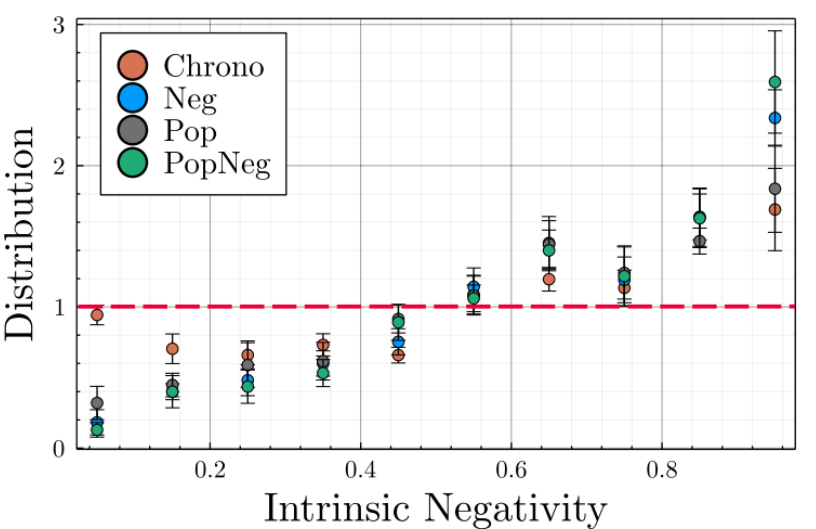
[syntheticneg] A sensitivity analysis of the agents’ negativity bias in synthetic networks also demonstrates that the algorithmic negativity bias phenomena (\(\Gamma>1\)) appears as soon as agents have some negativity bias ; and its intensity is almost independent of the strength of agents’ own negativity biases (see Sections 6.9 and Figure 29). As long as the users favor negative content over positive/neutral ones, recommender systems based on engagement will lead with certainty to an overexposure to negativity.
Starting with an unconstrained random network \(\mathcal{N}\) allows the full expression of recommender actions and makes it possible to check that the proposed model for network evolution is compatible with what is observed empirically (see Figure 9 for an example). As depicted on Figure 7, after two months of simulated evolution, the modularity of the retweet and follow networks significantly increases with algorithmic recommendation in respect with a neutral presentation of content, in Chrono, as well as the ideological fragmentation or the overexposure to negativity.
The algorithmic negativity bias does not only impacts the information environment of the agents toward more toxic environments, is also impacts the structure of social power in the population, defined as the capacity of an agent to influence the public debate (Jia et al. 2015). Figure 10 displays the intrinsic negativity unbalance between the overall population and the top \(1\%\) agents receiving the most retweets by tweet while Figure 28 shows the proportion of negative agents in function of the most popular quantile for Neg algorithm. This analysis clearly demonstrates that the amplification of individual negativity bias by engagement-optimizing recommendation algorithms leads to a concentration of online social power in the hands of the most toxic users.
For example, while agents publishing negative content half of the time are faithfully represented among the most popular, the users publishing no negative content are absent from the most popular ones for the three algorithmic recommenders. Frighteningly, agents publishing systematically negative content are more than twice as numerous among the most popular than in the overall population; the two recommenders considering the negativity of the message, namely Neg and PopNeg, leading to the highest over-representation.
It is also noteworthy that despite being neutral in its selection, Chrono nevertheless leads to a significant unfair representation as a consequence of individual negativity bias. Even in a neutral mode, the users will more likely read negative content and hence retweet it, increasing its author popularity.
Discussion
On January 6, 2021, a crowd convinced that the election was stolen stormed the Capitol in Washington, D.C. Whatever the extent to which this event can be attributed to misinformation about the electoral process, it is clear that it was not a fad: one year after Jan. 6 "52% of Trump voters, as well as 41% of Joe Biden voters, somewhat agree or strongly agree that it is time to cut the country in half" (UVA Center for Politics 2021) while a late 2020 survey concluded that "Americans have rarely been as polarized as they are today" (Dimock & Wike 2020). In order to remedy this situation of extreme polarization of public opinion, which tends to be reproduced in other countries such as Brazil, the United Kingdom or Italy, we must go beyond the reflex of "fact-checking" and the praise of better moderation of harmful content in online social networks.
As pointed out by other studies using complementary approaches to ours (Ceylan et al. 2023; Törnberg 2022), we must acknowledge the impact of SNSs on social structures and in particular in the amplification of polarization and hostility among groups. It is not only a phenomenon that affects the general public, the entire information ecosystem is at risk. After Facebook changed its algorithm in 2018 to favor "meaningful social interactions", "company researchers discovered that publishers and political parties were reorienting their posts toward outrage and sensationalism" and internal memo mentioned that "misinformation, toxicity, and violent content are inordinately prevalent among reshares" (Hagey & Horwitz 2021). Indeed, this paper demonstrates that a slight change in a recommendation algorithm can radically alter social structures, opinion dynamics and information flow at the aggregate level.
At a time when States are thinking about regulating large social networking sites (SNSs), it is more necessary than ever to have models to quantify their effects on society. In this article, thanks to the modeling of social networks as complex systems and the calibration of the models using big data, we could give hints about what is really going on under the hood.
Using a large scale longitudinal database of tweets from political activists (Gaumont et al. 2018), we have built and calibrated an agent-based model able to simulate the behavior of users on Twitter, some of their cognitive biases and the evolution of their political opinion under the influence of recommender systems. Among other things, we have empirically estimated parameters common to many models of opinion dynamics that were previously arbitrarily defined –like the widespread used opinion update rule Agents Rule 1. We also went beyond commonly adopted assumptions, such as a fixed threshold of ideological disagreement for engaging in an interaction, by considering interaction probabilities and estimating their law.
Thanks to this calibrated model, we were able to compare the consequences of various recommendation algorithms on the social fabric and quantify their interaction with some major cognitive bias.
In particular, we demonstrated that the self-learning recommender systems that seek to solely maximize users’ engagement based on measures of user or content popularity necessarily lead to an overexposure of users to negative content, a phenomenon called algorithmic negativity bias (Chavalarias 2022) and to an ideological fragmentation and polarization of the online opinion landscape. We believe that these results may constitute evidence of a systemic risk within the meaning of Article 26 of the Digital Services Act9 associated with engagement-maximizing business models on VLOPs10; and could consequently contribute to evidence-based regulation under the Digital Services Act or other international regulatory frameworks.
We also demonstrated that some social media users might experience excessive algorithmic negativity bias (\(>300\%\) overexposure to negative content), a situation that could have detrimental health consequences and could be harmfull to the user’s well-being. This overexposure phenomena is compatible with some observations on the impact of social media use (Karim et al. 2020), and could serve as a guide to identify clinical and vulnerable groups to social media use, which consitute one of the challenge of future research on digital media and human well-being (Fassi et al. 2023).
Last, we have shown that engagement maximizing recommenders also lead to a concentration of the social power in the hand of the most toxic accounts.
These results should lead regulators to focus on the types of data that feed into recommender systems and potentially outlaw some. These kind of findings could help to identify when and where business secrecy, which is so often brandished when platforms are asked to cooperate with public bodies, must be relaxed in the context of their regulation.
If the way recommender systems are currently implemented is detrimental to individuals and society, it’s important to note that this is not necessarily intentional: it results from the positive feedback between flawed human cognition and the economic goals of SNSs. As most of these platforms have become systemic due to their size (VLOPs), their unregulated pursuit of profitability poses systemic societal risks both to their users and to the sanity of our democracies.
Policy makers are increasingly aware of these risks but lack the keys to regulate this sector. Modeling SNSs and their effect on individuals an social groups with an interdisciplinary approach can give some of those keys.
This could also encourage digital platforms to take steps to mitigate negative bias at the user level and prevent it turning into algorithmic negative bias and spreading to the collective level.
Studies of the effect of recommender algorithms are an emerging field in academia that should be supported by the relevant authorities in order to identify, in all independence, the right regulatory levers and implement an evidence-based policy. Needless to say, this will require greater openness of SNSs data towards academia. It should be remembered that Twitter/"X" was one of the only major SNSs to make some of its data available, and that at the time of writing this article, it has stopped opening up its data, which means that the analyses proposed here will no longer be possible. Some of the empirical calibration made on Twitter in this study, like the opinion update rule or the reshare behavior, could be useful to model other platforms like Facebook, but nothing compares to an empirical calibration on the native data of a platform
In conclusion, it is not enough to point to malicious users who produce toxic content and call for better moderation. The individual and collective effects of the large-scale deployment of recommender systems by large technology companies, including the dynamics of opinion, information flow, and social structures, need to be further studied to assess their potential harm. For the sake of democracy, science shall contribute to evidence-based policy-making by modeling the impact of these platforms on the social fabric.
Model Documentation
In order to make the model accessible for everyone interested, we uploaded it to the Haward Dataverse (Bouchaud, Chavalarias, & Maziyar 2023) along with the following archives:
- GarganText maps and data (Interactive state-of-the-art phylomemy and gexf sources of maps)
- Source code in Julia for reproducing the simulations
- Initial data for agents’ opinions and properties
- Raw outputs of the simulations
- Political retweet networks
- Code for assigning opinions based on the retweet network
- Code for generating the plots
Here is the pseudo-code of the model for easier understanding:
Funding
Paul Bouchaud received a doctoral fellowship from the “Fondation CFM pour la Recherche”. This work was supported by the Complex Systems Institute of Paris Île-de-France (ISC-PIF), the CNRS 80 PRIME program and the Région Île-de-France SESAME 2021.
Authors’ Contributions
D.C and P.B. designed the research and developed the model. M.P. performed the data collection. P.B. carried out the numerical implementation, the empirical calibration, the data analysis and drafted the article. DC supervised the study. Both P.B and D.C. contributed to the final version of the manuscript.
Appendix
Opinion
Wishing opinions spanning continuously the range \([-1,+1]\) and exhibiting more refinement than a simple dichotomy or clustering, we decided to assign to each user an opinion corresponding to leaders’ opinion weighted by the inverse distance to the leader; euclidean distance measured in the projected space obtained through the force-directed layout algorithm ForceAtlas2 (Jacomy et al. 2014) (with default settings). Within this layout, nodes —in total disregard to theirs attributes— repulse each others while (undirected) edges attract their source/target nodes —proportional to the associated weight, if any. The resulting position of a node cannot be interpreted on its own, but only compared to others. On the above retweet graph, the higher the number of retweet between two users, the closest those two nodes.
We are left with the task of assigning a numerical opinion to the political leaders, this crucial task will once again be carried out using the graph structure. We considered these opinions as the angular difference between the vector (barycenter-leader) with respect to the reference vector (barycenter-Macron) in the projected space, here the barycenter is calculated among all leaders. The reference direction has been chosen for two reasons: first the community around Emmanuel Macron is quite stable over time, especially compared to the far-right/far-left communities, avoiding having unstable anchored points. Secondly, when expressing their views on a given issue other political leaders, use de-facto Emmanuel Macron —the sitting president— as a reference. The spatialization and thus leaders’ opinion, rely on the activity of their community, evolving with time.
Far from being a drawback, the dynamical nature of opinions allocation conveys the continuous adaptation, reshaping of the political landscape caused both by endogenous and exogenous events. For example the intensification of Eric Zemmour political ambitions is reflected by a relative inversion between Marine Le Pen and Eric Zemmour, two far-right figures, between September and October 2021, the former appearing "less extreme" than the latter in October, as displayed in Table 3, —the political Twittersphere of October 2021 is depicted in Figure 11. To someone initiated to French politics, the relative opinions of the different leader reflects quite accurately the different political current, Hidalgo, Jadot, Roussel, Poutou and Mélenchon at the left of Macron, Pecresse, Zemmour, LePen, Dupont Aignan, Philipot, Asselineau at his right.
| Candidates | September 2021 | October 2021 |
|---|---|---|
| DupontAignan | -0.72 | -0.76 |
| LePen | -0.62 | -0.60 |
| Zemmour | -0.60 | -0.63 |
| Pecresse | -0.26 | -0.28 |
| Macron | 0.00 | 0.00 |
| Hidalgo | 0.25 | 0.28 |
| Jadot | 0.42 | 0.42 |
| Roussel | 0.46 | 0.43 |
| Poutou | 0.71 | 0.68 |
| Arthaud | 0.73 | 0.66 |
| Melenchon | 0.82 | 0.77 |
The circularity of the arena motivates us to consider periodic opinions, with a transition suited between Melenchon and Asselineau, corresponding to "conspiracy views". The opinion assignment process leads to a distribution depicted in Figure 12.
Opinion update parameter
The result of the symbolic regression on the functional forms of \(\mu\) was the very expression, \(o_i \leftarrow o_i+\lambda_i (o_j-o_i)\), used in the opinion dynamics literature as in the Deffuant model (Deffuant et al. 2000) or in the Jager and Amblard model (Jager & Amblard 2005).
Then, we fitted for each agent the opinion update parameter \(\lambda_i\). In order for the calibration to be computationally efficient, we fix during the fitting procedure the opinion of the other agents and only update the considered user’s one. Such an approximation is reasonable considering the distribution of monthly change of opinion, the vast majority of users only changing slightly their opinion — the average change between September and October 2021 equals \(-0.03\).
The calibration of \(\lambda_i\) under the hypothesis of a single function form reveal a high heterogeneity among agents in their influenceability (Figure 13).
Such a fitting leads to a relatively high accuracy, with more than \(75\%\) of our final fitted opinions off by less than \(0.05\) after 30 iterations (corresponding to end of October, cf. Figure 14). This is less than intra-communities opinion diversity.
To verify the sanity of the opinion update parameter fitting procedure, we considered another time period, Spring 2020 in addition to Autumn 2021, as well as other spatialization settings. Gephi (Bastian et al. 2009) Force Atlas2 setting used by default were modified —stronger gravity coupled to gravity sets to 0.001 and a scale sets to 5— leading to the Twittersphere depicted in Figure 15. While we notice a relative inversion between far-right leaders such as Nicolas Dupont Aignan and Eric Zemmour, the overall arena is similar. All in all, the general accuracy is equivalent between the different variants, 85% of the predictions off by less than \(0.1\) (Figure 14), more than 60% of the prediction offs by less than 25% for large displacement \(\Delta_{op}>0.05\) (Figure 16). Also, using the fitted opinion update parameter, we forecast the change of opinion, using the list of retweets effectively exchanged during the month following the fitting. The accuracy is poorer but yet acceptable considering that the goal of the present work is not to predict the opinion of users, but only to faithfully simulate their online retweet behavior. As displayed on Figure 17, the relative error for monthly opinion changes larger than \(\Delta_{op}>0.5\) is less than 25% for more than 75% of the predictions.
Calibration of agents’ activities
Latitude of acceptance
While retweeting a message is generally a sign of agreement, quoting one may express a variety of intermediate positions, including total disagreement. The study of the distribution associated with quotes allow us to verify that the one associated with retweets is not a mere consequence of the process of assigning opinions to users, the latter being solely based on the retweets graph and not the quotes’ one. In order to estimate the probability that a given user will retweet a read tweet which diverges from its own opinion by \(\Delta_{op}\), we renormalize the distribution associated with retweets by the one associated with quotes, binning readers’ opinion. Indeed, in order for a user to quote a message, the recommender should have shown it to the user —under the reasonable assumption that the large majority of users’ actions on Twitter is ruled by the Home timeline and not by manual searches— the renormalization allows us to cancel the bias in the representation made by the platform (Huszár et al. 2022), as well as taking account the different sizes and positions of the communities. However, by renormalizing we de-facto neglect potential political strategy such as quoting massively the opposite site to attack the leader or to gain in visibility. Further work, would once again greatly benefit from having access to impressions information.
Negativity
The negativity considered within the sentiment analysis, is understood in the psychological sense; a message is labeled as negative if it is unpleasant, offending, harmful, inciting revolt etc., in total disregard of the societal or political implication. By manually labeling a thousand of tweets, we estimated the overall accuracy of the CamemBERT classification around \(73\%\). We refined the accuracy estimation by distinguishing clearly negative tweets such as:
Eric Ciotti [@ECiotti] Un adolescent interpellé à #Marseille avec plusieurs centaines de grammes de cannabis/cocaïne et avec un fusil à pompe. Le matériel du parfait écolier, tout va très bien madame la marquise !"["A teenager arrested in #Marseille with several hundred grams of cannabis/cocaine and with a shotgun. The equipment of the perfect schoolboy, everything is fine madam the marquise!"] Twitter, 1 Oct 2021, https://twitter.com/ECiotti/status/1443944007143407624
leading to an accuracy close to \(89\%\), from less negatively blunt messages, such as:
Gérald DARMANIN [@GDarmanin] "C’est le devoir de chaque Français que de se souvenir des visages innocents de Nadine, Simone et Vincent, brutalement arrachés à la vie par une idéologie mortifère"[It is the duty of every French person to remember the innocent faces of Nadine, Simone and Vincent, brutally torn from life by a deadly ideology", (the three victims of 2020 stabbing attack at Notre-Dame de Nice)] Twitter, 29 Oct 2021, https://twitter.com/GDarmanin/status/1454130435039109122
leading to an accuracy of \(78\%\). The accuracy related to tweets for which the determination of negativity —in the above-defined sense— is even fuzzy for a human speaker is close to \(60\%\):
Clémentine Autain [@Clem_Autain] "@Anne_Hidalgo a dit qu’elle n’utiliserait pas les mots crime contre l’humanité pour parler de la colonisation. On aurait pu imaginer que ces propos fassent un tollé, mais non. [...] On choisit ce qui est monté en épingle."[@Anne_Hidalgo said that she would not use the words "crime against humanity" to refer to colonization. One could have imagined that these words would cause an outcry, but no. [...] We choose what we want to make a fuss about] Twitter, 16 Oct 2021, https://twitter.com/Clem_Autain/status/1449377126709399554
Finally the accuracy for positives/neutral tweets is close to \(72\%\):
Bruno Le Maire [@BrunoLeMaire] "C’est par le travail que nous créons le pouvoir d’achat pour les Français. Depuis 2017, un million d’emplois ont été créés par les entreprises."[It is through work that we create purchasing power for the French. Since 2017, one million jobs have been created by businesses.] Twitter, 20 Oct 2021, https://twitter.com/brunolemaire/status/1450904607111139338?lang=fr
Philippe Poutou [@PhilippePoutou] "En soutien aux étudiants et étudiantes sans-fac à Nanterre, qui ne demandent rien d’autre que d’avoir le droit d’étudier, et dans de bonnes conditions." [In support of students without a university in Nanterre, who ask for nothing more than to have the right to study, and in good conditions.] Twitter, 13 Oct 2021, https://twitter.com/PhilippePoutou/status/1448287937238638593
As displayed on Figure 21, the users having exchanged political content are heavily negative, half of them published more than 60% of negative messages, and a quarter more than 75%. Figure 22 exhibits the average negativity as a function of the opinion, one notices a correlation between the negativity and the opinion extremity. Opinion extremity hereby considered as the absolute value of the opinion, with Emmanuel Macron (center) as a reference at 0, the historical moderate parties represented by their leaders Anne Hidalgo (left) and Valerie Pécresse (right) around 0.3 and more extreme candidates at more than 0.6 like Jean-Luc Mélenchon (far left) or Marine Le Pen (far right). The correlation between the average negativity and the absolute value of opinion equals 0.3 (\(p<10^{-9}\)), which means that the more extreme a political leader’s position, the more negative his or her statements.
Determining the average negativity of every user present in the above depicted Twittersphere is unrealistic considering the computational cost of the sentiment analysis and the need of sufficient tweets for each user to obtain a significant statistics. We will then assign to our user an intrinsic negativity drawn from the empirical distribution in function of their initial opinion.
The sentiment analysis performed on the tweets allow us to estimate the negativity bias of our users. Such an estimation is arduous due to the mere use of Twitter recommender and by our impossibility to know what message is actually presented by the platform to the users. As displayed on Figure 23, more than half of the messages are not retweeted a single time, only Twitter knows if its because these messages are bland or just have not been shown to others. The average negativity of messages decreases for an increasing number of retweets bellow few hundreds — as display on Figure 24 — retweet that we suppose to be associated to the author identity instead of the mere content, hypothesis to be verified in further works. The average negativity then increase significantly for a large number of retweets: highly popular messages are heavily negative.
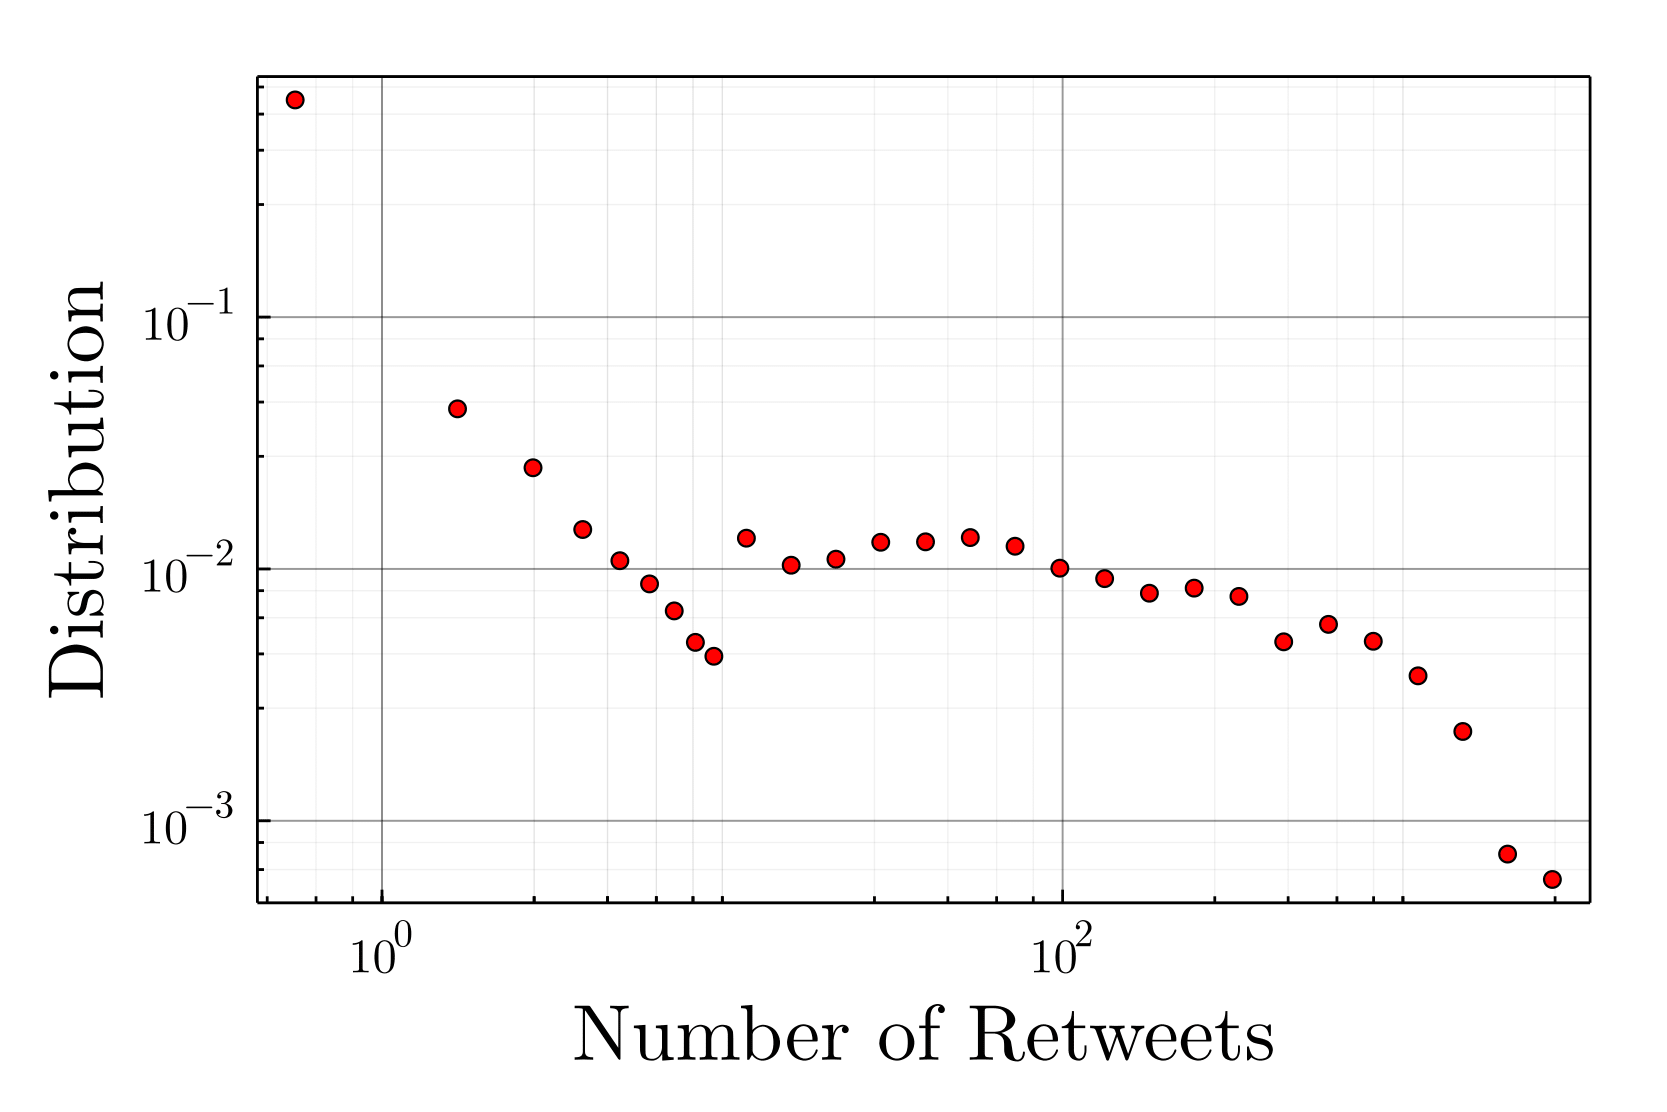
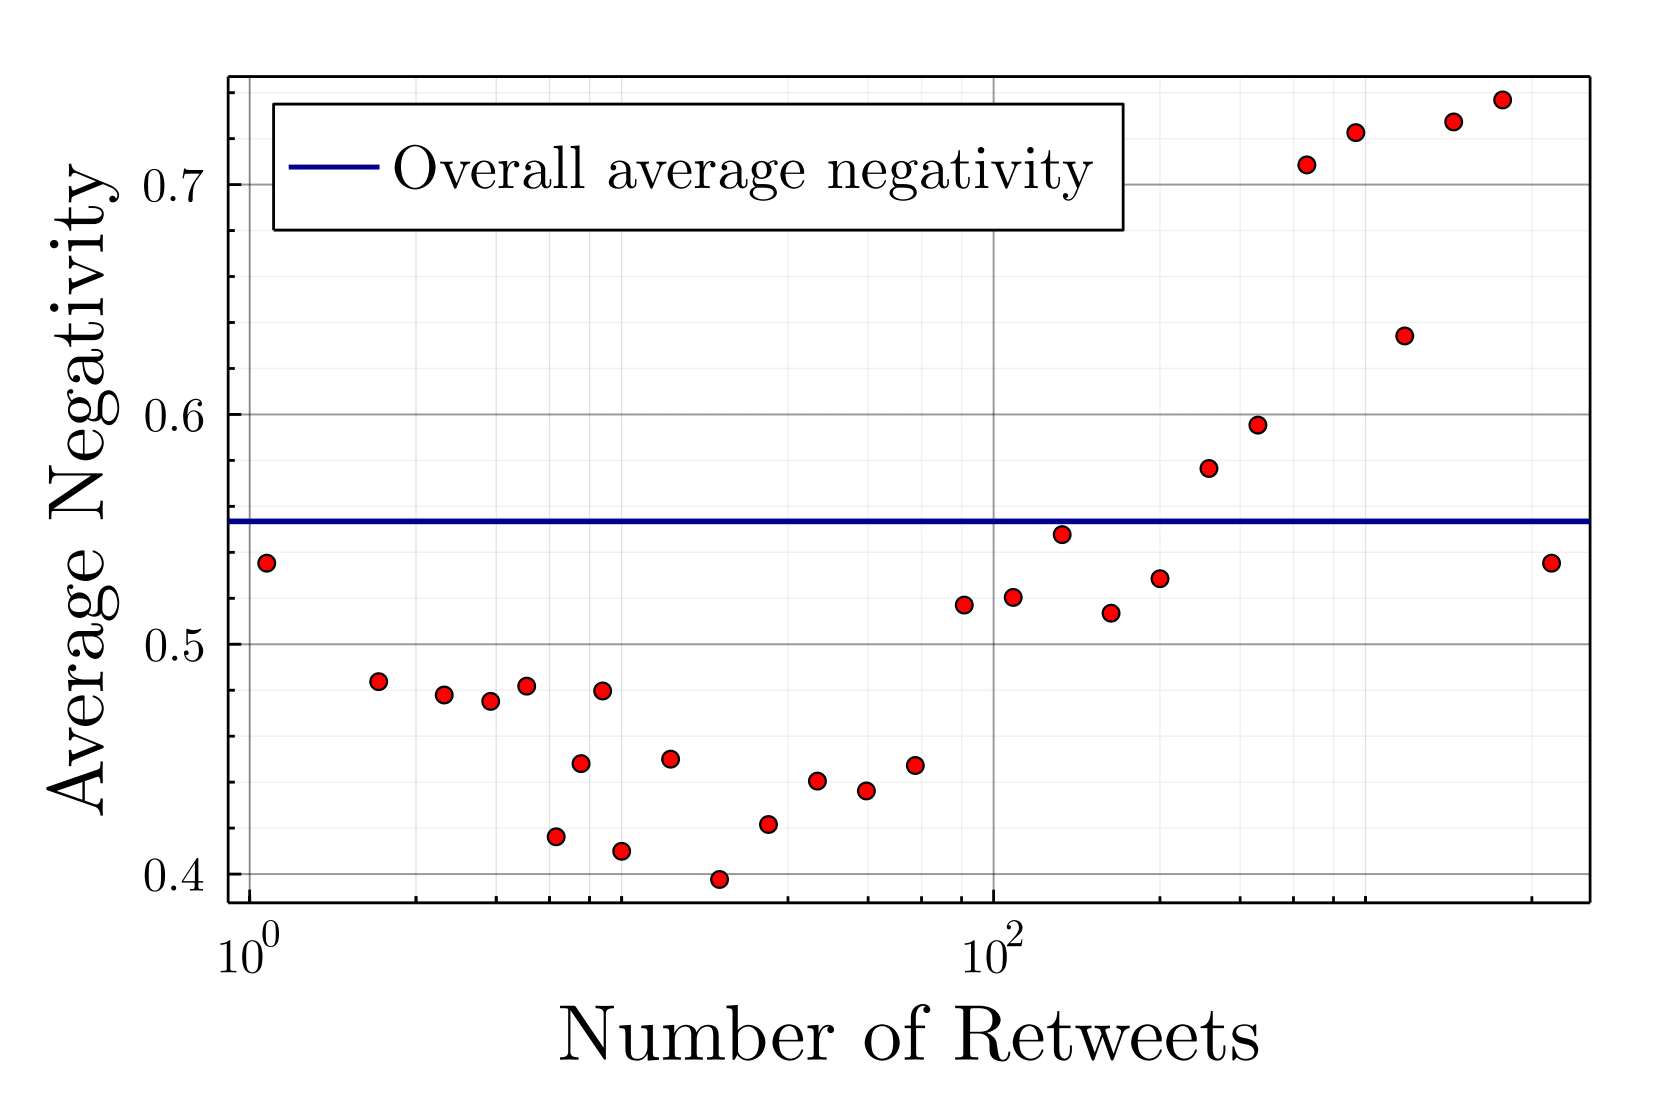
In absence of impressions information, every estimation of the negativity bias is debatable, we nevertheless assumed that the messages published by a given political leader are presented by the algorithmic recommendation in a similar way. Hence we estimate the negativity bias of our agents by comparing for each leader the average number of retweets for the messages labeled as negative and labeled as positive/neutral. The estimated negativity bias is presented for the different political leaders in Table 4; using this estimation we assigned a negativity bias to our users based on the leaders present in their communities.
| Leaders | NegBias | Leaders | NegBias | Leaders | NegBias | Leaders | NegBias | Leaders | NegBias |
|---|---|---|---|---|---|---|---|---|---|
| Asselineau | 1.38 | Philippot | 1.15 | DupontAignan | 2.13 | Collard | 1.64 | LePen | 1.18 |
| Zemmour | 1.34 | Ciotti | 4.49 | Wauquiez | 2.56 | Pecresse | 1.5 | Darmanin | 2.15 |
| LeMaire | 1.06 | Macron | 1.14 | Bayrou | 0.94 | Hidalgo | 0.96 | Faure | 1.04 |
| Jadot | 0.99 | Montebourg | 1.88 | Roussel | 1.33 | Bayou | 1.8 | Poutou | 6.1 |
| Arthaud | 2.05 | Autain | 4.0 | ManonAubry | 1.06 | Quatennens | 1.57 | Melenchon | 1.37 |
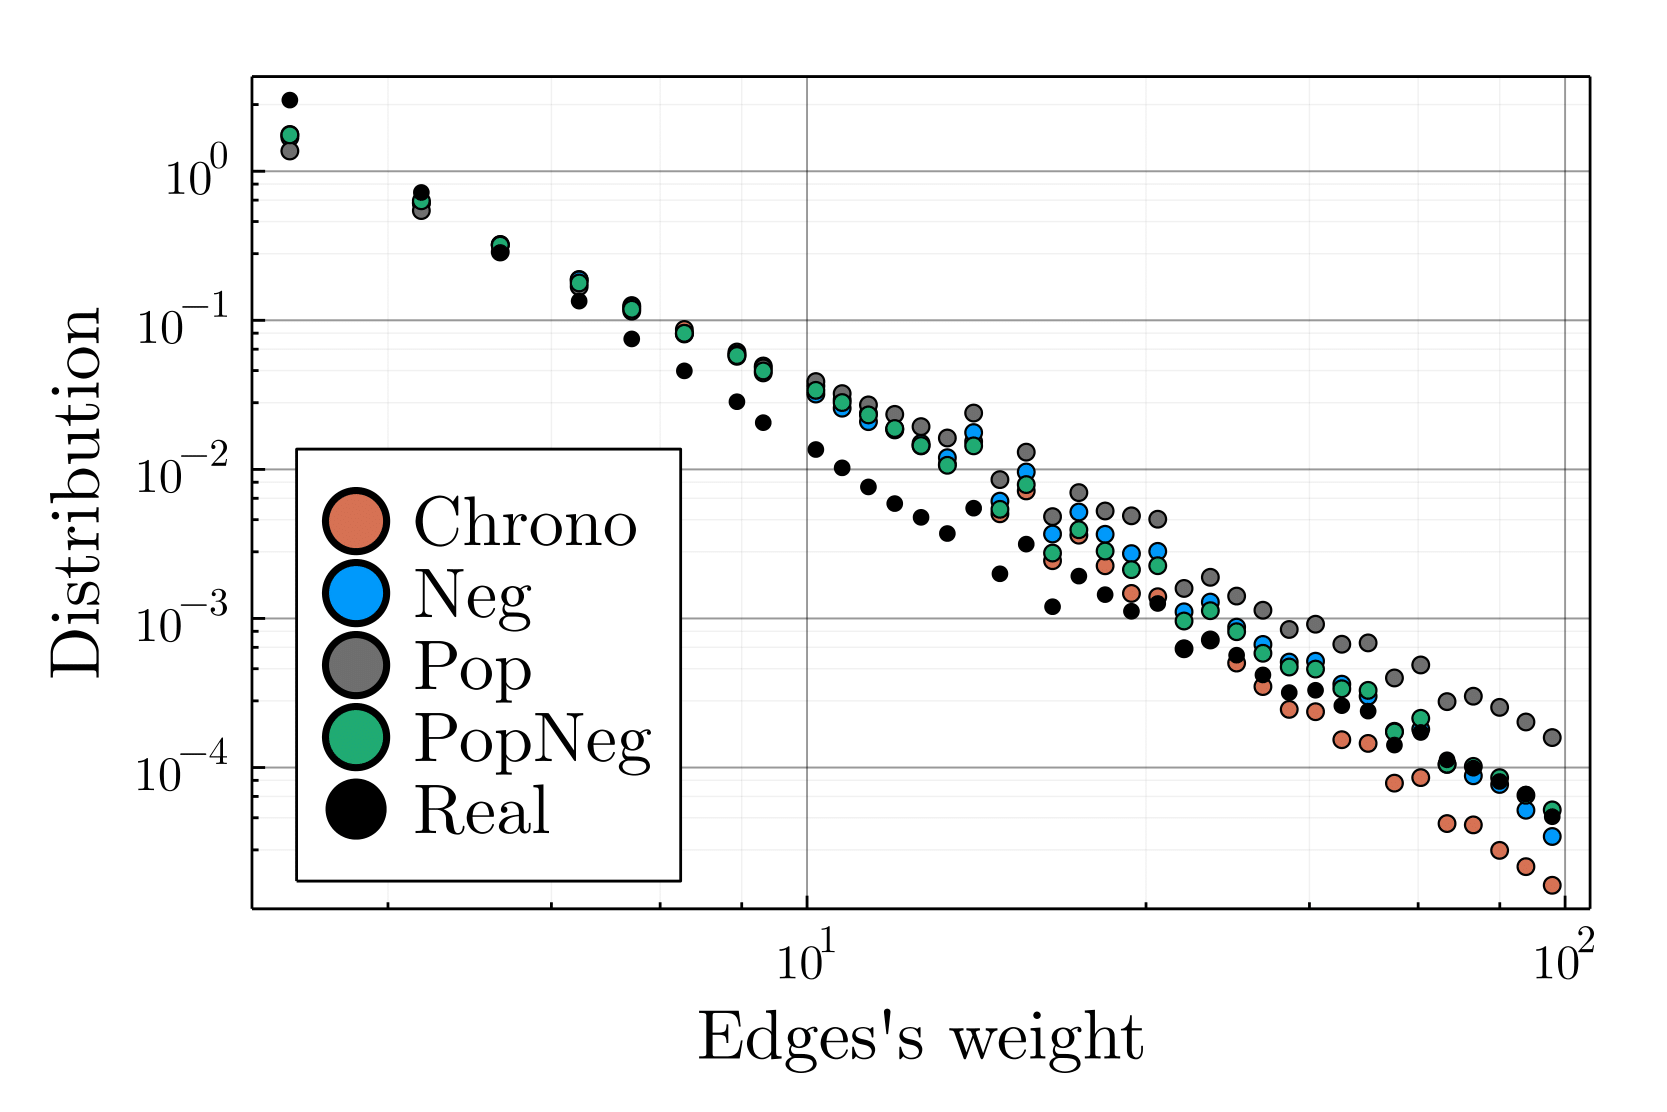
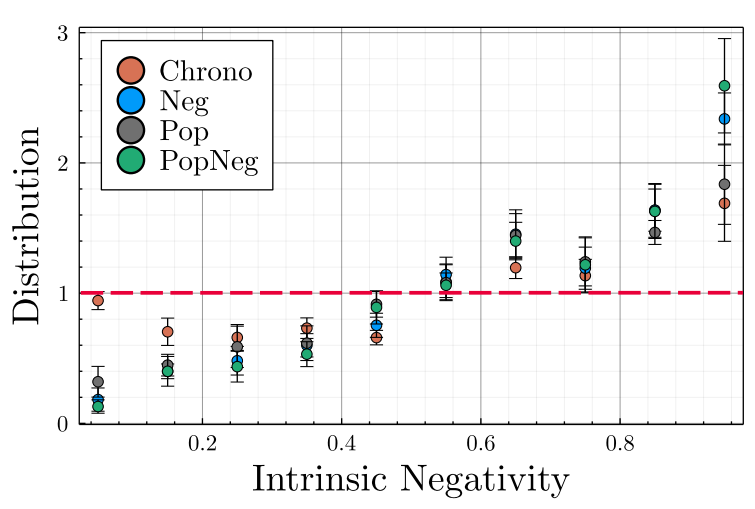
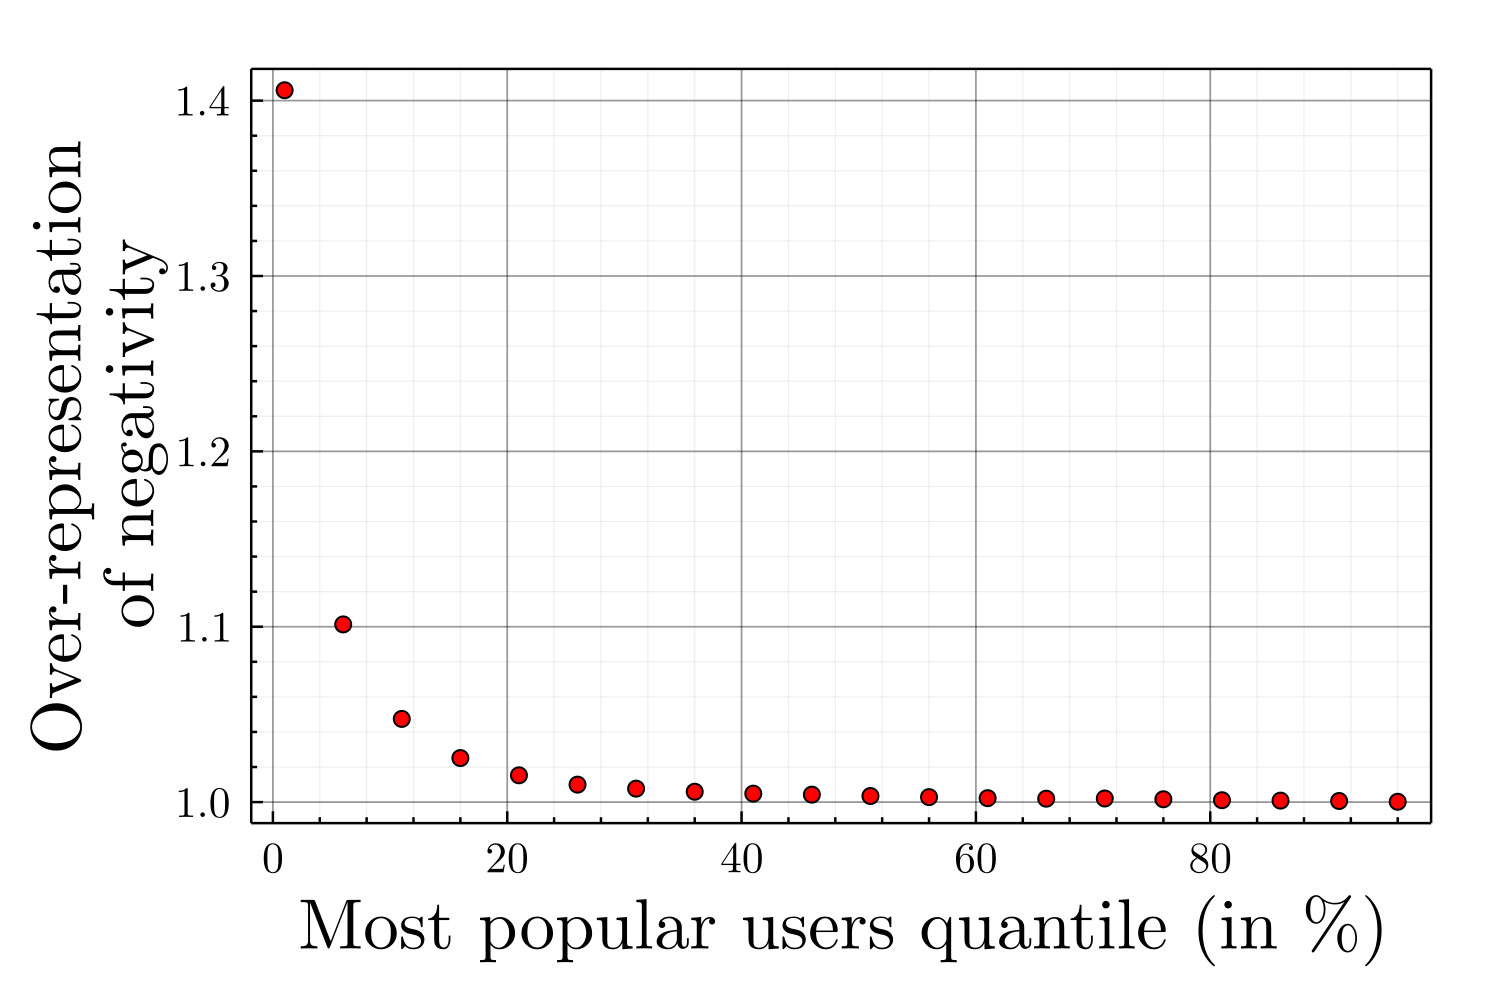
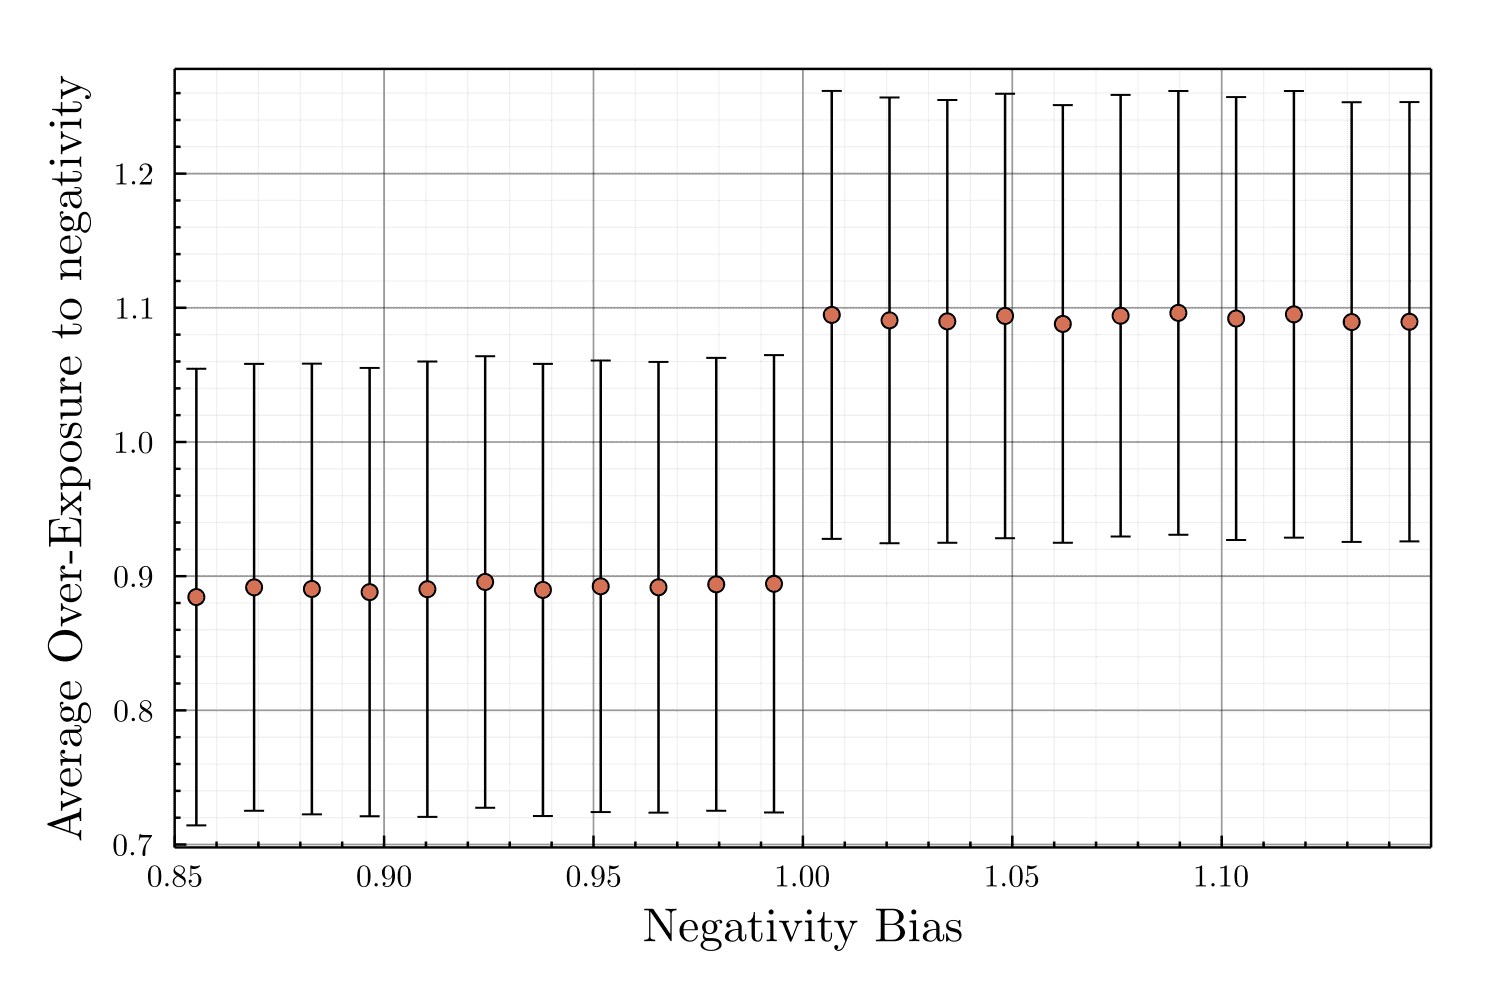
Notes
- See: https://ec.europa.eu/commission/presscorner/detail/en/IP_23_2413↩︎
- Digital Services Act (DSA): https://ec.europa.eu/commission/presscorner/detail/en/ip_22_2545↩︎
- GarganText is an academic free software.↩︎
- The WoS is not exhaustive, its coverage is however sufficient to give an insight of the main research avenues explored in those fields.↩︎
- https://www.cnet.com/tech/services-and-software/youtube-ces-2018-neal-mohan↩︎
- We made the same verification on our own dataset and found similar performances.↩︎
- i.e., addition, subtraction, multiplication, division, modulo, cosine, sine, tangent and their inverse functions.↩︎
- Source code available on (Bouchaud, Chavalarias, & Maziyar 2023)↩︎
- https://digitalservicesact.cc/dsa/art26.html↩︎
- Very Large Online Platforms, see https://ec.europa.eu/commission/presscorner/detail/en/IP_23_2413↩︎
References
ALLCOTT, H., Braghieri, L., Eichmeyer, S., & Gentzkow, M. (2020). The welfare effects of social media. American Economic Review, 110(3), 629–676. [doi:10.1257/aer.20190658]
AXELROD, R. (1997). The dissemination of culture: A model with local convergence and global polarization. Journal of Conflict Resolution, 41(2), 203–226. [doi:10.1177/0022002797041002001]
BARBERÁ, P. (2015). Birds of the same feather tweet together: Bayesian ideal point estimation using Twitter data. Political Analysis, 23(1), 76–91.
BASTIAN, M., Heymann, S., & Jacomy, M. (2009). Gephi: An open source software for exploring and manipulating networks. International AAAI Conference on Weblogs and Social Media. Available at: http://www.aaai.org/ocs/index.php/ICWSM/09/paper/view/154 [doi:10.1609/icwsm.v3i1.13937]
BAUMANN, F., Lorenz-Spreen, P., Sokolov, I. M., & Starnini, M. (2020). Modeling echo chambers and polarization dynamics in social networks. Physical Review Letters, 124(4), 048301. [doi:10.1103/physrevlett.124.048301]
BOUCHAUD, P., Chavalarias, D., & Maziyar, P. (2023). Replication Data for: Chavalarias, Bouchaud, Panahi (2023) Can few lines of code change Society? Beyond fack-checking and moderation: how recommender systems toxifies social networking sites. Available at: https://doi.org/10.7910/DVN/WRFMMU [doi:10.1038/s41598-023-43980-4]
BOUCHAUD, P., Chavalarias, D., & Panahi, M. (2023). Crowdsourced audit of Twitter’s recommender systems. Scientific Reports, 13(1), 16815. [doi:10.1038/s41598-023-43980-4]
BRIATTE, F., & Gallic, E. (2015). Recovering the French party space from Twitter data. Science Po Quanti
CASTRO, J., Lu, J., Zhang, G., Dong, Y., & Martínez, L. (2017). Opinion dynamics-based group recommender systems. IEEE Transactions on Systems, Man, and Cybernetics: Systems, 48(12), 2394–2406. [doi:10.1109/tsmc.2017.2695158]
CEYLAN, G., Anderson, I. A., & Wood, W. (2023). Sharing of misinformation is habitual, not just lazy or biased. Proceedings of the National Academy of Sciences, 120, e2216614120. [doi:10.1073/pnas.2216614120]
CHAVALARIAS, D. (2022). TOXIC DATA - Comment Les Réseaux Manipulent Nos Opinions. Paris: Flammarion.
CHAVALARIAS, D., Lobbé, Q., & Delanoë, A. (2021). Draw me science: Multi-level and multi-scale reconstruction of knowledge dynamics with phylomemies. Scientometrics, 127(1), 545–575. [doi:10.1007/s11192-021-04186-5]
CHEN, T., & Guestrin, C. (2016). XGBoost: A scalable tree boosting system. Proceedings of the 22nd ACM SIGKDD International Conference on Knowledge Discovery and Data Mining [doi:10.1145/2939672.2939785]
CHOMEL, V., Cuvelle-Magar, N., Panahi, M., & Chavalarias, D. (2022). Polarization identification on multiple timescale using representation learning on temporal graphs in Eulerian description. Available at: https://openreview.net/forum?id=P_MSQXnNhS
CINUS, F., Minici, M., Monti, C., & Bonchi, F. (2022). The effect of people recommenders on echo chambers and polarization. Proceedings of the International AAAI Conference on Web and Social Media [doi:10.1609/icwsm.v16i1.19275]
CONOVER, M. D., Goncalves, B., Ratkiewicz, J., Flammini, A., & Menczer, F. (2011). Predictingthepolitical alignment of twitter users. 2011 IEEE Third Intl Conference on Privacy, Security, Risk and Trust and 2011 IEEE Third Intl Conference on Social Computing [doi:10.1109/passat/socialcom.2011.34]
DEFFUANT, G., Neau, D., Amblard, F., & Weisbuch, G. (2000). Mixing beliefs among interacting agents. Advances in Complex Systems, 03(01n04), 87–98. [doi:10.1142/s0219525900000078]
DEGROOT, M. H. (1974). Reaching a consensus. Journal of the American Statistical Association, 69(345), 118–121. [doi:10.1080/01621459.1974.10480137]
DELANOË, A., & Chavalarias, D. (2023). GarganText, collaborative and decentralized LibreWare (V0.0.7). CNRS, ISC-PIF (UAR3611). Available at: https://gitlab.iscpif.fr/gargantext/main
DIMOCK, M., & Wike, R. (2020). America is exceptional in the nature of its political divide. Pew Research Center. Available at: https://www.pewresearch.org/fact-tank/2020/11/13/america-is-exceptional-in-the-nature-of-its-political-divide/
DOHERTY, C., Kiley, J., & Jameson, B. (2016). Partisanship and political animosity in 2016. Pew Research Center. Available at: https://www.pewresearch.org/politics/2016/06/22/partisanship-and-political-animosity-in-2016/
DONG, Y., Zhan, M., Kou, G., Ding, Z., & Liang, H. (2018). A survey on the fusion process in opinion dynamics. Information Fusion, 43, 57–65. [doi:10.1016/j.inffus.2017.11.009]
EPSTEIN, R. (2018). The search suggestion effect (SSE): How search suggestions can be used to shift opinions and voting preferences dramatically and without people’s awareness. 98 th annual meeting of the Western Psychological Association, Portland, USA [doi:10.2139/ssrn.4535163]
FASSI, L., Orben, A., Sackur, J., David, C., Delanoë, A., de Gelder, B., Brunori, M., Datchary, C., Hernandez, L., Víctor, R.-D., Lobbé, Q., Pediconi, M. G., Romani, S., Soria-Frisch, A., & Tummolini, L. (2023). Digital embedding, mental health, cognition and identity. Toward a Research Agenda on Digital Media and Humanity Well-Being
FORTIN, F. A., De Rainville, F. M., Gardner, M. A., Parizeau, M., & Gagné, C. (2012). DEAP: Evolutionary algorithms made easy. Journal of Machine Learning Research, 13, 2171–2175. [doi:10.1145/2330784.2330799]
GARIMELLA, K., De Francisci Morales, G., Gionis, A., & Mathioudakis, M. (2018). Quantifying controversy on social media. ACM Transactions on Social Computing, 1(1), 1–27. [doi:10.1145/3140565]
GAUMONT, N., Panahi, M., & Chavalarias, D. (2018). Reconstruction of the socio-semantic dynamics of political activist Twitter networks - Method and application to the 2017 French presidential election. PLoS One, 13(9), e0201879. [doi:10.1371/journal.pone.0201879]
HAGEY, K., & Horwitz, J. (2021). Facebook tried to make its platform a healthier place. It got angrier instead. Wall Street Journal. Available at: https://www.wsj.com/articles/facebook-algorithm-change-zuckerberg-11631654215
HEGSELMANN, R., & Krause, U. (2002). Opinion dynamics and bounded confidence models, analysis and simulation. Journal of Artificial Societies and Social Simulation, 5(3), 2. https://jasss.soc.surrey.ac.uk/5/3/2.html [doi:10.18564/jasss.5257]
HOLLEY, R. A., & Liggett, T. M. (1975). Ergodic theorems for weakly interacting infinite systems and the voter model. The Annals of Probability, 3(4), 643–663. [doi:10.1214/aop/1176996306]
HUSZÁR, F., Ktena, S. I., O’Brien, C., Belli, L., Schlaikjer, A., & Hardt, M. (2022). Algorithmic amplification of politics on Twitter. Proceedings of the National Academy of Sciences, 119(1), e2025334119.
JACOMY, M., Venturini, T., Heymann, S., & Bastian, M. (2014). ForceAtlas2, a continuous graph layout algorithm for handy network visualization designed for the gephi software. PLoS ONE ONE, 9(6), e98679. [doi:10.1371/journal.pone.0098679]
JAGER, W., & Amblard, F. (2005). Uniformity, bipolarization and pluriformity captured as generic stylized behavior with an agent-Based simulation model of attitude change. Computational & Mathematical Organization Theory, 10, 295–303. [doi:10.1007/s10588-005-6282-2]
JIA, P., MirTabatabaei, A., Friedkin, N. E., & Bullo, F. (2015). Opinion dynamics and the evolution of social power in influence networks. SIAM Review, 57(3), 367–397. [doi:10.1137/130913250]
JIANG, C., Duan, R., Jain, H. K., Liu, S., & Liang, K. (2015). Hybrid collaborative filtering for high-involvement products: A solution to opinion sparsity and dynamics. Decision Support Systems, 79, 195–208. [doi:10.1016/j.dss.2015.09.002]
KLAYMAN, J. (1995). Varieties of confirmation bias. In J. Busemeyer, R. Hastie, & D. L. Medin (Eds.), Psychology of Learning and Motivation (Vol. 32, pp. 385–418). New York, NY: Academic Press. [doi:10.1016/s0079-7421(08)60315-1]
KNOBLOCH-WESTERWICK, S., Mothes, C., & Polavin, N. (2017). Confirmation bias, ingroup bias, and negativity bias in selective exposure to political information. Communication Research, 47(1), 104–124. [doi:10.1177/0093650217719596]
LEICHT, E. A., & Newman, M. E. J. (2008). Community structure in directed networks. Physical Review Letters, 100(11). [doi:10.1103/physrevlett.100.118703]
LEVINSSON, A., Miconi, D., Li, Z., Frounfelker, R. L., & Rousseau, C. (2021). Conspiracy theories, psychological distress, and sympathy for violent radicalization in young adults during the COVID-19 pandemic: A cross-Sectional study. International Journal of Environmental Research and Public Health, 18(15), 7846. [doi:10.3390/ijerph18157846]
MARTIN, L., Muller, B., Ortiz Suárez, P. J., Dupont, Y., Romary, L., de la Clergerie, E., Seddah, D., & Sagot, B. (2020). CamemBERT: A tasty French language model. Proceedings of the 58th Annual Meeting of the Association for Computational Linguistics [doi:10.18653/v1/2020.acl-main.645]
MCPHERSON, M., Smith-Lovin, L., & Cook, J. M. (2001). Birds of a feather: Homophily in social networks. Annual Review of Sociology, 27(1), 415–444. [doi:10.1146/annurev.soc.27.1.415]
MESTRE, A. (2022). Eric Zemmour, nouveau président de la fachosphère? Le Monde. Available at: https://www.lemonde.fr/politique/article/2022/03/31/eric-zemmour-nouveau-president-de-la-fachosphere_6119985_823448.html
MUSCO, C., Musco, C., & Tsourakakis, C. E. (2018). Minimizing polarization and disagreement in social networks. Proceedings of the 2018 World Wide Web Conference - WWW ’18 [doi:10.1145/3178876.3186103]
NOORAZAR, H., Vixie, K. R., Talebanpour, A., & Hu, Y. (2020). From classical to modern opinion dynamics. International Journal of Modern Physics C, 31(07), 2050101. [doi:10.1142/s0129183120501016]
PERALTA, A. F., Kertész, J., & Iñiguez, G. (2022). Opinion dynamics in social networks: From models to data. arXiv preprint. Available at: http://arxiv.org/abs/2201.01322
PERRA, N., Gonçalves, B., Pastor-Satorras, R., & Vespignani, A. (2012). Activity driven modeling of time varying networks. Scientific Reports, 2(1), 1–7. [doi:10.1038/srep00469]
PERRA, N., & Rocha, L. E. C. (2019). Modelling opinion dynamics in the age of algorithmic personalisation. Scientific Reports, 9(1), 7261. [doi:10.1038/s41598-019-43830-2]
PESCETELLI, N., Barkoczi, D., & Cebrian, M. (2022). Bots influence opinion dynamics without direct human-bot interaction: The mediating role of recommender systems. Applied Network Science, 7(1), 1–19. [doi:10.21203/rs.3.rs-1401919/v1]
RAMACIOTTI Morales, P., & Cointet, J.-P. (2021). Auditing the effect of social network recommendations on polarization in geometrical ideological spaces. RecSys ’21: 15th ACM Conference on Recommender Systems [doi:10.1145/3460231.3478851]
REYERO, T. M., Beiró, M. G., Alvarez-Hamelin, J. I., Hernández, L., & Kotzinos, D. (2021). Evolution of the political opinion landscape during electoral periods. EPJ Data Science, 10(1), 31.
ROSSI, W. S., Polderman, J. W., & Frasca, P. (2022). The closed loop between opinion formation and personalized recommendations. IEEE Transactions on Control of Network Systems, 9(3), 1092–1103. [doi:10.1109/tcns.2021.3105616]
ROZIN, P., & Royzman, E. B. (2001). Negativity bias, negativity dominance, and contagion. Personality and Social Psychology Review, 5(4), 296–320. [doi:10.1207/s15327957pspr0504_2]
SANTOS, F. P., Lelkes, Y., & Levin, S. A. (2021). Link recommendation algorithms and dynamics of polarization in online social networks. Proceedings of the National Academy of Sciences, 118(50), e2102141118. [doi:10.1073/pnas.2102141118]
SÎRBU, A., Pedreschi, D., Giannotti, F., & Kertész, J. (2019). Algorithmic bias amplifies opinion fragmentation and polarization: A bounded confidence model. PLoS One, 14(3), e0213246.
TOKITA, C. K., Guess, A. M., & Tarnita, C. E. (2021). Polarized information ecosystems can reorganize social networks via information cascades. Proceedings of the National Academy of Sciences, 118(50), e2102147118. [doi:10.1073/pnas.2102147118]
TÖRNBERG, P. (2022). How digital media drive affective polarization through partisan sorting. Proceedings of the National Academy of Sciences, 119(42), e2207159119.
TRAAG, V. A., Waltman, L., & Eck, N. J. van. (2019). From louvain to leiden: Guaranteeing well-connected communities. Sci Rep, 9(1). [doi:10.1038/s41598-019-41695-z]
TROITZSCH, K. G. (2017). Using empirical data for designing, calibrating and validating simulation models. In W. Jager, R. Verbrugge, A. Flache, G. de Roo, L. Hoogduin, & C. Hemelrijk (Eds.), Advances in Social Simulation 2015 (pp. 413–427). Berlin Heidelberg: Springer. [doi:10.1007/978-3-319-47253-9_38]
TWITTER. (2020). Using Twitter. Available at: https://help.twitter.com/en/using-twitter
UVA Center for Politics. (2021). New initiative explores deep, persistent divides between Biden and Trump voters - Sabato’s crystal ball. Available at: https://centerforpolitics.org/crystalball/articles/new-initiative-explores-deep-persistent-divides-between-biden-and-trump-voters/
VOSOUGHI, S., Roy, D., & Aral, S. (2018). The spread of true and false news online. Science, 359(6380), 1146–1151. [doi:10.1126/science.aap9559]
WENG, L., Zhang, Q., Lin, Z., Wu, L., & Zhang, J.-H. (2023). Integrating interactions between target users and opinion leaders for better recommendations: An opinion dynamics approach. Computer Communications, 198, 98–107. [doi:10.1016/j.comcom.2022.11.011]
XU, Z., & Yang, Q. (2012). Analyzing user retweet behavior on twitter. 2012 IEEE/ACM International Conference on Advances in Social Networks Analysis and Mining
ZUBROW, K. (2021). Facebook whistleblower says company incentivizes "angry, polarizing, divisive content". CBS NEWS. Available at: https://www.cbsnews.com/news/facebook-whistleblower-frances-haugen-60-minutes-polarizing-divisive-content/