Corrigendum to 'Identifying Personal and Social Drivers of Dietary Patterns: An Agent-Based Model of Dutch Consumer Behavior', Journal of Artificial Societies and Social Simulation, 27 (1) 4, 2024

, ,
and
aUtrecht University, Netherlands; bVrije Universiteit Amsterdam, Netherlands; cWageningen University & Research, Netherlands
Journal of Artificial
Societies and Social Simulation 28 (2) 3
<https://www.jasss.org/28/2/3.html>
DOI: 10.18564/jasss.5653
Received: 05-Mar-2025 Accepted: 06-Mar-2025 Published: 31-Mar-2025
Abstract
This corrigendum refers to 'Identifying Personal and Social Drivers of Dietary Patterns: An Agent-Based Model of Dutch Consumer Behavior', Journal of Artificial Societies and Social Simulation, 27 (1) 4, 2024.Corrections summary
An error in the household and social network creation caused the distribution of household incomes to not entirely accurately reflect the Dutch data with which the model was parameterized, and some consumers to be linked to multiple households. These errors have been corrected and the model rerun. There are very minimal changes to the results, but the distribution of diets in the population now better matches the empirical data, as far fewer consumers are in the ‘financially constrained’ category. Otherwise, the model outcomes are qualitatively nearly the same. The model itself is also the same, though to correct the household network formation error, the number of households (rather than consumers) was specified – the number of consumers can therefore vary slightly. The parameters for motivations were also changed slightly to calibrate the updated model to the dietary frequency in the empirical data. In the corrections below, the updated figures and relevant results and discussion text are described.
Correction 1: A correction to Table 7 of the original article
As part of correcting this error in the code (which is updated at this link: https://www.comses.net/codebases/a0f46686-41cc-4e55-a55e-4eb97783a2ba/releases/1.1.0/), the number of households was used as a model parameter, rather than the number of consumers. The first column of Table 7 originally reported in the article has been revised (Davis et al. 2024). Table 1 below replaces the original Table 7.
| Variable | Description | Symbol | Data type and range | Baseline value | Range for sensitivity analysis |
|---|---|---|---|---|---|
| No. of households | The number of households in the simulation run | \(N\) | Integer [1, unbounded) | 160 | [80, 240] |
| Initial rewiring probability | The probability of rewiring when setting up the network initially | \(p(r)\) | Integer [0, 1] | 0.5 | [0.25, 0.75] |
| Initial mean ‘friends’ network node degree | The average number of friends a consumer is connected to initially | \(\mu(d_{F})\) | Integer [0, unbounded) | 5 | [2, 11] |
| Initial mean node degree | The total number of close friends and acquaintances a consumer is connected to initially | \(\mu(d)\) | Integer [1, 200] | 50 | [25, 75] |
| Mean household network link strength | Mean link strength among social contacts in the same household | \(\mu(L_{H})\) | Numeric (0, 1] | 0.925 | [0.879, 0.971] |
| SD of household network link strength | Standard deviation of link strength among household contacts | \(\sigma(L_{H})\) | Numeric (0, 1] | 0.025 | [0.024, 0.026] |
| Mean ‘friends’ network link strength | Mean link strength among friends in the network | \(\mu(L_{F})\) | Numeric (0, 1] | 0.825 | [0.784, 0.866] |
| SD of ‘friends’ network link strength | Standard deviation of link strength among friends | \(\sigma(L_{F})\) | Numeric (0, 1] | 0.025 | [0.024, 0.026] |
| Mean ‘acquaintances’ network link strength | Mean link strength among acquaintances in the network | \(\mu(L_{A})\) | Numeric (0, 1] | 0.350 | [0.175, 0.525] |
| SD of ‘acquaintances’ link strength | Standard deviation of link strength among acquaintances | \(\sigma(L_{A})\) | Numeric (0, 1] | 0.05 | [0.025, 0.075] |
| Max. number of contacts per step | Maximum number of contacts a consumer can make in each timestep | \(X_{max}\) | Integer [0, No. of consumers] | 10 | [5, 15] |
| Social information adherence scaling factor | Multiplier of social information adherence input data | \(\alpha\) | Numeric [0, 1] | 0.025 | [0.001, 0.1] |
| Mean satisfaction threshold | Mean of consumer satisfaction thresholds across the population | \(\mu(T)\) | Numeric [0, 1] | 0.50 | [0.25, 0.75] |
| SD of satisfaction threshold | Standard deviation of consumer satisfaction thresholds across the population | \(\sigma(T)\) | Numeric [0, 1] | 0.05 | [0.025, 0.075] |
| Mean max. % of income spent on food | Mean of the percent of income consumers consider feasible maximum to spend on food | \(\mu(S)\) | Numeric [0.1, 0.2] | 0.16 | [0.08, 0.24] |
| SD of max % of income spent on food | Standard deviation of percent of income considered feasible maximum | \(\sigma(S)\) | Numeric [0.01, 0.05] | 0.01 | [0.005, 0.015] |
| Taste perception change rate | Rate of taste perception change with exposure | \(k\) | Numeric [0,1] | 0.01 | [0.005, 0.015] |
| Taste perception change gradient | Gradient of taste perception change from previous value | \(\phi\) | Numeric (0, Inf) | 50 | N/A2 |
| Taste perception change error | Stochastic error applied to taste perception change when a diet is consumed | \(E\) | Numeric [0, 1] | 0.001 | [0.0005, 0.0015] |
| Link strength change rate | Rate of link strength change with interaction | \(\gamma\) | Numeric [0, 1] | 0.001 | [0.0005, 0.0015] |
| Link strength change gradient | Gradient of link strength change from previous value | \(\Delta\) | Numeric (0, Inf) | 50 | N/A3 |
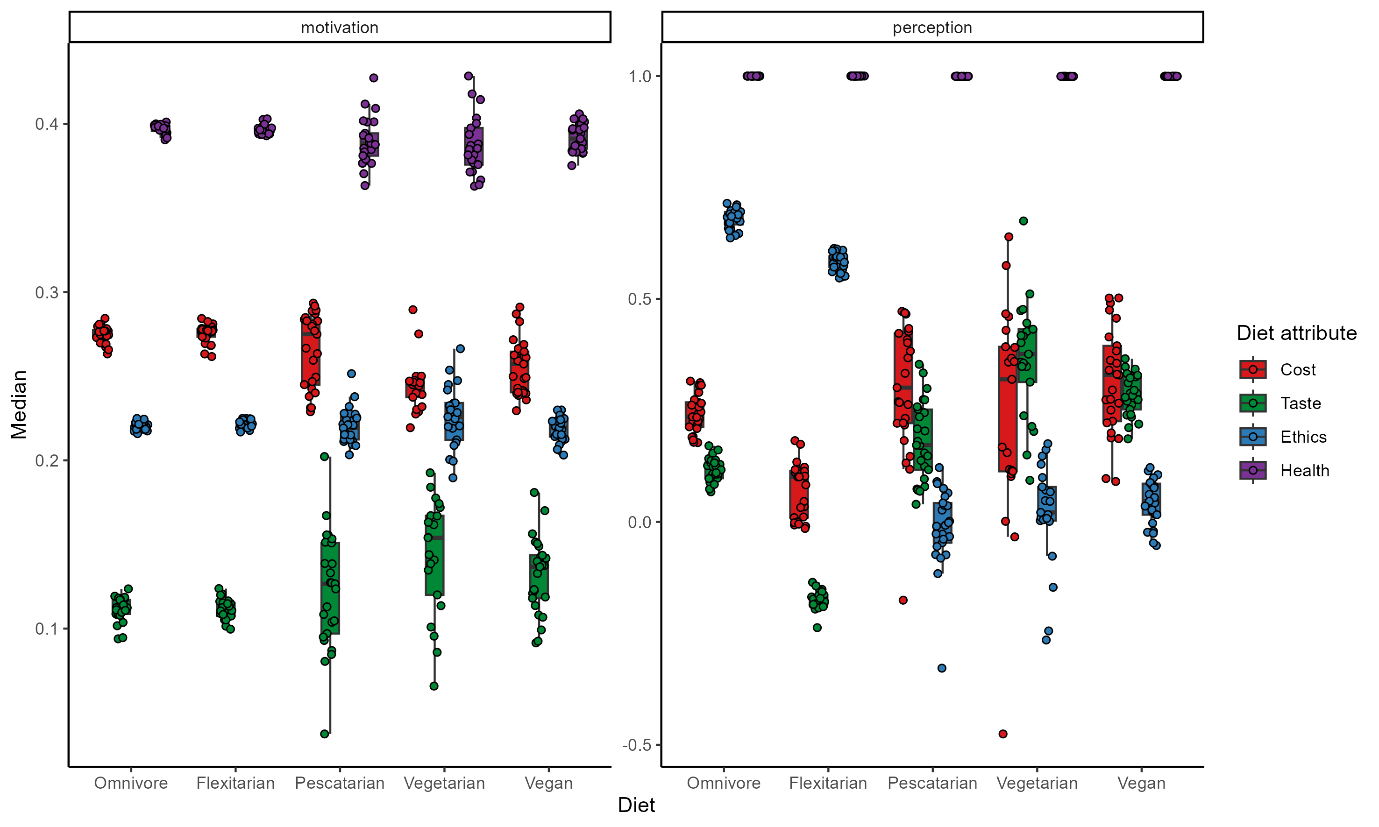
Correction 2: A correction to Figure 2 of the original article
Due to the nature of the household creation error described in Correction 1, the model runs were redone and re-analyzed, using the same analysis scripts as before. The updated figures are detailed in the corrections below. For convenience, the figure captions are also included here, but these were unchanged in respect to the article. Figure 1 below replaces Figure 2 in Davis et al. (2024).
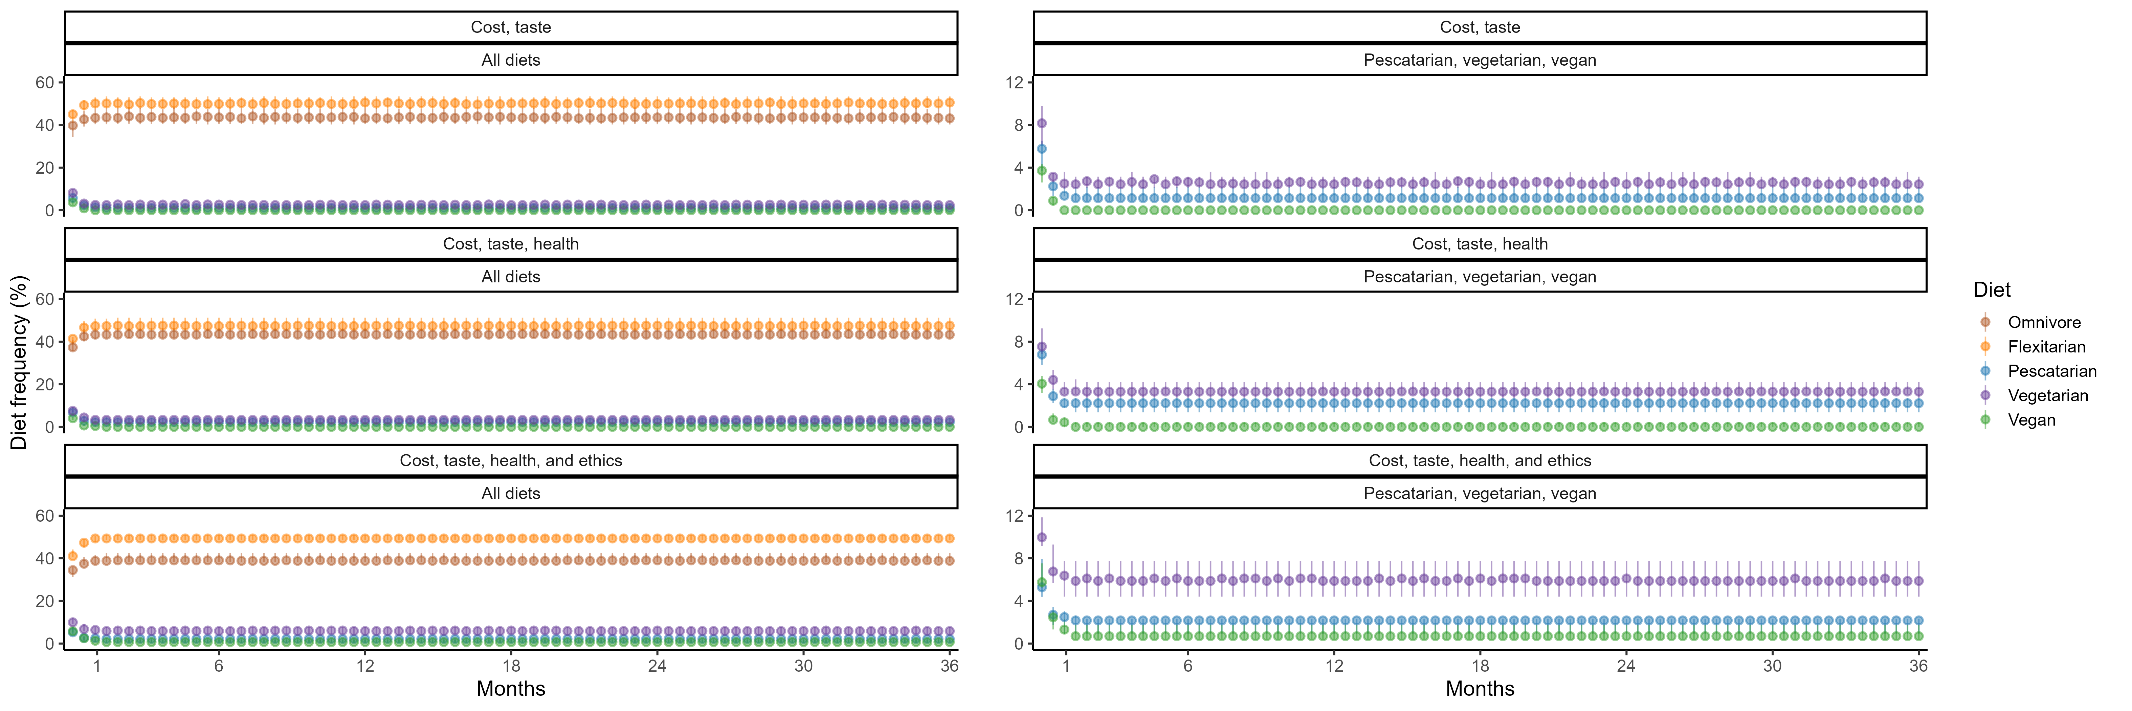
The related text in the Discussion (Davis et al. 2024, Section 4.11, sentences 3-4), updated accordingly, would also remove sentence 3 about the popularity of flexitarian and vegetarian diets increasing with price decreases. Now, the text should read as follows:
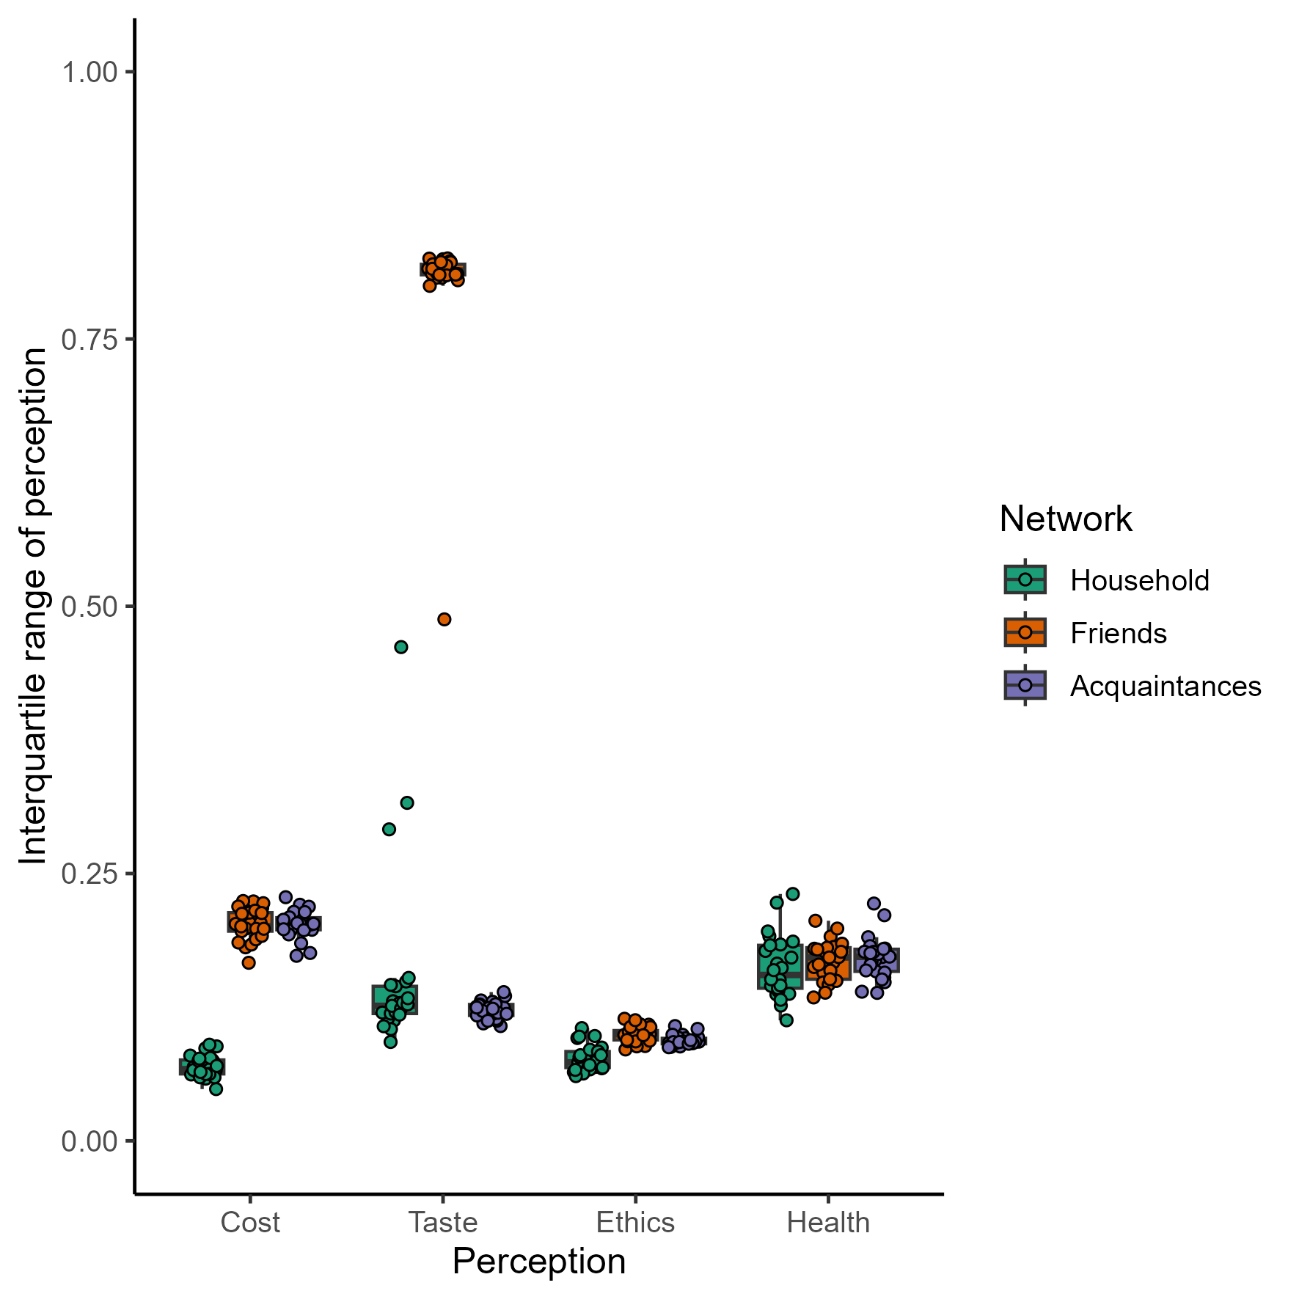
Correction 3: A correction to Figure 3 of the original article
Figure 2 replaces Figure 3 of the original article (Davis et al. 2024).
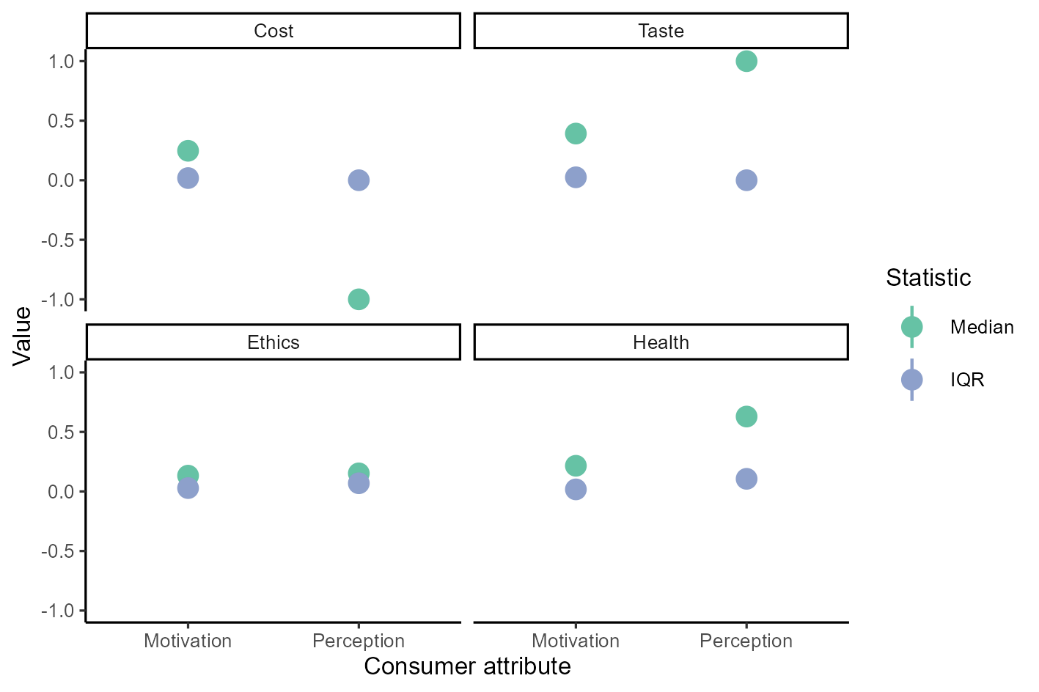
The accompanying text (Davis et al. 2024, Section 3.4) should also be updated to remove the note about higher interquartile range of the consumers’ ethics perceptions, and therefore should read:
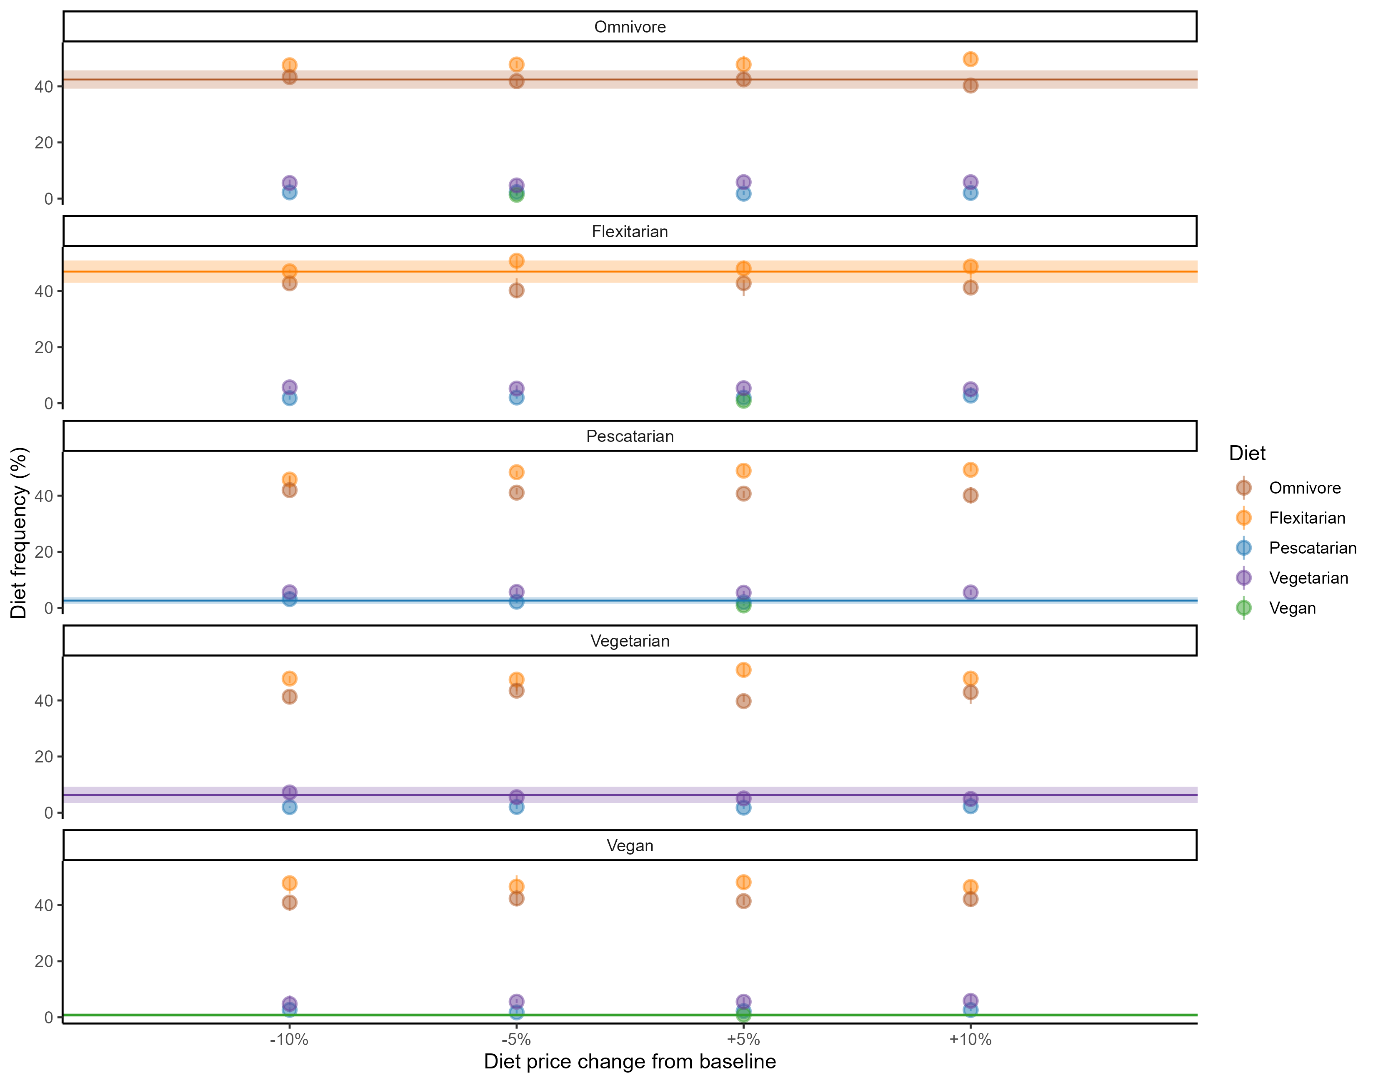
Correction 4: A correction to Figure 4 of the original article
Figure 3 below replaces Figure 4 of the original article (Davis et al. 2024, Section 3.6), and the accompanying text should be updated as the vegetarian diet no longer showed an increase in popularity with a decreased price, but flexitarian diets did become more popular when omnivore diets increased in price. It should therefore read:
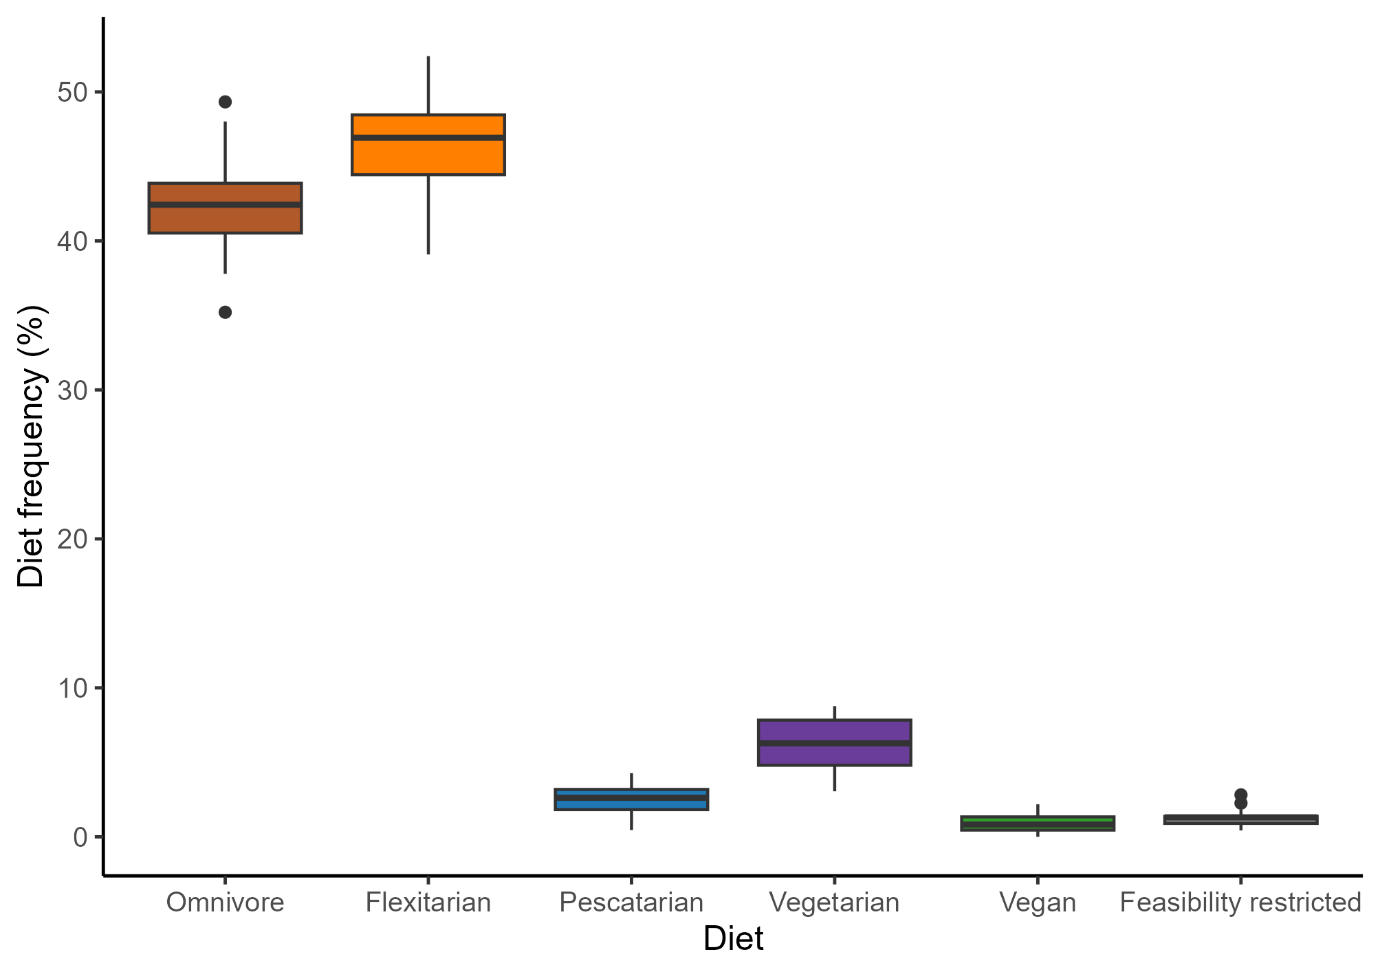
Correction 5: A correction to Figure 5 of the original article
Figure 4 replaces Figure 5 of the original article (Davis et al. 2024, Section 3.7).
Correction 6: A correction to Figure 6 of the original article
Figure 5 replaces Figure 6 of the original article (Davis et al. 2024, Section 3.9).
Correction 7: A correction to Figure 7 of the original article
Figure 6 replaces Figure 7 of the original article (Davis et al. 2024, Section 3.10).
References
DAVIS, N., Dermody, B., Koetse, M., & van Voorn, G. (2024). Identifying Personal and Social Drivers of Dietary Patterns: An Agent-Based Model of Dutch Consumer Behavior. Journal of Artificial Societies and Social Simulation. 27 (1) 4: http://jasss.soc.surrey.ac.uk/27/1/4.html. [doi:10.18564/jasss.5020]