Consumer Heterogeneity and E-Retailing Market Concentration: An Agent-Based Approach

aCollege of Economics and Management, Huazhong Agricultural University, Wuhan, China; bDepartment of Sociology, University of Groningen, Netherlands
Journal of Artificial
Societies and Social Simulation 28 (4) 3
<https://www.jasss.org/28/4/3.html>
DOI: 10.18564/jasss.5699
Received: 26-Jul-2024 Accepted: 10-Jul-2025 Published: 31-Oct-2025
Abstract
The phenomenon of high concentration in China's e-retail markets remains not fully understood. This study aims to explore its potential origins from the perspective of consumer types. By theoretically examining the impact of consumer type on market structure, this study assumes sellers to be homogeneous, while categorizing consumers based on two dimensions: risk-taking tendency (preference for new products over old ones) and pickiness tendency (likelihood to give negative rather than positive ratings). An agent-based simulation model is developed to examine the trends of market concentration ratios under diverse conditions. The simulation findings indicate that consumers' risk-taking tendency influences market concentration and volatility. Specifically, higher risk preference tends to reduce market concentration, making the market more volatile. Similarly, the higher the consumers' pickiness tendency, the more it hinders market concentration. Additionally, the relative weight of word-of-mouth (WoM) on a product plays a crucial role in market dynamics. When the weight of sales is greater, market concentration is more likely. However, if WoM becomes more influential, positive ratings enhance sales' role in increasing market concentration, while negative ratings suppress it. In other words, when picky consumers dominate the market, higher sales, which means more negative ratings, can actually diminish the product's WoM and subsequently reduce the product's attractiveness. This prevents any product from maintaining a sales advantage, making it hard to achieve high market concentration. This research aligns with existing market structure theories and has implications for e-retailers and administrators.Introduction
Economists generally think that market concentration should be understood from supply-side factors such as economies of scale, natural monopoly, industry admission policy, and technological or managerial innovation (Anderson et al. 2012; Andrade et al. 2001; Chu et al. 2022; Kwon et al. 2024; Laincz 2009; Long & Zhang 2012; Matraves & Rondi 2007; Pryor 2001; Ratnayake 1999). These factors allow certain sellers to produce differentiated products and create competitive advantages over their competitors.
In the recently booming online retail market, however, we observe a different form of market concentration. On the same e-commerce platform, there may be hundreds of sellers all selling identical standard products, such as electronics, books, etc. These products are almost homogeneous in terms of production, brand, performance, model, price or consumer experience, etc. Traditional economic theory suggests that there would not be high market concentration in this scenario because the conditions favor a market structure closer to perfect competition, where rational consumers view the products as perfect substitutes. However, this is not the case. For example, since the 1990s, there has been a notable trend of concentration in China’s e-retailing markets (Borsenberger 2015; Wei et al. 2023). On major e-retailing platforms such as Tmall.com or JD.com, it is common for a select few leading sellers to hold a significant proportion of their industries, while the majority of others are essentially ignored by online shoppers. According to the data in July 2023, the online smartphone market in China on JD.com was dominated by just three major players: Apple, Xiaomi, and Honor. These brands held a combined market share of nearly 47% in terms of online sales.1 Similarly, the e-retailing market for sports shoes offers another illustration of this concentration trend, with the market share of the top three brands in China reaching 58.7% in 2020 (Zhou 2021). This begs the question: why are these seemingly identical products so concentrated in a few e-shops?
Strictly homogeneous products, of course, do not exist in practice, and online sellers will differentiate themselves from their competitors by means of "virtual decoration", a strategy that involves enhancing their product listings with better images, detailed descriptions, customer reviews, and other online presentation techniques, which promotes market concentration of standardized products. However, even if we disregard sellers’ attempts to differentiate themselves and assume identical offerings, can this market concentration be entirely eliminated in theory?
Our answer is "no". In the e-commerce retail market, market concentration is not only caused by producers and online sellers, but also by the opinion dynamics of consumers. Despite not having direct personal interaction, online consumers can interact with each other through product sales records and reviews on shopping platforms (Abedin et al. 2021). Past consumption records can influence future consumers’ decision-making. Even if two sellers are objectively indistinguishable from each other, consumer interactions may still create "subjective" differences between them. We propose that this is an important aspect of understanding concentration in e-tailing markets, which refers to the buying and selling of goods and services through online platforms.
Several models have examined the influence of consumers on market dynamics. For instance, Huotari (2017) investigates the interactions between heterogeneous market participants, specifically consumers and differentiated firms, and their reciprocal effects on platform performance, emphasizing the interplay between firm strategies and consumer preferences. Fatas-Villafranca et al. (2019) explore co-evolutionary dynamics between consumers and profit-maximizing firms, highlighting the importance of firm heterogeneity in shaping market outcomes. Yanagita & Onozaki (2008), Yanagita & Onozaki (2010) relax the assumption of fully rational consumers, incorporating a broader range of market actors. Their simulations demonstrate how sellers’ strategies and consumers’ bounded rationality jointly contribute to the emergence of oligopolistic market structures. Complementing these models are the CONSUMAT frameworks, CONSUMAT I (Jager 2000), CONSUMAT II (Jager & Janssen 2012), and the recent HUMAT extension (Jager et al. 2025; Li & Jager 2023), which provide a behavioral perspective on market dynamics. These models effectively link psychological and social influences to consumer behavior, thereby elucidating how bounded rationality shapes market structures. However, they predominantly reflect a traditional economic perspective in which market concentration is primarily driven by firm-side dynamics, offering limited insights into the extent to which consumer behavior, especially bounded rationality and social influence, contributes to this process. In contrast, our study focuses explicitly on the consumer side. By assuming homogeneous firms and identical product offerings, we isolate the impact of consumer heterogeneity on market concentration. In particular, we examine how variations in consumer types affect outcomes in e-commerce markets, offering a novel perspective on the role of demand-side dynamics in shaping market structures.
Recent studies have highlighted the unique and intricate nature of market concentration in e-retailing. Goldmanis et al. (2010) suggest that lower search costs contribute to higher market concentration in e-retailing. When search costs are low, consumers can gather information about sellers more easily, resulting in greater competition and weaker sellers being unable to rely on information asymmetry. Rhodes & Zhou (2019) demonstrate that when search frictions are relatively high, meaning it is difficult or costly for consumers to gather information and compare products effectively, the market tends to be dominated by large firms, leading to higher concentration ratios. Hervas-Drane (2015) argues that word-of-mouth has an impact on e-market concentration and improvements in this area can increase the concentration ratio under specific conditions. Additionally, studies have been conducted to analyze the factors that influence online market concentration, including search engines (Brynjolfsson et al. 2011), network externality (He et al. 2023), and network effects (Haucap & Heimeshoff 2014). These studies, despite different emphases, attempt to account for the concentration of online markets using factors that pertain solely to e-retailing.
In this paper, we aim to investigate the theoretical possibility of market concentration in an e-retailing market where all sellers are considered homogeneous, and particularly, theorize how heterogeneity of the population in these micro-behavioral patterns affects the macro-level outcome of market concentration. Since consumers’ feedback has the potential to create subjective differences, this subjective differentiation could provide certain sellers with a competitive advantage, influencing consumers’ choices and, in extreme cases, leading to "winner-takes-all" and high market concentration. We contend that, beyond objective factors such as quality, cost, or technology, consumer behavior and their subjective beliefs about products can play a pivotal role in determining the concentration of the e-retail market. This perspective aligns with Drucker’s assertion that "consumers define the product" (Drucker 1973), highlighting the significance of consumer behavior in shaping market dynamics. Consumers can be categorized according to their behavioral characteristics. For example, some consumers may prefer purchasing familiar products over entirely new ones. Additionally, the diverse nature of consumer types becomes evident in their evaluations of even identical products. While some individuals like to provide positive feedback, others tend to be pickier, offering predominantly negative reviews. The consequences of these varied consumer actions on the market level merit exploration. Understanding how different consumer types interact with one another can shed light on the dynamics of market concentration.
Agent-based modeling (ABM) was selected as the primary methodology in this study due to its capacity to investigate the intricate dynamics resulting from the interactions of numerous interdependent individuals. ABM offers a simplified depiction of individual psychological processes, modeling social interactions between individuals and their environment whilst adhering to specified assumptions (Gilbert & Troitzsch 2005). Furthermore, ABM enables systematic computer experimentation to examine how theoretical assumptions and contextual conditions, as assumed in research, govern the frequently intricate social dynamics that emerge. Empirically, there are many statistics and surveys that investigate factors that influence market concentration. However, understanding the dynamic mechanisms driving consumer decision-making through empirical data collection alone is challenging. While it is possible to establish relationships between factors and outcomes, the underlying mechanisms by which these factors operate and produce observed results cannot be deduced solely from data observations. In relation to this study, consumers who prefer new products may dampen the current market composition because they move more readily to new products. However, if these consumers tend to give negative reviews on their purchases, it may undermine the emergence of new brands and thus stabilize the market structure. It is unclear how these mechanisms interact precisely, thus we need ABM to explore various theoretical scenarios to facilitate the explication of empirical observations.
Conceptual Framework
To theoretically examine the impact of consumer interactions on market concentration, we categorize consumers into distinct types based on their online shopping behaviors. Prior studies have delineated various consumer typologies according to research contexts and objectives, including distinctions such as high and low involvement (Bloch & Richins 1983), hedonism and pragmatism (Babin et al. 1994), and risk seeking and aversion (Lusk & Coble 2005). This study adopts a classification framework that hinges on two dimensions characterizing the consumer purchasing process. Firstly, consumers’ familiarity with a product shapes their individual preferences (Zhou & Nakamoto 2007). Some individuals prefer purchasing familiar/habitual products, while others enjoy buying new ones (Pandey 2022; Shukla 2009).
Therefore, consumers are first categorized based on their pre-purchase attitudes toward new products. Risk-taking consumers are more inclined to select novel products that they have not yet bought, used, or understood. In contrast, conservative consumers prioritize products they have already purchased and are familiar with. Second, consumers exhibit heterogeneity in their post-purchase rating behavior. Picky consumers tend to leave negative ratings after making a purchase, while tolerant consumers are more likely to leave positive ratings (Bondi et al. 2024; Cheng et al. 2021; Wu et al. 2016).
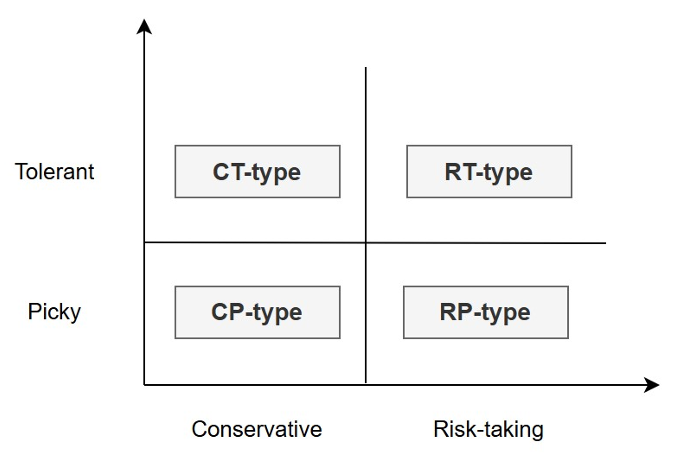
We refer to the first dimension as the consumer’s risk-taking tendency and the second dimension as the pickiness tendency. In extreme cases, consumers can be classified into four types (\(2\times 2\) matrix):
- Risk-taking and Picky (RP-type): These consumers always like to try new products and give negative ratings after purchasing.
- Risk-taking and Tolerant (RT-type): These consumers always try new products and give positive ratings.
- Conservative and Picky (CP-type): These consumers always prefer familiar products and give negative ratings.
- Conservative and Tolerant (CT-type): These consumers always prefer familiar products and give positive ratings.
Of course, both the risk-taking and pickiness tendencies vary in degree, and most consumers may not be at the extremes but rather somewhere between extremely adventurous and extremely conservative, as well as between extremely picky and extremely tolerant. Figure 1 illustrates the different types of consumers within our model.
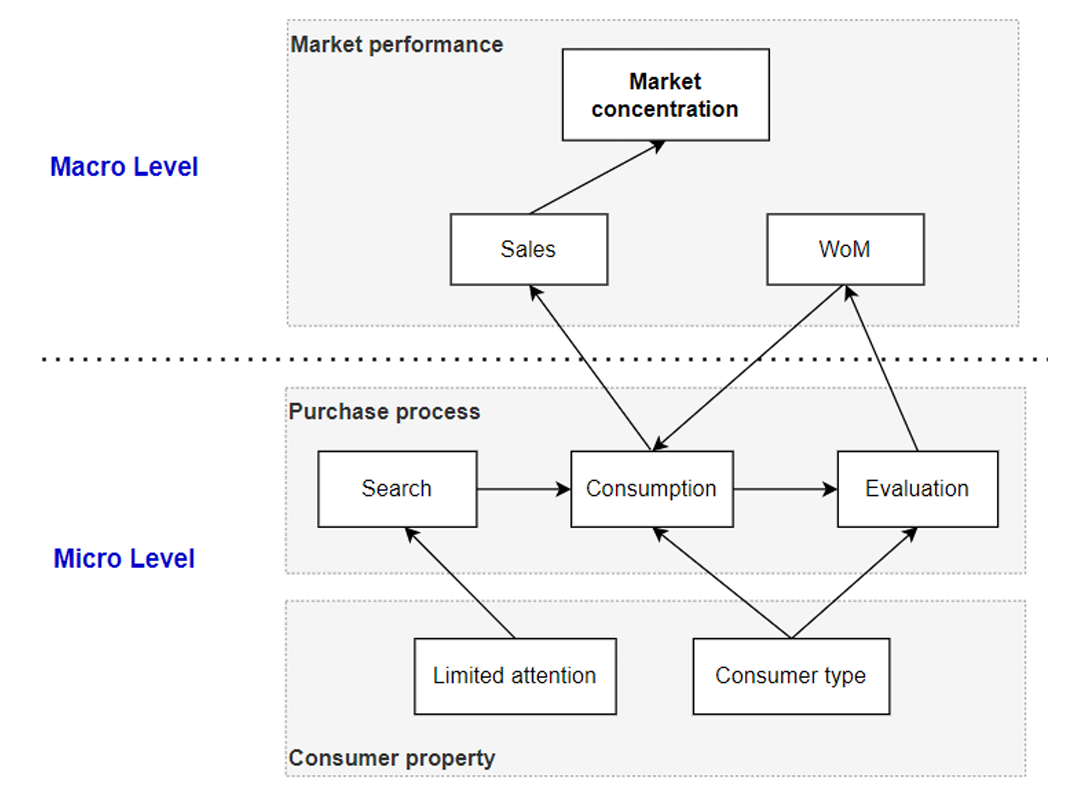
We aim to simulate how consumer behaviors, categorized by their types at the micro level, influence market concentration at the macro level. Figure 2 illustrates the conceptual framework of micro-macro interactions within a market.
At the micro level, we summarize the consumer purchase process into three stages, i.e. search, consumption, and evaluation. It is worth noting that the actual consumer process may be more complex, but our model simplifies it to focus on the research objectives of this paper. During the search stage, consumers begin searching for information about available options to fulfill their needs. We primarily focus on the number of candidate products that consumers can search for. Research indicates that consumer search sets vary in size (Bollen et al. 2010; Punj & Moore 2009), influenced by individual limited memory or attention (Shocker et al. 1991). The larger the consumer attention, the more likely they are to search for more alternative products before making a purchase, and vice versa. The second stage is consumption, where consumers decide to purchase the product or service they perceive as offering the best value or meeting their needs most effectively. This stage is influenced by consumer types; for example, risk-taking consumers prioritize new products within the entire set of alternatives, while conservative consumers prefer familiar products. The third stage is post-purchase evaluation. After making a purchase, consumers evaluate their satisfaction with the product or service based on their experiences, often by providing online reviews. This behavior in this stage is also related to consumer types; for instance, picky consumers are more likely to give negative reviews, while tolerant consumers tend to give positive reviews.
Consumer-level actions and interactions give rise to macro-level market dynamics. Firstly, consumer purchasing decisions directly affect changes in product sales volume, reflected in market share and market concentration. Secondly, consumer product evaluations influence the word-of-mouth of products, which in turn affects the consumer purchase process, forming interactive feedback between micro-level mechanisms and macro-level outcomes.
The Agent-Based Model
ABM was employed to examine how consumer type affects market concentration, studying emergent phenomena that arise from interactions between individual agents in a larger system. The model description follows the ODD (Overview, Design concepts, Details) protocol for describing individual- and agent-based models (Grimm et al. 2006), as updated by Grimm et al. (2020). The protocol helps to make model descriptions complete and accurate, as well as standardize descriptions for the benefit of users and reviewers. The model itself was implemented with NetLogo 6.0.4 (Wilensky & Rand 2015). A complete, detailed model description following the ODD protocol is provided in Appendix 1.
Model elements
To start with, the population of \(N_{c}\) consumers is randomly distributed in a two-dimension space. We independently select a random x and y coordinate from a uniform random distribution of coordinates. Subsequently, we assign consumers to the randomly drawn x-y coordinate if the spot is empty.
The key attributes of consumers in our model are their risk-taking tendency, denoted as \(R_{i}\), and pickiness tendency, denoted as \(P_{i}\), both of which range from 0 to 1. Specifically, \(R_{i}\) indicates the risk-taking tendency of consumers, where \(R_{i} = 0\) means the market consists solely of highly conservative consumers, and \(R_{i} = 1\) signifies the presence of only highly risk-taking consumers. Values of \(R_{i}\) between 0 and 1 indicate varying levels of risk-taking, with higher values corresponding to a more risk-taking nature. Similarly, \(P_{i}\) reflects the pickiness tendency of consumers, where \(P_{i} = 0\) represents a market entirely composed of highly tolerant consumers, and \(P_{i} = 1\) indicates that only highly picky consumers are present. Values of \(P_{i}\) between 0 and 1 represent different levels of pickiness, with higher values indicating a more picky disposition. To define the consumer type, this model first considers the extreme cases, including extreme CT-type (\(R_{i} = 0\) & \(P_{i} = 0\)), RT-type (\(R_{i} = 1\) & \(P_{i} = 0\)), CP-type (\(R_{i} = 0\) & \(P_{i} = 1\)), and RP-type (\(R_{i} = 1\) & \(P_{i} = 1\)). For a broader range of consumer types, the Beta distribution is utilized to establish the initial distributions of \(R_{i}\) and \(P_{i}\), denoted as \(x \sim Beta(\alpha,\beta )\), where \(\alpha\) (\(\geq 0\)) and \(\beta\) (\(\geq 0\)). The probability density function (\(PDF\)) of the beta distribution, \(f(x)\), is defined as Equation 1, where \(B(\alpha,\beta)\) is the beta function used as a normalization constant to ensure the total probability integrates to 1. We employ this function to generate a variety of shapes of initial distributions of consumer preferences with constrained ranges. For example, if \(\alpha\) is equal to \(\beta\), the distribution of opinions is symmetric. If \(\alpha\) is greater than \(\beta\), the opinion distribution is left-skewed. Conversely, if \(\alpha\) is less than \(\beta\), the distribution is right-skewed. This model allows us to simulate a wide range of consumer behaviors by adjusting the \(R_{i}\) and \(P_{i}\) values, thereby capturing the diversity of consumer attributes in the market. It is worth noting that we assume risk-taking and pickiness to be independent characteristics. This is because risk-taking pertains to pre-purchase behavior, while pickiness pertains to post-purchase behavior. Consequently, the share of picky types can be the same among both conservative and risk-taking consumers.
| \[f ( x ) = \frac { x ^ { \alpha - 1 } ( 1 - x ) ^ { \beta - 1 } } { B ( \alpha , \beta ) } , 0 \leq x \leq 1 \] | \[(1)\] |
Another important attribute of a consumer is limited attention, which can be quantified by the parameter \(m\). The parameter \(m\) ranges from 1 to \(N_{s}\) (the number of sellers) and is treated as a constant for all consumers in this study. The lowest value, \(m = 1\), indicates that each consumer can search only one seller or product, whereas the highest value, \(m = N_{s}\), indicates that consumers can search all products in the market. Based on prior research, it is well-established that consumers exhibit characteristics of bounded rationality, incomplete information, and cognitive limitations (Kahneman 1973; Li et al. 2025; Simon 1978). In this study, we will refer to these attributes as limited attention. This denotes that the consumer is not entirely rational and cannot process all market information available; instead, they only access information about products from a restricted number of sellers when making a purchase.
The market consists of \(N_{s}\) sellers who are located in the same two-dimensional space and produce identical products. The distinction between sellers lies in the consumer evaluations, measured by word-of-mouth (\(WoM\)), of their products, and sales. Sales refer to the volume of products actively promoted and delivered by a company within a specified time period. In the context of this article, it represents the frequency with which consumers elect to purchase products from a particular seller. Word-of-mouth refers to the verbal exchange of information as a means of sharing knowledge (Schindler & Bickart 2005). It typically involves individuals sharing their thoughts, personal experiences, or expertise about a specific product with others in their social or professional circles. In this context, we utilize \(WoM\) to represent the collective reviews of a seller by consumers, with the extent of \(WoM\) dependent on the cumulative assessments provided by interconnected consumers regarding a specific seller. To clarify, the information regarding a seller, including \(WoM\) and sales, is not accessible to all consumers. Rather, it is only visible to those who are able to search for it. And both \(WoM\) and sales will be normalized to the range of 0 to 1, as shown in Equation 4.
In our model, \(WoM\) measures the subjective evaluations of all consumers who have purchased from a seller. Picky consumers tend to give lower ratings, while tolerant consumers give higher ratings, which directly affects the seller’s \(WoM\). In extreme cases, if all of a seller’s buyers are picky, the seller’s \(WoM\) will be the lowest, making it harder for other consumers to choose that seller. Referring to the work of Cialdini & Goldstein (2004) on informative and normative influence, the \(WoM\) here is more informative, encompassing both positive and negative feedback. Sales primarily serve as a normative influence, indicating the number of consumers using a product without reflecting their ratings. In the "evaluation" phase of the consumer purchasing process, a more detailed explanation is provided regarding the formation and updating of \(WoM\).
Consumer purchasing process
Previous research (Frasquet et al. 2015; Pizzutti et al. 2022) indicates that online shopping typically comprises three stages: search, consumption, and evaluation. For searching products, consumers try to acquire relevant information such as sales and feedback from others by browsing through product pages, and gradually narrowing their focus to a few alternatives. In the consumption stage, consumers purchase the most appealing product from the options they have considered. Finally, during the evaluation stage, customers leave feedback on the products. What follows is a detailed description of these processes and the flowchart is given in Figure 3.
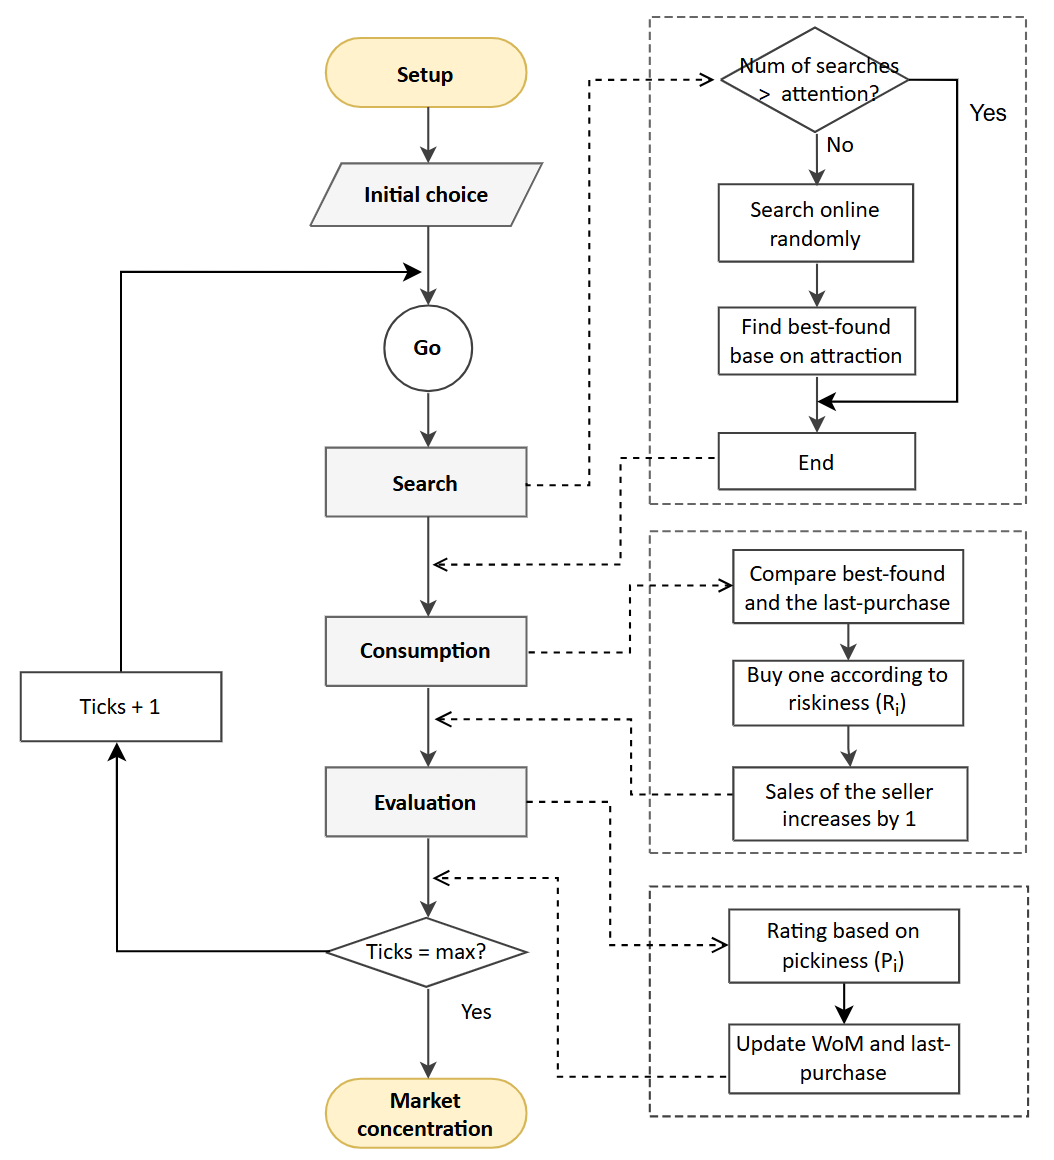
Search. When consumers enter a new market with asymmetric information, they lack past purchase experience and are therefore forced to conduct random searches and purchases. Subsequent rounds provide consumers with a historical record of their previous purchases, reflecting their shopping habits. Consumers aim to search for as many online sellers as possible before making a purchase. However, their potential choices are restricted due to their limited attention (Goldhaber 1997; Lanham 2006). In line with the bounded rationality concept, attention is limited; therefore, a maximum consideration number denoted by \(m\) is defined, which is the same for all consumers in the model.
In accordance with the concept of bounded rationality, consumers possess a limited capacity for attention, which constrains the number of options they can consider. This maximum number of options, denoted by \(m\), constitutes the consumer’s consideration set (Gu et al. 2012; Shocker et al. 1991). This set represents the range of product options that a consumer considers during the purchasing process. Consumers make their optimal choice from this consideration set by evaluating each option based on the combined attraction of sales and word-of-mouth. A parameter \(W_{m}\), which ranges from 0 to 1, determines the weight a consumer assigns to \(WoM\), while \((1 - W_{m})\) indicates the weight assigned to sales. \(W_{m}\) is set to be the same across all consumers. The higher the value of \(W_{m}\), the more importance the consumer places on \(WoM\) compared to sales.
The overall attraction of a product is quantified by a specific Equation 2. The optimal choice is the product with the highest attraction, which is considered the best-found among the new products available
| \[ A = W _ { m } * W o M + ( 1 - W _ { m } ) * S \; , \; W _ { m } \in \left[ 0 , 1 \right]\] | \[(2)\] |
Where, \(A\) denotes the total attraction of the product; \(S\in [0,1]\) represents the sales of the product, normalized between 0 and 1; \(WoM \in [0,1]\) denotes th word-of-mouth of the product, also normalized between 0 and 1; \(W_{m}\) is the weight assigned to \(WoM\), while \((1 - W_{m})\) is the weight assigned to the sales \(S\).
Consumption. Once consumers have selected the best option (best-found) according to the attraction of products, they will compare this choice with the product they purchased last time (last-purchase) according to their risk-taking tendency, that is, the level of \(R_{i}\). This comparison will inform their current purchasing decisions. In this process, they follow general behavior rules: (1) Conservative consumers are more likely to stick with their established purchasing habits and therefore prefer previous products. They will only switch to the best-found if it presents a significant advantage over their last-purchase. (2) For risk-taking consumers, on the contrary, they prefer new products over familiar ones, thus buying from the best-found unless the historical choice is significantly better.
The significant advantage here is determined by a threshold \(t\), which can be called attraction difference tolerance. \(t\) is set to be a global factor, indicating it is the same for all consumers. This threshold indicates that when consumers face the attraction difference between a new product and a historical product, their choices are influenced by their risk-taking tendencies before reaching this critical point. The larger the \(R_{i}\), the more likely they are to choose the best-found new product; the smaller the \(R_{i}\), the more likely they are to choose the last-purchase. Once this critical point is exceeded, consumers will rationally choose the product with the greatest attraction, no longer influenced by personal preferences. The value range of \(t\) is from 0 to 1. When \(t = 0\), all consumers will only purchase the product with the greatest attraction; when \(t = 1\), all consumers will choose their purchase based solely on their personal risk preferences. Varying \(t\) may change a market from satisficers to rational optimizers—optimizing on social dimensions in this case, not on product attributes. The decision tree in Figure 4 shows how consumers make a decision.
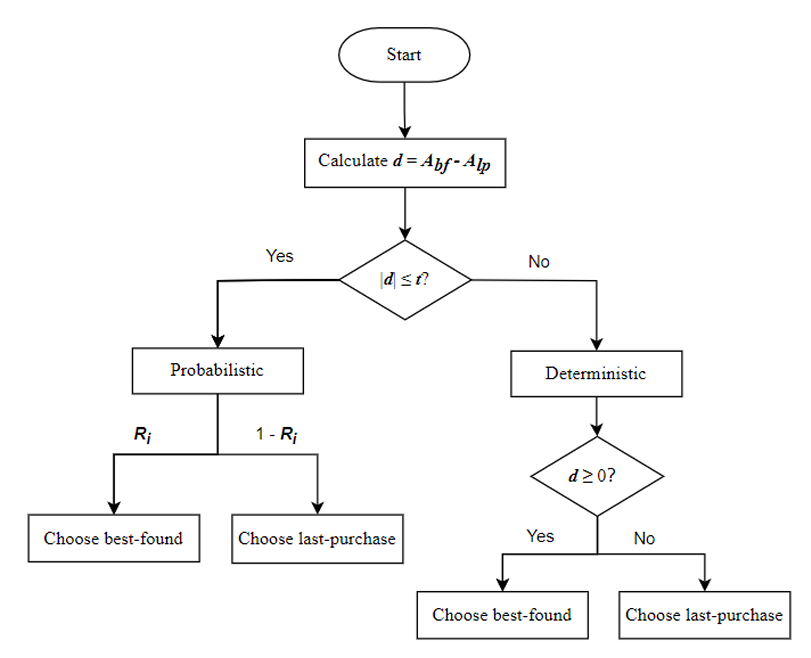
The following steps provide a detailed explanation of the Figure 4:
- Step 1: Start by calculating \(d\), the difference in attraction between best-found (\(A_{bf}\)) and last-purchase (\(A_{lp}\)), denoted as \(d = A_{bf} - A_{lp}\), (\(d \in [-1,1]\)).
- Step 2: Check if the absolute value of \(d\) is within the threshold \(t\).
- If \(|d| \leq t\): The decision is probabilistic:
- With probability \(R_{i}\), choose the best-found product.
- With probability \(1 - R_{i}\), choose the last-purchase product.
- If \(|d| > t\): The decision is deterministic:
- If \(d > 0\), choose the best-found product.
- If \(d \leq 0\), choose the last-purchase product.
- If \(|d| \leq t\): The decision is probabilistic:
In general, when the difference in attraction \(|d|\) is small (i.e., within the threshold \(t\)), the decision is probabilistic. The consumer chooses the best-found product with probability \(R_{i}\) and the last-purchase product with probability \(1 - R_{i}\). When the difference in attraction \(|d|\) is large (i.e., greater than \(t\)), the decision is deterministic. The consumer prefers the product with higher attraction if \(d > 0\) or sticks with the last-purchase if \(d \leq 0\).
After each consumer makes a final purchase decision, the seller who sold the product increases its sales by one unit accordingly. Market concentration in turn makes a difference at the end of each purchase period.
Evaluation. This process concerns post-purchase behavior whereby consumers provide their feedback on purchased products based on their pickiness traits (\(P_{i}\)). In general, picky consumers prefer to leave negative ratings after buying products, whereas tolerant consumers provide positive ratings. Specifically, after each purchase, A consumer will give a negative rating with a probability equal to their pickiness trait \(P_{i}\), and each negative rating decreases the product’s rating by 1 (\(rating - 1\)). With probability \(1 - P_{i}\), the consumer gives a positive rating, increasing the product’s rating by 1 (\(rating + 1\)). This can be formulated by Equation 3.
| \[Rating_{new} = \begin{cases} Rating-1 \; , \; \text{with probability} \; \; P_{i} \\ Rating+1 \; , \; \text{with probability} \; \; 1-P_{i} \end{cases} \] | \[(3)\] |
This setting reflects how the pickiness trait \(P_{i}\) influences the feedback process, where a higher \(P_{i}\) indicates a greater likelihood of negative ratings, and a lower \(P_{i}\) suggests a higher chance of positive ratings.
Once ratings from different types of consumers have been collated for a given product, the product’s \(WoM\) score is updated accordingly. Our model simplifies the process of updating \(WoM\) by normalizing the total ratings obtained to a value between 0 and 1, which is then treated as \(WoM\). The normalization process is shown in Equation 4. Sales are also normalized to between 0 and 1 using the same method as in Equation 4.
| \[WoM = \begin{cases} 0.5 & \text{if } rating_{max} = rating_{min} \\ \frac{rating-rating_{min}}{rating_{max}-rating_{min}} & \text{otherwise} \end{cases} \] | \[(4)\] |
Where, \(WoM\) ranges from 0 to 1, representing the normalized rating, where 0 corresponds to the minimum rating and 1 corresponds to the maximum; \(rating\) is the individual rating to be normalized of a product; \(rating_{max}\) is the highest rating among all sellers given so far; \(rating_{min}\) is the lowest rating among all sellers given so far; and if \(rating_{max}\) and \(rating_{min}\) are the same, report a normalized score of 0.5 (a mid-point value when all ratings are equal).
One full cycle of exchange between buyers and sellers is recorded as a time step. After each time step, the market calculates the current sales, ranks all sellers, and produces concentration levels. Meanwhile, consumers update their purchase history, and sellers receive new consumer feedback and sales will be updated by adding the newly acquired sales. The model then proceeds to the next time step, initiating a new round of trade. Consumers continue to randomly search for \(m\) products in the market, evaluate the best option, compare it with the last purchased product, and finally make their purchasing decisions. In this model, consumers are unable to access all sellers’ full rating information. However, they are able to view comprehensive information for the \(m\) sellers they find through their searches, including sales figures and the overall ratings provided by other consumers. There are no direct local social links between consumers; interactions occur through the online ratings that others have provided for sellers and the sales of sellers.
Simulation Experiments and Results
The main outcome of the model is the degree of market concentration. Market concentration refers to the extent to which a relatively small number of sellers dominate a particular market, indicating the distribution of market share among the sellers operating in a specific market (Bykova 2017; Jadlow 1981; Wesman 2005). This study employs the Concentration Ratio (\(CRn\)) to quantify the degree of market concentration. \(CRn\) represents the combined market share of the \(n\) largest firms in the industry. A higher \(CRn\) value indicates a more concentrated market structure. To achieve a more granular assessment of market structure, this research utilizes \(CR1\) as the primary indicator.
Firstly, while \(CR3\) and \(CR4\) are commonly employed in empirical studies (Duranovic & Filipovic 2021; Sexton 2000; Sharmin & Arman 2020), \(CR1\) offers a sharper distinction, particularly in oligopolistic markets. While all three indices may converge in monopoly scenarios, oligopolistic structures can exhibit significant discrepancies. For instance, in a duopoly (market with two dominant firms), both \(CR3\) and \(CR4\) would reach 100%, while \(CR1\) would necessarily be lower. Secondly, some studies have indicated that as \(n\) increases, the effectiveness of \(CRn\) in measuring market concentration decreases (Kwoka 1981; Sleuwaegen & Dehandschutter 1986). One deficiency shared by all \(CRn\) indices is that they can only indicate the proportion of the top-selling party/parties in terms of market share, without revealing whether the leading seller’s identity shifts. \(CR1\) can remain constant in two successive periods, even though the leader in the later period is not the same as in the previous period. Therefore, we will examine in our model whether the top seller remains consistent throughout the market process.
It is worthwhile noting that the concept of market concentration in the realm of e-commerce diverges from the conventional understanding. In traditional markets, stability in concentration arises from the relative constancy of factors such as quality and price advantages. However, in this digital landscape, the driving force behind market concentration is not solely anchored in the traditional determinants of product quality and pricing. Instead, customer attention has arisen as an emerging and critical element. The e-commerce environment is characterized by a potentially unstable concentration, which differs from the stability seen in traditional factors. This concentration is influenced by the ebb and flow of consumer attention, resulting in a more dynamic environment.
As explained earlier, consumers are classified into four single groups (\(RP\), \(RT\), \(CP\), \(CT\)) based on two dimensions. However, real markets are much more complex, where different consumer types can coexist in any proportion. Therefore, we carried out multiple rounds of simulation to examine market concentration ratios in different scenarios, with each round focusing on a particular consumer combination. The initial artificial market consisted of 300 consumers and 30 sellers randomly distributed in the space. The consumer attention was set to \(m = 3\), implying that each consumer could only remember up to 3 sellers per transaction. The experiment was conducted in each round with 20 repetitions, and the outcomes were averaged to guarantee reliability. In each repetition, the simulation model was run for 150 time steps, which correspond to 150 rounds of market transactions. A period means that all consumers have completed one purchasing activity once, and the market concentration ratio would stabilize around this point.
Simulation experiment 1: Extreme-type consumer markets
We start with four "pure" markets, each of which has only one extreme type of consumers, which includes CT-type (\(R_{i} = 0\) & \(P_{i} = 0\)), RT-type (\(R_{i} = 1\) & \(P_{i} = 0\)), CP-type (\(R_{i} = 0\) & \(P_{i} = 1\)), and RP-type (\(R_{i} = 1\) & \(P_{i} = 1\)). Investigating these pure situations helps understand how each consumer type may affect market concentration and is thus a natural starting point. The fundamental aim of this experiment is to investigate under which conditions the market concentration becomes high or low with a single type of consumer in the e-tailing context.
Considering the first dimension of consumer classification, namely the tendency to purchase new products, a key factor is the threshold for attraction difference (\(t\)). This threshold measures the intensity of this dimension. Within this threshold, consumer choices are shaped by their risk-taking or conservative inclinations. However, once this threshold is surpassed, consumers make rational decisions based on the most appealing product, irrespective of their personal preferences. The second dimension of consumers, the tendency to leave negative reviews after purchasing a product, relates to another key factor affecting market concentration: the weight of word-of-mouth (\(W_{m}\)). This is because a seller’s attractiveness to consumers is determined by both word-of-mouth and sales; the larger the \(W_{m}\), the more significant the impact of positive or negative reviews on market outcomes. Conversely, if \(W_{m}\) is zero, market outcomes are determined solely by sales.
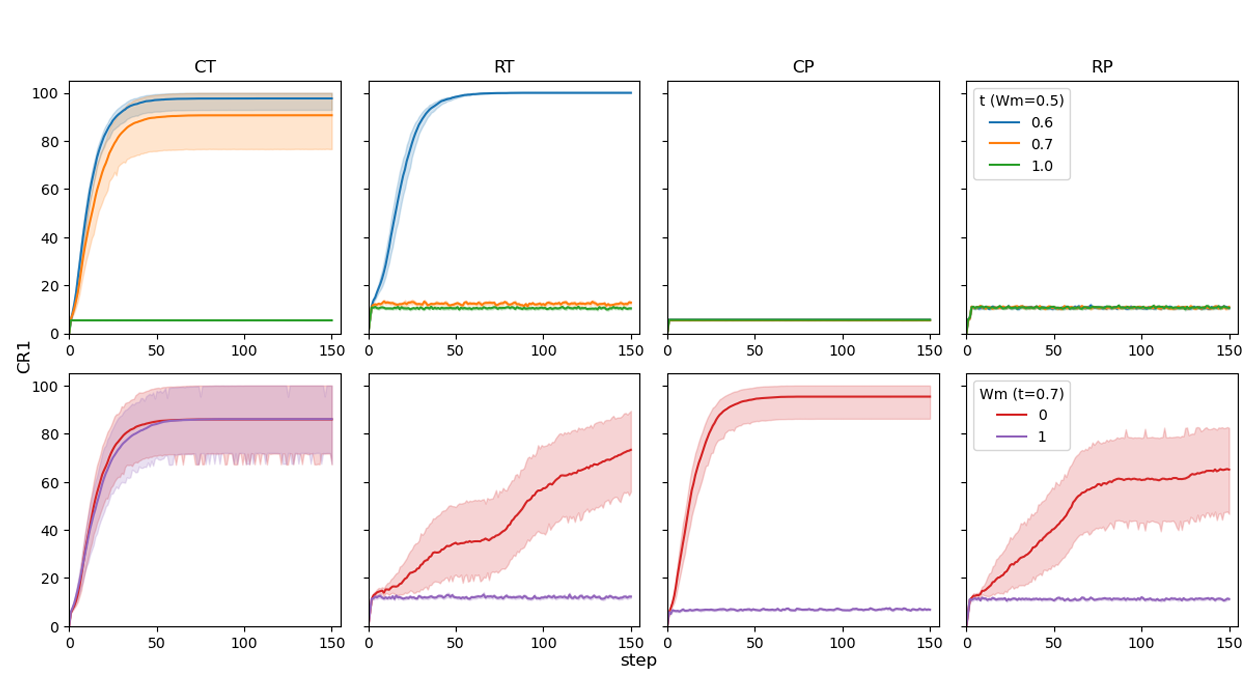
Figure 5 compares the market concentration in these extreme situations. The four subplots in the first row show market concentration under different \(t\) values, with \(W_{m}\) maintained at 0.5. In the scenario where all consumers exhibit conservative and tolerant (\(CT\)-type), preferring products they bought last round and tending to give positive reviews after using the products, we observed markedly different results with different \(t\) values. First, when \(t\) takes the maximum value of 1, \(CR1\) rapidly reaches the lowest equilibrium of approximately 5%. This is because, when \(t = 1\), conservative consumers only buy whatever they previously purchased, regardless of the availability of superior new products. Consequently, consumers are locked onto their initial random purchase choices, resulting in a low level of market concentration. However, when \(t\) decreases to 0.7 or 0.6, the market concentration will rise high with \(CR1\) exceeding 80%. The mechanism behind this is that although consumers still predominantly choose products based on their conservative preferences, there is still a considerable chance (0.3 or 0.4) for them to switch to more attractive new products and give positive ratings. Therefore, some sellers who gained a slight advantage at the beginning due to random factors are likely to maintain or even expand their market share, accumulate higher sales and more positive reviews, and eventually become an oligopoly with absolute dominance.
In contrast, when the market is dominated by risk-taking and tolerant consumers who are excited about buying new products (\(RT\)), the market concentration remains low (around 10%) when \(t = 1\). Unlike the \(CT\) market, however, the \(RT\) market exhibits greater volatility. This is primarily due to the dynamic nature of market share dominance, where no single product consistently maintains a leading position. Due to the high mobility of customers, a product that was patronized by the majority in the previous period may be patronized by fewer people in this period, and therefore market concentration does not increase cumulatively. This situation remains unchanged when \(t\) is reduced to 0.7. But further reduction of \(t\) to 0.6 leads to rapid market concentration. The reason for this is that at this point, consumers do not just blindly explore new products, but also consider familiar products that are more attractive. When the attractiveness of a product is strong enough, its consumer base becomes fixed and gradually expands, and this process is accelerated by the tolerant nature of consumers.
Next, if the market is populated by consumers with picky traits (\(CP\) or \(RP\)), market concentration is generally low, regardless of the value of \(t\). In the \(CP\)-type market, consumers tend to repurchase products they bought last time (maybe out of a pure habit) but give negative reviews after consumption, resulting in “the curse on the winner”: the higher the sales of a product, the poorer its review record, and the less the likelihood it being picked up by potential consumers. Therefore, market concentration will be low because sellers cannot leverage the volume-of-sales advantage.
As for the \(RP\)-type consumer market, consumers constantly switch to new products and leave negative reviews wherever they go, leading to a general deterioration of product reputation in the market. In this situation, even products with relatively high sales can lose consumers due to poor reviews, so each product can only maintain an average market share.
In summary, when \(t\) takes the maximum value 1, the market is not concentrated because consumers make choices based not on product attractiveness, but solely on personal prescribed inclination. Adventurous consumers keep exploring the market for a new product, while conservative consumer keeps purchasing a familiar one, regardless of the product’s reputation and sales volume. Only when the value of \(t\) is less than 1 can this status quo be broken by tolerant consumers to achieve higher market concentration. The simulation results also indicate that picky consumers reduce market concentration because they are always dissatisfied with the products they buy, and the larger the sales volume, the worse the reputation of the product, therefore, no seller can maintain a high level of attractiveness. The results also show that the equilibrium in the risk-taking consumer market exhibits greater volatility than the conservative consumer market.
Having gained a preliminary understanding of the effect of \(t\)-values on market outcomes, we now fix \(t\) at 0.7 (if \(t = 1\), the market will stay unchanged), and focus on the effect of the weights of word-of-mouth and sales (\(W_{m}\)) on market concentration. The four subfigures in the second row of Figure 5 show the results when the weight of word-of-mouth, \(W_{m}\), takes the maximum values of 1 (i.e., product attractiveness is entirely determined by word-of-mouth) and the minimum value of 0 (i.e., product attractiveness is entirely determined by sales). In the \(CT\) market, market concentration is high in both cases, indicating that the magnitude of \(W_{m}\) does not affect the market outcome. This is because sales volume positively contributes to market concentration. If a product is purchased by more consumers, it will become more attractive, and will more likely be shopped for by other consumers. Since consumer ratings in this market are positive, the same effect exists for word-of-mouth, i.e., the more consumers buy a product, the better its word-of-mouth and the easier it is to develop a cumulative advantage. Both mechanisms, individually or in combination, contribute to the accumulation of product attractiveness, ultimately leading to a high degree of market concentration.
In the \(CP\) market, however, different \(W_{m}\) values show distinct effects on market concentration. When \(W_{m} = 1\), i.e., the difference in product attractiveness depends only on word-of-mouth and not on sales, the market concentration remains at a very low level (about 5%) despite some increased volatility. This is because all the ratings in that market are negative, i.e., higher sales, leading to more negative ratings, can actually diminish the product’s \(WoM\) and subsequently reduce the product’s attractiveness. As a result, no seller can develop a cumulative advantage to conquer the market. Conversely, when \(W_{m} = 0\), i.e., negative ratings no longer play a role, and product differentiation is determined by sales alone, the product initially most purchased will maintain a sales advantage, resulting in a rapidly concentrating market.
We now turn to the risk-taking market (\(RT\) and \(RP\)). When consumers consider only word-of-mouth while ignoring sales volume (\(W_{m} = 1\)), market concentration stays low, which is in line with the results of the first row (the orange line). However, when the effect of sales volume is taken into account and even plays a decisive role, market concentration experiences a slow increase. This is because, on the one hand, sales volume adds a cumulative advantage to the product and causes concentration, on the other hand, the risk-loving characteristic of consumers counterbalances this cumulative advantage to some extent, and therefore concentration occurs but not as quickly as in the \(CT\) market.
In summary, the simulation experiment of homogeneous markets reveals the micro-mechanisms by which each of the four consumer traits affects market concentration. It has been discovered that different consumer characteristics influence market structure differently, and the final level of market concentration depends on the interplay of those mechanisms. In the next simulation experiment, we will explore the result of mixed consumer types.
Simulation experiment 2: Markets with different distributions
In this experiment, we use beta distributions to represent the mixture of consumer types and explore how they affect market concentration. We analyze the outcomes of three typical unimodal distributions of each type, with most values distributed around 0 (achieved by \(Beta(1,10)\)), around 0.5 (achieved by \(Beta(10,10)\)), and around 1 (achieved by \(Beta(10,1)\)). The default \(t\) in this experiment is set at 0.7, and \(W_{m}\) is set at 0.5.
Tolerant consumer market (\(P_{i} = 0\))
For a market full of extremely tolerant consumers (\(P_{i} = 0\)) who are generous with their positive reviews, we investigate situations with different distributions of risk-taking consumers. The results are shown in Figure 6 (top-left), with \(R_{i}\) around 0 representing most consumers are extremely conservative, \(R_{i}\) around 1 representing most consumers are extremely risk-taking, and \(R_{i}\) around 0.5 representing most consumers are in the middle without strong preferences for new or old products.
As illustrated by the Figure 6, when most \(R_{i}\) is around 0, \(CR1\) rapidly increases to the highest level, a trend similar to the single \(CT\)-type market in Experiment 1 (orange line), and can be attributed to similar reasons. The subtle difference between the two is that the market concentration achieved in the current experiment is slightly higher (nearly 100%). This is because in this experiment, although the majority of consumers under the single \(RT\)-type distribution are ultra-conservative, there is a small minority whose conservatism is less extreme and who keep exploring new products, thus giving them a better chance of finding the most appealing ones and further contributing to market concentration. When most consumers’ \(R_{i}\) is around 1, the equilibrium level of \(CR1\) suddenly drops to less than 20%, similar to the single \(RT\)-type market in Experiment 1 (orange line). The reason is that adventurous consumers, who like new products, dominate the market, making it difficult for the cumulative advantage of the product to be formed. When most consumers’ \(R_{i}\) is around 0.5, market concentration rises slowly and eventually reaches a higher level. This shows that when the proportion of conservative and adventurous consumers is close to each other, the former has a slightly stronger effect on market concentration than the latter.
Picky consumer market (\(P_{i} = 1\))
Suppose all consumers in the market are extremely picky type (\(P_{i} = 1\)), which means they like to give negative reviews to whatever products they buy. Results in Figure 6 (top-right) show that regardless of how much they are risk-taking or conservative, \(CR1\) remains lower than 10%. This result is similar to the \(CP\) or \(RP\) situation in Experiment 1 (orange line) and further confirms that more picky consumers make market concentration less likely to happen, regardless of the proportion of risk-taking/conservative consumers.
Conservative consumer market (\(R_{i} = 0\))
Now consider the effect of the distribution of the propensity to be picky (\(P_{i}\)) on market concentration. When the mode of the \(P_{i}\) unimodal distribution is around 0, it means that most consumers are extremely forgiving and tend to give good reviews; when the mode of the \(P_{i}\) distribution is around 1, most consumers are extremely picky and are inclined to give bad reviews; and when the mode of \(P_{i}\) is around 0.5, most consumers are equally likely to produce good and bad reviews.
Figure 6 (lower-left) depicts the extremely conservative consumer market, where consumers prefer to choose previously purchased products rather than new products. When \(P_{i}\) is distributed around 0, which means most consumers are also extremely tolerant, market concentration quickly rises and stabilizes at a high level (nearly 100%). The reason for this is similar to the tolerant market, in that conservative and tolerant traits predominate, and together they contribute to the cumulative advantage gained by the initially attractive product that eventually captures the market. The 95% confidence interval shows that the conservative market is slightly more volatile than the tolerant market.
When most consumers’ \(P_{i}\) is around 1, i.e., extremely picky consumers account for the majority, the market concentration can only reach and stabilize at a minimum level (about 5%). The reason for this is that the larger the sales volume, the more negative reviews the product receives, therefore, no cumulative advantage can be created. When \(P_{i}\) is around 0.5, that is, the probability of most people giving good reviews and bad reviews is about the same, we see a slight increase in the concentration of the market, stabilizing at about 20%. This seems to imply that, under the same conditions, positive reviews (\(P_{i} = 0\)) promote market concentration less than negative reviews (\(P_{i} = 0\)) inhibit it, such that when the two are similar (\(P_{i} = 0.5\)), the market concentration that eventually arrives is pretty low.
Risk-taking consumer market (\(R_{i} = 1\))
Risk-taking consumers prefer to buy new products. In other words, they have a low degree of brand loyalty. Similarly, according to their pickiness in giving reviews, three representative scenarios are investigated where peak \(P_{i} = 0\), peak \(P_{i} = 1\), and peak \(P_{i} = 0.5\), respectively, with results shown in the lower-right pane of Figure 6. It can be seen that if all consumers are risk-taking, no matter whether the value of \(P_{i}\), \(CR1\) remains lower than 20%. The reason for this is that risky consumers are always exploring new products (as can be seen from the turbulent curve), which is not conducive to realizing a cumulative advantage for a given product unless the intensity of riskiness is further reduced (e.g., by setting \(t = 0.6\)) or the weight of sales volume is increased (e.g., by setting \(W_{m} = 0\)).

The above experiments have permitted a preliminary understanding of the mechanisms by which different consumer preferences affect market concentration. For example, it can be observed that the greater the consumers’ risk preference tendency (\(R_{i}\)), the less likely the market is to concentrate, and the more volatile it becomes. Similarly, the higher the consumers’ pickiness tendency (\(P_{i}\)), the more it hinders market concentration.
Additionally, the relative impact of word-of-mouth on sales (\(W_{m}\)) is a significant factor in market dynamics. Typically, the smaller the \(W_{m}\), or the greater the weight of sales, the more likely the market is to achieve concentration. However, when \(W_{m}\) becomes larger, whether the market becomes concentrated depends on whether positive or negative ratings dominate. When positive ratings are in the majority, word-of-mouth strengthens the role of sales in promoting market concentration, because products with more sales receive more positive reviews, which in turn attracts even more consumers. Conversely, when negative ratings are more prevalent, word-of-mouth suppresses the role of sales in promoting market concentration. This is because products with higher sales receive more unfavorable reviews, making it more challenging to build cumulative advantages and reducing their attractiveness.
Simulation experiment 3: Markets with heterogeneous consumers
In this simulation experiment, we aim to investigate how market concentration evolves when different types of consumers coexist. This enhances our understanding of market complexity and dynamics. To achieve this, more generalized markets are designed in this experiment, in which consumers neither exhibit extreme risk-taking nor extreme conservatism, nor do they display extreme pickiness or tolerance. Instead, the majority of individuals exhibit a preference that is situated somewhere between the two extremes. Consequently, we set \(R_{i}\) and \(P_{i}\) to follow a unimodal distribution around 0.5, which is achieved by \(Beta(10,10)\). Furthermore, consumers are neither excessively rational nor irrational, thus the rational choice threshold \(t\) is set at 0.7. This implies that within a certain range, consumers make choices based on their own type (e.g., a conservative consumer will buy the familiar product, while a risk-taking consumer does the opposite); only beyond the range do they choose based on product attractiveness. Based on this, we explore three different scenarios: product attraction determined solely by sales (\(W_{m} = 0\)), solely by \(WoM\) ( \(W_{m} = 1\)), and equally by both factors (\(W_{m} = 0.5\)).
Figure 7 illustrates the evolution of the market concentration ratio. In general, market concentration grows rapidly and reaches a high level (nearly 100%) when \(W_{m} =0\) (blue line). This further indicates that if product differentiation is determined solely by sales, the product initially purchased by the majority will accumulate a sales advantage, attracting even more consumers. When \(W_{m}\) increases to 1 (orange line), the market concentration fluctuates around 20%, with rises and falls. This is because half of the market tends to give positive reviews, while the other half tends to give negative reviews (peak of the unimodal distribution of \(P_{i} = 0.5\)), leading to overall minor differences in product attractiveness. Market fluctuations occur because the product receiving the most positive ratings changes constantly with each purchase. Once a product receives the most positive ratings, market concentration rises. However, this increased visibility makes it more likely to attract picky consumers, leading to more negative ratings and a subsequent decline in market concentration. Thus, markets continuously oscillate in this dynamic balance.
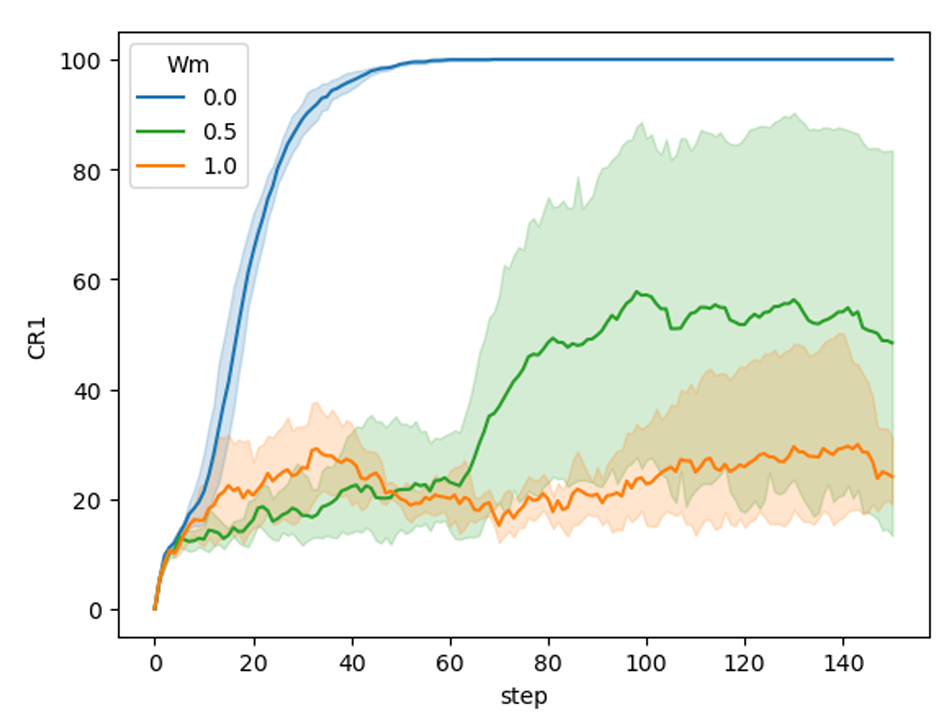
When \(W_{m} = 0.5\), we see a market with maximum volatility. In contrast with the other two scenarios, this is also the most complex market. There are both risk-taking and conservative consumers who may give both positive and negative reviews. At the same time, they are concerned with the sales ranking of the product and also assess the word-of-mouth about the product. Different mechanisms push and pull market concentration, with each time step’s outcome depending on which force prevails. Specifically, at a given time step, some consumers will contribute to market concentration by purchasing the most popular product and/or leaving positive reviews. Simultaneously, other consumers will reduce market concentration by exploring alternative products and leaving negative reviews for the best-selling product.
To observe the complex dynamics and balance of forces in this market more clearly, Figure 8 presents five random runs for each scenario, with each line representing a typical market concentration evolution process. We observed similar mechanisms of change: when forces promoting market concentration dominate, the market quickly concentrates to its maximum; when forces inhibiting concentration take effect, the concentration level decreases. Ultimately, the market exhibits a dynamic evolution. The results also demonstrate that the complex interactions between factors previously studied in isolation can lead to significantly different outcomes when combined. This highlights the intricate market behavior that emerges from the interplay of various consumer types, providing deeper insights into how consumer properties interact to influence overall market dynamics.
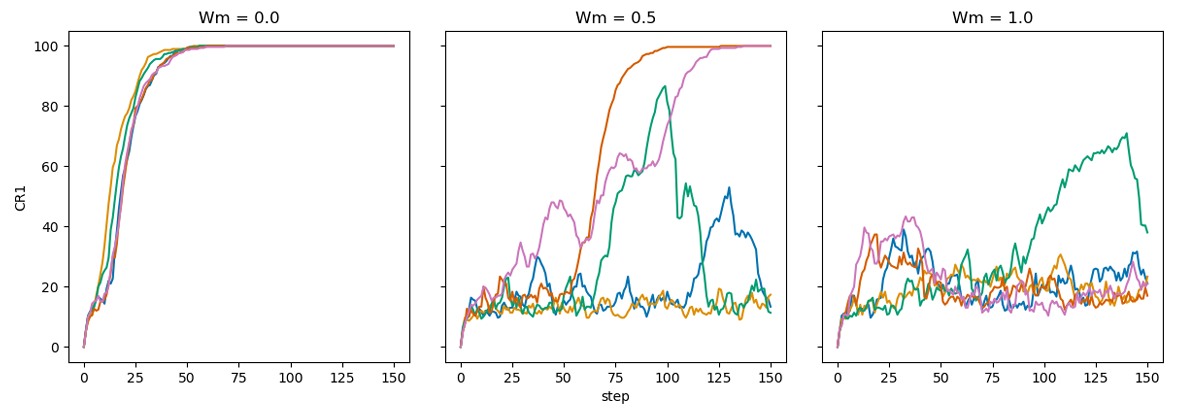
It is important to note that, in theory, the final market equilibrium in this experimental scenario would result in \(CR1\) reaching 100% if given sufficient time. This is because consumers make purchases at each time step, and with various balancing mechanisms in place, it is always possible for one product to gain a significant advantage (in terms of sales or positive reviews) and eventually dominate the market. For instance, in the middle graph of Figure 8, we can see that the uppermost red and purple lines have stabilized at market equilibrium. This indicates that a particular product has gained a dominant advantage, monopolizing the entire market, thereby preventing other products from challenging its position. The green and blue lines in the middle exhibit the most fluctuation, suggesting that there is a significant possibility of a shift in the future, ultimately leading to a monopolistic market. The bottom orange line remains stable at a lower level amidst fluctuations. Although it is theoretically possible for it to reach the equilibrium point of \(CR1 = 100\%\), it is foreseeable that it would require a much longer time. The precise time required to achieve equilibrium was not investigated. Firstly, a mid-term perspective enables the observation of more intriguing market fluctuations, which aligns better with the research objectives of this study. Secondly, the mid-term perspective has empirical significance, as real purchasing behavior rarely occurs under conditions that allow the system to reach long-term equilibrium. Real-world social systems may be influenced by external disturbances, internal structural changes, or other uncontrollable factors, making equilibrium a hypothetical state.
In summary, the fluctuation of market concentration is a sign of the complex dynamics between different consumer traits in shaping the market structure. For example, a certain seller may become popular within a time step, but this popularity can be its own downfall as it attracts more picky consumers. This results in more negative reviews for the seller’s products in the next time step, causing the seller to lose their dominant position in the future.
The scenarios presented in this study primarily serve as a proof of concept, illustrating the model’s flexibility and capacity for further experimentation. To gain a more comprehensive understanding of the interaction between key parameters, we also conducted additional simulations in which both \(t\) and \(W_{m}\) were varied continuously over the interval [0, 1]. This allowed us to explore their combined influence on market concentration. The results of these extended experiments are provided in Appendix 2.
Discussion
The prevalent academic research regarding the causes of market concentration centers around sellers, and typically disregards the consumer perspective. This study fills this gap by investigating how consumer types can impact market concentration, even in scenarios where the sellers are homogeneous. Using the agent-based modeling method, we conducted simulation experiments to explore how and under what conditions market concentration arises from the interactions between heterogeneous consumers.
Experiment results
The results from Simulation Experiment 1 show that, if the threshold for optimal choice is substantial (\(t = 1\)), market concentration will not happen, as consumers make their shopping decisions based solely on their prescribed inclinations, e.g., to always buy new or habitual products. Therefore, conservative consumer markets (\(CT\) and \(CP\)) quickly lock into the initial status quo with unchanged sales ranking. By contrast, risk-taking consumer markets (\(RT\) and \(RP\)) demonstrate more complex dynamics, where consumers keep buying new products and bigger sellers cannot enjoy the advantage of sales.
When \(t\) decreases (e.g., 0.7) to allow more rational purchases, only the conservative and tolerant (\(CT\)) consumer market displays a constant trend toward substantial concentration, such as monopoly or oligopoly. The \(CT\)-type consumers can be labeled as “content consumers”, since they are reluctant to switch from previously bought products (conservative), and are willing to give positive reviews after consumption (tolerant). In marketing terminology, these consumers show a high degree of brand loyalty. The positive feedback that they produce reinforces repeat purchases, leading to higher concentration ratios. This explanation also applies to the high concentration in two-type consumer markets where \(CT\) consumers constitute the majority.
In contrast, there is little concentration when risk-taking and picky consumers (\(RP\)) dominate the market. We can call them "impatient consumers," driven by a passion for new things and a dislike for the familiar. Furthermore, they are inclined to provide negative reviews of products, which will discourage repeat purchases. Products with high sales volume may easily attract risk-taking consumers, however, the picky character of these consumers brings in more negative reviews, so it is hard for these sellers to retain their initial advantages. Similar mechanisms exist for the conservative and picky (\(CP\)) consumer market, where continuous negative reviews make it difficult to achieve market concentration.
Finally, risk-taking and tolerant (\(RT\)) consumer markets generally experience low concentration and volatility. While forgiving consumers usually leave favorable reviews about sellers, their tendency to constantly seek out new products makes it difficult for sellers to build up an advantage. Remarkable market concentration can only appear at a lowered \(t\) threshold (e.g., 0.6).
Simulation Experiment 1 also examines the influence of the weight of word-of-mouth relative to sales (\(W_{m}\)) on the above mechanisms. Overall, the more consumers value sales over word-of-mouth, the more likely the market will become concentrated. Interestingly, when only word-of-mouth is considered, concentration occurs solely in the \(CT\) market. The underlying mechanism is that consumers consistently select products they have previously purchased and provide positive reviews, thereby facilitating the initial popular product to accumulate a reputation advantage. In other types of markets, either consumers’ nature of risk preferences reduces product loyalty, or their tendency to give negative reviews damages the product’s word-of-mouth, making it difficult for any product to dominate.
The results from single-type markets and their underlying mechanisms help us understand market dynamics under more complex conditions. Simulation Experiment 2 confirms a general rule in the model: a higher prevalence of negative online ratings correlates with lower market concentration. When negative ratings dominate, concentration ratios decrease. Conversely, when negative ratings are less prevalent, concentration ratios increase. This feedback effect is attributed to positive ratings giving high-selling sellers an advantage, creating a virtuous cycle, while negative ratings create a vicious cycle by diminishing sellers’ advantages.
While exploring single-type or two-type consumer markets may be thought-provoking, the reality of e-retail markets is far more intricate and encompasses multiple types of consumers. Simulation Experiment 3 on markets with different consumer types indicates that counterbalancing mechanisms are complex and interdependent and that the resulting market concentration ratio depends on the impact of each factor. When factors in favor of market concentration, such as consumer tolerance, become dominant, a highly concentrated market structure is likely to emerge. On the other hand, if factors that discourage market concentration, such as pickiness, take reigns, the result will be a low-concentration market. Agent-based modeling (ABM) proves a useful tool in untangling the effects of each mechanism in this complex system by offering valuable insights into understanding the dynamics of complicated societies and economic structures.
Assumption of product uniformity
The assumption of product uniformity in our model is not intended to disregard the importance of price or quality, but rather to control for supply-side variables in order to isolate the effect of consumer behavior, particularly social interactions, on market concentration. In digital retail environments, consumers are exposed to a multitude of information sources, and price or quality is often just one among many influencing factors. In fact, due to the ease of comparing similar products online, price and quality may not always be the most salient criteria in decision-making. While it seems intuitive that market concentration would result from all consumers choosing the lowest-priced or highest-quality products, this does not fully reflect reality. Consumers are influenced by social dynamics, such as word-of-mouth in our model, which affects their choices in ways that go beyond pure economic rationality. The assumption of product homogeneity in our model allows for a controlled focus on understanding how consumer behavior, rather than product differentiation, contributes to market concentration and avoids any objective differences between the products.
This assumption also serves to simplify the model and to maintain a clear analytical focus on demand-side mechanisms. Introducing quality heterogeneity at this stage would introduce supply-demand interactions that could obscure the causal processes we aim to uncover. That said, we believe our core results are unlikely to be weakened by the introduction of product differentiation. On the contrary, the presence of quality variation may in fact reinforce our findings. As suggested by (Van de Rijt 2019), following the "gold will shine" principle, high-quality products may initially be overlooked due to social influence dynamics but are likely to gain prominence over time and ultimately dominate market share. This relies on an implicit assumption that higher product quality leads to better word-of-mouth, which in turn facilitates greater market share—an effect consistent with the mechanisms observed in Experiment 2.
Empirical implications
This paper categorizes consumers along two dimensions: conservative/risk-taking and picky/tolerant. Although this is a theoretical simplification, it holds some practical significance.
- \(CT\) Type: Consumers with stable shopping habits who are satisfied with existing products or unwilling to expend effort searching for new ones. This group includes some elderly individuals and high-income earners, who usually do not spend too much time shopping (Punj 2013; Weiss 2003).
- \(CP\) Type: Consumers dissatisfied with existing products but unwilling or unable to change their choices for various reasons. This type of consumer has been empirically demonstrated to exist, as evidenced by the continued use of e-commerce platforms despite the experience of disappointing services due to the existence of switching barriers (Widyastuti et al. 2024).
- \(RT\) Type: Curious consumers who enjoy trying new things and are easily satisfied. This category is similar to the “fickle consumer” who is seeking alternatives despite being satisfied (Ok 2023). Another empirical study finds that half of the “satisfied” customers are predisposed to switching service suppliers (Mittal & Lassar 1998).
- \(RP\) Type: Consumers with high-quality demands who find it difficult to be satisfied and continually search the market. This group includes enthusiasts of professional products, such as electronics and sports equipment, who are able to distinguish subtle differences between products (Cheng et al. 2021).
A key assumption in this study is that consumers compare different products based on two primary indicators: sales volume and reviews. The varying weights assigned to these two indicators contribute to market dynamics and, along with the diverse consumer types, shape the overall market structure. This assumption kind of accurately reflects the characteristics of online shopping. A significant challenge of online shopping is that consumers are unable to examine products up close as they would in a physical store. Consequently, they must rely on alternative means for making purchasing decisions. These alternatives include the seller’s online presentation, product descriptions, and advertisements. However, due to information asymmetry and incentive compatibility issues, the reliability of such information is often questionable. In this context, the sales volume and review information recorded by e-commerce platforms may become the primary objective indicators for consumers to assess product quality because they can learn from other consumers. An interesting point is that the varying importance of these two indicators can lead to complex consumer interaction mechanisms online.
The above discussion highlights the practical relevance of the primary assumptions in this study. Next, we will discuss how some of the main findings of the simulation model relate to reality. It must be acknowledged that the absence of comprehensive data precludes the possibility of conducting a rigorous empirical validation of the aforementioned discussion. Instead, the discussion offers some preliminary observations. As e-commerce continues to develop, there is a general trend towards increasing market concentration in online retail. However, the degree of concentration varies across different product categories. For instance, the market concentration for consumer electronics (e.g., printer, \(CR1 = 22\%\) on JD.com) is generally higher than that for food (e.g., casual snacks, \(CR1 = 7\%\) on JD.com).2 This phenomenon lends support to the concentration mechanisms discussed in this study. In comparison to casual food, printers are more standardized in terms of craftsmanship and quality, leading to higher approval rates. According to the mechanisms revealed in this study, positive reviews promote market concentration while negative reviews inhibit it. Therefore, higher approval rates help electronics gain cumulative advantages, resulting in higher market concentration.
One of the mechanisms identified in this study is the positive feedback relationship between sales and positive reviews, which promotes market concentration. Conversely, there is a negative feedback mechanism between sales and negative reviews, often leading to fluctuations in market share and hindering concentration. This negative feedback mechanism might help explain the common phenomenon of the rapid rise and fall of "Internet celebrities" (Ding et al. 2020), even though this is not strictly related to online shopping. The sudden popularity of certain online personalities can be understood as an accumulation advantage in sales, similar to a snowball effect—the larger the snowball, the more snow it gathers. However, this accumulation advantage can contain self-destructive elements. As the audience grows, negative reviews increase correspondingly, and the risk-taking nature of Internet celebrity followers, who are constantly looking for new alternatives, can make Internet celebrities go out of fashion particularly quickly.
Limitations and future work
This study focuses on the e-commerce market, which offers a distinctive context for exploring social influence and word-of-mouth dynamics due to the high visibility of peer reviews and the rapid dissemination of information on digital platforms. However, when extending the model’s insights to broader market contexts, such as offline markets, additional factors and mechanisms must be considered. Offline consumer behavior is influenced by physical proximity, local social networks, and direct interactions with sales personnel, which may shape decision-making differently from online environments. Moreover, in offline markets, spatial constraints and geographical accessibility play a crucial role in consumer choices, potentially limiting the reach of dominant firms and moderating market concentration trends. Future research could extend our approach by incorporating these offline-specific factors into the modeling framework. Although our current model does not explicitly account for these offline-specific mechanisms, it provides a foundation that can be extended. Future work could adapt the framework to incorporate spatial and social structures characteristic of offline settings, enabling a more comprehensive understanding of consumer behavior across diverse market environments.
As online platform algorithms increasingly influence the network landscape, we acknowledge that interpreting these algorithms solely as mechanisms for generating sales and review metrics may soon prove insufficient. Today, across the pre-purchase, purchase, and post-purchase stages, platform algorithms act in a more “aggressive” manner. Their product recommendations, based on detailed consumer profiles, can be highly targeted and, in many cases, alter consumers’ original decision-making processes (Gawer 2011). However, incorporating these complex algorithmic influences poses two challenges: first, these factors are extremely complex, and it isn’t easy to specify their overall impact clearly; second, incorporating these additional dynamics would obscure the primary objectives of our study. Therefore, our findings should be interpreted with this limitation in mind, and future research is needed to integrate a more nuanced examination of algorithm-mediated consumer interactions.
Conclusion
In conclusion, this study examines theoretically the impact of different types of consumers on market structure. Our model assumes that while some consumers prefer to buy previously used products over new ones or give bad reviews, others do the opposite. It is investigated how heterogeneity of consumers’ micro-behavioral patterns affects the macro-level outcome of market concentration.
This research highlights the significant influence of consumer factors on market concentration, complementing traditional market structure theory. It also encourages industrial policy-makers to consider the impact of consumers on market concentration in the future. We recognize that this study is a preliminary theoretical assessment, and its findings require empirical validation. Moreover, the categorization of consumer types in this investigation is provisional and requires further refinement. Building on the knowledge obtained from this study, there are numerous promising research directions for the future. ABM facilitates the understanding of complex market dynamics by examining how market concentration emerges from interactions of heterogeneous consumers, specifically through mechanisms such as word-of-mouth and sales. In ABM, agent behaviors and interactions are often simplified representations of reality. This simplification is a deliberate strategy to enable a focused examination of specific mechanisms. For instance, our model includes perfect control over seller similarity and features an extreme market scenario with only a single consumer type for theoretical exploration. A notable strength of ABM is its capacity to systematically experiment with and relax these assumptions, thereby allowing the analysis of more complex markets by introducing distributions of consumer types.
However, increased realism does not always equate to better outcomes, as it can render a model less transparent, more difficult to understand, and more prone to errors (e.g., the necessity to estimate more parameters when applying the model empirically, which exceeds the scope of this study). Despite this, we hope that our model’s results will inspire new empirical research on market concentration. For example, validating the presented findings empirically could be a promising direction for substantiating the theoretical basis of consumer-oriented market concentration.
Achieving this would require large-scale data analysis as well as case studies centered around real-life e-commerce markets to more comprehensively scrutinize the correlation between consumer conduct, assessments, and market concentration. Consumer surveys can also be used to understand the consumption behavior characteristics of different groups, or behavioral experiments can be employed to simulate the formation of market structures.
Acknowledgements
This research was supported by the Major Program of the National Social Science Foundation of China (Grant No. 22&ZD079). I thank Wander Jager and Andreas Flache from the University of Groningen, as well as Deyi Zhou from Huazhong Agricultural University, for their valuable feedback on an earlier version of this paper. I am also grateful to the anonymous reviewers of JASSS for their insightful and constructive comments on a previous version of the manuscript.
Model Documentation
The model was implemented with NetLogo 6.0.4. The full code and model are openly available on the CoMSES Computational Model Library at: https://www.comses.net/codebase-release/6947ba9b-aad6-4a9a-b91b-12e19bc6fa24/.
Notes
- Source: Jingcanmou E-Commerce Database. Available at https://baijiahao.baidu.com/s?id=1776720729087545828&wfr=spider&for=pc.↩︎
- Source: Jingcanmou E-Commerce Database. Available at https://www.sohu.com/a/741502637_121082779 and https://blog.csdn.net/jingcanmou_data/article/details/132859689↩︎
Appendix 1: Agent-Based Model Applying the ODD Protocol
Overview of the model
Purpose
The purpose of the model is to investigate the underlying factors contributing to the high concentration observed in China’s e-retail markets, with a specific focus on consumer heterogeneity. While previous research has identified various structural and behavioral determinants of market concentration, the potential influence of consumer types has remained underexplored. This study addresses this gap by examining how distinct consumer behaviors—namely, risk-taking and pickiness tendencies—affect market dynamics and concentration levels. By integrating these behavioral dimensions with the dynamics of sales and \(WoM\) feedback, the simulation seeks to generate insights that not only advance theoretical understanding but also offer practical implications for e-retailers and regulatory administrators. Specifically, we carry out simulation experiments to analyze different scenarios that are designed by different target mechanisms. In the first scenario, "pure" markets are examined, each of which contains a single extreme type of consumer. The second scenario focuses on various distributions of each dimension and analyzes how they influence market concentration. Finally, the third scenario investigates the evolution of market concentration in the presence of mixed consumer types.
Entities, state variables and scales
There are two types of entities in the model, consumers and sellers. Below, we introduce their characteristics, state variables, and scales. Additional parameter settings used in the model are summarized in Table 1, which shows the main parameters, their definitions, value ranges, and dynamic states regarding their roles within the model.
Consumers.
Population and spatial Distribution: The model comprises \(N_{c}\) consumers. \(N_{c}\) is a model parameter to be adjusted by the modeler. Consumers are placed on a two-dimensional continuous space by independently drawing an x and y coordinate from a uniform random distribution. Each consumer is assigned to a coordinate provided that the location is unoccupied.
State variables: Consumers are characterized by a set of state variables that define their behavior: risk-taking propensity during purchases, which reflects their willingness to buy new products when buying products, and pickiness during online commenting, which indicates their tendency to be critical or positive when leaving reviews. These two variables collectively define consumer types. Additionally, consumers exhibit limited attention, which measures the extent of their online search or exploration before making a purchase decision.
- Risk-taking tendency (\(R_{i}\)). a) A continuous variable defined in the interval [0, 1]. b) \(R_{i}\) = 0 indicates a fully conservative consumer who buys only familiar products, while \(R_{i}\) = 1 represents a fully risk-taking consumer who buys only new products. Intermediate values represent varying degrees of risk-taking behavior. c) \(R_{i}\) is initialized using a Beta distribution \(R_{i} \sim Beta(\alpha,\beta)\).
- Pickiness tendency (\(P_{i}\)). a) A continuous variable defined in the interval [0, 1]. b) \(P_{i} = 0\) represents a highly tolerant consumer who gives positive reviews, while \(P_{i} = 1\) denotes a highly picky consumer who gives negative reviews. Intermediate values reflect different levels of pickiness. c) \(P_{i}\) is initialized using a Beta distribution \(P_{i} \sim Beta(\alpha,\beta )\).
- Consumer type classification. Extreme consumer types are defined by the combinations of the boundary values: a) CT-type: \(R_{i} = 0\) and \(P_{i} = 0\) (conservative and tolerant), b) RT-type: \(R_{i} = 1\) and \(P_{i} = 0\) (risk-taking and tolerant), c) CP-type: \(R_{i} = 0\) and \(P_{i} = 1\) (conservative and picky), d) RP-type: \(R_{i} = 1\) and \(P_{i} = 1\) (risk-taking and picky).
For a broader representation of consumer behaviors, the initial values of \(R_{i}\) and \(P_{i}\) are generated from a Beta distribution, \(x \sim Beta(\alpha,\beta )\). This approach allows for various distribution shapes: a) Symmetric when \(\alpha = \beta\), b) Left-skewed when \(\alpha > \beta\), c) Right-skewed when \(\alpha < \beta\).
- Limited attention (\(m\)): A discrete parameter quantifying the consumer’s ability to search for sellers/products. It ranges from 1 to \(N_{s}\) (the total number of sellers), where \(m\) = 1 implies that a consumer can search only one seller/product and when \(m\) = \(N_{s}\) indicates that a consumer can review all available products. This parameter encapsulates bounded rationality and incomplete information processing in consumer decision-making.
Sellers.
Population and spatial distribution: The market consists of \(N_{s}\) sellers, each located within the same two-dimensional space as the consumers.
State variables: a) Product Homogeneity. All sellers produce identical products. The differentiation among sellers arises solely from consumer-based evaluations. b) Sales. Sales are defined as the frequency with which consumers purchase products from a seller during a given time period. This variable is normalized to the interval [0, 1] to facilitate comparisons and to capture the normative influence of widespread product adoption. c) Word-of-Mouth (\(WoM\)). \(WoM\) aggregates the subjective evaluations provided by consumers who have purchased from a seller. Given that picky consumers tend to assign lower ratings and tolerant consumers higher ratings, the \(WoM\) serves as an informative metric reflecting both positive and negative consumer feedback. Like sales, \(WoM\) is normalized to the interval [0, 1]. Importantly, information regarding a seller’s \(WoM\) and sales is only accessible to consumers who can search for it (as determined by their limited attention \(m\)).
Scales.
Spatial scale. Consumers and sellers are embedded in a shared two-dimensional continuous space, with locations assigned via uniformly distributed coordinates to ensure random spatial distribution. Sellers remain stationary after initialization, while consumers are mobile. Following a purchase, consumers move closer to the seller they bought from. The specific movement rules (e.g., distance, speed, proximity) are detailed in the submodels section.
Temporal scale. The simulation advances in discrete time steps. At each time step, interactions between consumers and sellers occur, and state variables (e.g., sales and \(WoM\)) are updated according to the model dynamics.
| Parameter | Description | Values | Dynamics |
|---|---|---|---|
| \(N_{c}\) | Number of consumers | Integer (model-defined) | No |
| \(N_{s}\) | Number of sellers | Integer (model-defined) | No |
| \(R_{i}\) | Risk-taking tendency | [0, 1] | No |
| \(P_{i}\) | Pickiness tendency | [0, 1] | No |
| \(m\) | Limited attention | Integer from 1 to \(N_{s}\) | No |
| \(S\) | Seller’s sales volume | Normalized to [0, 1] | Yes |
| \(WoM\) | Seller’s word-of-mouth | Normalized to [0, 1] | Yes |
| \(W_{m}\) | Weight of the \(WoM\) in defining the product attractiveness | [0, 1] | No |
| \(A\) | Product attractiveness | Yes | |
| \(A_{bf}\) | Attraction level of the best-found product at the current step | [0, 1] | Yes |
| \(A_{lp}\) | Attraction level of the last-purchased product in the last step | [0, 1] | Yes |
| \(d\) | The difference in attraction between \(A_{bf}\) and \(A_{bf}\) | [-1, 1] | Yes |
| \(t\) | Threshold of tolerance for attractiveness differences | [0, 1] | No |
| \(\alpha\) and \(\beta\) | Shape parameters for the Beta distribution used to generate \(R_{i}\) and \(P_{i}\) | \(\alpha, \beta \geq 0\) | No |
Process overview and scheduling
The consumer purchasing process in the model unfolds over discrete time steps, with each cycle representing one complete round of interaction between consumers and sellers. The purchasing process consists of three sequential stages: Search, Consumption, and Evaluation, mirroring the typical phases of online shopping identified in previous research. A flowchart summarizing these processes is provided in Figure 3 in the main text.
Search stage. The stage represents the initial phase of the consumer purchasing process, where consumers gather information about sellers and products to identify potential purchase options. This stage is influenced by consumers’ limited attention and their historical purchase data. Specifically, at the start of each time step, consumers enter the market with asymmetric information. Initially lacking any purchase history, they conduct random searches for sellers and products. Consumers are motivated to explore the market to obtain information on product attributes, including sales and aggregated consumer feedback. However, their exploration is limited by a fixed attention span, quantified by the parameter \(m\). This parameter restricts each consumer to consider at most \(m\) sellers during the search phase, reflecting the bounded rationality and information-processing constraints observed in real online shopping behaviors. As the simulation advances over multiple time steps, consumers accumulate a record of past purchases, which in turn informs subsequent search behavior.
Consumption stage. Consumers decide which product to purchase, the last-purchased product or the new product, based on the information gathered during the search stage. Firstly, consumers identify the best-found product (highest attractiveness) among the \(m\) sellers they evaluated. Secondly, they compare the best-found product with their last-purchased product (historical choice) using the following rules: Conservative consumers (with lower \(R_{i}\)) prefer to stick with their last-purchased product unless the best-found product offers a significant advantage; Risk-taking consumers (with higher \(R_{i}\)) prefer to switch to the best-found product unless the last-purchased product is significantly better. Lastly, after the comparison, consumers make their purchase decisions and update their purchase history (last-purchased product).
Evaluation stage. Consumers provide feedback on the purchased product, influencing the seller’s \(WoM\). Consumers evaluate the purchased product based on their pickiness tendency (\(P_{i}\)): With probability \(P_{i}\), the consumer leaves a negative rating, decreasing the product’s rating by 1; With probability \(1-P_{i}\), the consumer leaves a positive rating, increasing the product’s rating by 1 (see Equation 3). This feedback mechanism captures the dual influence of consumer evaluation, where the collective ratings, in conjunction with sales, shape the attractiveness of each seller in subsequent time steps.
Scheduling and model iteration. Each full cycle of Search-Consumption-Evaluation constitutes one time step. At the end of each time step, the model updates the market environment. a) Market updates. Sellers’ sales and \(WoM\) are updated based on the latest purchases and feedback. The market calculates sales rankings and concentration levels (e.g., market share distribution). b) Consumer updates. Consumers update their purchase history (last-purchased product). c) Seller updates. Sellers receive new consumer feedback and update their sales and \(WoM\). With these updates, the system transitions seamlessly into the next time step, and the entire process repeats.
Design concepts
This section outlines the key theoretical and conceptual foundations of the model that capture the micro-to-macro linkages in online retail markets, including emergent phenomena, agent adaptation, decision-making processes, and other design principles. The following points outline the underlying ideas and mechanisms.
Basic principles. The model simulates a market where consumer heterogeneity, specifically in terms of risk-taking and pickiness, drives market dynamics. Sellers are assumed to be homogeneous in terms of the products they offer, with differentiation arising solely from consumer-generated feedback (sales and word-of-mouth ratings). This design isolates the effect of consumer behavior on market concentration, emphasizing the role of individual decision-making processes in shaping aggregate outcomes. The model is grounded in theories of bounded rationality and consumer behavior, particularly in the context of online shopping.
Emergence. Macro-level phenomena, mainly market concentration and dynamics, emerge from the repeated interactions of individual consumers with sellers. The aggregation of purchase decisions, influenced by consumers’ risk-taking and pickiness traits, leads to evolving sales and word-of-mouth scores. For example, some sellers may dominate the market due to higher sales and better \(WoM\) (Market Concentration), and positive or negative feedback from consumers can amplify or diminish a seller’s reputation over time (Feedback Loops). These emergent market patterns reflect the cumulative effect of local decisions and feedback loops, demonstrating how micro-level behaviors can lead to unexpected macro-level properties.
Adaptation. Consumers adapt their purchasing decisions over time based on their past experiences. With each time step, they update their purchase history (last-purchase), which then informs the comparison with newly discovered options (best-found). This adaptive behavior is modulated by each consumer’s risk-taking tendency. Conservative consumers tend to adhere to their established purchase patterns unless presented with a significantly superior option, whereas risk-taking consumers are more inclined to switch to new products. Simultaneously, sellers’ \(WoM\) and sales are updated dynamically based on consumer feedback, influencing their market position. This adaptive decision-making process enables the model to capture the dynamic evolution of consumer preferences and market structure.
Objectives. The primary objective for consumers is to maximize their satisfaction by selecting products that best meet their preferences, as indicated by the attractiveness of products (a function of sales and word-of-mouth). For sellers, while there is no explicit decision-making process, their performance (as measured by sales and \(WoM\)) serves as a proxy for market success.
Learning. Although the model does not incorporate an explicit learning algorithm, consumers indirectly "learn" from their purchase history. Their evolving last-purchase record reflects accumulated market experience, guiding future choices in a manner consistent with bounded rationality. Over time, this historical record influences their search and consumption decisions, thereby mimicking a form of experiential learning.
Interaction. Interactions in the model occur indirectly through market signals rather than direct communication among consumers. Two primary forms of interaction are represented. The first is \(consumer-seller\) interaction: a) Consumer evaluations (through \(WoM\)) and seller performance (through sales) serve as the conduits of interaction. b) Sellers’ \(WoM\) and sales are influenced by consumer behavior, creating a feedback loop. The second is \(consumer-consumer\) interaction: Consumers interact indirectly through \(WoM\), as their collective feedback influences the ratings and attractiveness of sellers’ products. Such indirect interaction framework allows the model to capture the influence of social feedback mechanisms, such as the spread of word-of-mouth, on market dynamics without modeling explicit social networks.
Stochasticity. Several elements of the model are stochastic. The spatial distribution of consumers is determined by random draws from a uniform distribution. And they randomly select \(m\) sellers to evaluate during the initial search stage, introducing variability in their decision-making process. Additionally, the initial distributions of the risk-taking and pickiness tendencies are generated using a Beta distribution, allowing for varied and probabilistic representations of consumer preferences. The evaluation stage introduces further stochasticity, as each consumer leaves a negative rating with probability \(P_{i}\) and a positive rating with probability \(1-P_{i}\).
Observation. The aggregated effects of individual actions, such as cumulative sales and word-of-mouth, form the basis for the emergent market structure. Sellers are ranked based on these collective measures, and overall market concentration is observed as a macro-level outcome. Although individual consumer decisions are made in isolation, collective behavior is observable through market-level indicators, enabling the assessment of phenomena like market concentration and dynamics. Specifically, the model tracks and outputs the following metrics: a) Sales Concentration: The distribution of sales across sellers. b) \(WoM\) Dynamics: Changes in sellers’ aggregated ratings over time. c) Market Evolution: Changes in market structure and seller rankings over time.
Details
Initialization
The simulation market is initialized with a predefined number of consumers and sellers, each assigned specific behavioral traits and constraints. The key initialization parameters are as follows.
Population setup. a) The market consists of 300 consumers and 30 sellers, randomly distributed in space. b) Consumers enter the market with no prior purchase history, requiring them to engage in random searches in the initial steps.
Consumer attention (\(m\)). a) Each consumer has a limited attention span and can only remember up to three sellers per transaction (\(m\) = 3). b) This constraint reflects bounded rationality in online shopping, as consumers cannot evaluate all available options but must instead rely on a limited consideration set.
Consumer traits (\(R_{i}\) and \(P_{i}\)). a) The behavioral tendencies of consumers, including their risk-taking propensity (\(R_{i}\)) and pickiness (\(P_{i}\)), are initialized using Beta-distributed random values. b) The specific parameter settings for these distributions are given in Table 2. c) The distribution type determines whether most consumers exhibit risk-taking (left-skewed), symmetric unimodal distribution (centered around 0.5), or less risk-taking (right-skewed) behaviors.
| Parameter Setting | \(\alpha\) | \(\beta\) |
|---|---|---|
| Left-skewed | 10 | 1 |
| Unimodal distribution centered 0.5 | 10 | 10 |
| Right-skewed | 1 | 10 |
Market experimentation and replication. a) Each simulation experiment consists of 20 repetitions, and results are averaged across repetitions to ensure statistical reliability. b) One full trade cycle (including search, consumption, and evaluation) constitutes a single time step, with the market iterating over multiple time steps.
Seller initialization. a) All sellers start with neutral ratings and zero initial sales, ensuring that early market dynamics emerge from consumer decisions rather than preset seller advantages. b) The attractiveness of sellers evolves based on consumer evaluations and cumulative sales performance over time.
Input data
The model does not use input data to represent time-varying processes.
Submodels
Consumer traits. The heterogeneity of consumer behavior in the artificial market is captured through two key traits: risk-taking (\(R_{i}\)) and pickiness (\(P_{i}\)). These traits are initialized using Beta distributions (as shown in Equation 1), which allow for flexible modeling of diverse behavioral tendencies among consumers, parameterized as \(R_{i} \sim Beta(\alpha1,\beta1)\) and \(P_{i} \sim Beta(\alpha2,\beta2)\).
The implementation in the model follows three steps: a) At the start of the simulation, each consumer is assigned a unique \(R_{i}\) and \(P_{i}\) value drawn from the appropriate Beta distribution. b) These traits remain constant for each consumer throughout the simulation, ensuring persistent behavioral differences in decision-making and feedback tendencies. c) The selected parameter values allow for experimentation with different market conditions, where populations may be predominantly, e.g., risk-averse, risk-neutral, or risk-seeking.
Normalization function. This submodel describes how Word-of-Mouth (\(WoM\)) and Sales are normalized to the range [0, 1] to ensure comparability across sellers. The normalization of \(WoM\) is calculated using the formula in Equation 4. The same normalization process is applied to Sales according to Equation 5:
| \[S_{norm} = \begin{cases} 0.5 & \text{if } Sales_{max} = Sales_{min} \\ \frac{Sales-Sales_{min}}{Sales_{max}-Sales_{min}} & \text{otherwise} \end{cases} \] | \[(5)\] |
Where, \(S_{norm}\) is the normalized sales value between [0, 1]; \(sales\) is the total number of units sold by a specific seller. \(Sales_{max}\) and \(Sales_{min}\) are the highest and lowest sales in the market, respectively. If all sellers have the same sales (\(Sales_{max} = Sales_{min}\)), the normalized sales value is set to 0.5 to avoid division by 0. Otherwise, sales are linearly scaled between 0 and 1, where sellers with higher sales receive a higher normalized score.
Market concentration. To evaluate the structure of the market and detect potential dominance by leading sellers, a concentration ratio (CR) is used. This metric quantifies the degree of market concentration by aggregating the market shares of the top \(n\) sellers in the market. In this model, we employ the concentration ratio of the largest seller (\(CR1\)) as an indicator of market concentration. \(CR1\) specifically captures the proportion of total market sales controlled by the single largest seller at each time step. The \(CR1\) is computed as follows: a) Aggregate sales. For each time step, the total sales of all firms are summed to determine the overall market size. b) Identify the largest seller. Among all firms, the one with the highest sales during the time step is identified. c) Compute \(CR1\). The market share of the largest seller is calculated by dividing its sales by the total market sales, as shown in Equation 6:
| \[CR1_t = \begin{cases} 0 & \text{if } \sum\limits_{i=1}^{N} Sales_{i,t} = 0 \\ \frac{Sales_{\text{max},t}}{\sum\limits_{i=1}^{N} Sales_{i,t}} & \text{otherwise} \end{cases} \] | \[(6)\] |
where, \(Sales_{max}\) is the sales of the largest seller at time \(t\); \(\sum_{i=1}^{N} \text{Sales}_{i,t}\) is the total sales of all firms at time \(t\); \(CR1_{t}\) ranges from 0 to 1, with higher values indicating stronger market dominance by a single seller.
Product attraction. The attraction of a product determines consumer preferences and purchasing behavior. It is computed based on word-of-mouth and sales, both of which are normalized between 0 and 1. The total attraction of a product is given by Equation 2. The purpose of attraction calculation is to provide a unified metric for evaluating products, combining both reputation (\(WoM\)) and popularity (Sales), and guide consumer decision-making in the consumption stage, helping consumers identify the most attractive product.
Consumer movement. After purchasing a product, consumers adjust their position in the market space, moving closer to the seller from whom they made the purchase. This movement is designed solely for visualization purposes, to illustrate market concentration more clearly and vividly, but it does not influence any future interactions or decision-making processes.
The movement mechanism follows these rules: a) Facing the seller. Consumers turn to face the seller they purchased from. b) Movement step. Consumers move 1.5 distance units toward the seller after each purchase. If the consumer is already near the seller, they remain in their current location. c) Location update. The consumer’s new position is recorded but does not influence their future decisions.
Appendix 2: Supplementary Experimental Results
To gain a more comprehensive understanding of the interaction between the threshold of attraction difference tolerance \(t\) and the weight of word-of-mouth \(W_{m}\), and their influence on market dynamics, we conducted an additional simulation experiment. This experiment employed the same setup as Experiment 3, with the key distinction that both \(t\) and \(W_{m}\) were varied continuously over the interval [0, 1]. The results are presented in Figure 9. For each parameter combination, the market concentration ratio (\(CR1\)) was averaged over 150 time steps and across 10 independent simulation runs.

First, Figure 9 reveals substantial market volatility, as evidenced by the irregular and diverse distribution of color patches in the heatmap. This volatility arises from the inclusion of all consumer types in the simulation, resulting in complex interactions among heterogeneous agents. As previously discussed in Experiment 3, such dynamics can lead to significant market fluctuations. Here, with both \(t\) and \(W_{m}\) jointly manipulated, these fluctuations become even more pronounced due to the increased dimensionality of influence factors.
Second, despite the high level of volatility, certain regularities emerge. Overall, higher levels of market concentration (indicated by the prevalence of yellow areas) tend to occur when \(t\) is relatively low, regardless of the value of \(W_{m}\). Conversely, lower concentration ratios (represented by dark blue areas) are primarily observed when \(t\) > 0.8. Moreover, the market concentration appears relatively stable when \(t\) approaches its minimum or maximum values, irrespective of changes in \(W_{m}\), suggesting that \(t\) exerts a stronger influence on market concentration than \(W_{m}\) under these conditions. In contrast, when \(t\) takes on intermediate values, market concentration becomes more sensitive to variations in \(W_{m}\), without exhibiting a clear linear trend.
In summary, this supplementary experiment provides deeper insights into the dynamics of market concentration under the joint influence of behavioral parameters. The results underscore the complex and nonlinear nature of market responses when driven by multiple interacting forces.
References
ABEDIN, E., Mendoza, A., & Karunasekera, S. (2021). Exploring the moderating role of readers? Perspective in evaluations of online consumer reviews. Journal of Theoretical and Applied Electronic Commerce Research, 16(7), 3406–3424. [doi:10.3390/jtaer16070184]
ANDERSON, S. P., Foros, O., Kind, H. J., & Peitz, M. (2012). Media market concentration, advertising levels, and ad prices. International Journal of Industrial Organization, 30(3), 321–325. [doi:10.1016/j.ijindorg.2011.11.003]
ANDRADE, G., Mitchell, M., & Stafford, E. (2001). New evidence and perspectives on mergers. Journal of Economic Perspectives, 15(2), 103–120. [doi:10.1257/jep.15.2.103]
BABIN, B. J., Darden, W. R., & Griffin, M. (1994). Work and/or fun: Measuring hedonic and utilitarian shopping value. Journal of Consumer Research, 20(4), 644–656. [doi:10.1086/209376]
BLOCH, P., & Richins, M. (1983). A theoretical model for the study of product importance perceptions. Journal of Marketing, 47(3). [doi:10.1177/002224298304700308]
BOLLEN, D., Knijnenburg, B. P., Willemsen, M. C., & Graus, M. (2010). Understanding choice overload in recommender systems. Proceedings of the Fourth ACM Conference on Recommender Systems. [doi:10.1145/1864708.1864724]
BONDI, T., Rossi, M., & Stevens, R. L. (2024). The good, the bad and the picky: Consumer heterogeneity and the reversal of product ratings. Management Science, 71(8), 6319–7222. [doi:10.1287/mnsc.2022.03281]
BORSENBERGER, C. (2015). The concentration phenomenon in E-commerce. In M. A. Crew & T. J. Brennan (Eds.), Postal and Delivery Innovation in the Digital Economy (pp. 31–41). Cham: Springer International Publishing. [doi:10.1007/978-3-319-12874-0_3]
BRYNJOLFSSON, E., Hu, Y. (., & Simester, D. (2011). Goodbye Pareto principle, hello long tail: The effect of search costs on the concentration of product sales. Management Science, 57(8), 1373–1386. [doi:10.1287/mnsc.1110.1371]
BYKOVA, A. (2017). The impact of industry’s concentration on innovation: Evidence from Russia. Corporate Finance, 11(1), 37–49. [doi:10.17323/j.jcfr.2073-0438.11.1.2017.37-49]
CHENG, A., Baumgartner, H., & Meloy, M. G. (2021). Identifying picky shoppers: Who they are and how to spot them. Journal of Consumer Psychology, 31(4), 706–725. [doi:10.1002/jcpy.1223]
CHU, X., Liu, Y., Chen, X., Ding, Z., & Tao, S. (2022). What motivates consumer to engage in microblogs? The roles of brand post characteristics and brand prestige. Electronic Commerce Research, 22(2), 451–483. [doi:10.1007/s10660-020-09435-y]
DING, Z., Tang, C., & Wei, H. (2020). Research on the development strategy of "E-Commerce + Live Broadcast" mode under the internet celebrity economy. 2020 International Conference on E-Commerce and Internet Technology (ECIT). [doi:10.1109/ecit50008.2020.00012]
DRUCKER, P. F. (1973). Management: Tasks, Responsibilities, Practices. New York, NY: Harper & Row.
DURANOVIC, G., & Filipovic, S. (2021). The impact of market concentration on competitivness of the banking sector in Serbia. Industrija, 49(3–4), 25–45.
FATAS-VILLAFRANCA, F., Fernández-Márquez, C. M., & Vázquez, F. J. (2019). Consumer social learning and industrial dynamics. Economics of Innovation and New Technology, 28(2), 119–141. [doi:10.1080/10438599.2018.1433582]
FRASQUET, M., Molla, A., & Ruiz, E. (2015). Identifying patterns in channel usage across the search, purchase and post-sales stages of shopping. Electronic Commerce Research and Applications, 14(6), 654–665. [doi:10.1016/j.elerap.2015.10.002]
GAWER, A. (2011). Platforms, Markets and Innovation. Cheltenham: Edward Elgar Publishing.
GILBERT, N., & Troitzsch, K. (2005). Simulation for the Social Scientist.London: McGraw-Hill Education (UK).
GOLDHABER, M. H. (1997). Attention shoppers. Wired Magazine.
GOLDMANIS, M., Hortacsu, A., Syverson, C., & Emre, O. (2010). E-commerce and the market structure of retail industries. The Economic Journal, 120(545), 651–682. [doi:10.1111/j.1468-0297.2009.02310.x]
GRIMM, V., Berger, U., Bastiansen, F., Eliassen, S., Ginot, V., Giske, J., Goss-Custard, J., Grand, T., Heinz, S. K., Huse, G., Huth, A., Jepsen, J. U., JNørgensen, C., Mooij, W. M., Müller, B., Pe’er, G., Piou, C., Railsback, S. F., Robbins, A. M., … DeAngelis, D. L. (2006). A standard protocol for describing individual-based and agent-based models. Ecological Modelling, 198(1), 115–126. [doi:10.1016/j.ecolmodel.2006.04.023]
GRIMM, V., Railsback, S. F., Vincenot, C. E., Berger, U., Gallagher, C., DeAngelis, D. L., Edmonds, B., Ge, J., Giske, J., Groeneveld, J., Johnston, A. S. A., Milles, A., Nabe-Nielsen, J., Polhill, J. G., Radchuk, V., Rohwäder, M. S., Stillman, R. A., Thiele, J. C., & Ayllón, D. (2020). The ODD protocol for describing agent-based and other simulation models: A second update to improve clarity, replication, and structural realism. Journal of Artificial Societies and Social Simulation, 23(2), 7. [doi:10.18564/jasss.4259]
GU, B., Konana, P., & Chen, H.-W. M. (2012). Identifying consumer consideration set at the purchase time from aggregate purchase data in online retailing. Decision Support Systems, 53(3), 625–633. [doi:10.1016/j.dss.2012.02.015]
HAUCAP, J., & Heimeshoff, U. (2014). Google, Facebook, Amazon, eBay: Is the Internet driving competition or market monopolization? International Economics and Economic Policy, 11(1), 49–61. [doi:10.1007/s10368-013-0247-6]
HE, W., Li, M., & Zheng, J. (2023). Switching cost, network externality and platform competition. International Review of Economics & Finance, 84, 428–443. [doi:10.1016/j.iref.2022.11.037]
HERVAS-DRANE, A. (2015). Recommended for you: The effect of word-of-mouth on sales concentration. International Journal of Research in Marketing, 32(2), 207–218. [doi:10.1016/j.ijresmar.2015.02.005]
HUOTARI, P. (2017). Strategic interaction in platform-based markets: An agent-based simulation approach. PhD Thesis, Lappeenranta University of Technology.
JADLOW, J. M. (1981). New evidence on innovation and market structure. Managerial and Decision Economics, 2(2), 91–96. [doi:10.1002/mde.4090020205]
JAGER, W. (2000). Modelling consumer behaviour. University of Groningen. Available at: https://research.rug.nl/en/publications/modelling-consumer-behaviour
JAGER, W., Antosz, P., Li, T., Polhill, G., Szczepanska, T., & Wang, S. (2025). HUMAT: An integrated framework for modelling individual motivations, social exchange and network dynamics. Journal of Artificial Societies and Social Simulation, 28(1), 4. [doi:10.18564/jasss.5611]
JAGER, W., & Janssen, M. (2012). An updated conceptual framework for integrated modeling of human decision making: The Consumat II. Paper for Workshop Complexity in the Real World@ ECCS.
KAHNEMAN, D. (1973). Attention and effort. Englewood Cliffs, NJ: Prentice-Hall, Inc.
KWOKA, J. E. (1981). Does the choice on concentration measure really matter? The Journal of Industrial Economics, 29(4), 445–453.
KWON, S. Y., Ma, Y., & Zimmermann, K. (2024). 100 years of rising corporate concentration. American Economic Review, 114(7), 2111–2140. [doi:10.1257/aer.20220621]
LAINCZ, C. A. (2009). R&D subsidies in a model of growth with dynamic market structure. Journal of Evolutionary Economics, 19(5), 643–673. [doi:10.1007/s00191-008-0114-8]
LANHAM, R. A. (2006). The Economics of Attention: Style and Substance in the Age of Information. Chicago, IL: University of Chicago Press.
LI, T., & Jager, W. (2023). How availability heuristic, confirmation bias and fear may drive societal polarisation: An opinion dynamics simulation of the case of COVID-19 vaccination. Journal of Artificial Societies and Social Simulation, 26(4), 2. [doi:10.18564/jasss.5135]
LI, T., Wang, S., Zhou, D., & Razzaq, A. (2025). Consumer attention and market concentration in e-commerce: An agent-based perspective. Journal of Economic Interaction and Coordination, 1–27. [doi:10.1007/s11403-025-00443-5]
LONG, C., & Zhang, X. (2012). Patterns of China’s industrialization: Concentration, specialization, and clustering. China Economic Review, 23(3), 593–612. [doi:10.1016/j.chieco.2011.09.002]
LUSK, J. L., & Coble, K. H. (2005). Risk perceptions, risk preference, and acceptance of risky food. American Journal of Agricultural Economics, 87(2), 393–405. [doi:10.1111/j.1467-8276.2005.00730.x]
MATRAVES, C., & Rondi, L. (2007). Product differentiation, industry concentration and market share turbulence. International Journal of the Economics of Business, 14(1), 37–57. [doi:10.1080/13571510601097124]
MITTAL, B., & Lassar, W. M. (1998). Why do customers switch? The dynamics of satisfaction versus loyalty. Journal of Services Marketing, 12(3), 177–194. [doi:10.1108/08876049810219502]
OK, E. (2023). Satisfied yet disloyal: A portrait of fickle consumers. PhD Thesis, University of British Columbia.
PANDEY, P. (2022). Analysis of habitual buying behavior: Understanding patterns, influences, and marketing strategies. International Journal of Multidisciplinary Innovative Research, 289–295.
PIZZUTTI, C., Goncalves, R., & Ferreira, M. (2022). Information search behavior at the post-purchase stage of the customer journey. Journal of the Academy of Marketing Science, 50(5), 981–1010. [doi:10.1007/s11747-022-00864-9]
PRYOR, F. L. (2001). New trends in U.S. Industrial concentration. Review of Industrial Organization, 18(3), 301–326. [doi:10.1023/a:1007888323241]
PUNJ, G., & Moore, R. (2009). Information search and consideration set formation in a web-based store environment. Journal of Business Research, 62(6), 644–650. [doi:10.1016/j.jbusres.2007.04.013]
PUNJ, G. N. (2013). Do consumers who conduct online research also post online reviews? A model of the relationship between online research and review posting behavior. Marketing Letters, 24(1), 97–108. [doi:10.1007/s11002-012-9205-2]
RATNAYAKE, R. (1999). Industry concentration and competition: New Zealand experience. International Journal of Industrial Organization, 17(7), 1041–1057. [doi:10.1016/s0167-7187(97)00069-6]
RHODES, A., & Zhou, J. (2019). Consumer search and retail market structure. Management Science, 65(6), 2607–2623. [doi:10.1287/mnsc.2018.3058]
SCHINDLER, R. M., & Bickart, B. (2005). Published word of mouth: Referable, consumer-generated information on the Internet (Vol. 32). Psychology Press.
SEXTON, R. J. (2000). Industrialization and consolidation in the U.S. Food Sector: Implications for competition and welfare. American Journal of Agricultural Economics, 82(5), 1087–1104. [doi:10.1111/0002-9092.00106]
SHARMIN, S., & Arman, M. (2020). Market concentration scenario in financial sector of Bangladesh. North South Business Review, 11(1), 28–37.
SHOCKER, A. D., Ben-Akiva, M., Boccara, B., & Nedungadi, P. (1991). Consideration set influences on consumer decision-making and choice: Issues, models, and suggestions. Marketing Letters, 2, 181–197. [doi:10.1007/bf02404071]
SHUKLA, P. (2009). Impact of contextual factors, brand loyalty and brand switching on purchase decisions. Journal of Consumer Marketing, 26(5), 348–357. [doi:10.1108/07363760910976600]
SIMON, H. A. (1978). Rationality as process and as product of thought. The American Economic Review, 68(2), 1–16.
SLEUWAEGEN, L., & Dehandschutter, W. (1986). The critical choice between the concentration ratio and the H-Index in assessing industry performance. The Journal of Industrial Economics, 35(2), 193–208. [doi:10.2307/2098358]
VAN de Rijt, A. (2019). Self-correcting dynamics in social influence processes. American Journal of Sociology, 124(5). [doi:10.1086/702899]
WEI, J., WEI, X., Zhang, D. (., & Liu, J. (2023). First-party content and market concentration on a B2B E-commerce platform ? Theory and empirical evidence. Decision Support Systems, 170, 113958. [doi:10.1016/j.dss.2023.113958]
WEISS, M. J. (2003). To be about to be. American Demographics, 25(7), 28–36.
WESMAN, L. D. (2005). Assessing market power: The trade-off between market concentration and multi-participation. Journal of Competition Law & Economics, 1(2), 339–354.
WIDYASTUTI, W., Hartini, S., Tiarawati, M., Artanti, Y., & Untarini, N. (2024). Why do dissatisfied consumers remain loyal? The role of switching barriers in online shopping. Asian Journal of Business Research, 14(1), 76–96.
WILENSKY, U., & Rand, W. (2015). An Introduction to Agent-Based Modeling: Modeling Natural, Social, and Engineered Complex Systems with NetLogo. Cambridge, MA: MIT Press.
WU, L., Mattila, A. S., Wang, C.-Y., & Hanks, L. (2016). The impact of power on service customers? Willingness to post online reviews. Journal of Service Research, 19(2), 224–238. [doi:10.1177/1094670516630623]
YANAGITA, T., & Onozaki, T. (2008). Dynamics of a market with heterogeneous learning agents. Journal of Economic Interaction and Coordination, 3, 107–118. [doi:10.1007/s11403-008-0038-2]
YANAGITA, T., & Onozaki, T. (2010). Dynamics of market structure driven by the degree of consumer’s rationality. Physica A: Statistical Mechanics and Its Applications, 389(5), 1041–1054. [doi:10.1016/j.physa.2009.10.040]
ZHOU, J. (2021). China domestic sports shoes and apparel market analysis report. Available at: https://www.qianzhan.com/analyst/detail/220/210819-c282d48d.html
ZHOU, K. Z., & Nakamoto, K. (2007). How do enhanced and unique features affect new product preference? The moderating role of product familiarity. Journal of the Academy of Marketing Science, 35, 53–62. [doi:10.1007/s11747-006-0011-3]