Fallow Land Simulations to Fight Against Soil Degradation: Engaging Stakeholders with Model Exploration

, , , , ,
and
aUniversité Gustave Eiffel, ENSG, IGN, LASTIG, France; bInstitut des Systhèmes Complexes - CNRS, France; cCIRAD, UMR SELMET, France; dIRD, UMR Eco&Sols Pole de Recherche (ex-LMI) IESOL - (ISRA-UCAD-UT-IO-INERA-IRD), Senegal; eCIRAD, UMR SENS, France; fCIRAD, UMR SELMET, Senegal
Journal of Artificial
Societies and Social Simulation 29 (1) 3
<https://www.jasss.org/29/1/3.html>
DOI: 10.18564/jasss.5816
Received: 07-Jan-2025 Accepted: 06-Nov-2025 Published: 31-Jan-2026
Abstract
This methodological paper forms part of a modelling approach conducted in the Senegalese groundnut basin. It addresses two key aspects: (1) the process of co-constructing the model with local stakeholders; and (2) the use of calibration to account for non-measurable elements, which stakeholders needed to describe and evaluate their system effectively. Thematically, the study examines the relationship between social solidarity and agro-pastoral systems in Diohine, a Senegalese village where communal fallow lands are a vital indicator of socio-ecological resilience. Using the co-constructed, agent-based "Me re Diam" model, we examine the dynamics of soil fertility, population growth and agricultural yields over a 25-year period, integrating local knowledge and ecological data. Our findings emphasise the pivotal role of social solidarity mechanisms, such as parcel lending and food sharing, in stabilising agro-pastoral systems amidst resource scarcity. Calibrating the model demonstrates its ability to reproduce historical dynamics and test alternative practices. Without these mechanisms, the system collapses, revealing their indispensable nature for long-term sustainability. This work emphasises the importance of collaborative modelling in bridging the gap between empirical data and local practices, providing actionable insights for addressing soil degradation and demographic pressures.Introduction
In 2018, Monique Barbut, then Executive Secretary of the United Nations Convention to Combat Desertification (UNCCD), warned that 40% of humanity was threatened by soil degradation. Soils play a major role in food security and maintaining their fertility is crucial to ensuring people’s livelihoods. In addition, as a carbon reservoir, they are a mean of mitigating climate change (Rumpel et al. 2018).
Sahelian territories and soils exhibit explosive vitality but also significant fragility and rapid degradation (Serpantié & Ouattara 2001). Given the harsh climatic conditions in which these soils are situated, it is highly likely that the populations cultivating them will face crises. Solidarity, manifested in the norms and values of societies, enables social groups to overcome these challenges, especially during periods of crisis when governments fail to provide adequate support (Delina 2023; Malamidis 2021). Societal norms and values play a crucial role in the formation and maintenance of social structures related to solidarity and collective action.
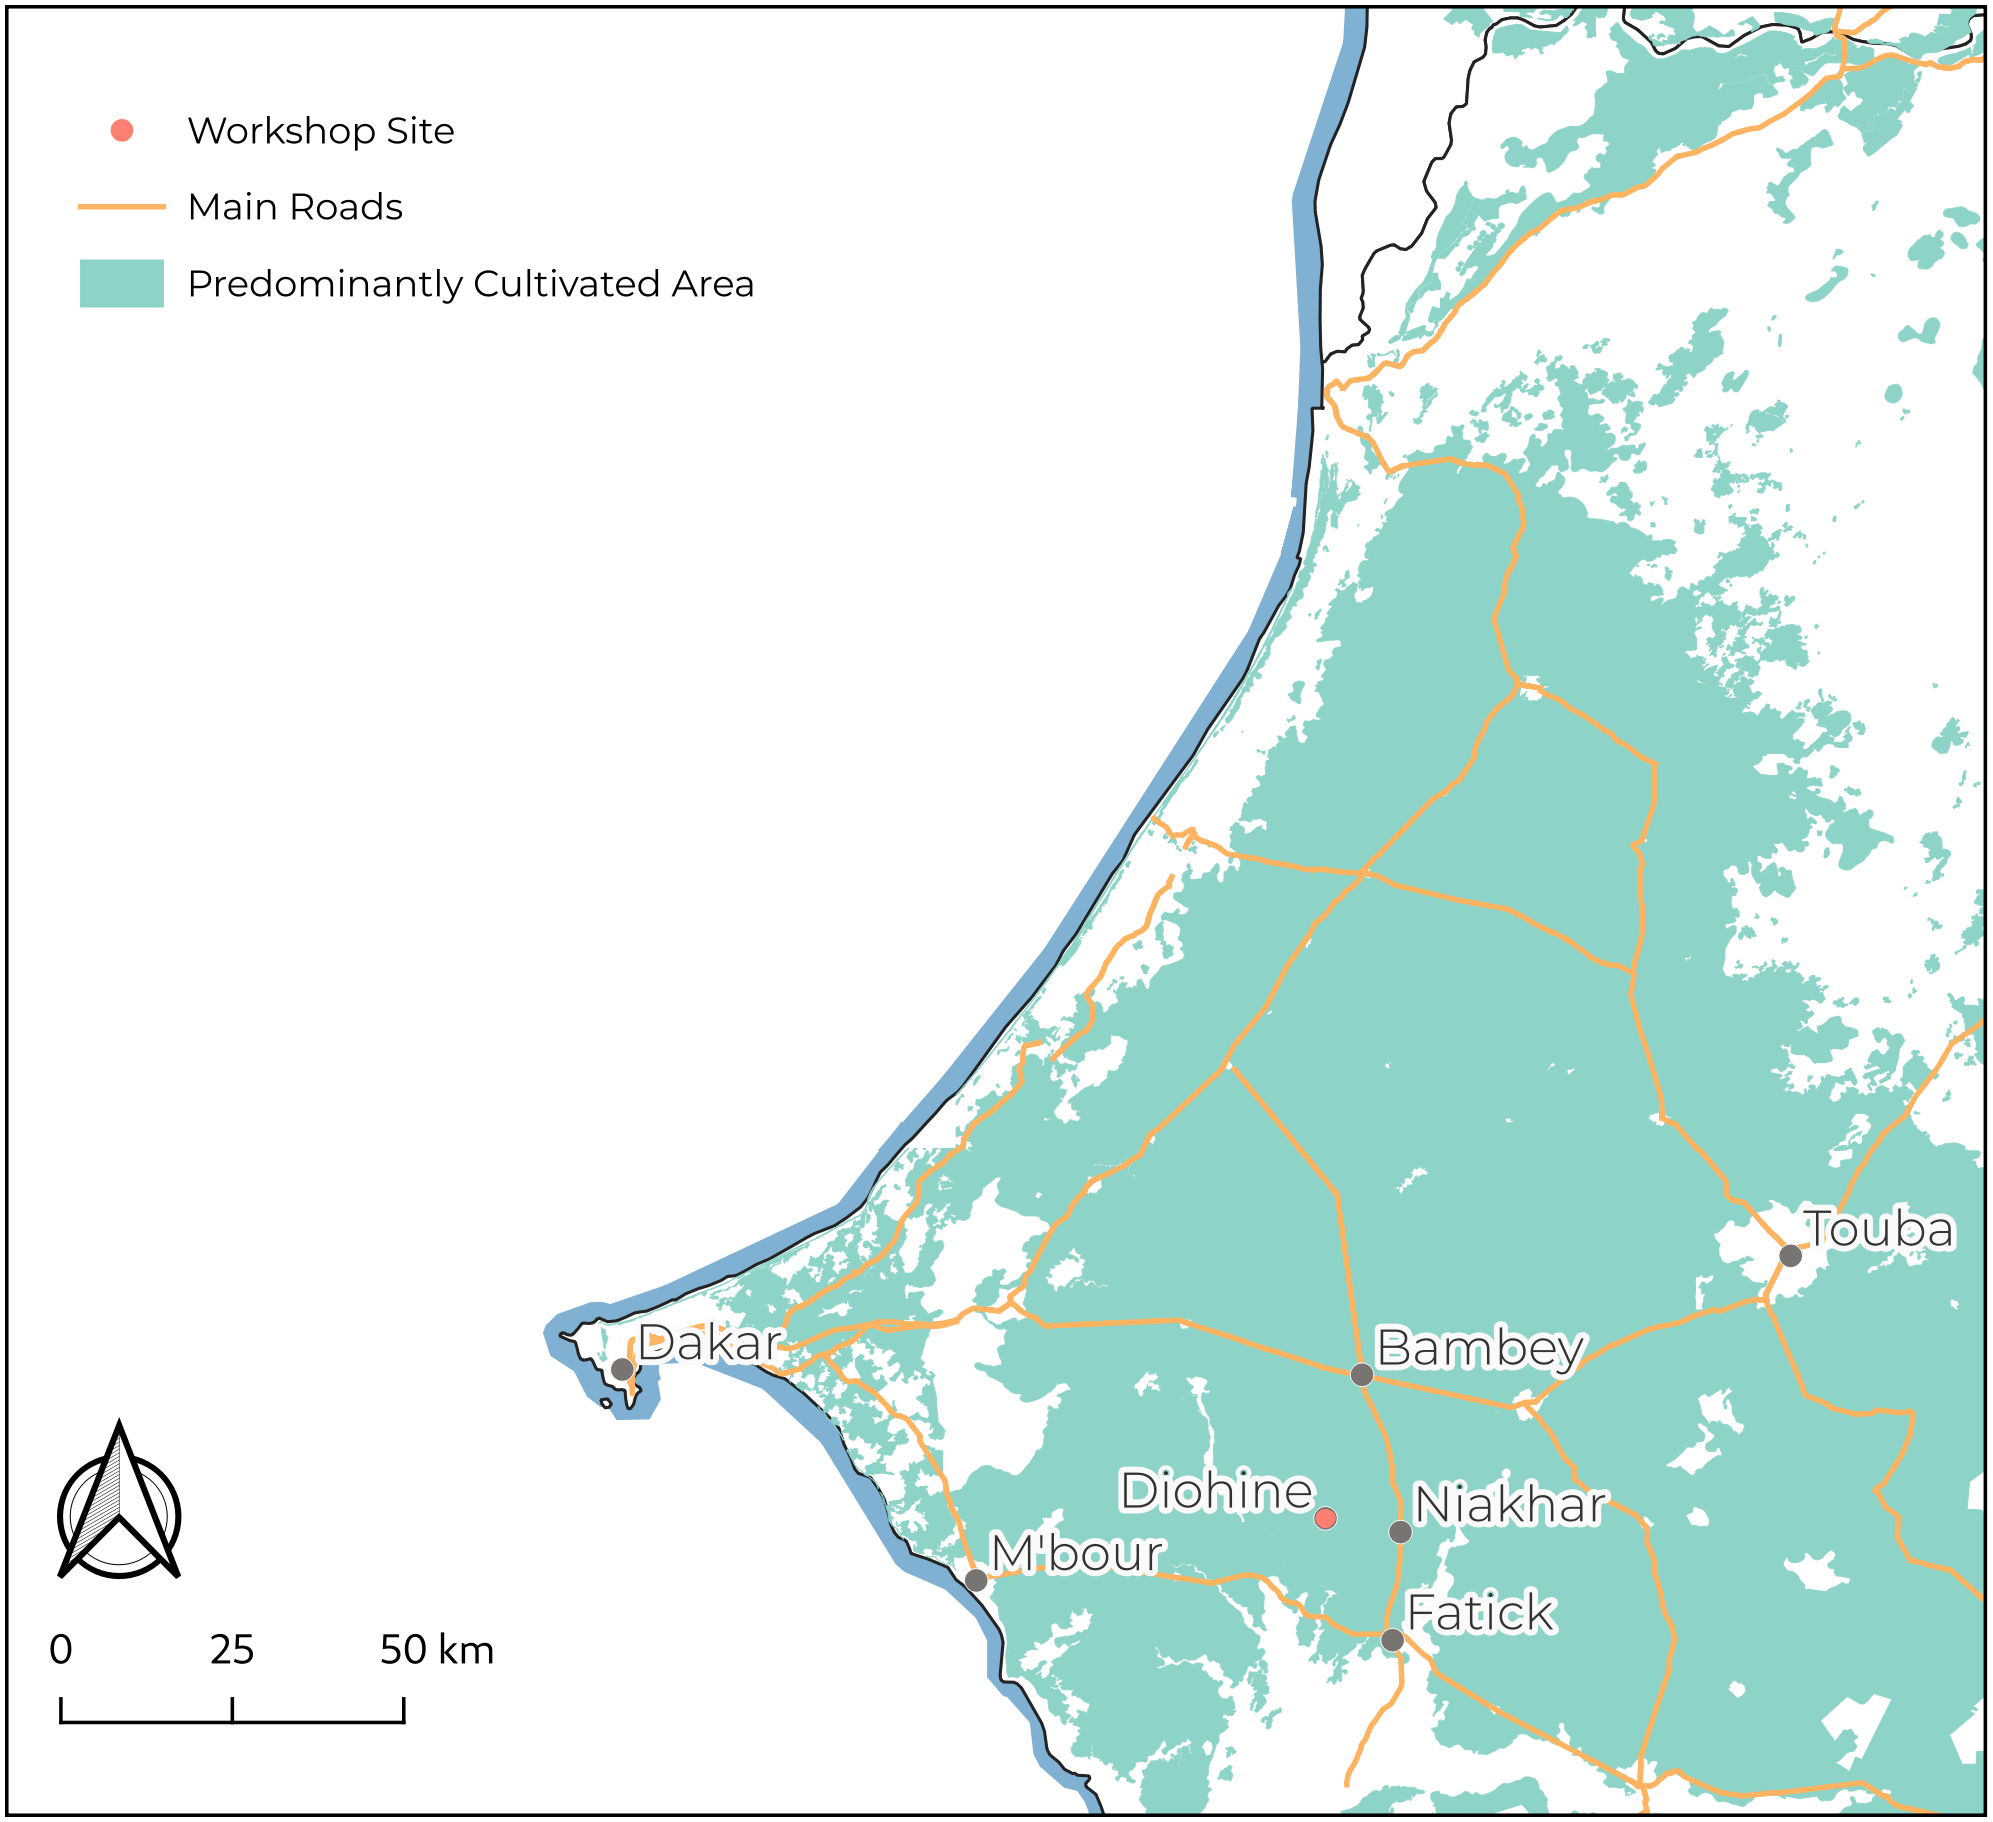
In our study area, within the Senegalese groundnut basin, around the village of Diohine (see Figure 1), agricultural conditions are deteriorating (Lericollais 1999 p. 117). Pieri (1989) reported a 50% decrease in yields since the 1970s in the region. This degradation is exacerbated by the spatial and temporal heterogeneity of rainfall, which makes harvests uncertain. Scarcity, however, fosters mutual aid and solidarity (Delay & Piou 2019). The scarcity of rain, and the resulting production crisis, therefore heavily mobilizes the solidarity systems of the Sereer people, an ethnic group primarily living in Senegal (Lericollais 1999 p. 520).
In Diohine, unlike the neighboring villages, the practice of communal fallowing has continued since the establishment of the locality, despite the fact that the village’s agricultural land has already been fully expanded (Delay, Chapron, et al. 2025). Yet for agronomists (Boserup & Chambers 1965), a drop in fertility encourages farmers to intensify their practices and extend their cultivated areas.
To address this issue, since 2020, we have been employing a Companion Modeling approach (ComMod) (Barreteau et al. 2003) with a group of stakeholders from the village of Diohine. Following a deliberative process (Perrotton et al. 2021), local actors and researchers collectively decided to address and question the conditions for maintaining communal fallow land. Indeed, fallow land is becoming a marker of extensive, low-productivity agriculture, which seems unable to meet demographic challenges. But although this opinion is gaining traction within the community, the communal fallow represents for the participants the spatial manifestation of mutual aid and solidarity. It enables farmers and agro-pastoralists, who are often in conflict in West Africa, to maintain social peace.
In this paper, we present the process of co-constructing the agent-based model "Me Re Diem" ("I am in peace" in the Sereer language) and discuss the results we have deliberated and validated with the farmers and agro-pastoralists in our working group.
Calibration plays a central role in this collective process of validating and refining the model. This is calibrated using both ‘external’ demographic data and ‘internal’ observations in the form of comments and feedback from farmers and agro-pastoralists. This enables us to extend the scope of the ComMod approach further, by revisiting the specificities of model calibration in the context of participatory modelling, and by discussing the modelling challenges that arise in such situations.
Materials and Methods
Study area
During the colonial period, groundnut cultivation was imposed on the colonies, integrating into the cropping systems of the therefore called groundnut basin. This introduction, in West-African colonies, added groundnuts to the fallow-cereal rotation, reducing the areas of fallow land and uncultivated savannas. Selective deforestation, however, preserved certain valuable trees, such as Faidherbia albida and the baobab, which played a crucial role in soil fertility management in the face of reduced fallow land. According to Masse et al. (2018), this reduction in fallow land did not affect cereal production, allowing the feeding of a rapidly growing population.
After independence in 1960, Senegal continued the colonial agricultural policy centered on groundnuts, a major source of foreign exchange (Richard 2019). The increase in cultivated areas, facilitated by animal traction, led to the deforestation of savannas and the reduction of fallow lands. The pressure on soils and the degradation of the agricultural system were exacerbated by rapid population growth (Faye et al. 2021), the decrease in pastoral routes, and the decline in forage resources, forcing herders to practice transhumance, thereby reducing manure input.
Moreover, the persistent drought from 1968 to 1985 disrupted ecological conditions, reducing yields and increasing the risks associated with agricultural intensification (Affholder et al. 2015). Consequently, expanding cultivated areas became a less risky strategy than pursuing high yields to meet growing needs, facilitated by animal traction. This reduction decreased vegetation cover and simplified cropping systems. Long-cycle millet was replaced by short-cycle millet, and fallow land almost disappeared, leading to problematic soil fertility management. Increased transhumance reduced manure inputs, while agricultural practices evolved towards millet monoculture and millet-groundnut rotation (Masse et al. 2018).
In Diohine village (c.f. Figure 1), the communal fallow land has survived since pre-colonial times, despite the land pressure. This area, referred to as "fallow" by farmers, is identified as "pasture" by agro-pastoralists. Its annual demarcation, in space and time, is negotiated and then ratified during a ritual event where spirits are consulted about the upcoming season.
Introduction to the co-design process – Companion modeling approach
From the outset, we framed our work within the companion modeling approaches (Barreteau et al. 2003). In the context of field intervention, the co-construction work followed three distinct steps of companion modeling. The first step involved supporting homogeneous groups in expressing their aspirations for the territory. These groups consisted of actors homogeneous in their agricultural practices, including households with livestock, households without livestock, merchants, etc. The work with these strategic groups led to the definition of aspirations and associated socio-technical issues. During the second step, each strategic group designated a representative to join a multi-stakeholder group, responsible for voicing the concerns and issues of their original group. Finally, the third step involved this multi-stakeholder group synthesizing the collective aspirations and identifying the constraints impeding their realization. Perrotton et al. (2021) provides a detailed account of this methodology.
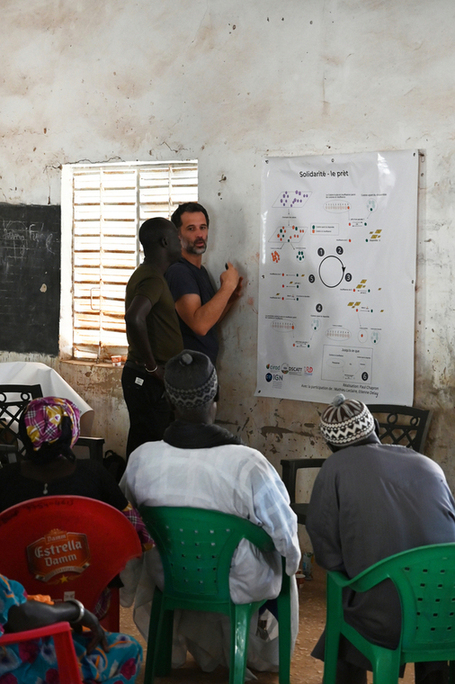
The work we present here focuses specifically on the results of the multi-stakeholder group accompaniment around the aspiration of "maintaining a communal fallow land." This workshop brought together five participants from the multi-stakeholder group during four days of workshops in October 2021 to develop an ARDI model (Etienne et al. 2011; Etienne & Collectif 2010). This diagramatic representation facilitated the initial structuring of a simulation model during two subsequent workshops in February and December 2022. A follow-up workshop held in February 2024 allowed for presenting a preliminary version of the model and its results to the participants for further adjustments (see Figure 2).
We hypothesize that fallow land can be perceived as a marker of social and ecological solidarities in action on the territory. However, these solidarities struggle to reinvent themselves. Participation in the co-construction of the conceptual model, followed by a computer simulation model, allows all participants to grasp the issues and share a representation of the system that enables them to appropriate the simulation results.
ODD
The use of the ODD (Overview, Design concepts, and Details) protocol, as proposed by Grimm et al. (2020), Grimm et al. (2010), provides a systematic and standardized approach to describe agent-based models (ABMs). This protocol has been instrumental in ensuring clarity, reproducibility, and comprehensiveness in model documentation, thereby enhancing the transparency and utility of models in ecological and socio-ecological research.
The ODD protocol consists of three main components: Overview, Design concepts, and Details. The Overview section includes a concise summary of the model’s purpose, the entities and state variables, and the process overview and scheduling
In the Design concepts section, the protocol outlines the theoretical and conceptual underpinnings of the model. This includes the rationale for choosing specific agents, their interactions, and the underlying assumptions driving the model’s development. The Details section delves into the intricacies of the model, providing comprehensive descriptions of initialization, input data, sub-models, and parameterization.
Overview
Purpose
The objective of this co-constructed model with stakeholders is to collectively reflect on alternative futures that participants might consider, as well as to think about the unimaginable. This supportive approach, which led to the development of this co-constructed model, encourages viewing the model as a hybrid object between empirical knowledge and locally rooted understanding. According to Edmonds et al. (2019), our objective lies between social learning and description to yield explanations.
Social learning, in this case, although the source of the model’s information is human and may be subjectively biased, aims to produce an objectively justifiable model. Scientific actors contribute their knowledge on soil behavior and its relationship with living organisms. Stakeholders bring forth their questions and their knowledge about their own farming practices. Thus, the simulation model can be said to summarize a common understanding (or a set of understandings) of a group of people. This learning process encompasses two additional objectives: system description and explanation.
We consider the simulation model as a description, which is an attempt to partially represent what is important in a specific observed case (or a small set of closely related cases) by the collective. This description aims to highlight explanations. By explanation, we mean establishing a possible causal chain from a configuration to its consequences in terms of mechanisms within a simulation. At the end of the simulation process, it is possible to collectively discuss these causal chains to consider their plausibility.
The objective of the model, due to its co-designed nature, is to tactfully address questions, ensuring that the primary concerns of the workshop participants remain central. Consequently, the question that the model seeks to answer has evolved from: (i) investigating the conditions for maintaining communal fallow land in Diohine to (ii) examining the conditions necessary for sustaining village livelihood at both village and kitchen scale.
Patterns
Thanks to the demographic survey carried out in the village over the past 50 years as part of the Niakhar Observatory (Delaunay et al. 2018), we were able to obtain the village’s growth rate. The model aims at reproducing the Sassem – a neighbourhood of Diohine village – population growth rate and its distribution in kitchens1 (i.e. households) of plausible size as well:
- the growth rate is 1.31% (Sassem population rose from 352 to 488 in 25 years)
- households sizes are remarkably stable over the years: they are composed of 16 people (mean is 16.52, standard deviation is 0.5)
Similarly, parcel inventories in Diohine were conducted at different periods (Audouin et al. 2015; Odru 2013); we therefore aimed to reproduce a synthetic territory whose land and parcel areas are close to real-world data:
- arable bushfields surface is 180 ha (177.1 ha in Sassem)
- 320 parcels are distributed among kitchens (352 bushfields parcels in Sassem)
- Discrepancy in parcels owning by households is moderate; the Gini index is 0.2 (same in Sassem).
- Percentage of parcels maintained in fallow declines over time: 60% was preserved in 2012, 40% in 2020
Other patterns to replicate are plausible yields (millet and groundnut). Previous works (Audouin 2014; Lericollais 1999; Pieri 1989) and stakeholders groups participants insights result in the following values:
- Millet yield is \(600 kg.ha^{-1}\) (grain)
- Groundnut yield is \(400 kg.ha^{-1}\) (nuts and shells)
These values are general, i.e., independent of the plant cultivar, agricultural practice and soil fertility; they are given by the actors as average values over several years and households.
The last pattern to be replicated is that of solidarity between households. This relation exists between households as they share the same context and constraints, especially the land pressure and the demographic pressure, and respond to them by enforcing assistance to households in need. This assistance take two forms:
- The loan of plots to households with insufficient land to cover their annual food needs by harvesting only their own plots
- food donation to households in need
Entities, state variables, and scales
Entities in this model are kitchens (i.e., households) and parcels. Figure 17 in Appendix A presents a class diagram to clarify the relationships between entities, and the overall structure of the model.
- Kitchens are the family household units. The typical size of a kitchen is around 16 people, including children. Their sizes vary over time according to some demographic dynamics (see section 3.33). Kitchens own livestock and land (in the form of several parcels), and decide of the culture orientation of their own parcels. Kitchens are involved in a solidarity network where transactions occur in form of loaning of parcels and donating some food to other kitchens in need if the loaned parcel production is still not enough (see section 3.33). Kitchens have some strategies, i.e. traits that represent their type of social-agricultural practices: cropping, parcels loans, food donations, herd grazing management and mulching.
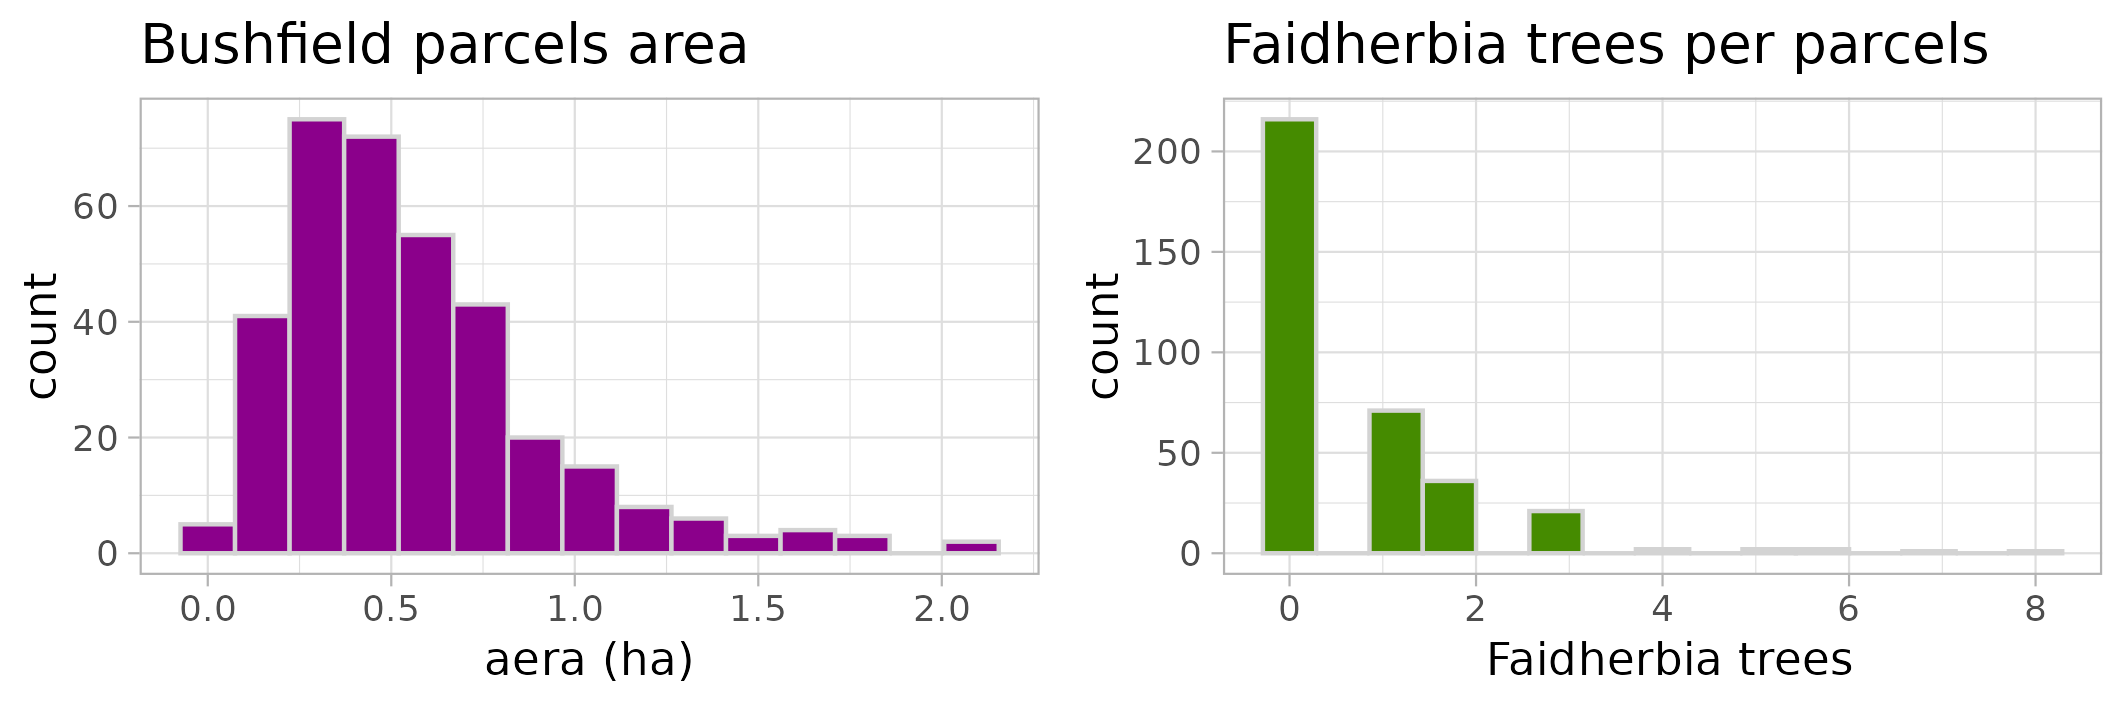
- Parcels represent atomic land units, owned by a kitchen. In a given year, a parcel can be loaned and thus will be farmed by an other kitchen than its owner. Typical sizes of parcels in Sassem are less than one hectare, with a median area of 0.45 ha (c.f. Figure 3, left).
State Variables concern the village as a whole, kitchens and parcels:
- Village
HerdSize(integer) is the size of the common pool of livestock constituted of each kitchen cattle. Cattle is not agentified in the model – cattle is a number that increases or decreases depending on the availability of fodder –, it can be seen as a proxy for manure production, fed on millet straw and grass of the resting land. Only tropical livestock units (TLU) are considered, i.e. adult cows. Typical herd size of a single agro-pastoral kitchen balancing agriculture and cattle breeding spans from one up to six animals. Total Sassem herd size is around 88 animals. These values take into account the average annual forage consumption of Sahelian cattle in the village, which is 1480 kg of straw per TLU per year (Assouma et al. 2018).
- Kitchens
size(integer) is the size of the kitchen. Typical value is 16 (Delaunay et al. 2018). This value will evolve during the simulation based on apopulationGrowth parameter. The baseline value (1.31%) is calculated using the data from Table 3.nbFaidherbiaByHa(integer) is the number of Faidherbia tree per hectare in all the kitchen’s parcels. To simplify it is supposed to be the same in each of the kitchen’s parcels. Typical value in Sassem is 4.
rotationCycledescribes the rotation cycle applied by the kitchen during the cropping phase. Possible values areFallowMilletPeanut*,MilletPeanut,MilletFallow, orMilletOnlycropingStrategyis a function that compute the amount of parcels to be cropped by the kitchen so that a certain excess of harvest is obtained. The function takes a parameter,peanutForInExcessthat modulates the excess proportion of cropped parcels devoted to peanut cultivation – the typical cash crop of Sassem farmers. This parameter stays the same during the simulation. In this paper we conduct experiments with no excess cash crop.ownFallowUsedescribes the extent to which the use of fallow parcels is permitted in the kitchen planning of cropping. Available values for this trait areNeverUseFallowthat forbids the use of fallow parcels, orUseFallowIfNeeded* that allows it, only in order to meet the kitchen food needs.loanStrategydescribes parcel loan behavior by the owner kitchen. Available values areAllExtraParcelsLoaner, where any parcels can be loaned,ExtraParcelsExceptFallowLoaner* where fallow parcels are prohibited, andSelfishwhere no parcels are loaned at all.foodDonationStrategydescribes the way kitchens may donate food to other kitchens still in need after having consumed all their own production. Available values for this trait areFoodForUsOnly, where no food is donated andFoodForAll*where excess food is made available for donations to anyone in need.drySeasonHerdStrategydescribes the cattle grazing management during the dry season, indicating on which parcels the animals are allowed to be. These rules are susceptible to change at night. Available values areAnywhereAnyTime, for which the herd can go on any parcels of the village any time,EverywhereByDayOwnerByNight* where animals are parked on their owner’s parcels at night, andOwnerOnlywhere animals never go on other kitchen plots.wetSeasonHerdStrategyis the converse trait for wet season cattle management, and possible values are exactly the same. The difference lies in the parcels where the animals may go: because of freshly sown parcels where young plants are fragile, cropped parcels are excluded from the grazing zone during the wet season.herdSizeStrategydescribes the intensity of cattle breeding activity of the kitchen. Possible values areFullCapacity, where the kitchen possess as many cows as it is possible to feed using the millet straw of their parcels and the fallow,NoHerdwhere the kitchen has no animals, andLSUByArea* which is a function used to compute the size of the kitchen herd according to the kitchen’s available total parcel area and a parameter defining the desired density of animals. At Sassem, the typical value for this density (animals per hectare) is 0.42 (Odru 2013).drySeasonManureCriteriadetermines which parcels could be manured by the herd during the dry season. Default value is to manure every parcel that will be cropped with millet the year after, as it is observed in Sassem, but it could also be later extended to some user-defined function used to implement a more refined parcel-manuring managment.mulchingStrategydescribes the use of millet crop residue as mulching to cover the soil of the kitchen parcels. Possible values areCropResidue, where the totality of the millet residue (straw and roots) are used as mulching, andNoMulchingwhere the straw is taken outside the parcel and used to feed the cattle.
cropZone(qualitative variable) indicates the rotation cycle phase in which the parcel should be. Possible values in general areOne, Two, Three, and the actualcropZonepossible values of a given parcel are derived from therotationCycleof the owner kitchen.crop(qualitative variable), the crop currently farmed on the parcel. Possible values areMillet, GroundnutandFallow. The actual crop of a parcel may differ from the one derived from thecropZone, as a parcel intended for groundnut can be loaned to another kitchen that will sew millet.area(double), the surface of the parcel, in hectare (ha).faidherbiaTreesByHa(double) the density of Faidherbia trees by hectare on the parcel (c.f. Figure 3 right, to get an idea of the current density of Faidherbia. We will explore the effect of trees further by relaxing this parameter in the following sections of the paper).
Space and Time scales. One step of simulation, as depicted in Figure 5, lasts one year. In the model environment, the smallest space unit is the parcel.
We study the Sassem district, whose total surface of interest is 205 hectares, bush fields, fallow land and resting land. The typical surface of a Sassem bushfield parcel is around 0.5 ha. 38% of the parcels have at least one Faidherbia (Figure 3).
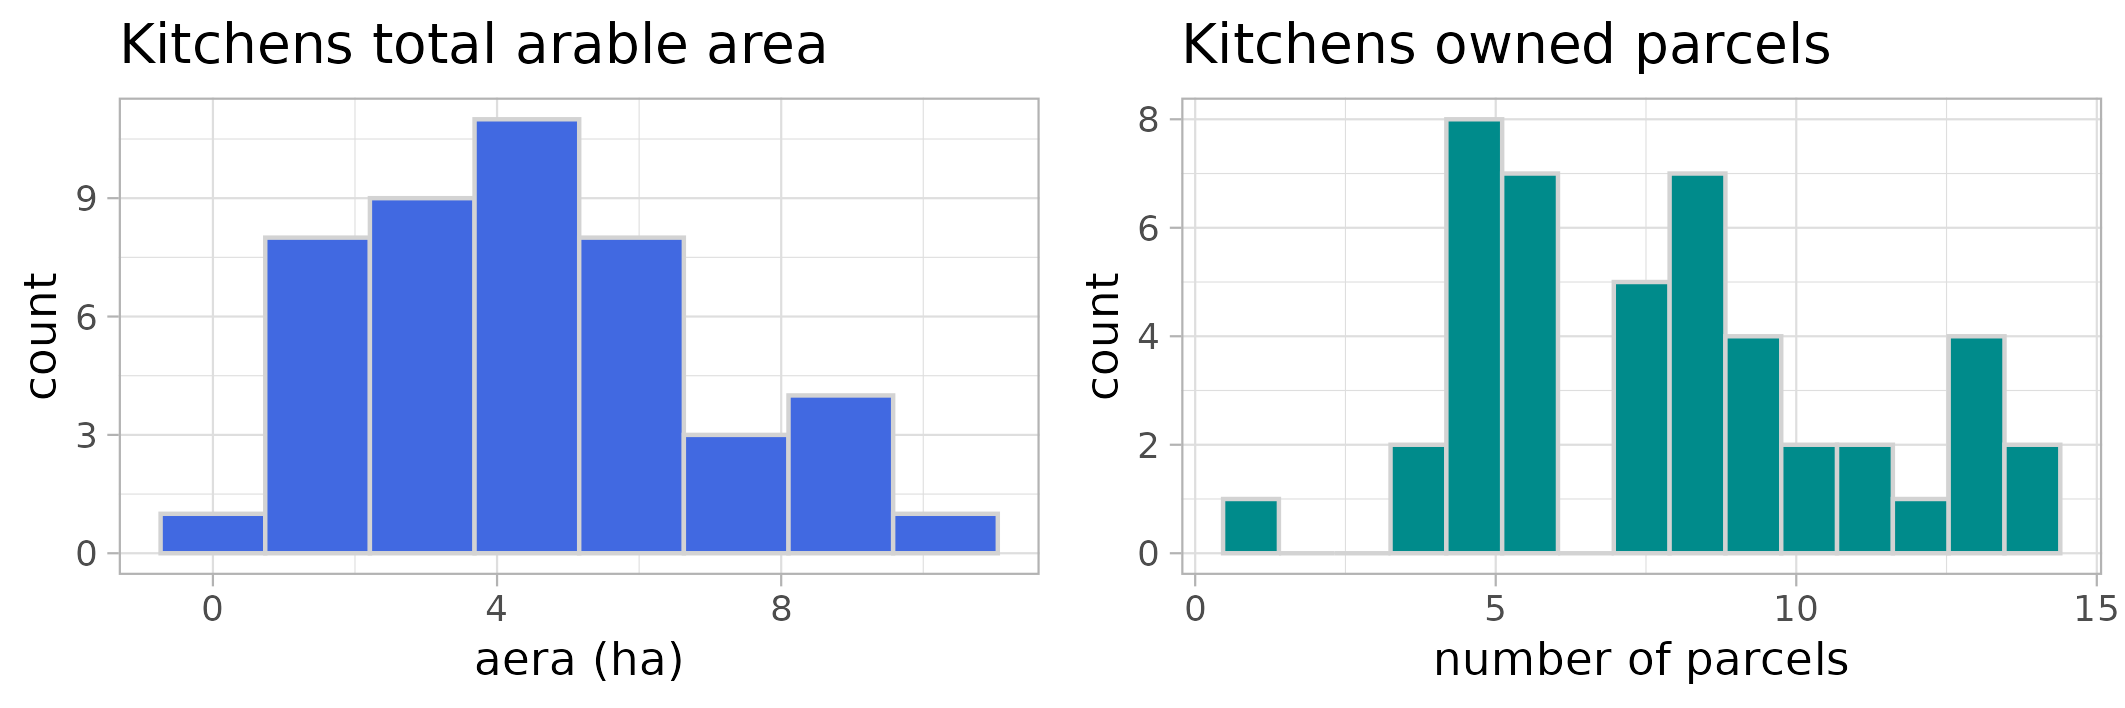
Survey data register 45 kitchens, the vast majority of which owning between 7 and 14 parcels, for a total of 352 bushfield parcels (Audouin et al. 2015). In order to fit to Sassem as closely as possible, for the calibration experiment, the simulated village is composed of 324 bush plots in bushfield parcels with a total surface areal of 180 ha, divided into 22 kitchens. A simulation run lasts 25 steps, which is the time extent of our survey data.
Process overview and scheduling
Our model consists of four types of processes (Figure 5): agricultural processes, processes related to the community’s social organization, processes occurring at the kitchen level, and processes related to soil fertility.
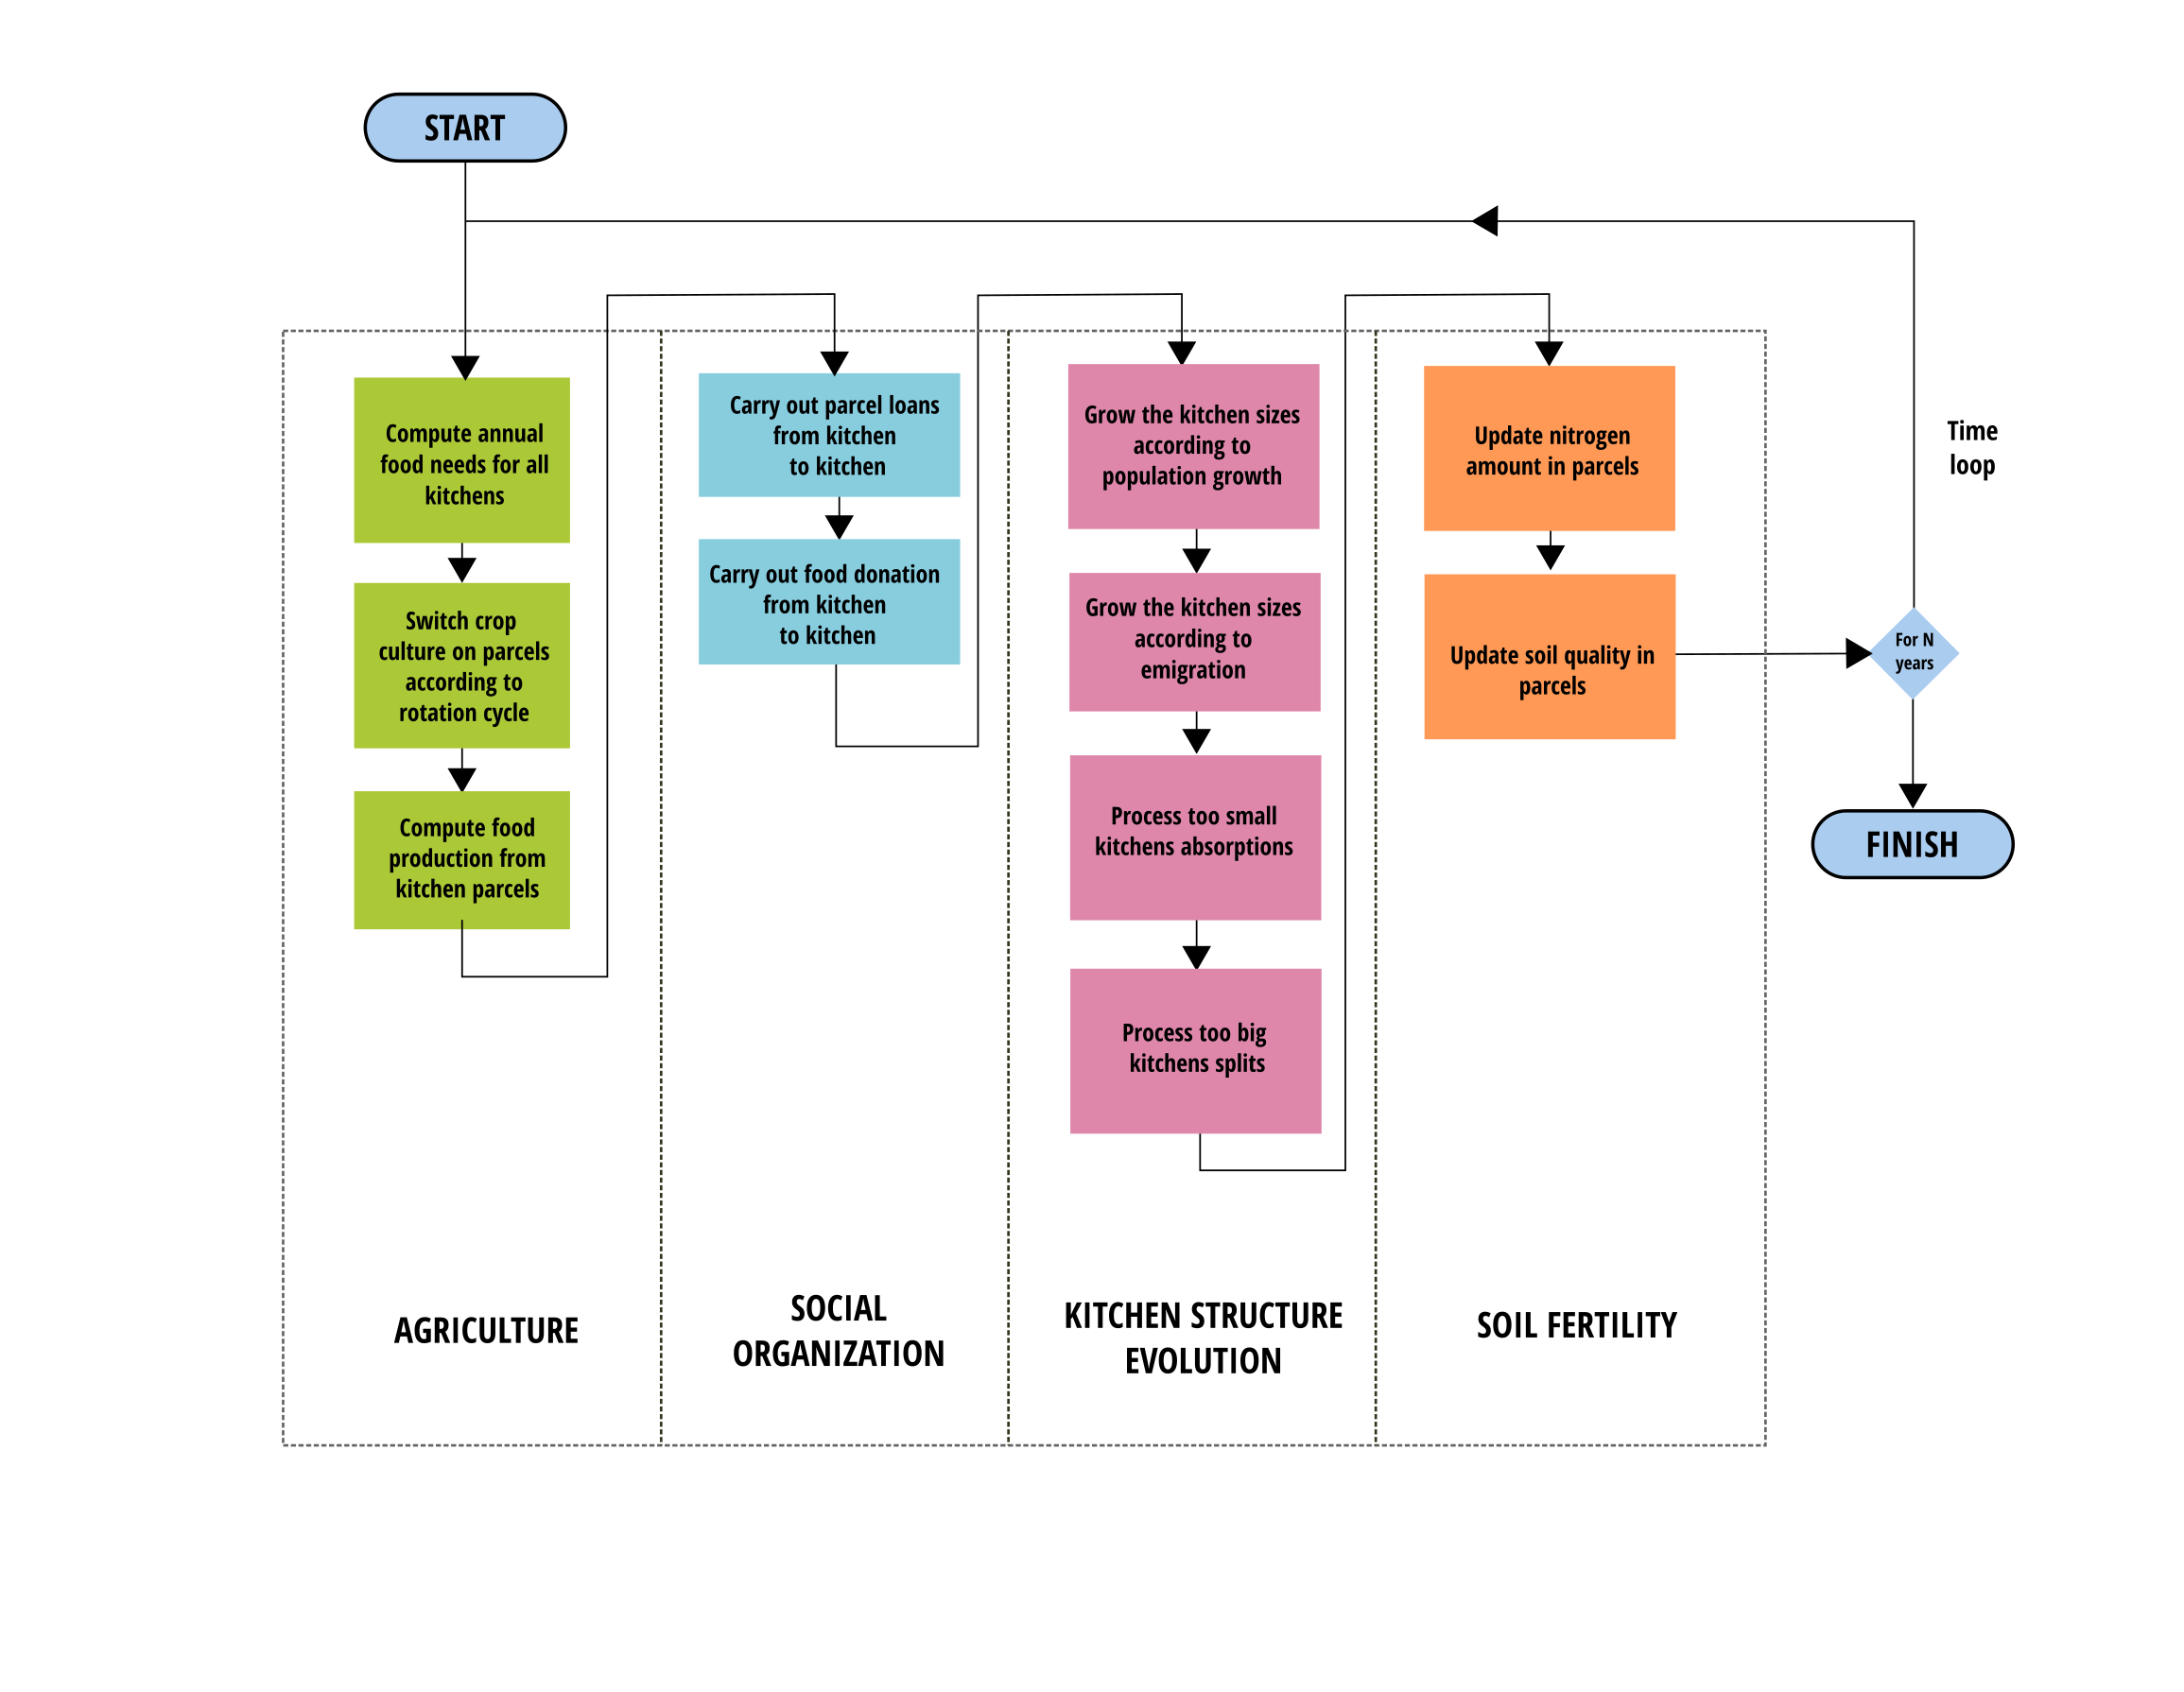
Among the agricultural processes, shown in green in Figure 5, we calculate the food requirements for each kitchens. These needs will guide the cultivation of agricultural plots, considering the crop rotation cycles of the area (groundnuts, millet, fallow). Based on the crops cultivated on the plots, but also on the quality of the soil, the agricultural production is calculated. From this production, we deduce the proportion of satisfied and unsatisfied needs for each household.
In terms of social organization, shown in blue in the figure, a mechanism allows for lending plots from one kitchen with land in excess to another with insufficient land to ensure its subsistence. If subsistence is not ensured via this first solidarity mechanism, a second one is triggered where the community (i.e., other kitchen with some food in excess) will support the kitchens in food deficit through food donations.
Each kitchen, shown in pink in the figure, grows according to the village’s population growth rate (current situation data from the Table 3). If a kitchen’s needs are not met, members of the kitchen emigrate (leaving the system). The number of migrants depends on the number of kitchen members whose needs have not been met. If some kitchens become too small, they are absorbed by another kitchen, and conversely, if a kitchen becomes too large, it is split to maintain a demographically credible size according to the village’s demographic data.
Finally, the soil processes, shown in orange in the figure, include a mechanism for updating nitrogen levels based on the crops that have been cultivated on the plot or the fact of having been in fallow, and the manure they received. Then, the soil quality of each parcel, reflecting the quality of its structure and therefore its capacity to grow plants, is updated.
Design concepts
Basic principles
In focusing on the maintenance of fallow land in Diohine, we have been drawn by the actors into questions of soil fertility. For them, fallow land is synonymous with fertilization. However, the way soils and fertilization function is largely unclear to the participants. For this, we were able to rely on existing works (Grillot 2018; Grillot et al. 2018) and on empirical knowledge.
While an important effort for congruence has been made in the model to reproduce soil fertility mechanisms that are compatible with previous research works, the formalization of vernacular knowledge has been even more important regarding the mechanisms of the social organization component. It is at this level that the dynamics of solidarity are anchored. Thus, it is quite clear to the participants that their social practices of space management structure the maintenance of the community. They question the effects of the disappearance of these mechanisms on the renewal of soil fertility.
Emergence
Several elements appear to be of interest in characterizing the emergent behavior of the model.
Maintaining fallow land. The stakeholders consider the maintenance of fallow land over time as an emerging process. Indeed, it is only possible if social mechanisms are mobilized by the actors. For example, an isolated kitchen with a majority of its parcels in the communal fallow during a given year, will crop food on them in order to fulfill its food needs, despite the fallow: subsistence overcomes fallow preservation. However, a kitchen integrated in the solidarity network of the village, in case of insufficient parcels outside of the fallow to ensure its subsistence, will benefit from the two solidarity mechanisms: parcels loans (to increase its cropping ability) and food donation (to fulfill a part of its food needs). The application of these social mechanisms will result in a reduction or a delay in the use the kitchens parcels in fallow, by evening out (a part of) their resources inequalities.
By considering the model from the perspective of the actors involved in its co-construction, we regard as emergent the fact that the maintaining of the fallow land over time is supported by solidarity practices: donations of food to kitchens in need and lending of parcels between kitchens make it possible to postpone – at least for a time – the use of fallow land for cultivation.
Village herd size. The size of the village’s herd2 is an indicator of the integration between agriculture and livestock farming, which emerges from the interactions between the different entities. Since cattle feed solely on millet straw and free grazing in the resting land, the herd size is roughly limited by the availability of millet straw. The result of the interplay of millet yields, agricultural choices and practices such as mulching that limit the availability of millet residues limits in turn the possible village herd size. This allows the characterization of the village production system in a spectrum ranging from "pure" agriculture to agro-pastoralism.
Migratory flow. Depending on the births occurrence and yields of parcels during a year, kitchens may not be able to provide its members with sufficient food. Kitchen sizes are then reduced to the extent of the available food rations. "Exceeding" members are considered migrating, leaving the village system. Thus, the total number of emigrants at the end of the simulation helps us understanding whether the village can retain its inhabitants, or if living conditions become too harsh, compelling part of the population to seek resources outside the system.
Adaptation
This model is exclusively composed of reactive agents : kitchens and parcels. Kitchen agents act in response to a shortage of food either for themselves or for those of their neighbors. Kitchens react by engaging a lending process of parcels if the shortage arises from a deficit in cultivable area, and a food donation process if the food deficit remains afterwards. If a kitchen’s food deficit is not made up, people in excess emigrate from the kitchen and leave the system.
Parcels also react to the agricultural practices and rotation cycle: their soil quality is affected by being devoted to fallow (which includes herd grazing and thus contributes to organic soil amendment) and by some of the farming practices of the kitchen currently farming the parcel, namely mulching.
Objectives
Kitchens pursue two objectives:
- farming to fulfill their food needs. This is pursued by every kitchen, during the agriculture stage of the main loop (see Figure 5). The number of parcels and the type of crop that will be farmed depend on the kitchen food needs (i.e., the number of people to feed). If the produced food was to be insufficient, the kitchen would engage in a parcel loan demand (see social organization stage of Figure 5)
- helping others to do so. This is pursued by kitchens having parcels or food in excess, that will be loaned or given to kitchens in need (parcels are loaned for the current year, food is donated). Kitchens solidarity mechanism targets equity: kitchens try to help all the demanding kitchens in order of need, up to the availability of their land or food in excess.
Sensing
Kitchens perceive their state variables (size, owned land, loaned land, number of cattle units) and the food needs of other kitchens, to commit in loans and food donations processes.
Kitchens also perceive the current state of parcels in their rotation cycle, the yield of the parcels, and the yearly available quantity of millet straw to be fed to the cattle.
Interaction
Parcels loans. Parcels loans occur when kitchens with parcels in excess loan some of them to kitchens whose parcels are not sufficient to feed their members. This solidarity process occurs every year, since arable parcels change as a result of the crop rotation cycle: the number of parcels dedicated to cultivation and the number of parcels dedicated to fallow may change significantly for each kitchen. Loanable parcels are loaned until depletion or until every kitchen parcel deficit has been filled.
Food donations. Food donations occur after the parcels loans, in a similar manner: kitchens with food in excess make some food donations to kitchens who did not fulfill their food needs with the parcels they own or have been loaned. Excess food is given to kitchen until depletion or until every kitchen food deficit has been filled.
Cattle grazing and manuring. Observed pratices in herd management in Sassem are that the cows are gathered, and form the village herd, which is free to wander in the rangeland by day. When it comes to grazing in the fallow parcels, or being parked overnight, different modes of cattle distribution among parcels can be enforced by kitchen shepherds. The description of these grazing and herd "parking" strategies has been detailed in the State Variables section. Some of these herd management practices, which are input parameters of the model, require splitting the herd across different kitchens’ plots, according to both their dry and wet season strategies. For example, the EverywhereByDayOwnerByNight in the wet season trait indicates that the kitchen cows are allowed to join the village herd during the day and parked on a single owner parcel by night during the wet season. Depending on the kitchen herd managment strategies mix in the village, "sharp" cases of manuring can occur: the village herd may not exist in itself (if every kitchen has the OwnerOnly strategy, cows will never gather) and the manure never be shared, and conversely, the village herd may never be split, and the cows manure spread evenly on parcels if every kitchen has the AnywhereAnyTime herd management strategy. Thus, the simulation of kitchens herd management strategies operates the repartition of time spent by animals over kitchen parcels during day and night, dry and wet season, and thus allows to compute distribution of animals presence in parcels over a year. This distribution is finally used to compute the amount of manure available on each parcel, that will result in a nitrogen amendment to the parcel soil.
Stochasticity
There are two stochastic processes in the model. The first pertains to the parcels affectation to kitchens. Parcels shapes are generated randomly and their affectation to kitchens are adjusted until a given Gini coefficient of their surface among households is met. The second stochastic element introduced is natality. While the number of births follows the population growth rate, the "date" of birth arrival is randomly assigned within the model.
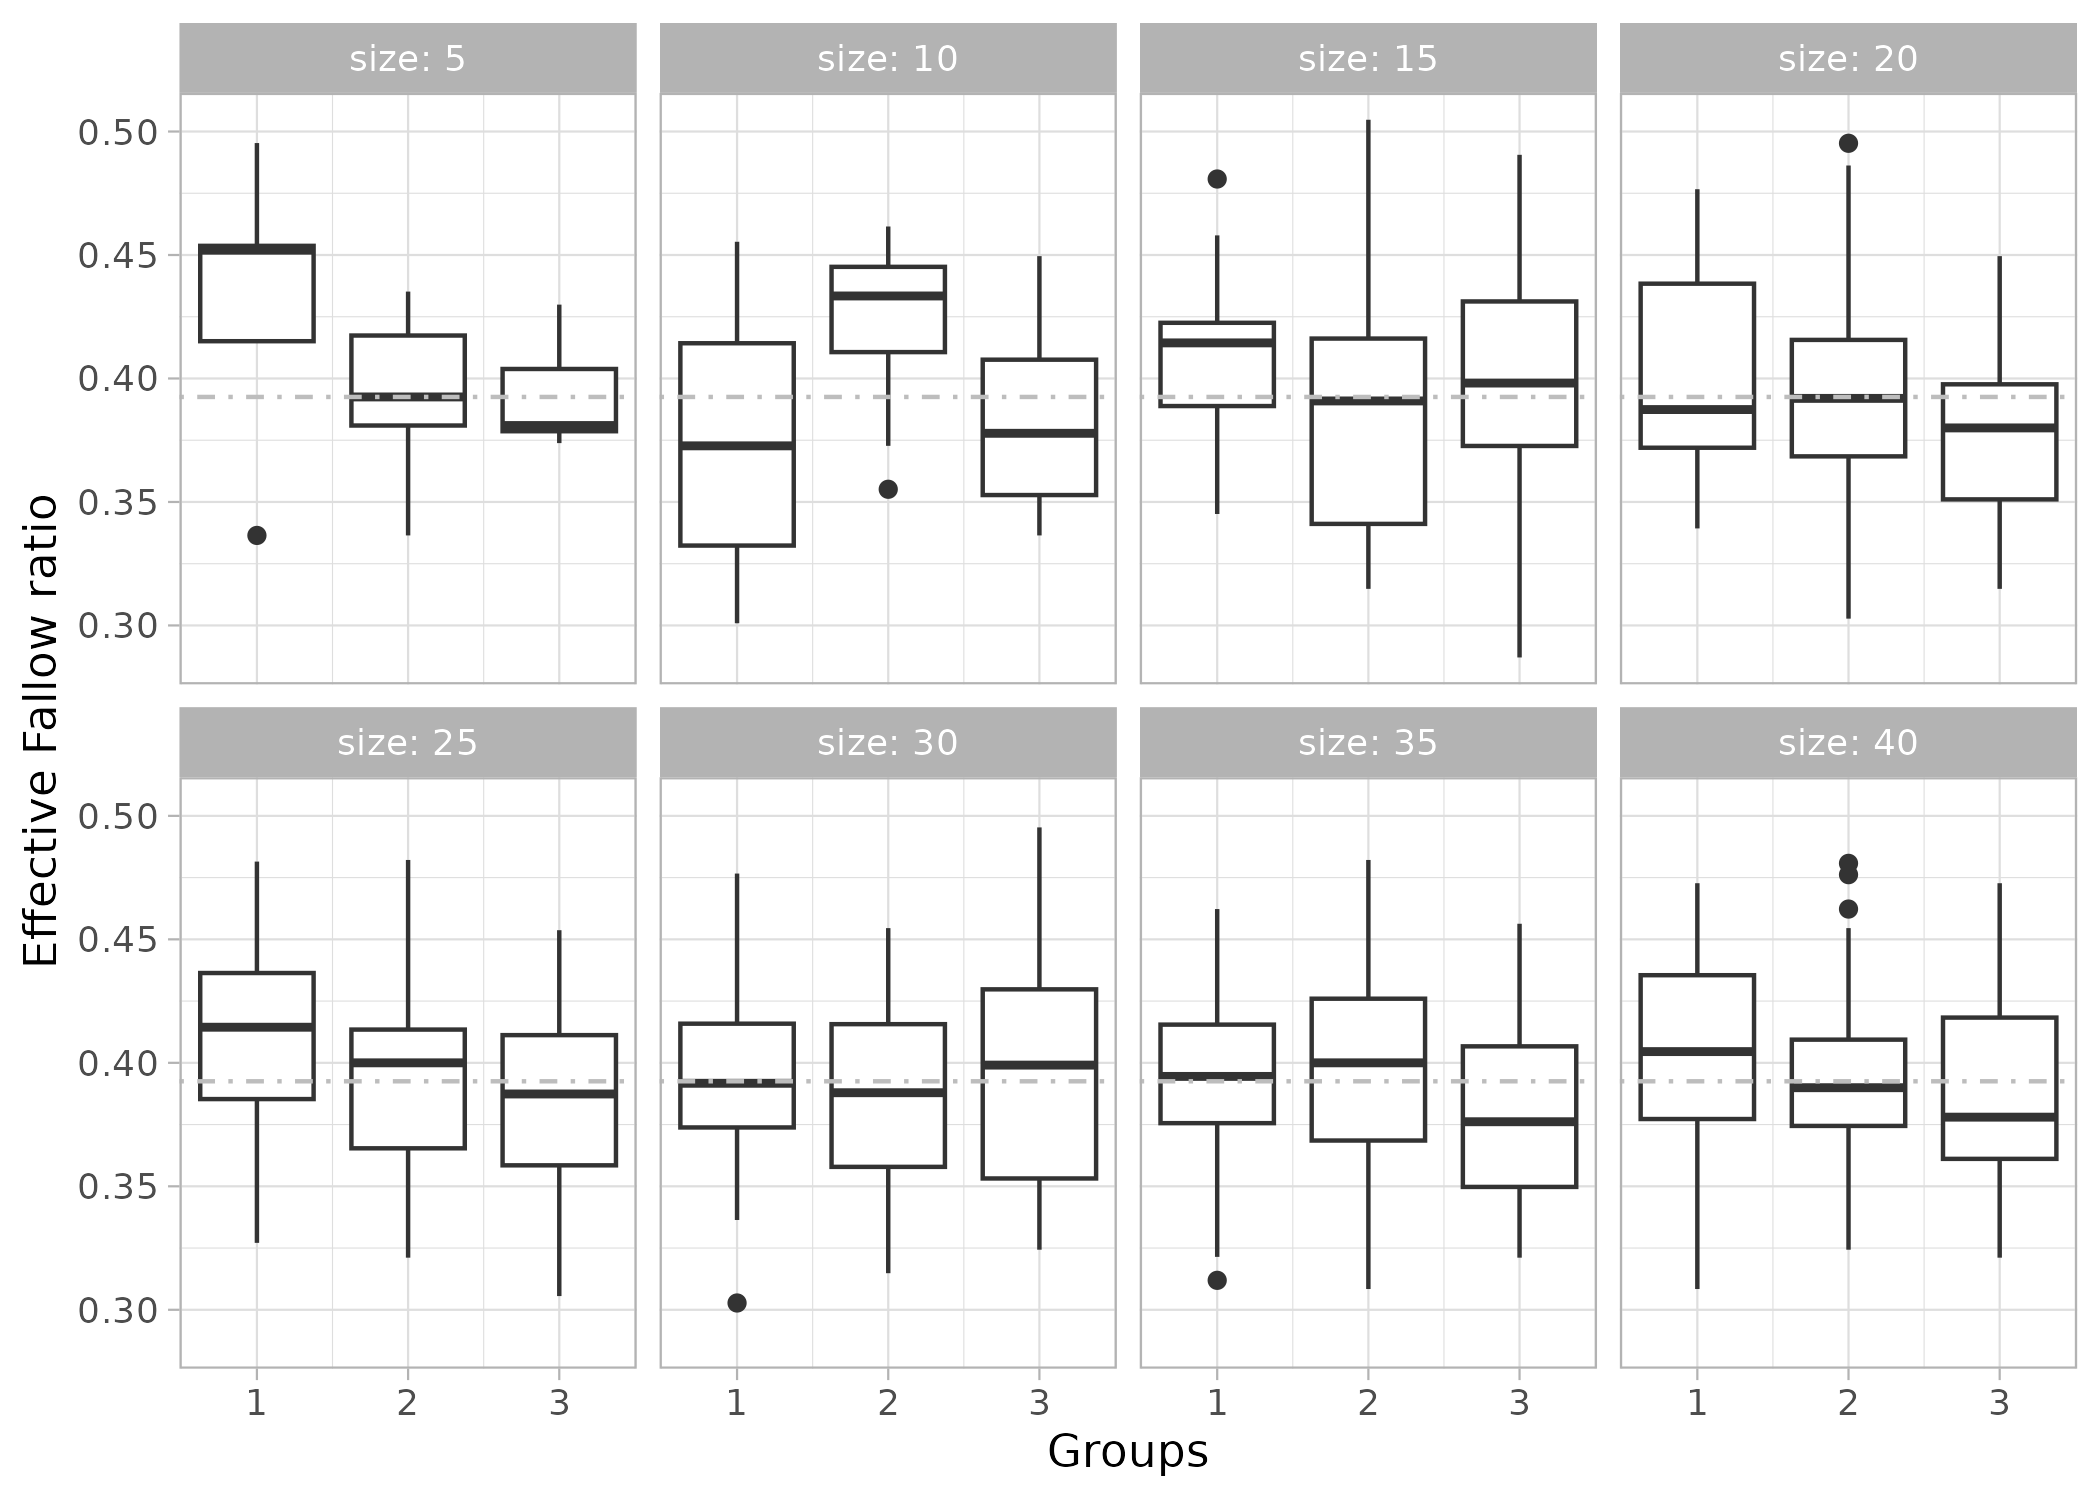
To account for the stochastic nature of the model and to ensure the robustness and reliability of the simulation results, we replicate each simulation multiple times. This allows us to assess the variability of outcomes and determine the number of replications needed to obtain stable and representative results. To determine the number of replications needed, we initially replicated the model 1000 times to obtain a population of simulations. We then conducted sampling from this simulation population by drawing samples of simulations of different sizes, in order to determine the sample size above which the results distributions stabilizes. We performed this analysis on the remaining intact fallow observable. Empirically, we selected 20 replications as the minimum number needed to stabilize both the median and the standard deviation of the results, based on a comparison with 1000 replications. Increasing the number to 30 did not offer a significant improvement, as shown in the figure, and was therefore not retained in order to reduce computation time for subsequent explorations.
The model does not include explicit collectives, as collective behavior is not the result of agents’ decisions but is instead predefined and assigned at the initialization stage. However, some loan and food donations strategies combinations could lead to categorize the village into types of kitchens collectives: e.g., the kitchens that are engaged into solidarity (loaning some parcels, donating some food), and those who do not. In this paper, since we aim to reproduce 25 years of strategies observed in Sassem and described by the actors, every kitchen is committed in solidarity practices with the others.
Observation
We observe six dynamics to qualify a simulation:
- the population dynamics
- the remaining intact fallow area dynamics
- the emigration dynamics: the number of people who have to leave the village because of insufficient food
- the village herd size dynamics
- the dynamics of parcels soil quality (aggregated by the median over the parcels)
- the millet yields dynamics (averaged over the kitchens)
These dynamics, as well as their final average or median values provide an assessment of the effects of social and agropastoral practices on the system, particularly on (i) soil fertility, (ii) crops yields and (iii) the village demography, during 25 years.
Details
Initialization: Kitchens
Kitchens are initialized via the definition of their profiles. A profile is the value of the kitchen’s strategic traits described in section 3.14. The number of kitchen of each profile defines a partition used to initialize the model.
Initialization: Parcels
In this paper experiment, we use a synthetic parcels spatial file which is obtained by executing a state of the art algorithm of parcels reshaping: the Oriented Bounding Box algorithm (OBB), implemented in Colomb et al. (2022), and adapted by its author to suit our needs. This process takes two parameters: a Gini coefficient in \([0;1]\), and a number of kitchens (Figure 7).
Initial zone is a triangle divided in three regions (one for each CropZone) in accordance with the traditional crop rotation cycle. Each of these regions are then divided into synthetic parcels and affected to the kitchens. This affectation tries to abide by the given Gini index, calculated on the number of parcels per kitchen distribution. To reach this given Gini index value, a simple gradient descent algorithm is used: at each iteration, the whole zone division into parcels is performed, and the Gini index value updated, until the target value is reached within a given tolerance. In Sassem, observed parcels surface inequality give a Gini index value of 0.2.
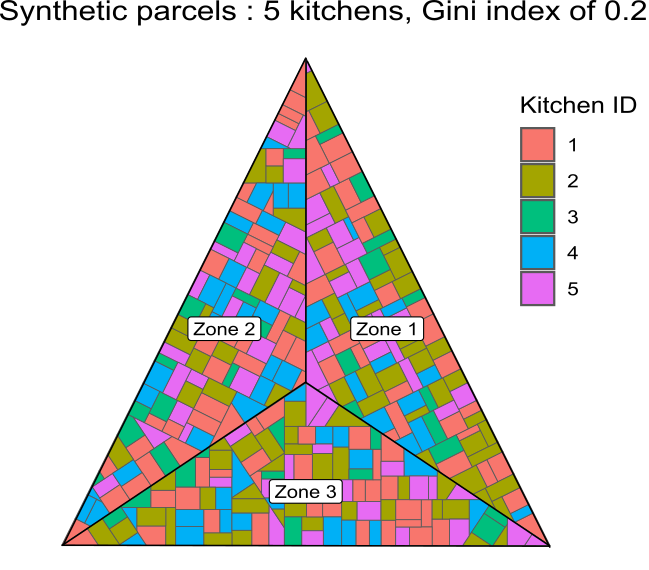
To adapt the parcels to some more vast or smaller lands, the Area_Factor parameter is used, to scale the initial synthetic surface (50 ha) to a desired value. For Sassem territory, the target bushfield surface is 180 ha. Finally, parcels are initialized with a number of Faidherbia trees according to the faidherbiaTressByHa trait of their owner kitchen, and a soil quality (SQ) of 100. Parcels shown in figure 7 are shown as a partition of a three equal zones surface, with neighboring parcels and zones. In the Me Re Diem model, there is no explicit topology of parcels sets, which means that every process and mechanism do not require neither the geographical localization of entities nor adjacency relationship between entities (parcels or owner kitchens) to be performed. The ownership relationships between kitchens and parcels are sufficient for this first version of the model, even if more refined agropastoral policies such as differentiated manuring intensity between parcels could be considered in a next iteration of the modeling process.
Herd. Herd size is initialized by running two years of "blank" simulation, where kitchen population are not updated, for the fallow biomass and the grass of resting land to grow, as well as an initial quantity of millet straw according to the herdSizeStrategy trait of the kitchen owning the parcels where millet is cropped. The number of cows (expressed as TLU: tropical livestock unit) is based on the quantity of annual forage intake by TLU) found in Assouma (2016) and Assouma et al. (2018), which is 1480 kgs of straw by TLU by year.
Input data
The only input data loaded during initialization are the parcels spatial file and the rainfall time series. Theoretically, regarding the spatial file, any collection of surfaces associated with IDs for the cropZone and the owner kitchen could be used as a parcel file, but the model implementation presented in this paper relies on a geopackage (.gpkg) files containing valid polygons, each of which having an ID, an owner ID and a CropZone ID.
Rainfall can be provided either as a single value (i.e., constant rainfall over the years) or as a vector of successive annual rainfall values for the simulated period. Yearly values are expressed in \(mm.m^{-2}\).
| Year | 1995 | 1996 | 1997 | 1998 | 1999 | 2000 | 2001 | 2002 | 2003 | 2004 | 2005 | 2006 | 2007 |
|---|---|---|---|---|---|---|---|---|---|---|---|---|---|
| Rainfall (mm) | 623 | 623 | 404 | 408 | 388 | 729 | 620 | 528 | 394 | 484 | 395 | 635 | 540 |
| Year | 2008 | 2009 | 2010 | 2011 | 2012 | 2013 | 2014 | 2015 | 2016 | 2017 | 2018 | 2019 | 2020 |
| Rainfall (mm) | 526 | 652 | 691 | 720 | 416 | 723 | 536 | 353 | 767 | 527 | 509 | 501 | 501 |
For Sassem, rainfall time series over the study area are extracted from the CHELSA dataset (Karger et al. 2018, 2016). Monthly precipitation values ranges from the year 1979 to 2018. Missing data for the years 2019 and 2020 are drawn from previous years rainfall distribution.
Submodels
We describe here the sub-models applied at each simulation step to capture the annual organization of kitchens in meeting their food requirements.
Compute annual food needs for all kitchens. The annual food needs for a kitchen consist in assigning a daily food need for each member of the kitchen. According to the actors, a daily ration for an adult is \(750g\). To reflect the mean ration according to the kitchen member age, we use the age distribution in Sassem in 2020: 0-4 years old (6% of the population), 5-19 years old (40% of the population) and more than 19 years old (54% of the population). We consider that the youngest do not eat millet, the second category members eat a 50% ration and adults a full quantity. The average daily ration in kilograms of food is thus given by:
| \[ \begin{split} dailyFoodNeeds & = 0.75 \times (0 \times 0.06 + 0.5 \times 0.4 + 0.54) \\ & = 0.555 \end{split}\] | \[(1)\] |
A yearly kitchen food needs \(FN\) is:
| \[ FN = dailyFoodNeeds \times kitchenSize \times 365\] | \[(2)\] |
Switch crop culture on parcels according to a rotation cycle. The model only considers the bush fields agricultural process (hut fields are outside of the model’s scope). Every year, for each parcel, a new crop is chosen to be cultivated, depending on the rotation cycle followed by the farmer’s3 kitchen, that is depicted by the rotationCycle trait. Possible crops are millet, groundnut or fallow. The submodel allows 3-years rotation (Fallow-Millet-Groundnut), 2-years rotation (Millet-Groundnut or Millet-Fallow) or even 1-year cycle (Millet).
Compute food production of kitchen parcels. Once crops are set on each parcel \(p\), their food production \(P\) can be computed as described in Equation 3. In the following, we will detail the calculation for the millet, other crops (groundnut and fallow) follow the same reasoning.
| \[ \begin{split} P^p(millet) = & FPY_{millet}^{p}(r(n)) \times NRF_{millet}(N^{p}(n))\times cropSeedRatio_{millet} \times \\ & SQ^{p}(n) \times sqrf \times area(p) \end{split}\] | \[(3)\] |
The parcel crop yield is estimated by a product of several termsì:
- the millet Full Potential Yield \(FPY\), which is a water-limited yield function depending on \(r(n)\), the rainfall during year \(n\) expressed in millimeters per meters square \(mm.m^{-2}\)
- the Nitrogen Reduction Factor \(NRF\) depicts a ratio, applied to the full potential yield and depending on the available amount of Nitrogen on the parcel \(p\) at year \(n\): \(N^{p}(n)\) (see Equation 7),
- the \(cropSeedRatio_{millet}\) gives the part of grain mass in the whole millet harvested dry mass (straw and grains). Only the seed (grain) mass is considered for food production. For millet, the ratio is 30%.
- the soil quality of parcel \(p\) during year \(n\): \(SQ^{p}(n)\), see section 3.67),
- the parcel area and the soil quality reduction factor \(sqrf\) (see section 3.70).
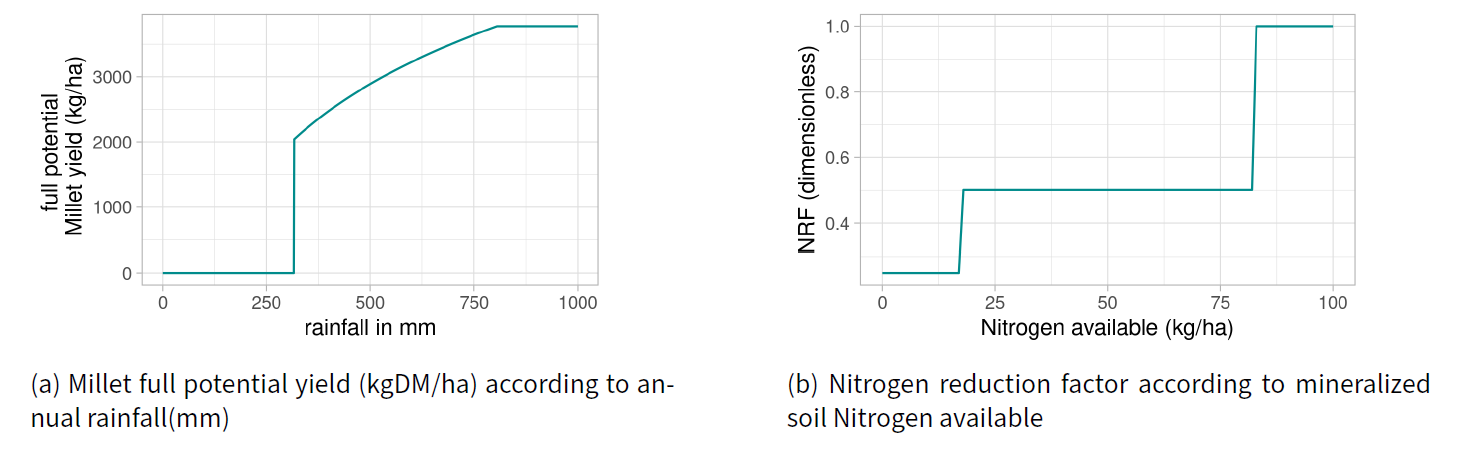
Equation 4 describe the Full Potential Yield of millet(\(FPY\)), according to the annual rainfall in millimeters (\(r(n)\)), that is possible to obtain when water is the only factor limiting its growth. The yield is expressed in kilograms of drymatter per hectare (\(kgDM.ha^{-1}\)), Below 317 mm of rainfall, no millet can grow, and the yield is maximal above 805mm.
| \[ FPY_{millet}(r(n))= \begin{cases} 0.0& \text{if } r(n) < 317 \\ 1860.8\ log(r(n)) - 8675.6 & \text{if } r(n) \in [317 ; 805] \\ 3775 & \text{otherwise} \end{cases}\] | \[(4)\] |
Equation 5 describes the Nitrogen Reduction Factor (NRF), a dimensionless factor (between 0.25 and 1). From the proportion of mineralized nitrogen available in the soil,\(N^p(n)\), it adjusts the growth of plant mass on a plot \(p\) during year \(n\):
| \[ NRF_{millet}(N^{p}(n))= \\ \left\{ \begin{array}{ll} 0.25 \ if \ N^p(n) < 18\\ 0.501 \ if \ 18 \leq N^p(n) \leq 83 \\ 1 \ otherwise \end{array} \right\}\] | \[(5)\] |
These two last equations are taken from Grillot et al. (2018), who in turn obtained the equations from a crop growth simulation model calibrated on empirical Sahelian data: CELSIUS (Ricome et al. 2017). Corresponding curves can be seen in Figure 8.
Carry out parcel loans from kitchen to kitchen. Once the food needs \(FN(k,n)\) and food production \(P(k,n)\) are computed for a given kitchen \(k\) during year \(n\), the food balance \(FB(k,n)\) can be computed.
| \[FB(k,n) = P(k, n) - FN(k,n)\] | \[(6)\] |
All the kitchens with a positive food balance are called in surplus and those with a negative food balance are called in deficit. The kitchen in deficit try to borrow parcels from kitchen in surplus to balance they annual needs. This loans assignment process is iterated until depletion either of loanable parcels or depletion of in deficit kitchens (i.e., every kitchen is balanced), as described in the following algorithm:
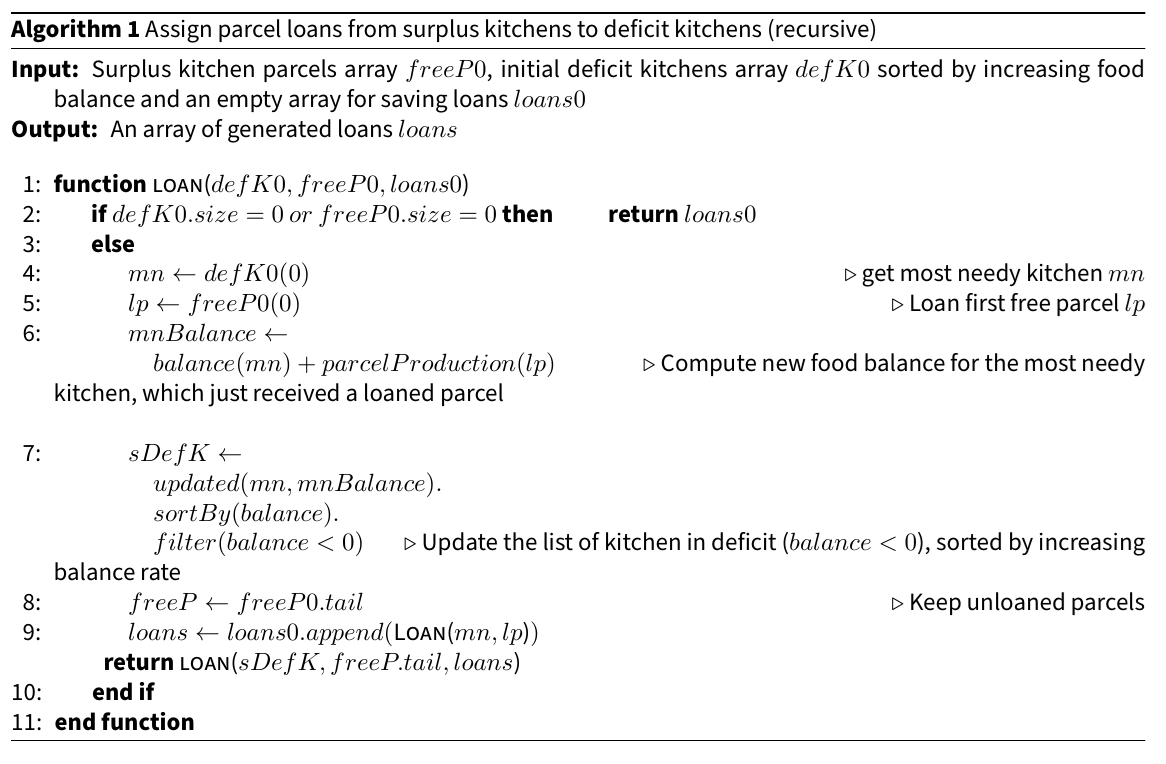
Carry out food donation from kitchen to kitchen. After the loan process, some households may remain in deficit, because their needs cannot be offset by the additional harvests from the loaned plots. Other households may remain in surplus even after having loaned some plots. This latter case is quite rare. In these cases, kitchens use a second solidarity process to fine-tune the food balance: food donations. This involves a kitchen to give its surplus of millet harvest to a household in deficit, up to the amount of its unmet food-needs.
The algorithm is quite similar to the parcel loans Algorithm 1. We recursively transfer food from kitchen in surplus to kitchen in deficit, starting in each loop by the most needy kitchen.
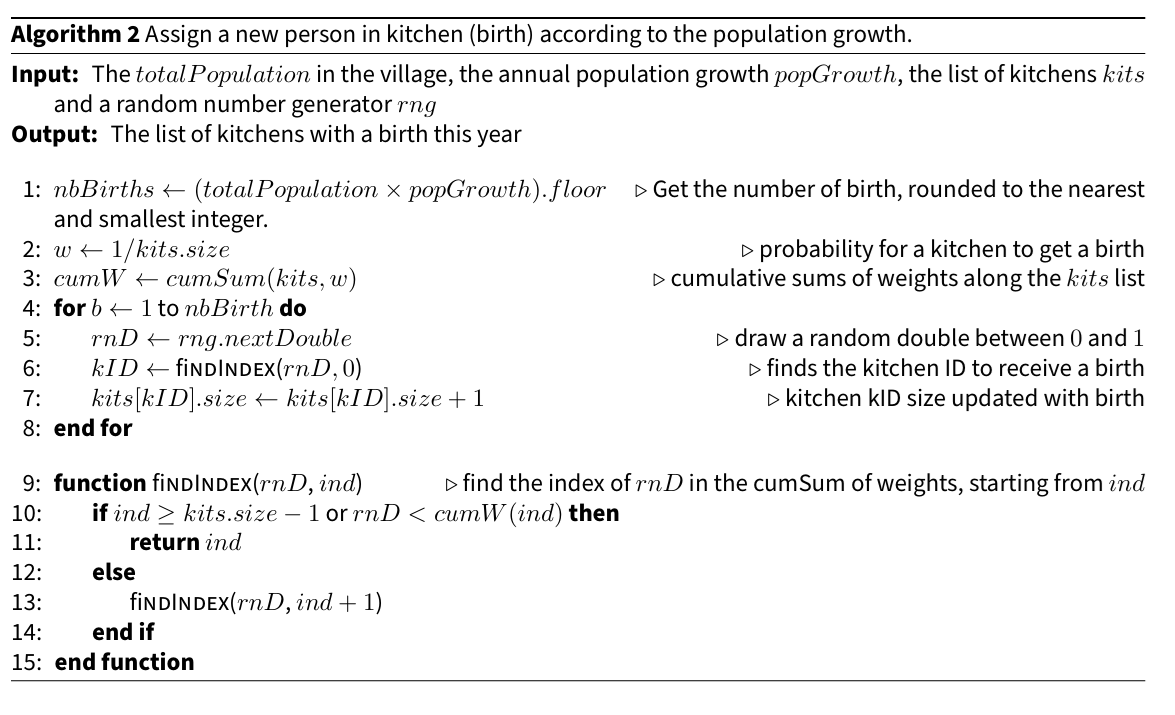
Grow the kitchen sizes according to population growth. The demographic evolution is driven by the populationGrowth parameter. We do not consider births and deaths explicitly, but only the actual births each year, i.e the resulting number of necessary births to fit the population growth without processing any deaths. Births are affected to kitchens by a random choice, weighted by the kitchens sizes (weighted roulette process): the bigger the kitchen, the more chance it has to see its size increased by one, as depicted in Algorithm 2.
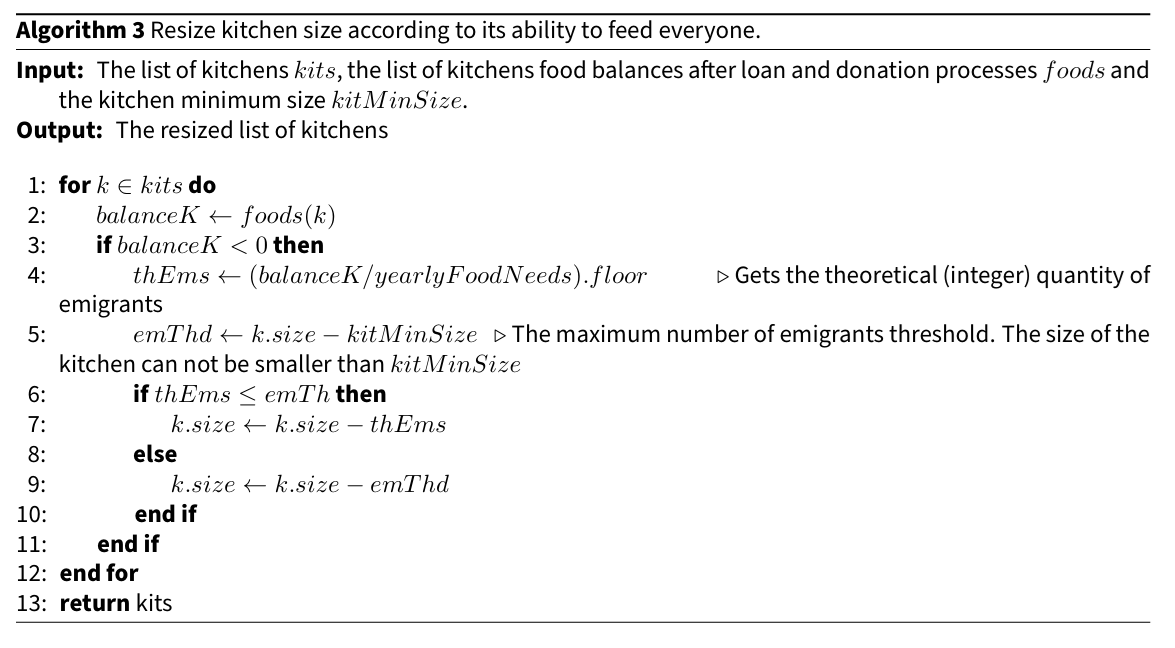
Adjust the kitchen sizes according to available food (emigration). Each kitchen keeps the people it is able to feed. If a kitchen’s food production is insufficient (in deficit), even after loan and donation processes, its size is shrunk until it fits the amount of available food, as described in Algorithm 3. People in excess (who cannot be fed) leave the simulation. They are considered to migrate to a near city where they find a job and regularly send money to their original kitchen. These donations of money are outside the scope of the model.
Process too small kitchens absorption. When there are too many departures from a kitchen (due to insufficient food), the kitchen becomes too small to keep on functioning independently. It is then absorbed by a larger kitchen. Care must be taken during this absorption to ensure that the absorbing kitchen does not reach a critical size beyond which it must split immediately (see next sub-model Algorithm 5).
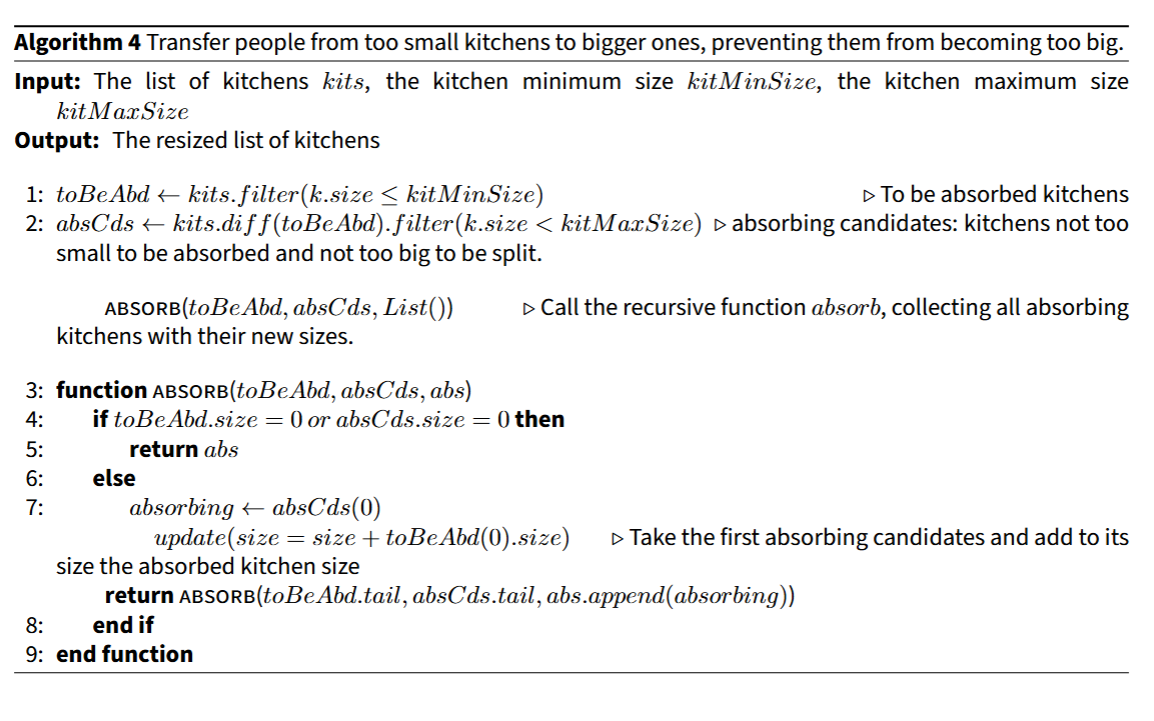
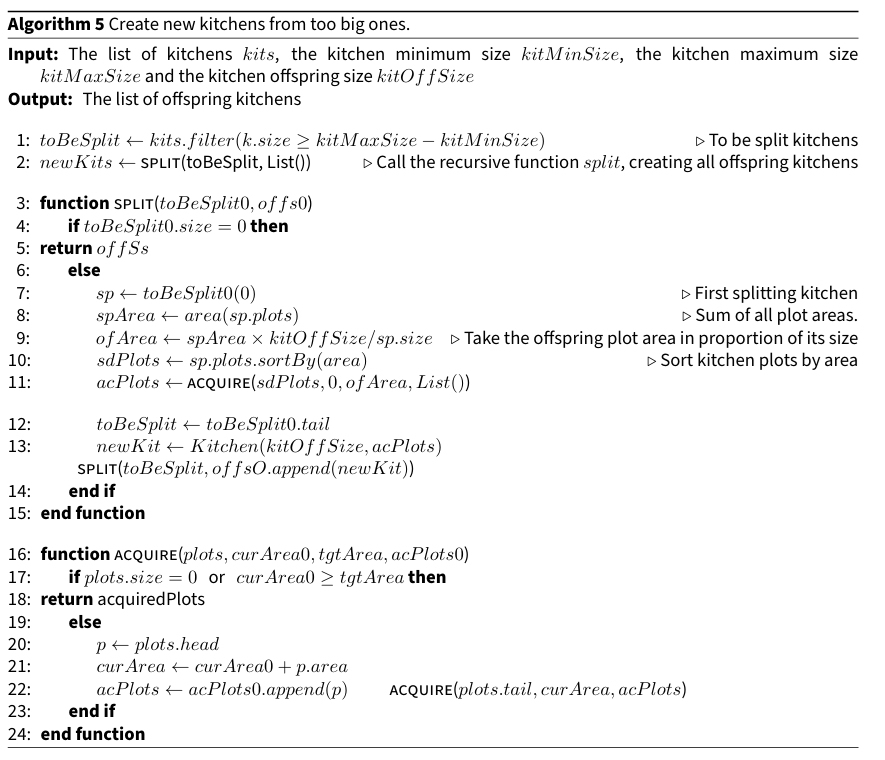
Process too big kitchens splits. The kitchens size does not increase indefinitely. At some point, the households that are part of the kitchen (often young couples recently married) need to become independent and leave the kitchen to build up a new and smaller one. That is what we call a \(split\). In the model, if a kitchen reach a critical threshold, a split is triggered.
Update nitrogen amount in parcels. Every year, the amount of nitrogen in each parcels is calculated. It is the sum of four nitrogen sources: from air, soil,herd manure and faidherbia trees.
| \[ \begin{aligned} &N^{p}(n) = N^{p}_{air}(n) + N^{p}_{soil}(n) + N^{p}_{man}(n, n-1) + N^{p}_{faid}(n) \\ &\text{with:}\\ & N^{p}_{air}(n) = 12 kg.ha^{-1} ~ \text{nitrogen fixed from the atmosphere} \\ &N^{p}_{soil}(n) =\begin{cases} 20 \, \text{kg.ha}^{-1}, & \text{if groundnut year } n-1, \\ 7.5 \, \text{kg.ha}^{-1}, & \text{otherwise.} \end{cases}\\ & N^{p}_{man}(n, n-1) = 23.8 \, \text{kg.ha}^{-1}, \begin{cases} \text{60% if year } n-1, \\ \text{40% year } n \\text{otherwise.} \end{cases}\\ & N^{p}_{faid}(n) = 4kg.tree^{-1} \\ \end{aligned}\] | \[(7)\] |
Update soil quality in parcels. Every year the quality of the soil \(SQ\) of each plot is calculated. What we call soil quality is its capacity to grow plants thanks to its structural assets. In the model, this soil quality is increased by fallowing or mulching and is degraded every year by constant erosion. The two \(boost^{p}\) terms allows us to incorporate the beneficial impacts of mulching (using crop residues like straws) and fallow practices on parcel \(p\). The dimensionless parameters will be calibrated during model tuning (c.f. Table 5).
| \[SQ^{p}_{res}(n) = SQ_{res}(n-1) \times (1 - erosion)\] | \[(8)\] |
| \[ SQ^{p}(n) = SQ^{p}_{res}(n) + boost^{p}_{cropResidue}(n) + boost^{p}_{fallow}(n)\] | \[(9)\] |
Calibration: Reproducing 25 years of demographic and agronomic dynamics
This section presents the calibration method used to adjust the model parameters so that it can reproduce 25 years of demographic and agronomic dynamics in a satisfying way. We distinguish between state variables, based on stakeholder knowledge, and technical variables, which are uncertain and must be calibrated. During calibration, only technical variables are adjusted to minimize discrepancies between model outputs and observed data, using defined fitness functions. This process ensures the model’s behavior aligns with reality before running scenario-based simulations.
State variables and technical variables
The states variables described in the State Variables section are variables that can be tuned from one simulation to another either to reproduce the system behavior as described by actors or to test different alternative configurations. Some other variables, that we call here technical variables should not remain free while simulating. At the calibration time however, they are still variable because it exists an uncertainty about their precise empirical value. Adjusting these variables lead to the model adjustment itself, i.e. its capacity to reproduce an expected behavior (modeled by some fitness function). The adjustment stage is referred to model calibration.
| Modeling stage | States Variable | Technical variables |
|---|---|---|
| Calibration | fixed | free |
| Simulation | free | fixed |
Technical variables to be fitted
Soil quality (SQ). In the model, we introduce the soil quality SQ. It represents a certain ability of the soil to grow plants. It does not include the famous NPK trio (Nitrogen, Phosphorus, Potassium). The SQ potential starts at 100 at the beginning of the simulation and then varies according to positive mechanisms, called boosts, and negative ones.
fallowBoost represents a positive contribution of the fallow to the soil structure, essentially by limiting its erosion, and favoring long term fertility. This mechanism is not well documented; at most, we know that its direct impact is low. Its contribution to the \(SQ\) evolution is described in Equation 9.
erosion is the deterioration of the soil quality over time. As the \(fallowBoost\) parameter, we have little information about its value, that it is why it has to be calibrated.
sqrf (Soil Quality Reduction Factor). The \(SQ\) base 100 is convenient to observe the evolution of the quality over time. However it is inconsistent with the \(NRF\) quantities. That’s why we introduce this pure technical parameter to fit \(SQ\) and \(NRF\).
populationGrowth is the increase of population over time, in percent.
peanutSeedToFood represents the price ratio between groundnut and rice over time. Groundnut is sold to buy food, especially rice, used for lunch meals. As this quantity varies considerably over time, we prefer to obtain a calibrated value.
Fitness functions
We define two fitness functions4 based both on what stakeholders described to characterize Sassem agropastoral system and demographic data obtained from (Delaunay et al. 2018). These patterns are described in the Patterns section of the ODD description.
The \(popFit\) function merges i) the distance between the simulated final population and the data, ii) the quality of fit between the simulated population time series and the observational data population time series through the \(R^{2}\) and iii) the difference between real population slope and simulated one. These three quantities are then summed and normalized to 1.
| \[\begin{split} popFit = ( & \lvert 5.67 - populationSlope \rvert + \\ & \lvert 488 - lastPopulation \rvert + \\ & \lvert 1 - populationRSquare \rvert ) / 3 \end{split}\] | \[(10)\] |
The demographic data comes from Delaunay & Adjamagbo (2018) and are listed in Table 3.
| Year | 1995 | 1996 | 1997 | 1998 | 1999 | 2000 | 2001 | 2002 | 2003 | 2004 | 2005 | 2006 | 2007 |
|---|---|---|---|---|---|---|---|---|---|---|---|---|---|
| Population | 358 | 371 | 384 | 378 | 368 | 370 | 363 | 386 | 408 | 409 | 411 | 411 | 402 |
| Year | 2008 | 2009 | 2010 | 2011 | 2012 | 2013 | 2014 | 2015 | 2016 | 2017 | 2018 | 2019 | 2020 |
| Population | 417 | 434 | 455 | 450 | 460 | 477 | 468 | 467 | 466 | 475 | 487 | 492 | 488 |
The \(agroFit\) function merges agricultural goals. The first one concerns the fallow preservation over time. Odru (2013) measured 60% of conserved fallow in 2012. Current amount of preserved fallow in 2020 is estimated around 40%. The calibration algorithm will consider a null fitness (the best one) for a preserved fallow between 55% and 65% for 2012 (the exact distance otherwise) and a null distance for a preserved fallow between 35% and 45% for 2020. This results in a "band-pass filter" effect on solutions: solutions within the yield acceptance range will be considered equally good. Finally we target a mil yield around \(700kg.ha^{-1}\), as stakeholders said.
| \[\begin{split} agroFit & = ( \\ & \text{if} ~ 0.55 \leq ef_{2012} \leq 0.65 ~ \text{then} ~ 0 ~ \text{else} ~\lvert 0.6 - ef_{2012} \rvert \\ & \text{if} ~ 0.35 \leq ef_{2020} \leq 0.45 ~ \text{then} ~ 0~ \text{else} ~\lvert 0.4 - ef_{2020} \rvert \\ & \text{if} ~ 665 \leq milYield \leq 735 ~ \text{then} ~ 0~ \text{else} ~\lvert 700 - milYield \rvert \\ & ) / 3 \end{split}\] | \[(11)\] |
With \(ef_{2012}\) (respectively \(ef_{2020}\)) the effective fallow intact proportion in 2012 (resp. 2020) and \(milYield\) the median millet yield (in \(kg.ha^{-1}\)) of every parcel cropped with millet during the 25 simulated years.
Calibration tool. We use the automatic calibration tool of the OpenMOLE (Reuillon et al. 2013) exploration model software, based on the NSGA II evolutionary algorithm (Deb et al. 2002). This method automatically searches for the best free parameters combinations that minimizes the fitness functions and delegates the computation load on a distributed computation architecture. It also takes stochasticity into account natively, so that the model replications are automatically done. The implementation of the model has been thought so that the exploration experiences are easy to achieve. In particular, we made sure that the code was quick to execute (\(0.5s < executionTime < 1s\)), so that we can calibrate the model in few hours on 100 cores.
Calibration outcome: The Pareto front
The multi-objectives calibration method employed delivers a set of solutions, called "front", which is the set of approximate5 Pareto optimal solutions front. Pareto-optimality implies that there is no way, for a solution \(s\) of the Pareto-front, to increase the performance of \(s\) regarding one of the criteria (for example here \(popFit\)) without degrading one of the other criteria (here; \(agroFit\)).
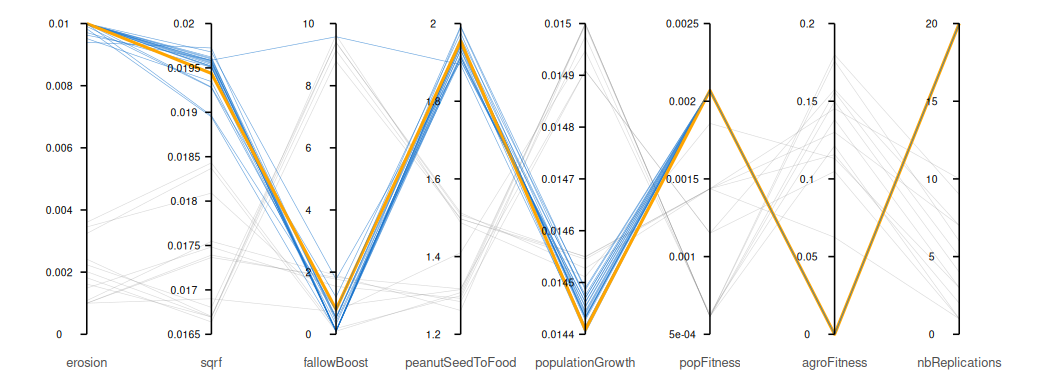
At this stage, picking a solution randomly in the Pareto front would be correct: the fitness values are low for the two calibration objectives. Concerning the population fitness value, this can be explained by the fact that \(populationGrowth\) is tunable, so it is fairly easy to find solutions that result in a population trend that fits the one of the demographic data. The cluster of sufficiently replicated solutions is fairly dense around fairly similar values for all the variables (blue lines in the parallel plot of Figure 9, low replications solutions are light grey). As all the other observable metrics show no significant differences from one solution to another, we decide to choose a intermediate solution (number 20 in Table 4, orange line in the plot of Figure 9).
| erosion | sqrf | fallowBoost | peanutSeedToFood | populationGrowth | popFitness | agroFitness | |
|---|---|---|---|---|---|---|---|
| 1 | 0.01000 | 0.01962 | 0.13196 | 1.95262 | 0.01447 | 0.00207 | 0.00000 |
| 2 | 0.00991 | 0.01928 | 0.51796 | 1.96365 | 0.01449 | 0.00207 | 0.00000 |
| 3 | 0.00999 | 0.01958 | 0.10000 | 1.93177 | 0.01440 | 0.00207 | 0.00000 |
| 4 | 0.00963 | 0.01959 | 9.57449 | 1.89393 | 0.01441 | 0.00207 | 0.00000 |
| 5 | 0.01000 | 0.01952 | 0.10000 | 1.95217 | 0.01443 | 0.00207 | 0.00000 |
| 6 | 0.00939 | 0.01972 | 0.41218 | 1.90597 | 0.01446 | 0.00207 | 0.00000 |
| 7 | 0.00983 | 0.01895 | 0.10000 | 1.99073 | 0.01447 | 0.00207 | 0.00000 |
| 8 | 0.00971 | 0.01951 | 0.10000 | 1.93105 | 0.01448 | 0.00207 | 0.00000 |
| 9 | 0.01000 | 0.01954 | 0.11672 | 1.94229 | 0.01444 | 0.00207 | 0.00000 |
| 10 | 0.01000 | 0.01958 | 0.10000 | 1.94724 | 0.01443 | 0.00207 | 0.00000 |
| 11 | 0.01000 | 0.01951 | 0.10000 | 1.92001 | 0.01444 | 0.00207 | 0.00000 |
| 12 | 0.01000 | 0.01960 | 0.55192 | 1.95092 | 0.01443 | 0.00207 | 0.00000 |
| 13 | 0.01000 | 0.01945 | 0.10000 | 1.95372 | 0.01443 | 0.00207 | 0.00000 |
| 14 | 0.01000 | 0.01957 | 0.10495 | 1.94036 | 0.01442 | 0.00207 | 0.00000 |
| 15 | 0.01000 | 0.01955 | 0.50522 | 1.94718 | 0.01441 | 0.00207 | 0.00000 |
| 16 | 0.00999 | 0.01952 | 0.10000 | 1.95265 | 0.01443 | 0.00207 | 0.00000 |
| 17 | 0.01000 | 0.01968 | 1.77343 | 1.90369 | 0.01446 | 0.00207 | 0.00000 |
| 18 | 0.01000 | 0.01956 | 0.53817 | 1.91376 | 0.01445 | 0.00207 | 0.00000 |
| 19 | 0.01000 | 0.01928 | 1.19476 | 1.97587 | 0.01444 | 0.00207 | 0.00000 |
| 20 | 0.01000 | 0.01944 | 0.80187 | 1.95482 | 0.01441 | 0.00207 | 0.00000 |
| 21 | 0.01000 | 0.01896 | 0.76761 | 1.99319 | 0.01449 | 0.00207 | 0.00000 |
| 22 | 0.01000 | 0.01961 | 0.10064 | 1.91284 | 0.01445 | 0.00207 | 0.00000 |
| 23 | 0.00952 | 0.01935 | 0.32260 | 1.91453 | 0.01445 | 0.00207 | 0.00000 |
Post calibration
A second calibration step has to be carried out to fit the cropResidue boost term (the mulching positive contribution to the soil quality \(SQ\)). Indeed, in Bationo et al. (1993) the experimental protocol available concerning the increase of millet yield due to the crop residue practices implies that all the other technical parameters are set. This protocol describes an increasing of the millet yield by 40% from one year to another, compared to the control (i.e. same crop culture, no NPK addition, same rainfall). To fit the cropResidueBoost parameter, we run simulations over 2 years. No crop residue is used during the first year. The crop residue mechanism is activated the second year, exactly in the same experimental conditions. We then tune the \(cropResidueBoost\), so that the increase of millet yield from one year to another is 1.4.
The results is presented in Table 5. Values in themselves are hard to interpret since it operates on a rather abstract value : the soil quality \(SQ\). We can note that the yield increase of 40% for which it has been tuned is also consistent with the ratio between the increased \(SQ\) with the cropResidueBoost and its initial basis value: 100 \((140 / 100)\).
| cropResidueBoost | yield Y1 | yield Y2 | Gain |
|---|---|---|---|
| 39 | 302.39 | 422.58 | 1.392 |
| 40 | 302.39 | 428.68.83 | 1.397 |
| 41 | 302.39 | 428.79 | 1.412 |
Results
Calibrated model dynamics
Once the model is calibrated, we can observe some different metrics of interest in the context of the actor description, i.e. with the calibrated values for technical values and the implemented values in the village on the 1995-2020 period for states variables.
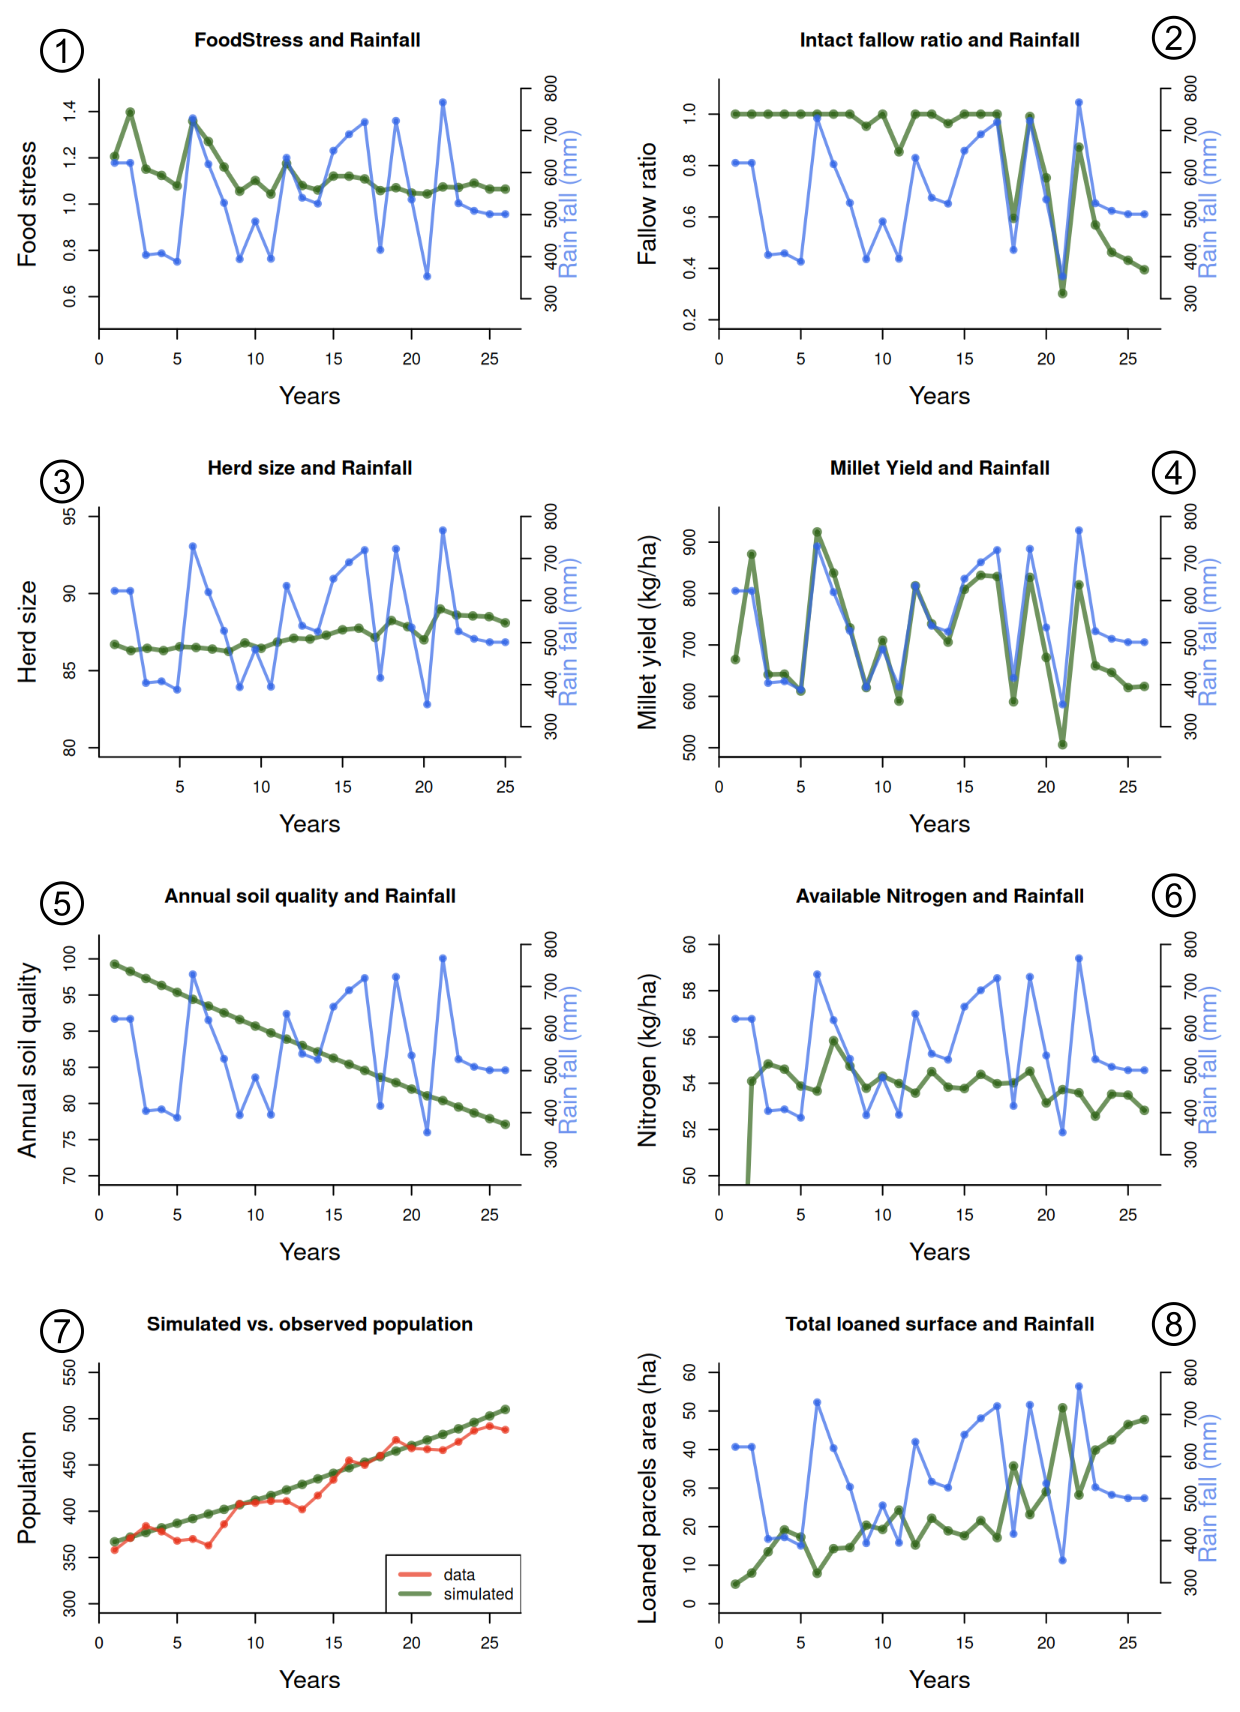
The population (plot 7, Figure 10) over 25 years is constantly increasing, in line with the observed data (\(R^{2} > 0.99\)). The food stress (equation 12 and plot 1) varies in the same time as the rain stress for 15 years, then it remains close to 1. Indeed, during the first period of time, the abundance of fields (proportionally to the population size) make it possible to absorb climatic shocks, which is no longer possible thereafter. Based on the same explanations (tension over the availability of plots after 15 years), the remaining fallow (plot 2 Figure 10) is trimmed when rainfall decreases, because the millet yields are lower. The use of the fallow helps to absorb shocks. The herd size (plot 3 Figure 10) varies little over time, which indicates that the herd can feed sufficiently well on fallow land. The millet yield (plot 4, Figure 10) is strongly correlated with the amount of rainfall. This is also due to the relatively stable production of nitrogen in the fields. (plot 6 Figure 10). Indeed the main three sources of nitrogen remain constant enough: i) the manure is stable because the livestock remains stable enough, ii) the number of faidherbia does not evolve during the simulation and iii) the groundnut plots are preserved and thus their nitrogen production. The soil quality (plot 6 Figure 10) constantly decreases, due to the repetition of cropping on parcel soil, and the fallow effect on it being insufficient to compensate its erosion (there is no mulching in the simulation). As the soil quality decreases, the gap between millet yield and rainfall marginally increases over the years and millet yield stay below rainfall from 10 years until the end of the 25 years, that we could interpret as a slow and subtle general decay of fertility. The proportion of loaned parcels (plot 8, Figure 10) is higher when the rainfall decreases. It also increases as the available fallow land decreases.
| \[foodStress(k,n) = \frac{food_{crops}(k,n) + food_{loan}(k,n) + food_{donation}(k,n)}{food_{needs}(k,n)} \] | \[(12)\] |
Prospective: Bifurcations after 25 years
One of the aims of this model, over and above its ability to reproduce past dynamics, is to show how changes in socio-agricultural practices can have an impact on the various metrics of interest (yields, conservation of fallow land, population).
For this purpose, we introduce bifurcations in the course of simulations. Simulation now last for a longer period of 50 years. The first 25 simulated years are a common prior to every bifurcation experiment, during which the model is tuned to the technical parameter values found during calibration. The next 25 years are simulated with a change in the value of a single mechanism, every other things being kept equal.
The Table 6 presents a selection of bifurcations.
| Mechanism | First 25 years | Last 25 years |
|---|---|---|
| Solidarity | Plot loans and food donation | Neither plot loans nor food donation |
| Rainfall \(mm\) | Real data | Constant: 645 (+ 100mm vs 25 first year average ) |
| Faidherbia \(nb.ha^{-1}\) | 4 | 6 |
| Herd size | LSU = 0.42 | Maximum capacity |
| Herd size | LSU = 0.42 | LSU = 0.525 (+25%) |
| Crop rotation | Fallow-Millet-Groundhut | Millet-Groundhut |
| Mulching | No mulching | Crop residue left on the ground |
| Grazing strategy | EverywhereByDayOwnerByNight | AnywhereAnyTime |
| Fallow use in own crops | Not allowed | Allowed |
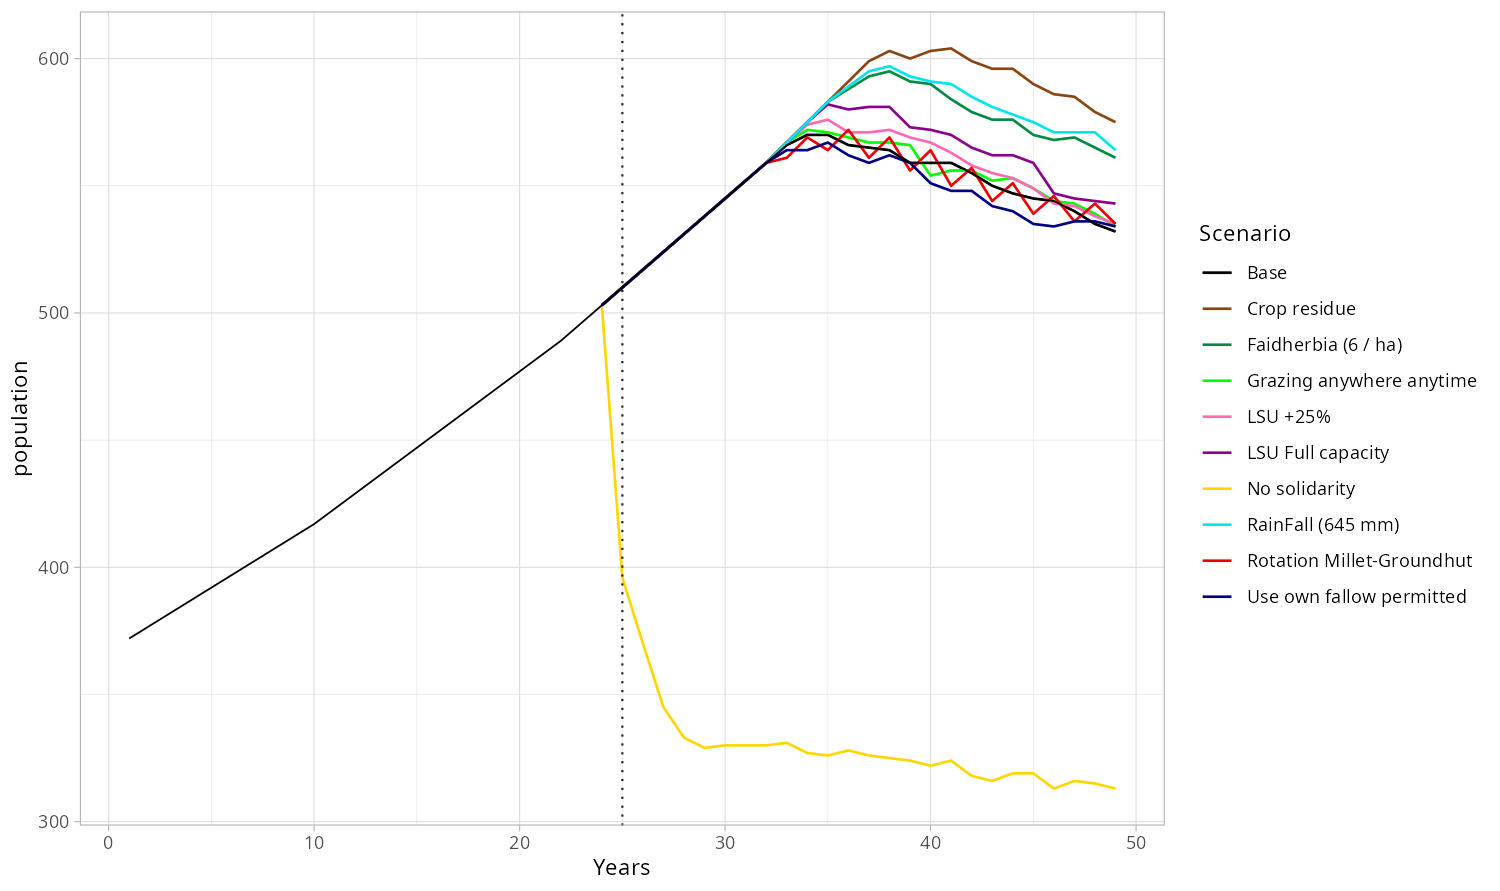
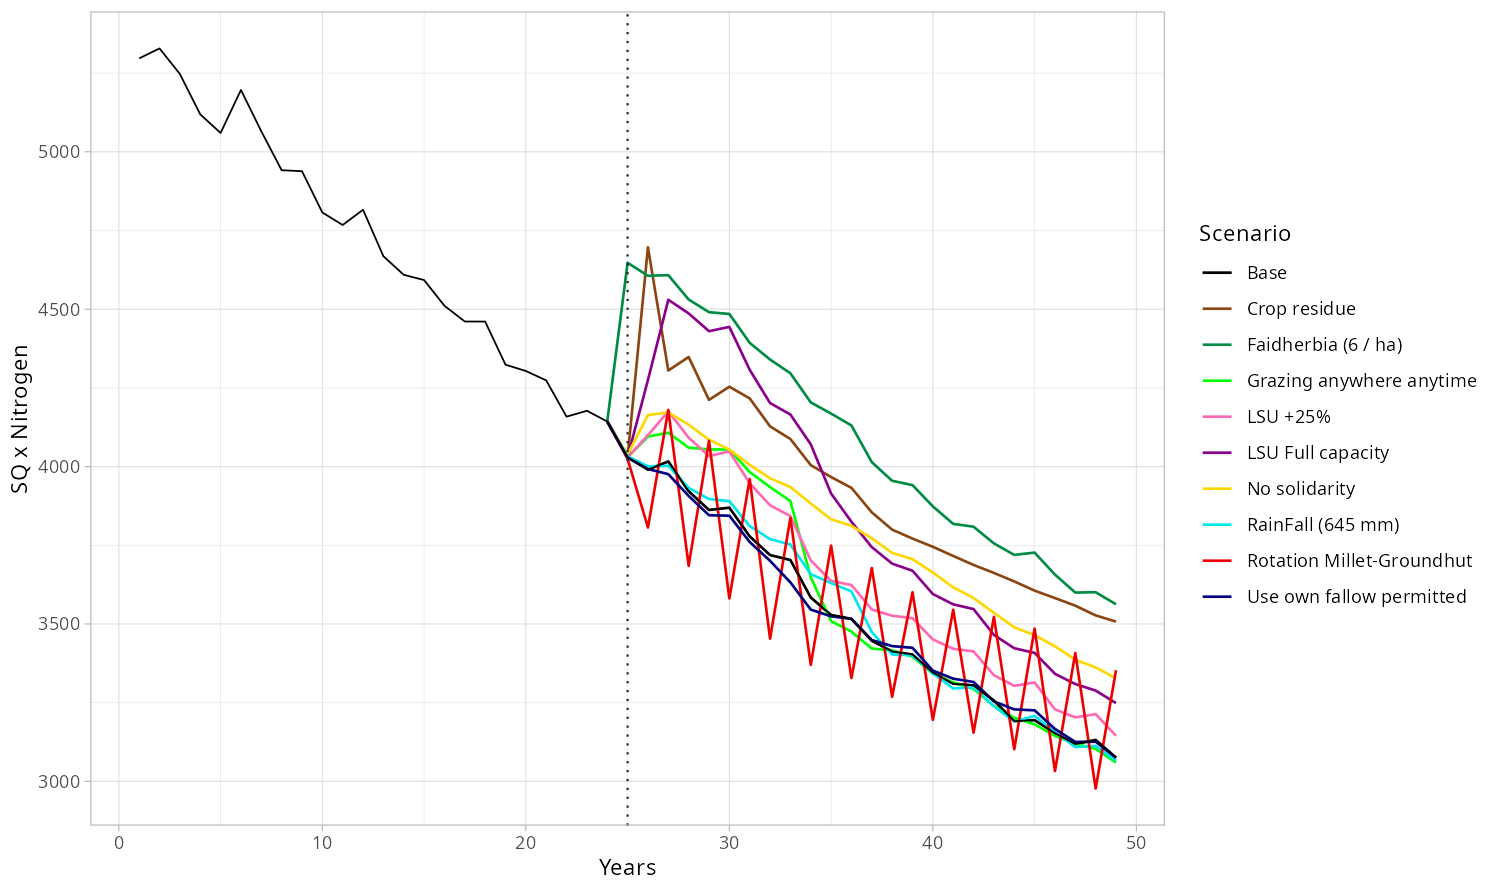
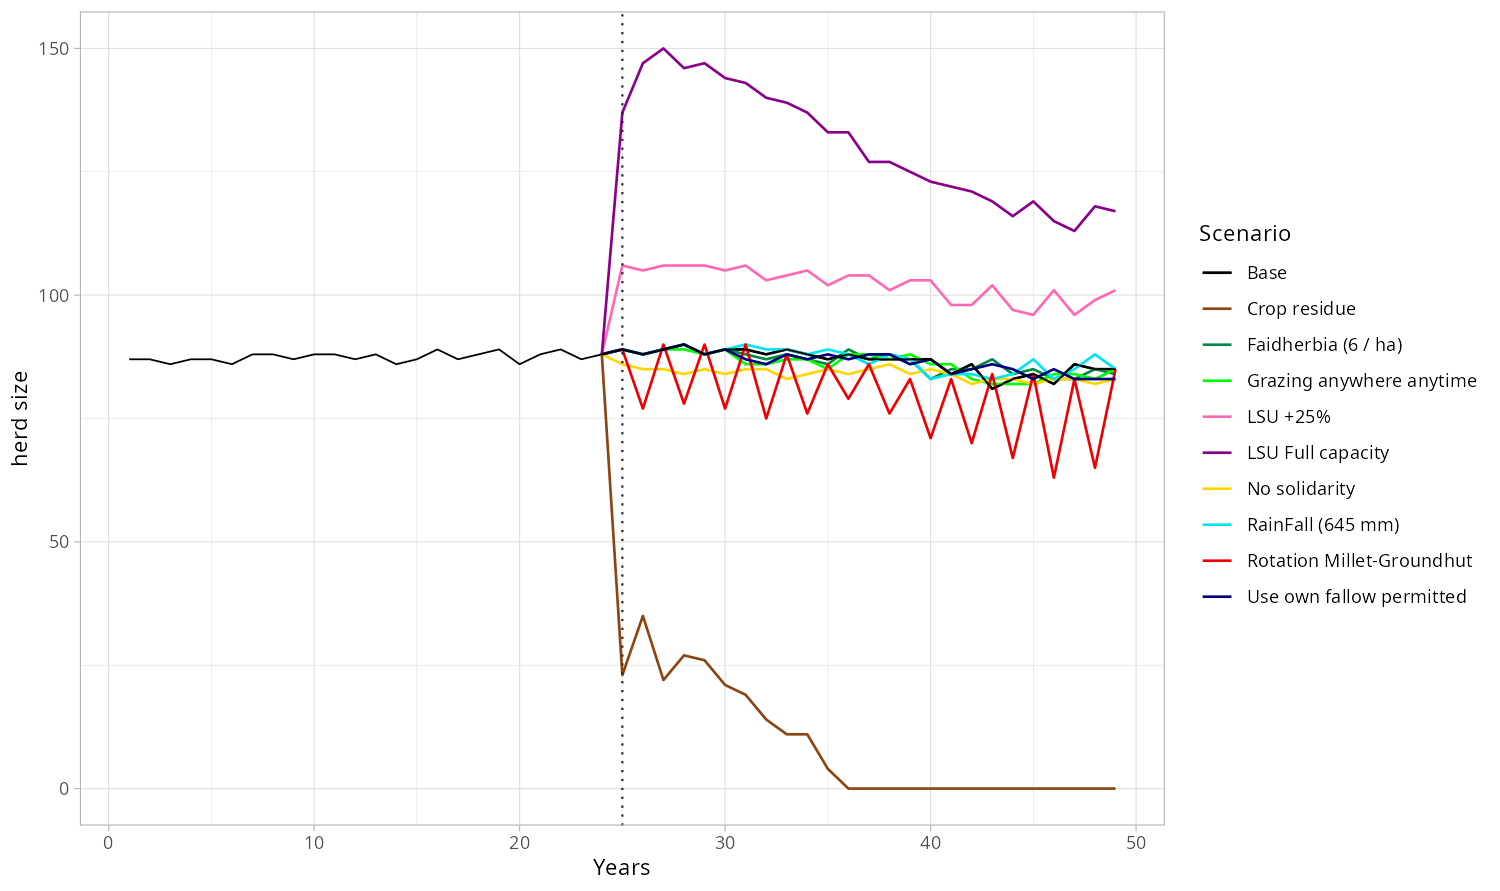
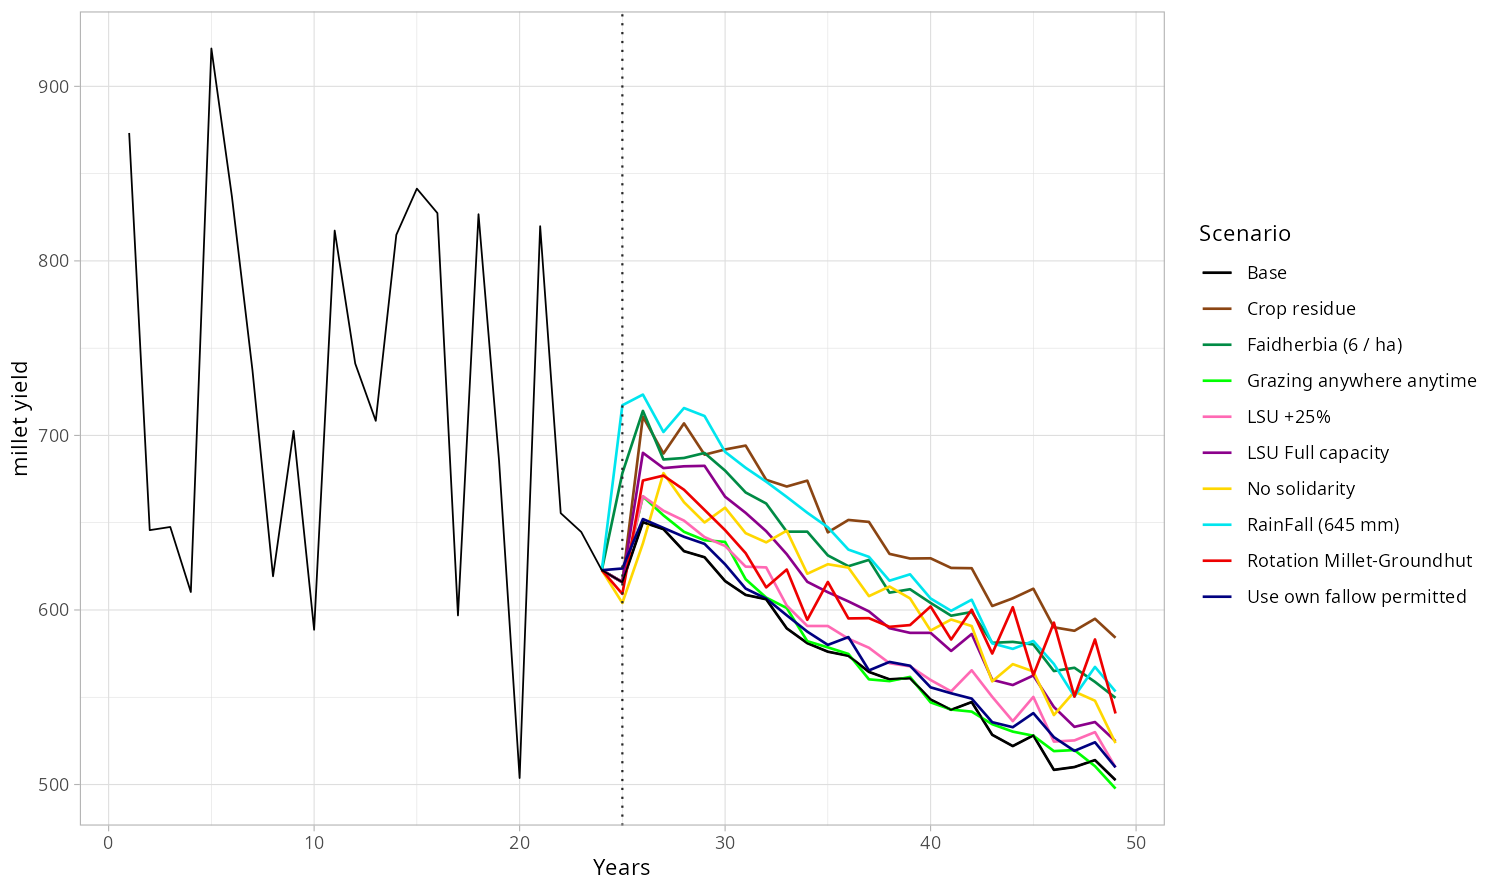
We present in Figures 11 to 15 below the dynamics obtained for population, effective fallow, herd size, millet yield and SQxNitrogen. The later represents the product of two quantities that favour high yields. Indeed, some mechanisms increase the soil quality \(SQ\), while others increase the amount of nitrogen in the soil. The rainfall used in the first 25 years is the real data (as in the calibration process), we use then a constant rainfall equals to the average over the first 25 years (545 mm), except for the special bifurcation where the rainfall change is tested (+100 mm = 645 mm).
The Solidarity bifurcation shows clearly that without lending of polts and food donation, the village collapses (Figure 12) (the population drops dramatically) since a lot of kitchens cannot face the constraints: unfavorable positioning of their parcels in the rotation cycle (few plots oriented towards millet), lack of water or both, and thus lose kitchen members. Abandoning solidarity practices would mean the death of the village.
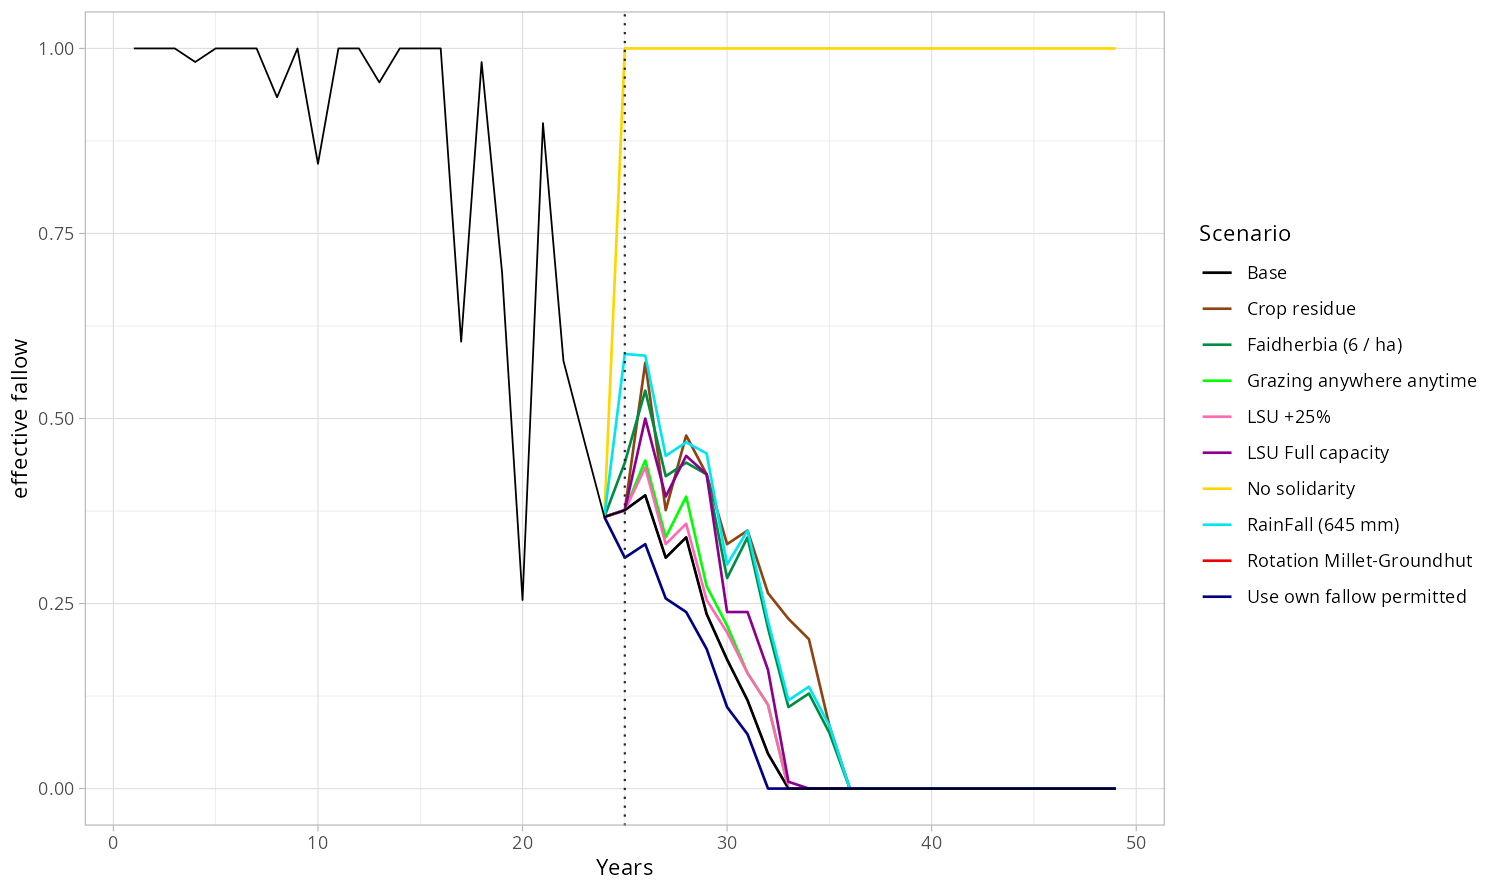
The Rainfall bifurcation is purely theoretical because people have no control over the amount of precipitation but it provides a baseline, a reference that is easily understandable. Although the use of fallow parcels gradually declines, it remains higher than in other scenarios, due to better and more consistent millet yields (even if still declining) resulting from higher and more stable rainfall (Figure 15). The remaining intact fallow proportion decreases later than the other trajectories, see Figure 11. This strengthens the rainfall as one of the main driver of the village agricultural subsistence upkeep.
The Faidherbia bifurcation (from 4 trees by hectare to 6) leads to an increase of Nitrogen in soil. It is the best switch option to get a more fertile soil (Figure 13). In terms of millet yield (Figure 15), two more Faidherbia by hectare has an effect equivalent to +100mm of annual rainfall. The more Faidherbia is added, the greater the millet yield is.
The increase of the Herd size (whatever the proportion) leads temporarily to a more fertile soil (Figure 13) before it meets decreases again, due to the progressive trimming of the fallow proportion Figure 11 and thus to the trimming of a part of the herd food source. In other words, the limitation of lands limits in turn the herd, whose manure is a nitrogen source for the soil.
Moving to a two-year Crop rotation means a low capacity to handle livestock (Figure 14) since the fallow disappears in this system. It leads to a lower fertile soil (cf. Figure 13) and thus to lower millet yields 15 that will limit the sustainable population (see Figure 12) over time.
The introduction of the use of Crop residue for mulching leads to a dramatic decrease of the livestock (Figure 14) since a significant part of their food is now used to "feed" the ground instead of the cattle. However, it results in an improvement of soil fertility (Figure 13) and thus of the millet yield (Figure 12). It is even the best long-term option in terms of yield and thus in terms of population.
The switch of Grazing strategy does not produce any spectacular changes. The SQ \(\times\) Nitrogen quantity in Figure 13 is quite low and does not help to delay the fallow loss (c.f. Figure 11).
Allowing the Fallow use in own crops leads to a decrease of soil fertility (Figure 13). The reason is that the use of fallow land is favored to the detriment of loans of parcels from surplus kitchens. Moreover, the only way for a parcel to have its soil quality erosion partially compensated is to "rest" for a year in fallow, during which the biomass of the grass cover and bushes favor structure and humidity of the soil, compared to naked, post-harvest soil.
Although not all of these bifurcations are plausible or even doable, and our confidence in the simulation results must be relativized, as in any simulation experiment, we claim that this bifurcation approach allows us to show to the farmers and agro-pastoralists the effects of changes in their practices, compare their respective isolated effects, even if they are not realistic, and gain supplementary insights in the model behavior understanding, guiding us toward a co-designed validation as well (cf. the Discussion section).
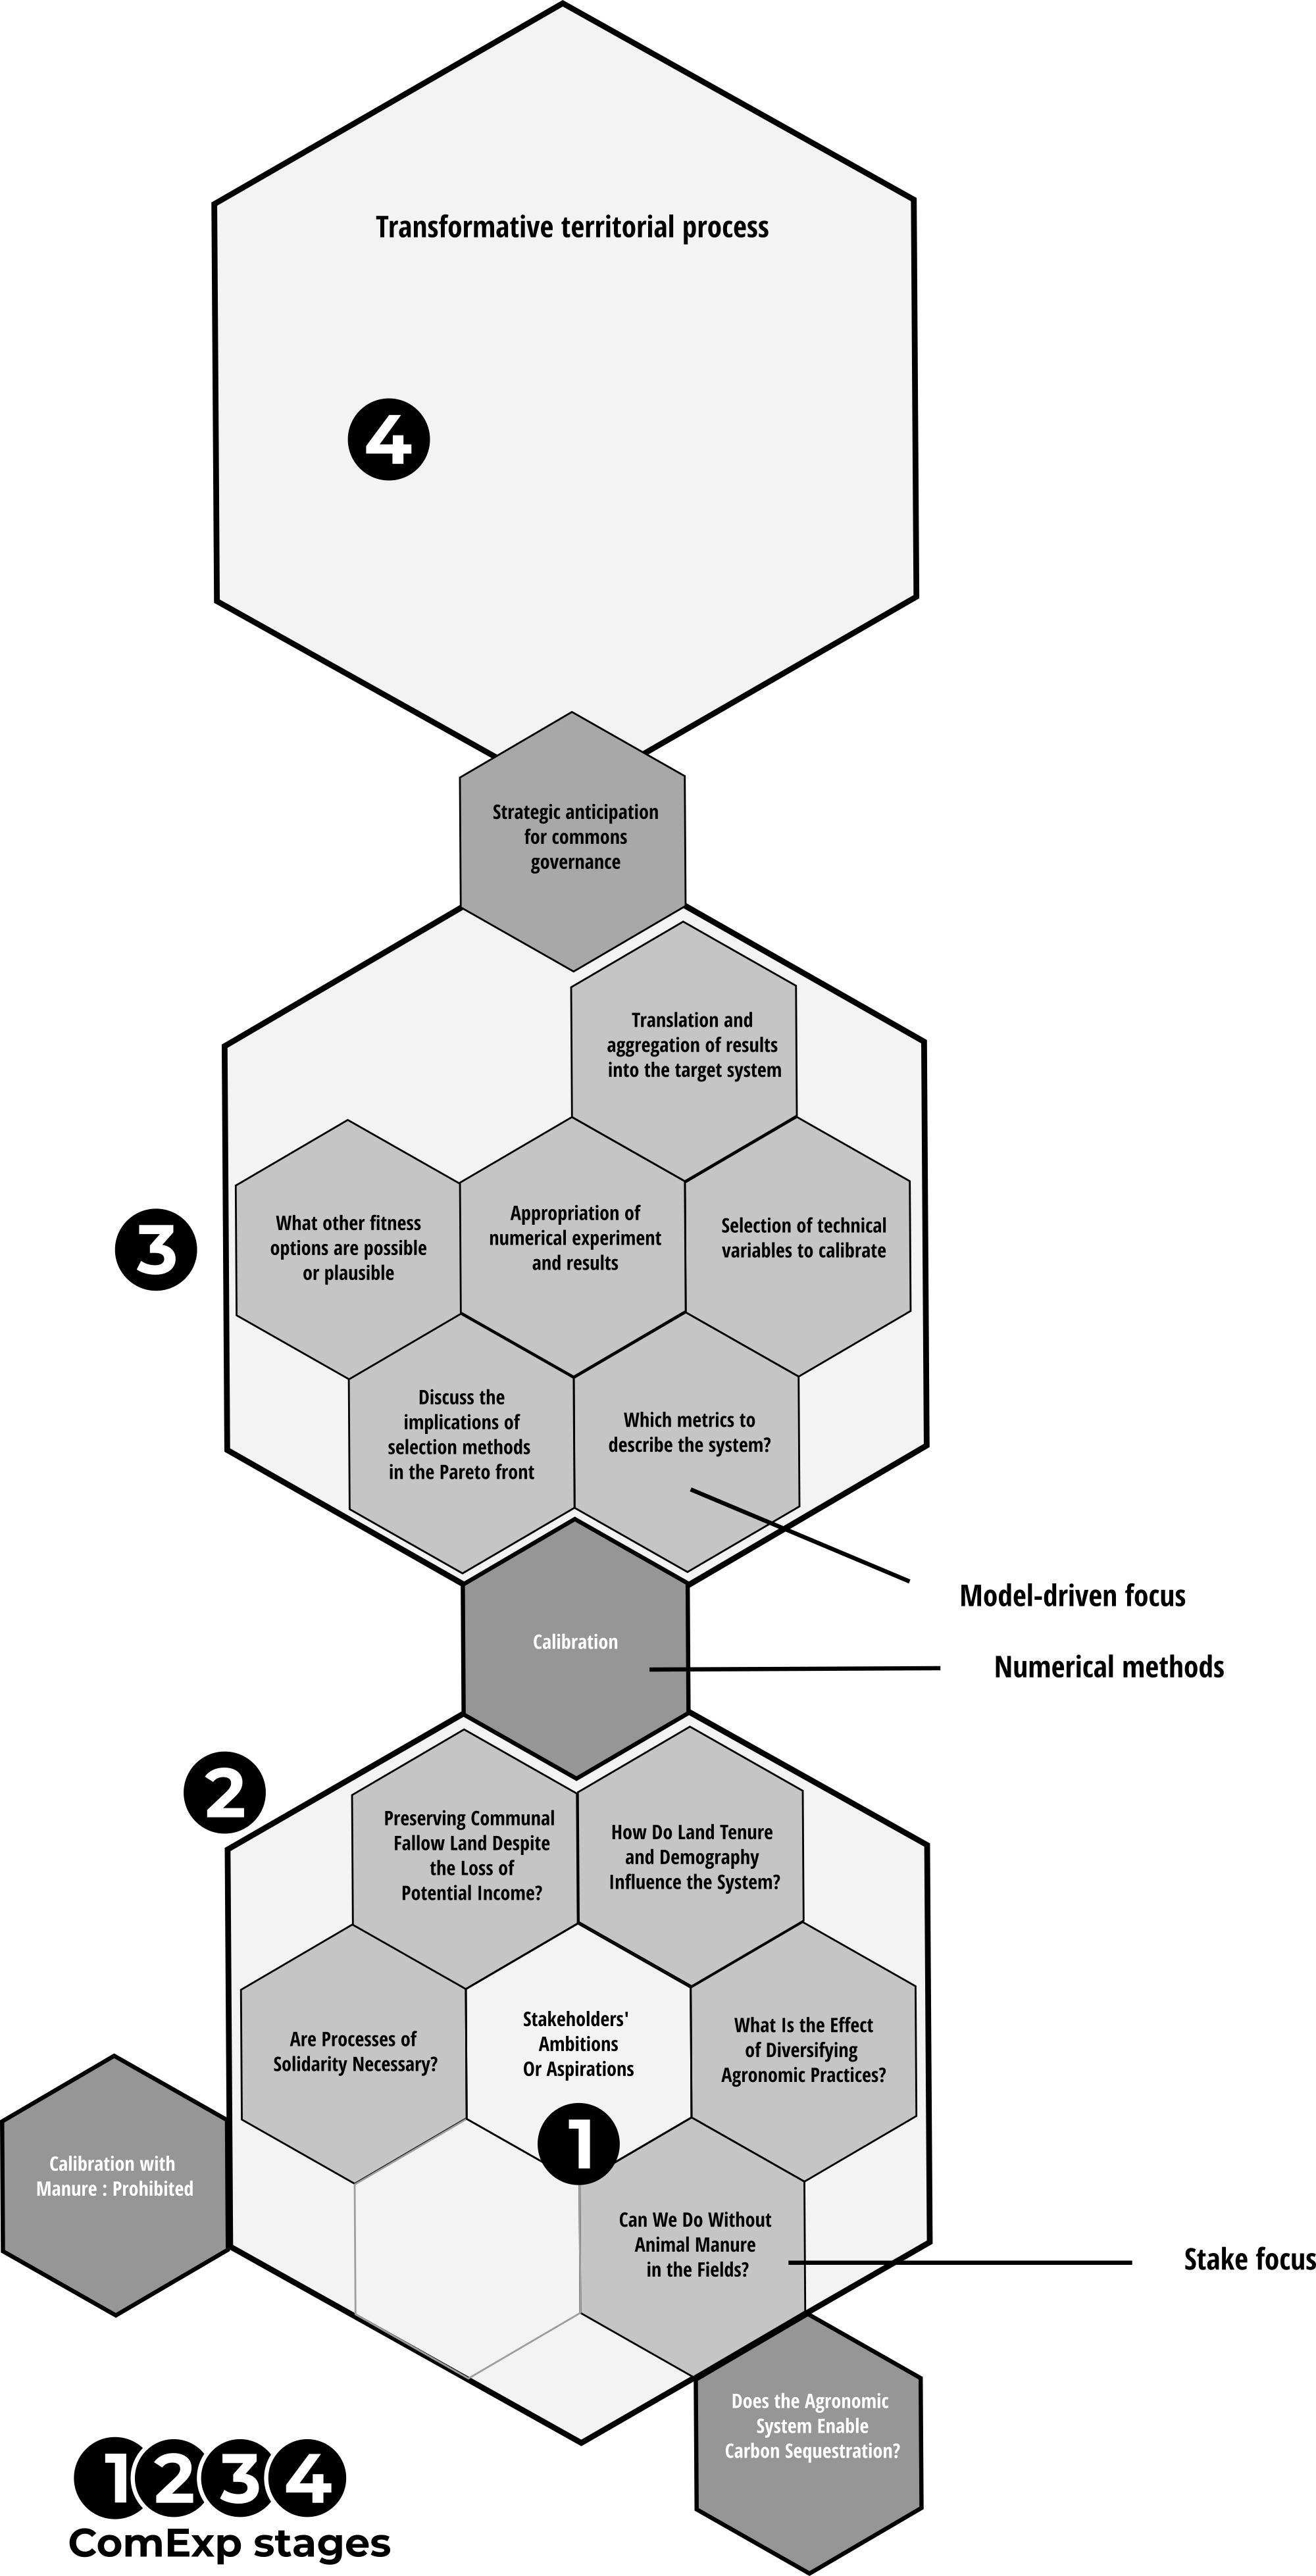
Steering the course: A narrative of our model construction
As previously mentioned, we began by considering the aspirations expressed by the participants (stage 1, Figure 16). Based on one of these aspirations, we worked with them to define sub-models, each serving as a ‘targeted focus’ necessary to address their aspiration (stage 2, Figure 16). It can be argued that ComMod approaches, which utilize participatory simulation, generally operate within this scope to achieve territorial transformation objectives (stage 4).
We introduced calibration as a hinge: calibration opens up a new dimension in participatory simulation.
This allowed us to reverse the relationship between the model and the real world, thereby shifting the role of the enunciator. In stage 2, the actors contribute to the model by incorporating their knowledge grounded in local realities. In stage 3, the model generates questions that the actors are encouraged to address. Thus, it is no longer the participants who articulate these questions, but the model itself, prompting the participants to position themselves in relation to these model-driven exploratory questions.
The introduction of stage 3 Figure 16 centers around the actors’ appropriation of the numerical results and their ability to engage in an iterative process of translation between what the model produces and what can be implemented in the real world within the context of territorial transformation processes. The transition between blocks stage 3 and 4 involves equipping the collective with anticipatory capacities (as a hinge just like calibration), from which the identification of transformative processes will emerge.
Discussion
Because land tenure issues and soil fertility in the groundhut basin are excellent examples of wicked problems (Rittel & Webber 1973; Roberts 2001), we adopted a post-normal science approach (Funtowicz & Ravetz 1993). The process of co-designing the model with farmers, herders, agronomists, and soil scientists resulted in a model that was legitimate for each group. It became a true boundary object (Star & Griesemer 1989), serving as a common reference point between the local population and researchers, enabling cooperation without requiring each group to give up its own objectives or methods.
The co-design process was extended by defining, with the stakeholders, stylized facts that the model was intended to reproduce. By calibrating the model according to the perspectives of both local actors and agronomists and soil scientists, we achieved a form of model validation that addresses the challenges identified by Edmonds et al. (2019), which we consider extremely robust and founded. This validation not only aids researchers and local actors in understanding the surrounding mechanisms through a systemic approach but also fosters mutual understanding. The three objectives identified in the Purpose – section – social learning, description, and explanations – allowed us to achieve another form of validation that is also more grounded (Bommel 2009 p. 23) (likelihood).
Because the model had to be developed with care (tact in french), it can genuinely serve to initiate a "socio-technical" compromise, aimed at i) refining the plausibility of the different solutions on the Pareto front, and ii) collectively determining the future development choices for the village and their operational modalities.
Calibration and anticipation, balancing the possible and the probable
The results of the strict calibration process (Figure 16) show that the set of mechanisms, although parsimonious, is sufficient to reproduce dynamics that are relevant for the actors involved. This parsimony helps maintain a simple model while capturing the essential aspects of the observed phenomena. The co-construction process of the model, validated throughout its development, turns it into a key element in the discussion arena (Callon 2013). Through calibration, the model gains legitimacy and ability to structure debates among stakeholders. Once this status is established, it becomes possible to explore different configurations, notably by loosening some of the parameters carefully adjusted during calibration. This allows the model to be used as a reflexive tool to support collective thinking, helping actors to think differently and explore new dynamics (Banos 2010). In our case, this involved the farmers, but Saltelli et al. (2020) appeals to the decision-makers to do the same.
From a methodological perspective, Companion Modeling (ComMod) and Companion Exploration (ComExp) (Delay et al. 2020; Delay, Broutin, et al. 2025) require a deep understanding by all involved actors of the stakes surrounding calibration, as it represents the fundamental link between the objectives (a well-identified portion of the model outputs space) and the technical parameters (inputs). Calibration involves adjusting these parameters so that the model’s results align with the expectations of the various stakeholders. This process leads to a collective reflection on the very notion of fitness: which indicators are we aiming to reproduce? What margins of error are we willing to accept in order to explore alternatives? These fundamental questions must be redefined for each new calibration, as they influence the model’s dynamics and its capacity to meet the needs of the stakeholders.
At this point, the concepts behind a Pareto front are discussed, exposing the possible trade-offs between conflicting objectives. The debate over these selection criteria reflects the priorities of the actors and allows for the expansion or restriction of the range of possible solutions, depending on the compromises they are willing to make. This methodological step is therefore essential to ensure that the model remains relevant and usable in various contexts, while maintaining transparency around the decisions taken during the calibration process.
The social solidarity: The backbone of this agro-pastoral system
An analysis of the bifurcations results (Figures 11 to 15) reveals that disruptions in different dimensions of the model affect the system in distinct ways. For instance, outputs such as crop yields (Figure 15) and nitrogen levels (Figure 13) remain confined within a narrow trajectory or "tube", showing limited divergence across scenarios.
On the contrary, significant variations emerge in livestock dynamics (Figure 14) and population trends (Figure 12). A key empirical finding is that removing social solidarity mechanisms from the agro-pastoral system of the village of Diohine causes the model to diverge sharply, particularly in terms of fallow land management and population stability. These results highlight the critical role of social practices in sustaining the resilience and overall balance of the agro-pastoral system. Without these mechanisms, the system’s stability collapses, underscoring the central importance of social solidarity in this context.
While economists frequently examine the role of social solidarity on systems (Che 2019; Mullings & Otuomagie 2023), its impact on agronomic systems is not as systematically explored. Some elements are detailed in D’Aquino & Bah (2013), who explore techniques for supporting modelling with stakeholders in West Africa, as well as in key critical social science sources (Benoit 1988; Gautier & Benjaminsen 2012; Linton & Delay 2018; Swyngedouw 2015; Weber & Bailly 1993).
To follow the current trajectory – where the fallow, that slow time of soil and commons, is dissolved under the acid of economic liberalization – is to risk a cascade of unmaking. In Diohine, the bifurcation figures (Figures 11 to 15) do not simply quantify; they tell stories of relational collapse. When social solidarity – and its spatial manifestation as mutual aid (Springer 2016) – is unthreaded from the fabric of the agro-pastoral system, it is not merely a social parameter that disappears. What unravels is the ability to hold land through care, to sustain inter-generational alignment, and to live within a fabric of resilience. The loss of the collective fallow lands is not a technical adjustment – it is a symptom of a deeper dis-articulation, where responsibilities once distributed across kin, commons, and cattle become isolated in entrepreneurial selves increasingly subjected to market logics. In this context, the models are not predictive; they are speculative companions – warning, gesturing, calling.
For policymakers, the temptation to read such models as repositories of optimized decisions must be resisted. The figures neither dictate solutions nor flatten political stakes; they whisper, instead, of precarious balances and partial inheritances. If solidarity mechanisms are shown here to anchor the system, then the shift toward land individualization (such as future land tenure reforms) is not a benign evolution – it is a dangerous experiment with the very conditions of rural continuity. These findings do not produce policy recommendations in the classical sense; they invite a reframing of what counts as viable. They make audible the slow violences that accrue when rural worlds are pressured to conform to entrepreneurial futures, rather than supported in their ecological and social co-compositions. To hear this is to acknowledge that resilience is not a technical output but a collective achievement, fragile and negotiated, always at risk of being forgotten by those who govern from afar.
Companion modeling requires "care" (tact in French)
The notion of "care" (tact in French; Stengers (2022 p. 489)) allows for discussing the status of the model and the challenge of balancing "scientific obligations" with a moral duty to answer the stakeholders’ questions.
The modeler, caught in a bind, should not rely entirely on his model, not because it is false or irrelevant, but because its relevance is not known beforehand. The model’s objectivity and operational value are tied to the specific problem it seeks to explore, but this does not imply that it can directly yield solutions. Instead, it raises questions about how the solution is constructed, with what ingredients, and through what means. The solution is ultimately co-desinged by the stakeholders and the system itself, understood in a Foucauldian sense as a dispositif encompassing both human and non-human actors (Foucault et al. 1977). This heterogeneous assemblage, through the iterations of the companion modeling process, gradually aligns around a shared narrative that helps stakeholders identify possible future solutions (Hertz & Bousquet 2025).
Therefore, tact represents an obligation that limits the power of modelers, who may believe they fully understand the problem. Tact means taking account of changes in the demands made by stakeholders. The traits selected to represent the target system – here, the socio-ecological dynamics of fertility in Sassem – must aim for a form of provisional stability, co-constructed with the actors involved. This stabilization is not about simplifying reality, but about crafting a shared ground from which trust can emerge and dialogue can take place. The modeler’s task is thus a delicate one: they must proceed with tact, avoiding the imposition of an external framework that might alienate stakeholders, while still abstracting the system just enough to make the initial question intelligible and addressable. The tension lies precisely here – between fidelity to the richness of the real and the need for operational stylization. The model must become a ‘reliable witness,’ capable of both representing and provoking, without closing down the plurality of possible interpretations.
Thanks to this participatory modelling approach, we identified the needs of local stakeholders. We helped them to use scientific modelling tools to reach a mutual understanding of the stakes. As modelers, we avoided providing solutions to the problem of communal fallows (in the conventional sense of decision support). We collectively attempted to identify the implications that some "solutions" would have for them (Delay, Broutin, et al. 2025).
Conclusion
In conclusion, the co-construction and exploration process outlined in this study has followed a careful and structured approach, deeply rooted in participatory and companion modeling approach. Beginning with the identification of stakeholder aspirations and concerns, the process has advanced through iterative cycles of model development, validation, and calibration. The calibration phase, in particular, acted as a critical step in linking the technical parameters of the model to the objectives and expectations of the participants. This collective effort not only refined the model, but also fostered a deeper understanding among the stakeholders regarding the trade-offs and compromises involved.
A significant portion of the preliminary work leading to the results focused on calibrating the model. It involves identifying combinations of parameters that best reproduce observed behaviors, which is critical for validating and extending the scope of the model. This process ensures that the model can be used in a reliable and effective manner, while remaining cautious and tactful about the validity and interpretation of its results.
In this study, calibration enabled the identification of technical parameters that would have been otherwise inaccessible. These parameters, while non-existent as measurable physical quantities, capture issues that are essential to the stakeholders. For instance, soil quality and its degradation in the model represent one of the main challenges perceived by stakeholders regarding land fertility and the impact of agricultural practices on it. Incorporating such parameters reflects the nuanced approach modelers must adopt to work within this heterogeneous environment.
The calibration process proved to be relatively efficient due to the model’s rapid execution. This facilitated frequent iterations between the calibrated model and modifications to its underlying mechanisms. This iterative process provided a dual benefit: (i) refining the model and increasing the rigor of calibration objectives, particularly by formalizing and organizing knowledge about the model’s output space in collaboration with stakeholders; and (ii) testing and validating the model’s mechanisms by pushing them to their limits, thereby strengthening their relevance.
The results indicate that, for outputs such as nitrogen yield, the modeled trajectories remain clustered within a single "tube", with minimal bifurcations. In contrast, significant divergences appear in dynamics related to livestock and social aspects. A key empirical observation of this study is that, all other mechanisms being equal, removing solidarity practices from the model results in systemic collapse. Thus, these practices are pivotal for maintaining the resilience and overall viability of the system.
However, this solidarity – and the commons in which it is embedded – is often perceived by policymakers as suboptimal, inefficient, or even backward. Seen through the lens of productivity and economic rationalization, these collective practices tend to be dismissed as obstacles to modernization (Hamant 2022). As a result, current policy efforts increasingly aim to "optimize" rural agricultural systems through reforms that promote individual land tenure, entrepreneurial farming models, and market integration. Yet, our findings suggest that such reforms, if they fail to recognize the constitutive role of social solidarity, risk undermining the very foundations that sustain resilience in agro-pastoral contexts like Diohine. What appears inefficient from a policy perspective may in fact be essential to the reproduction of ecological and social stability.
Acknowledgements
Thanks to the Diohine multi-stakeholder group for their time, efforts, patience and hospitality (the renown senegalese «teranga»), especially: Marie-Hélène Ndjira Diouf, Aissatou Faye, Robert Diatte, Assane Diouf, Marcel Diouf, Idrissa Faye, Joseph Sene, Paul Sene, Ameth Paul Thiaw. This work is part of the research and development project DSCATT (Dynamics of Carbon Sequestration in Soils of Tropical and Temperate Agricultural Systems, https://dscatt.net), co-financed by Agropolis Fondation (reference ID 1802-001, through the "Investissements d’avenir" program Labex Agro ANR-10-LABX-0001-01 as part of I-SITE MUSE ANR-16-IDEX-0006) and by the TOTAL Energies Foundation. For this work, we exclusively used open-source software to ensure transparency, reproducibility, and accessibility of our results. The model was fully implemented in Scala, a functional and object-oriented programming language. The model exploration was conducted using OpenMOLE (Reuillon et al. 2013), an open-source platform designed for the exploration of models in a distributed environment. Finally, the figures and visualizations presented in this work were produced using R, a statistical software widely used in the scientific community for its extensibility and flexibility.Notes
- The name "kitchen" is the closest to the Serrer idiom commonly used, which could be roughly translated as "the people who eat together".↩︎
- Only the cattle staying in the village is considered. Transhumant cattle herds is outside the scope of the model.↩︎
- In case of a loaned parcel, the rotation cycle is the one of the farmer, to whom the parcel is loaned, not the parcel owner’s↩︎
- Genetic algorithms generates a large pool of candidate solutions, that are evaluated via fitness functions. These function are used during the elitism stage of genetic algorithm, where candidates solutions are ranked according to how well they perform regarding the desired optimization criteria. In our case it comes down to as minimizing the distance to population data, yield and fallow intact proportions. These fitness function will guide the genetic algorithm toward optimal solutions.↩︎
- Solutions are in fact as good as the NSGA II algorithm performs, and Pareto-optimality cannot be guaranteed if there is no analytical solution to the optimization problem↩︎
Appendix A: Class Diagram
Figure 17 shows a simplified class diagram of the Me Re Diem model.
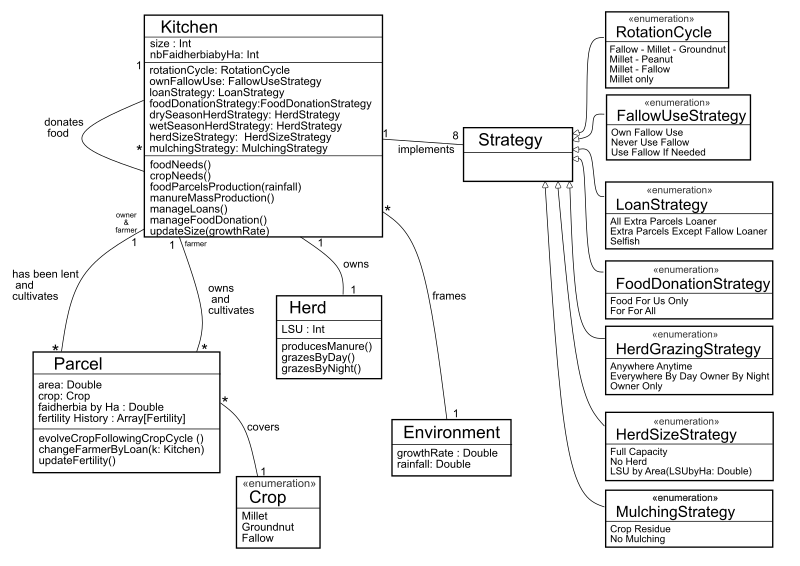
Appendix B: ComSES Code Repository
The code of the model used in this study has been uploaded to ComSES network and can be retrieved here: https://www.comses.net/codebases/d4183b6b-de60-4536-95c8-3d1cab537235/releases/1.0.1/
References
AFFHOLDER, F., Sultan, B., Kouakou, P., Poeydebat, C., & Muller, B. (2015). Yield gap and the shares of climate and crop management in yield and yield variability of staple crops in West Africa. UNESCO, Our Common Future under Climate Change. International scientific conference Abstract Book 7-10 July 2015, Paris, France.
ASSOUMA, M. H. (2016). Approche écosystémique du bilan des gaz à effet de serre d’un territoire sylvo-pastoral sahélien: Contribution de l’élevage. AgroParisTech, Paris, PhD Thesis.
ASSOUMA, M. H., Lecomte, P., Hiernaux, P., Ickowicz, A., Corniaux, C., Decruyenaere, V., Diarra, A. R., & Vayssières, J. (2018). How to better account for livestock diversity and fodder seasonality in assessing the fodder intake of livestock grazing semi-arid sub-Saharan Africa rangelands. Livestock Science, 216, 16–23. [doi:10.1016/j.livsci.2018.07.002]
AUDOUIN, E. (2014). Comparaison de deux terroire en terme de flux de biomasse et de bilan d’azote en vue de proposer des voies d’intensification écologique. Purpan, PhD Thesis, Toulouse.
AUDOUIN, E., Vayssières, J., Odru, M., Masse, D., Dorégo, S., Delaunay, V., & Lecomte, P. (2015). Réintroduire l’élevage pour accroître la durabilité des terroirs villageois d’Afrique de l’Ouest: Le cas du bassin arachidier au Sénégal. In B. Sultan, R. Lalou, M. Amadou Sanni, A. Oumarou, & M. A. Soumaré (Eds.), Les Sociétés Rurales Face aux Changements Climatiques et Environnementaux en Afrique de l’Ouest (pp. 403–427). Marseille: IRD Éditions. [doi:10.4000/books.irdeditions.9843]
BANOS, A. (2010). La simulation à base d’agents en sciences sociales: Une "béquille pour l’esprit humain"? Nouvelles Perspectives en Sciences Sociales: Revue Internationale de Systémique Complexe et d’études Relationnelles, 5(2), 91–100. [doi:10.7202/044078ar]
BARRETEAU, O., Antona, M., D’Aquino, P., Aubert, S., Boissau, S., Bousquet, F., Daré, W., Etienne, M., Le Page, C., Mathevet, R., Trébuil, G., & Weber, J. (2003). Our companion modelling approach. Journal of Artificial Societies and Social Simulation, 6(2), 1.
BATIONO, A., Christianson, C. B., & Klaij, M. C. (1993). The effect of crop residue and fertilizer use on pearl millet yields in Niger. Fertilizer Research, 34(3), 251–258. [doi:10.1007/bf00750571]
BENOIT, M. (1988). Espaces francs et espaces étatisés en Afrique occidentale: Remarques sur quelques processus de territorialisation et leurs fondements idéologiques en Haute Casamance et Haute Gambie. Cahiers Des Sciences Humaines, 24(4), 503–509.
BOMMEL, P. (2009). Définition d’un cadre méthodologique pour la conception de modèles multi-agents adaptée à la gestion des ressources renouvelables. Montpellier 2, PhD Thesis.
BOSERUP, E., & Chambers, R. (1965). The Conditions of Agricultural Growth: The Economics of Agrarian Change Under Population Pressure. London: Routledge. [doi:10.4324/9781315070360]
CALLON, M. (2013). Sociologie de l’acteur réseau. In M. Akrich & B. Latour (Eds.), Sociologie de la Traduction: Textes Fondateurs (pp. 267–276). Paris: Presses des Mines. [doi:10.4000/books.pressesmines.1201]
CHE, C. F. (2019). Community agency, needs mapping and solidarity economics in resource depleted communities.
COLOMB, M., Tannier, C., Perret, J., Chapron, P., & Brasebin, M. (2022). Parcel Manager: A parcel reshaping model incorporating design rules of residential development. Transactions in GIS, 26(6), 2558–2597. [doi:10.1111/tgis.12970]
D’AQUINO, P., & Bah, A. (2013). A bottom-up participatory modelling process for a multi-level agreement on environmental uncertainty management in West Africa. Journal of Environmental Planning and Management, 56(2), 271–285.
DEB, K., Pratap, A., Agarwal, S., & Meyarivan, T. (2002). A fast and elitist multiobjective genetic algorithm: NSGA-II. IEEE Transactions on Evolutionary Computation, 6(2), 182–197. [doi:10.1109/4235.996017]
DELAUNAY, V., & Adjamagbo, A. (2018). La reproduction des familles en contexte de changement socioéconomique et culturel : L’apport du suivi longitudinal et pluridisciplinaire. In Niakhar, mémoires et perspectives: Recherches pluridisciplinaires sur le changement en Afrique (pp. 197–213). Dakar: L’Harmattan Sénégal IRD. [doi:10.4000/books.irdeditions.31477]
DELAUNAY, V., Desclaux, A., & Sokhna, C. (2018). Niakhar, Mémoires et Perspectives: Recherches Pluridisciplinaires sur le Changement en Afrique. Dakar: L’Harmattan Sénégal IRD.
DELAY, E., Broutin, L., Fallot, A., Perrotton, A., & Masse, D. (2025). From local actors to leaf carers: Companion modeling for rethinking tree protection in Senegal’s groundnut basin. Journal of Artificial Societies and Social Simulation, 28(4), 6. [doi:10.18564/jasss.5740]
DELAY, E., Chapron, P., Leclaire, M., & Reuillon, R. (2020). ComExp: Une manière d’introduire l’exploration avec les acteurs. ComMod, Le Cauvel, France.
DELAY, E., Chapron, P., Leclaire, M., Reuillon, R., & Faye, O. (2025). Entre terre et solidarité: La jachère collective comme lien social à Diohine, Sénégal. Cahiers Agricultures, 34, 28. [doi:10.1051/cagri/2025029]
DELAY, E., & Piou, C. (2019). Mutual aid: When does resource scarcity favour group cooperation? Ecological Complexity, 40, 100790. [doi:10.1016/j.ecocom.2019.100790]
DELINA, L. L. (2023). Collective solidarities. In L. L. Delina (Ed.), COVID and Climate Emergencies in the Majority World: Confronting Cascading Crises in the Age of Consequences (pp. 110–115). Cambridge: Cambridge University Press.
EDMONDS, B., Le Page, C., Bithell, M., Chattoe-Brown, E., Grimm, V., Meyer, R., Montañola-Sales, C., Ormerod, P., Root, H., & Squazzoni, F. (2019). Different modelling purposes. Journal of Artificial Societies and Social Simulation, 22(3), 6. [doi:10.18564/jasss.3993]
ETIENNE, M., & Collectif. (2010). La Modélisation d’Accompagnement: Une Démarche Participative en Appui au Développement Durable. Versailles: Quae éditions.
ETIENNE, M., Du Toit, D., & Pollard, S. (2011). ARDI: A co-construction method for participatory modeling in natural resources management. Ecology and Society, 16(1). [doi:10.5751/es-03748-160144]
FAYE, A., Dièye, M., Diakhaté, P. B., Bèye, A., Sall, M., & Diop, M. (2021). Senegal - Land, climate, energy, agriculture and development: A study in the Sudano-Sahel Initiative for Regional Development, Jobs, and Food Security. ZEF Working Paper Series No. 202.
FOUCAULT, M., Colas, D., Grosrichard, G., Le Gaufey, G., Livi, J., Miller, J., Miller, J.-A., Millot, C., & Wajeman, G. (1977). Le jeu de Michel foucault. In Dits et écrits 1954-1988 (Vol. 3, pp. 298–329). Paris: Gallimard.
FUNTOWICZ, S. O., & Ravetz, J. R. (1993). Science for the post-normal age. Futures, 25(7), 739–755. [doi:10.1016/0016-3287(93)90022-l]
GAUTIER, D., & Benjaminsen, T. A. (2012). Environnement, Discours et Pouvoir: L’approche Political Ecology. Versailles: Quae éditions.
GRILLOT, M. (2018). Modélisation multi-agents et pluri-niveaux de la réorganisation du cycle de l’azote dans des systèmes agro-sylvo-pastoraux en transition: Le cas du bassin arachidier au Sénégal. supAgro, Montpellier, PhD Thesis.
GRILLOT, M., Guerrin, F., Gaudou, B., Masse, D., & Vayssières, J. (2018). Multi-level analysis of nutrient cycling within agro-sylvo-pastoral landscapes in West Africa using an agent-based model. Environmental Modelling & Software, 107, 267–280. [doi:10.1016/j.envsoft.2018.05.003]
GRIMM, V., Berger, U., DeAngelis, D. L., Polhill, J. G., Giske, J., & Railsback, S. F. (2010). The ODD protocol: A review and first update. Ecological Modelling, 221(23), 2760–2768. [doi:10.1016/j.ecolmodel.2010.08.019]
GRIMM, V., Railsback, S. F., Vincenot, C. E., Berger, U., Gallagher, C., DeAngelis, D. L., Edmonds, B., Ge, J., Giske, J., Groeneveld, J., Johnston, A. S. A., Milles, A., Nabe-Nielsen, J., Polhill, J. G., Radchuk, V., Rohwäder, M.-S., Stillman, R. A., Thiele, J. C., & Ayllón, D. (2020). The ODD protocol for describing agent-based and other simulation models: A second update to improve clarity, replication, and structural realism. Journal of Artificial Societies and Social Simulation, 23(2), 7. [doi:10.18564/jasss.4259]
HAMANT, O. (2022). La Troisième Voie du Vivant. Paris: Odile Jacob.
HERTZ, T., & Bousquet, F. (2025). Knowledge that affects: An assemblage approach. Ecology and Society, 30(1). [doi:10.5751/es-15734-300127]
KARGER, D. N., Conrad, O., Böhner, J., Kawohl, T., Kreft, H., Soria-Auza, R. W., Zimmermann, N., Linder, P., & Kessler, M. (2018). Data from: Climatologies at high resolution for the earth’s land surface areas. Available at: https://doi.org/10.5061/dryad.kd1d4 [doi:10.1038/sdata.2017.122]
KARGER, D. N., Conrad, O., Böhner, J., Kawohl, T., Kreft, H., Soria-Auza, R. W., Zimmermann, N., Linder, P., & Kessler, M. (2016). Climatologies at high resolution for the Earth land surface areas. Scientific Data, 4. [doi:10.1038/sdata.2017.122]
LERICOLLAIS, A. (1999). Paysans sereer: Dynamiques agraires et mobilités au Sénégal. Marseille: IRD Éditions.
LINTON, J., & Delay, E. (2018). Death by certainty: The Vinca dam, the French state, and the changing social relations of irrigation the Têt basin of the Eastern French Pyrenees. In F. Menga & E. Swyngedouw (Eds.), Water, Technology and the Nation-State (pp. 1–16). London: Routledge. [doi:10.4324/9781315192321-4]
MASSE, D., Lalou, R., Tine, C., Ba, M., & Vayssières, J. (2018). Les trajectoires agricoles dans le Bassin Arachidier au Sénégal: éléments de réflexion à partir de l’observatoire de Niakhar. In V. Delaunay, A. Desclaux, & C. Sokhna (Eds.), Niakhar, Mémoires et Perspectives: Recherches Pluridisciplinaires sur le Changement en Afrique (pp. 311–332). Marseille: IRD Éditions. [doi:10.4000/books.irdeditions.31687]
MULLINGS, B., & Otuomagie, T. (2023). Resilience in the context of multiple crises. In I. Yi (Ed.), Encyclopedia of the Social and Solidarity Economy (pp. 409–415). Cheltenham: Edward Elgar Publishing. [doi:10.4337/9781803920924.00067]
ODRU, M. (2013). Flux de biomasse et renouvellement de la fertilité des sols à l’échelle du terroir. Etude de cas d’un terroir villageois sereer au Sénégal. PhD Thesis, ISTOM, Cergy-Pontoise.
PERROTTON, A., Ba, M., Delay, E., & Fallot, A. (2021). ACARDI: Gestion des sols agricoles et définition collective d’un futur désirable pour la zone de Diohine, Sénégal.ISRA.
PIERI, C. (1989). Fertilité des terres de savanes. Bilan de trente ans de recherche et de développement agricoles au Sud du Sahara. Available at: https://api.semanticscholar.org/CorpusID:155370600
REUILLON, R., Leclaire, M., & Rey-Coyrehourcq, S. (2013). OpenMOLE, a workflow engine specifically tailored for the distributed exploration of simulation models. Future Generation Computer Systems, 29(8), 1981–1990. [doi:10.1016/j.future.2013.05.003]
RICHARD, F. (2019). Peanuts, pangool, and places: Constellations of colonial capitalism in rural Senegal. Historical Archaeology, 53(3), 611–633. [doi:10.1007/s41636-019-00207-6]
RICOME, A., Affholder, F., Gérard, F., Muller, B., Poeydebat, C., Quirion, P., & Sall, M. (2017). Are subsidies to weather-index insurance the best use of public funds? A bio-economic farm model applied to the senegalese groundnut basin. Agricultural Systems, 156, 149–176. [doi:10.1016/j.agsy.2017.05.015]
RITTEL, H. W., & Webber, M. M. (1973). Dilemmas in a general theory of planning. Policy Sciences, 4(2), 155–169. [doi:10.1007/bf01405730]
ROBERTS, N. (2001). Wicked problems and network approaches to resolution. International Public Management Review, 1.
RUMPEL, C., Lehmann, J., & Chabbi, A. (2018). “4 per 1,000” initiative will boost soil carbon for climate and food security. Nature, 553(7686), 27–27. [doi:10.1038/d41586-017-09010-w]
SALTELLI, A., Bammer, G., Bruno, I., Charters, E., Di Fiore, M., Didier, E., Espeland, W. N., Kay, J., Lo Piano, S., Mayo, D., Pielke Jr, R., Portaluri, T., Porter, T. M., Puy, A., Rafols, I., Ravetz, J. R., Reinert, E., Sarewitz, D., Stark, P. B., … Vineis, P. (2020). Five ways to ensure that models serve society: A manifesto. Nature, 582(7813), 482–484. [doi:10.1038/d41586-020-01812-9]
SERPANTIÉ, G., & Ouattara, B. (2001). Fertilité et jachères en Afrique de l’Ouest. In C. Floret & R. Pontanier (Eds.), La Jachère en Afrique Tropicale: Rôles, Aménagement, Alternatives: 2. De la Jachère Naturelle à la Jachère Améliorée: Le Point des Connaissances (pp. 21–83). Paris: IRD; J. Libbey.
SPRINGER, S. (2016). The Anarchist Roots of Geography: Toward Spatial Emancipation. Minneapolis, MN: University of Minnesota Press. [doi:10.5749/minnesota/9780816697724.001.0001]
STAR, S. L., & Griesemer, J. R. (1989). Institutional ecology, “translations” and boundary objects: Amateurs and professionals in Berkeley’s museum of vertebrate zoology, 1907-39. Social Studies of Science, 19(3), 387–420. [doi:10.1177/030631289019003001]
STENGERS, I. (2022). L’art des modèles. In Cosmopolitiques (pp. 482–495). Paris: La Découverte.
SWYNGEDOUW, E. (2015). Liquid Power. Contested Hydro-Modernities in 20th Century Spain. Cambridge, MA: MIT Press. [doi:10.7551/mitpress/9780262029032.001.0001]
WEBER, J., & Bailly, D. (1993). Prévoir, c’est gouverner. Natures Sciences Sociétés, 1(1), 59–64. [doi:10.1051/nss/19930101059]