OPOSim: An Agent-Based Model for Evaluating Long-Term Effects of Opioid Policy Outcomes in North Carolina

, ,
and
RTI International, United States
Journal of Artificial
Societies and Social Simulation 29 (1) 5
<https://www.jasss.org/29/1/5.html>
DOI: 10.18564/jasss.5892
Received: 06-Jul-2024 Accepted: 30-Dec-2025 Published: 31-Jan-2026
Abstract
The opioid epidemic remains a critical public health issue in the United States, with North Carolina experiencing particularly high opioid-related mortality rates. This study introduces OPOSim, an agent-based model designed to assess the long-term impacts of opioid policy interventions. By incorporating social networks and simulating opioid use dynamics, we use OPOSim to evaluate the effects of prevention strategies, specifically targeting the reduction of transitions from prescribed opioids and non-opioid substance use to heroin/synthetic opioid use disorder within North Carolina. The results demonstrate a significant delay between intervention implementation and observable mortality reductions, emphasizing the need for long-term planning. Even partial reductions in transition rates can notably decrease opioid-related deaths over time. OPOSim offers a valuable tool for understanding the opioid crisis and informing policy decisions, providing insights into the effectiveness of various interventions to mitigate the epidemic in North Carolina and similar settings.Introduction
The opioid epidemic represents one of the most pressing and recalcitrant public health emergencies the United States has faced in recent decades. Communities across the country continue to grapple with high rates of opioid-involved overdoses, addiction, and death; a situation that demands focused attention. The severity of the crisis in North Carolina is reflected in alarming statistics. In 2021, the state reported 38.2 overdose-related deaths per 100,000 (North Carolina Department of Health and Human Services 2024) – represented principally by opioids – a figure that outpaces the national average of 24.3 per 100,000 in 2021 (National Center for Health Statistics 2022). While the epidemic impacts individuals across every segment of society, it disproportionately impacts certain vulnerable populations, reflecting broader social and economic disparities (Altekruse et al. 2020; Dasgupta et al. 2018; Kariisa et al. 2022).
After North Carolina implemented its Opioid Action Plan in 2017 mortality plateaued, however since the rise of COVID-19 in 2020 it nearly doubled and has only begun to decline in 2024 (North Carolina Department of Health and Human Services 2024).
The complex interplay between biological, psychological, social, and environmental factors has rendered traditional approaches to prevention, treatment, and policy implementation less effective (Jalali et al. 2020; Strang et al. 2020; Volkow et al. 2016). While it is important to analyze the course of the epidemic and policy at the national level (Lim et al. 2022; Pitt et al. 2018), the practical implementation of policies frequently takes place at the local, community level. Several simulation models have evaluated policies aimed at distributing the opioid antagonist naloxone, which can reverse an overdose if administered promptly (Irvine et al. 2018; Keane et al. 2018). Although such policies are linked to reductions in mortality (Tabatabai et al. 2023), they do not necessarily reduce the number of individuals at risk for overdose or with opioid use disorder (OUD). Other policies, and their related models, focus on increasing treatment availability (Adams et al. 2023). While crucial, these policies affect those already at a high risk for overdose, such as those with OUD, but do not address the upstream flow of individuals who, over time, become at risk for overdose. Prevention policies, on the other hand, significantly influence the course of an epidemic by addressing the upstream causes and mitigating the epidemic growth early on. Prevention policies can create overall awareness of harms associated with opioid use and transition to addiction and can be targeted to act at different levels to reach different populations: school, community, workplace, institutional, and societal. These policies can affect two types of transitions: initiation and progression. Within the context of the opioid epidemic, these correspond to initiation of opioid use, and progression from occasional use to regular use and ultimately to opioid use disorder. However, the impacts of these policies are not always immediately obvious because of the time horizons over which a disease can progress. For example, the development of OUD can be nonlinear and unfold over several years (Strang et al. 2020). To understand the timeline over which reductions in fatalities might be significantly realized under prevention policies, it is essential to account for the nonlinear transitions in disease dynamics within modeling efforts. Simulation models are particularly valuable for estimating the potential impacts of these preventative measures.
In this paper, we present OPOSim (Opioid Policy Outcomes Simulation), an agent-based model which incorporates social networks to simulate the essential dynamics of opioid use within the context of key players in a community. We demonstrate use of the model to investigate prevention policies within North Carolina. Due to the variety of prevention strategies available, we consider a general preventive effort involving the Department of Health and Human Services and local communities rather than any specific strategy or policy. By focusing on North Carolina’s specific situation, the paper contributes to the growing body of research on targeted interventions and context-sensitive approaches to the opioid crisis.
Methods
Model overview
Because the course of opioid epidemics is complex (Bobashev et al. 2020; Strang et al. 2020), the purpose of OPOSim is multifaceted. It builds on our prior agent-based modeling work (Bobashev et al. 2018; Hoffer et al. 2012; Hoffer & Bobashev 2009) and serves as a tool to explore the impact of interventions on individual trajectories of opioid use and is primarily intended for use in examining long-term effects of prevention and treatment interventions. Our decision to use an agent-based model rather than an ordinary differential equation (ODE) model was motivated by the desire to capture individual-level interactions, behavioral heterogeneity, and the influence of social networks – critical factors in opioid distribution and addiction dynamics that are challenging to represent with ODEs. By modeling each agent individually, we can more accurately reflect how personal behaviors and interactions contribute to overall outcomes. This approach enhances our ability to assess the impact of interventions at the micro-level and how they scale to affect population-level trends, which is essential for informing effective policy interventions.
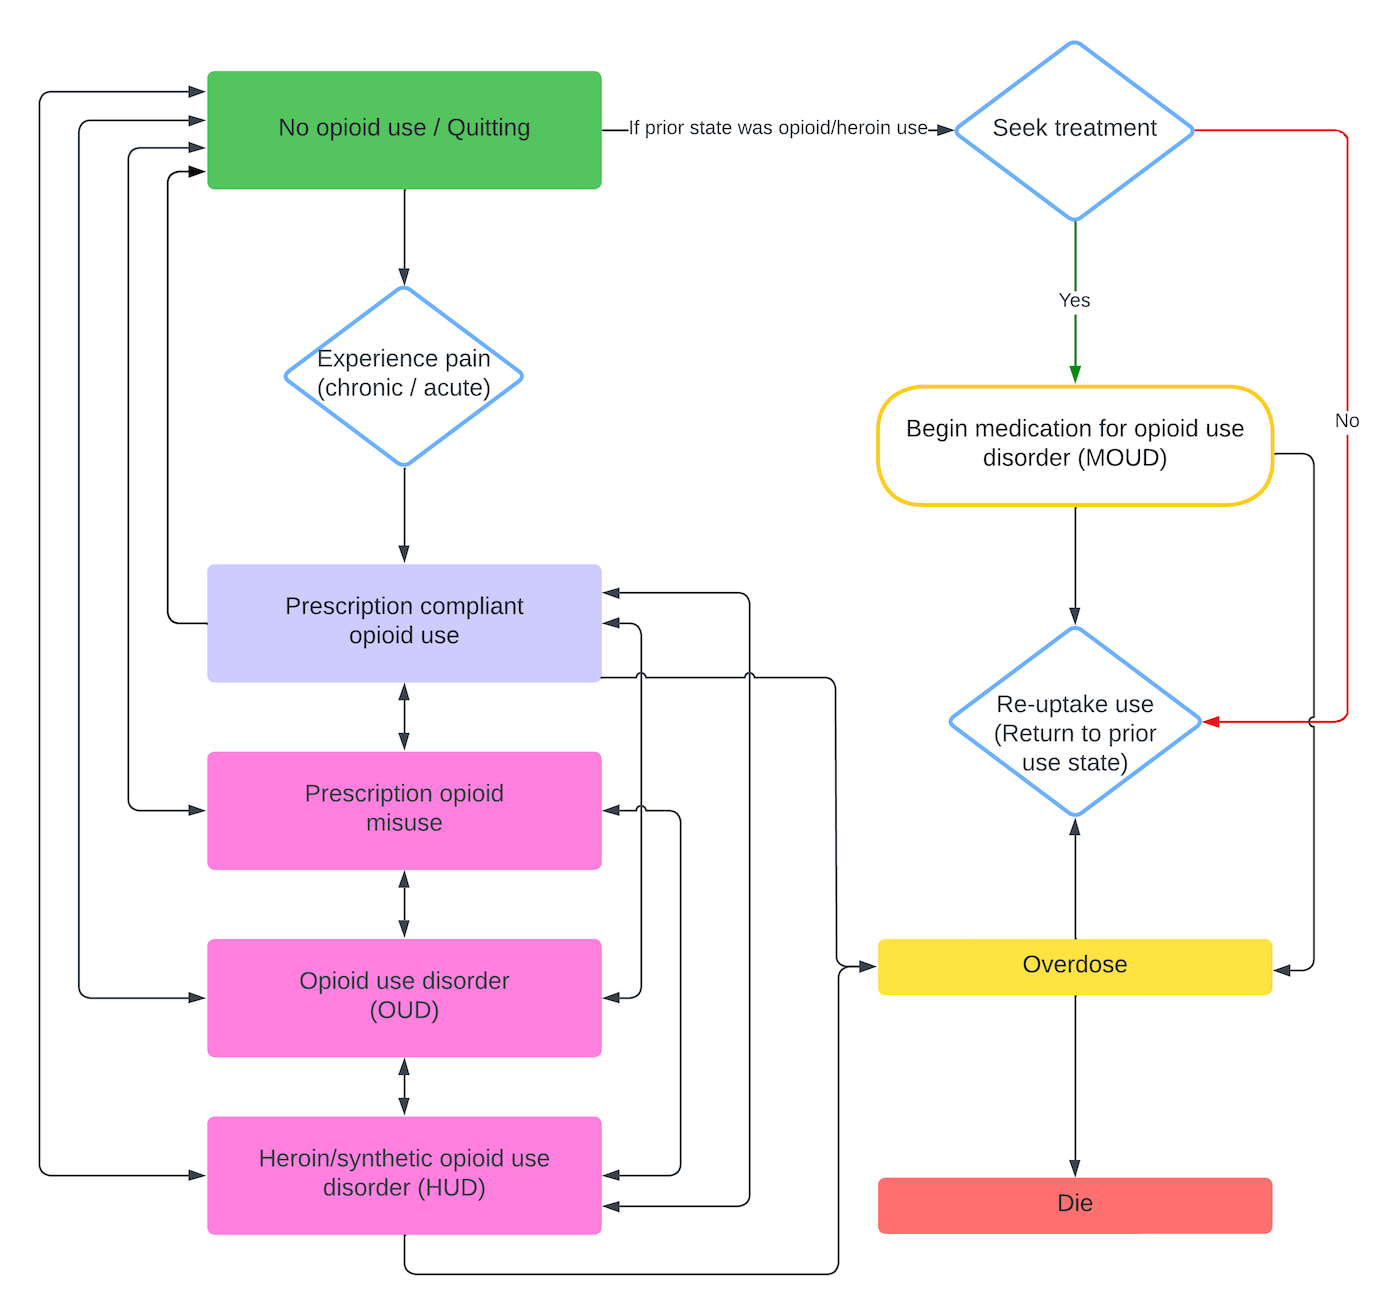
The model tracks initiation of opioid use through prescribed medications including the use of prescription opioids for chronic or acute pain, and transitions from other substances to opioids or through other exposure to illicit opioids. The model includes illicit drugs heroin/fentanyl, and medications for opioid use disorder (MOUD) including buprenorphine. Agent interactions include dealer-user relationships; accessing prescription opioids (POs) through emergency departments, pharmacies, and other healthcare settings; and user-peer networks.
Inclusion of social networks is a critical component that supports social interactions and sharing of substances as well as information across the networks. The incorporation of social networks within the OPOSim aligns with existing research that emphasizes the importance of social factors in substance use. For example, evidence supports that social interactions and peer influence are critical drivers in the initiation and continuation of substance use (Ennett et al. 2008; Henneberger et al. 2021; Montgomery et al. 2020).
The model is implemented in the NetLogo modeling environment (Wilensky 1999) and simulates life courses at one-day timesteps across several years. This temporal structure provides a sufficiently granular perspective to observe short-term patterns of use (e.g., across one month) while also enabling a longer-term analysis of the dynamics as they unfold over larger timescales (across a decade). Users can easily modulate key parameters to explore alternative scenarios, including policy interventions such as greater adherence to Prescription Drug Monitoring Program (PDMP) protocols, wider distribution of overdose-reversal agents like naloxone, or expanded use of MOUDs such as buprenorphine. This exploratory approach, coupled with the local focus and integration of social networks, allows for a more nuanced understanding of the opioid crisis. The model can empower stakeholders with insights to guide decision-making and contributes to more effective prevention and treatment strategies tailored to specific communities and populations, particularly within the context of North Carolina.
A comprehensive description of the model is provided in Appendix A, following the ODD (Overview, Design concepts, Details) protocol (Grimm et al. 2006, 2020). This detailed documentation ensures a clear understanding of the model’s structure and behavior, facilitating future research and adaptation of the model.
Agents and agent behavior modeling
The structure of the model is designed to emulate a community affected by the opioid crisis, reflecting key elements of society that play a role in the proliferation, treatment, and control of opioid use. The five agent types within the model—community members (CMs), physicians, emergency departments (EDs), pharmacies, and dealers – each have distinct roles and functions.
Community Members (CMs)
Community members are the primary agents of interest within the model. Representing individuals within the community, this agent type can interact with physicians, EDs, pharmacies, and dealers to access opioids. Their behaviors and decisions regarding opioid use can be influenced by various factors including pain levels, social influences, availability of resources, and exposure to different interventions. CMs have friendships, represented by graph edges, with other CMs or dealers. Individuals may develop an OUD either by taking opioids originally prescribed for managing acute or chronic pain in a way not intended by the prescriber or by commencing opioid misuse to experience euphoria. Each individual is characterized by three evolving internal states: desire, tolerance, and satiation. These states dynamically respond to opioid consumption. The equations governing desire, tolerance, and satiation in our model are based on established pharmacological and behavioral principles, as well as empirical observations from ethnographic and clinical research (Bobashev et al. 2018, 2020; Hoffer et al. 2012; Hoffer & Bobashev 2009; Preiss et al. 2022). These equations aim to capture the interplay between escalating drug consumption, physiological adaptation, and the ongoing effort by individuals to fulfill changing opioid needs.
The desire state is quantified by the morphine milligram equivalent (MME) that the individual seeks, which not only pertains to the MME amount necessary for achieving satiation but may also encompass additional MME sought for euphoria or escalated MME necessitated by an increased tolerance. This relationship is captured in Equation 1:
| \[d=\tau \cdot r \] | \[(1)\] |
Here, \(d\) (desire) represents the amount of opioids an individual seeks, \(\tau\) (tolerance) is the individual’s neurophysiological adaptation to the drug, and \(r\) (the desire-tolerance ratio) is a fixed parameter specifying how rapidly desire increases with rising tolerance. This proportional relationship reflects the concept of allostasis, wherein repeated opioid use compels the body to re-establish a new homeostatic set point. As tolerance accumulates, individuals require higher opioid doses to achieve the same pharmacological or subjective “high”, thereby escalating drug-seeking behavior. Clinical research and observational data support a linear or near-linear link between rising tolerance and increased dosage (Ferrer-Pérez et al. 2024; Gutkin & Ahmed 2012). We derive specific parameter values for \(r\) from earlier modeling work that aligns well with observed patterns of gradual dose escalation.
Initially, tolerance is zero for an individual with no prior opioid exposure. Over time, as CMs continually use opioids, tolerance develops in response to the dosages taken. Exposure to opioids alters the desire state over time, which evolves according to both tolerance and the currently utilized dosage. The progression of tolerance can be described by the following equation:
| \[\tau_{\text{new}} = \tau + i(o-\tau) \] | \[(2)\] |
In this expression, \(\tau_{\text{new}}\) is the updated tolerance, \(\tau\) is the current tolerance, \(o\) is the opioid dose consumed (in MME), and \(i\) is the tolerance inertia parameter. Tolerance does not immediately match every change in consumption level; it adjusts gradually over time. The parameter \(i\) captures the rate at which an individual’s tolerance “catches up” to new dosing levels. A higher \(i\) signifies faster adaptation, whereas a lower \(i\) implies a more gradual physiological shift. Parameter ranges for \(i\), commonly in the vicinity of 8-16%, stem from ethnographic data (Hayden et al. 2021; Hoffer 2005).
The satiation state represents the extent to which the amount of opioids consumed within a given timestep fulfills the individual’s need, with its value ranging between 0 and 1. This is determined by the following equation:
| \[\sigma_{\text{new}} = \begin{cases} 1, & \delta = 0, \\[6pt] \displaystyle \min\!\left(1, \frac{\min(p, s)}{\delta}\right), & u = \texttt{po-comp}, \\[10pt] 1, & u \neq \texttt{po-comp} \text{ and } s \ge \delta, \\[6pt] \displaystyle \min\!\left(1,\max\!\left(\frac{s}{\delta},\,0.95\,\sigma\right)\right), & u \neq \texttt{po-comp} \text{ and } s < \delta, \end{cases} \] | \[(3)\] |
Here, \(\sigma_{\text{new}}\) is the new satiation level (ranging from 0 to 1), \(\delta\) is the current desire, \(p\) is the prescribed dose (for prescription-compliant users), \(s\) is the total available drug supply after consumption, \(u\) is the current use state, and \(\sigma\) is the previous satiation. Satiation measures how fulfilled or satisfied an individual’s opioid need is after consumption. For prescription-compliant users (\(u=\texttt{po-comp}\)), satiation generally remains stable as long as the available prescription meets or approximates the individual’s desired level. When consumption is more erratic or illicit, satiation depends on whether the remaining supply is sufficient to satisfy an often-escalating desire, leading to potential fluctuations in opioid use patterns. Some evidence suggests that following medical guidelines with smaller, consistent doses can sustain a stable level of satiation (Preiss et al. 2022), preventing rapid dose escalation. In contrast, illicit use patterns frequently involve inconsistent supply, leading to unpredictable satiation and a higher likelihood of increasing dosage in pursuit of a desired effect.
CMs daily consume MME through prescribed opioids, illicit oral forms, or heroin/fentanyl, driven by their desire. Subsequently, opioid usage will trigger updates to the individual’s levels of tolerance, desire, and satiation. The probability of overdose and fatality varies with the specific amount of opioid ingested. Due to the scarcity of peer-reviewed publications or clinical trials that could shed light on these internal states, our model is informed by qualitative insights from ethnographic and clinical studies, anecdotal evidence, and social media analysis (Goldstein 2001; Hayden et al. 2021; Hoffer 2005). This model was further refined through calibration to minimize the difference in overdose mortality trends observed in North Carolina between 2012 and 2021.
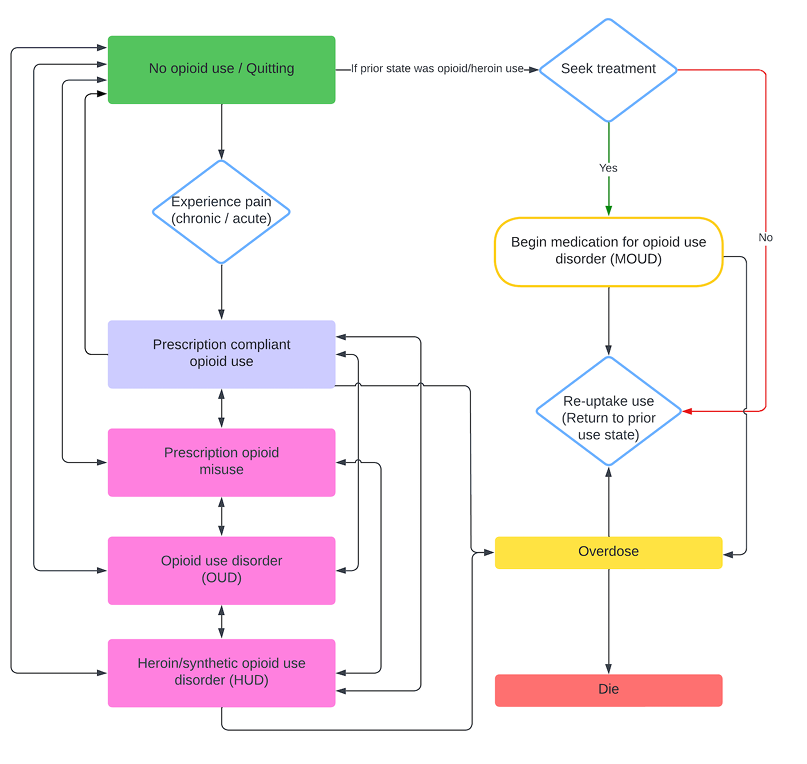
Within each simulated day, CMs experience acute or chronic pain, interact with the medical system, and consume opioids according to their current use state. Prescription-compliant CMs take the smaller of their prescribed dose and the supply they have on hand; if that supply cannot satisfy their pain-related need, they revisit their primary prescriber and pharmacy to request additional medication. CMs in illicit use states (prescription opioid misuse, opioid use disorder, or heroin/synthetic opioid use disorder) consume opioids up to their current desire but are capped by whatever stock they possess, with heroin users drawing first from their heroin supply before using prescription opioids. When an illicit-use CM’s desire exceeds the opioids available after those visits, the agent stochastically seeks additional supply through friends, dealers, emergency departments, or extra physicians. After consumption, the model updates tolerance, desire, and satiation, and determines overdose and death probabilities based on the amount actually taken. Transitions among use states occur probabilistically, allowing individuals to move between compliant use, misuse, opioid use disorder, and heroin use disorder over time. Figure 1 summarizes these stochastic pathways.
Physicians
In the model, physicians play a pivotal role as primary sources of prescription opioids. Their decisions and actions are guided by assessments of patient needs and prevailing guidelines. They can opt to write new prescriptions for opioids, increase a patient’s dosage (titrate up), or adhere to specific dose-caps as recommended by the CDC (Dowell et al. 2022) by consulting the patient’s record in the state’s PDMP database. The integration of the PDMP within the model reflects real-world efforts to monitor and regulate opioid prescriptions and allows the simulation to explore how compliance with these guidelines might impact opioid use and addiction. Within the model, these decisions are represented through simple probability rules –governed by parameters such as PDMP compliance and prescribing tendencies–for initiating, titrating, or withholding prescriptions based on PDMP findings.
Pharmacies
Pharmacies are the intermediaries responsible for filling prescriptions written by physicians and distributing prescription opioids to patients. In the current implementation, pharmacies serve as simple dispensers: when a patient presents a prescription, the model adds the prescribed quantity to that patient’s supply and logs the visit. We do not yet model pharmacy-level inventory checks, education, or surveillance, but those mechanisms could be layered into future extensions (e.g., by tracking pharmacy stock or adding flags for high-frequency fills).
Emergency departments
Representing hospital emergency departments, EDs in the model dispense opioids directly to patients without routing prescriptions through pharmacies. Each visit results in at most a one-day supply, drawn from an ED-specific distribution. Before issuing that supply, an ED may probabilistically apply the CDC’s 90 MME/day cap and consult the patient-specific PDMP record; if the record already exceeds the threshold, the ED withholds the medication. This implementation captures the short-term, tightly regulated nature of emergency prescribing while keeping the logic intentionally simple
Dealers
Dealers provide an illicit dimension to the model, supplying non-medical opioids. Each dealer starts with opioid and heroin inventories and is automatically refilled to predetermined maxima at the beginning of every month. When a CM requests drugs, the dealer responds automatically: for heroin users, it first provides the lesser of the request or its current heroin stock; any remaining demand is then filled with prescription-opioid stock, again capped by what’s available. If the dealer cannot satisfy the full amount, the CM may seek out another dealer through its network. Overdose risk from heroin draws is scaled by a time-dependent fentanyl multiplier applied to all users, capturing the increasing potency of illicit heroin markets without modeling dealer-specific adulteration.
Model parameterization and calibration
The existing configuration of the model situates agents within Euclidean space, serving as an abstract rather than a concrete geographical depiction of North Carolina. This spatial framework captures the basic dynamics without depending on the geography or location-based intricacies of the region. However, the model’s design does allow for potential extensions to become geospatially explicit.
The model environment includes numerous global parameters fixed at the start of each simulation. A complete list of these parameters is available in Appendix B. To determine these parameter values, we conducted a survey of relevant literature, including peer-reviewed articles and gray literature, to establish reasonable estimates. Parameter estimation requires researchers to make informed choices about what data to include and how to incorporate it into the model. While inherently subjective, we adhered to guiding principles to ensure the parameters’ validity and relevance to our study.
For parameters related to opioid use disorder in general (e.g., effectiveness of methadone), we relied on recent peer-reviewed literature reporting results from randomized clinical trials or well-conducted observational studies. For parameters specific to North Carolina (e.g., entry into methadone treatment, probability of overdose), we utilized government reports such as the Substance Abuse and Mental Health Services Administration (SAMHSA) Treatment Episode Data Set (TEDS) data for North Carolina and surveillance reports from the North Carolina Department of Health and Human Services (NC DHHS). Data from the National Survey on Drug Use and Health (NSDUH) also informed the model.
To enhance the model’s credibility, we engaged in a parameter validation process that included consultations with subject matter experts and cross-referencing with local data. At least two researchers reviewed each parameter to ensure accuracy and appropriateness. Parameters derived from studies more than ten years old, from non U.S. settings, or lacking sufficient detail or justification were flagged for further discussion. These parameters were evaluated in research team meetings, where we considered their applicability and potential impact on the model. When specific parameters were not identifiable within the literature or required additional context, we consulted with subject matter experts in opioid use and treatment within North Carolina to obtain the most accurate estimates.
Our literature search strategy involved systematic searches using Google Scholar, PubMed, and other relevant databases to identify peer-reviewed literature and government sources related to each parameter of interest. We reviewed the available data, prioritizing recent and regionally relevant studies, and selected appropriate parameter values based on this evidence. Within an Excel spreadsheet (provided in Appendix B), we documented for each parameter the category (e.g., overdose, treatment), a description, the value, units or type, distribution (e.g., normal, exponential), and citation or URL. This comprehensive documentation allows for transparency and traceability of our parameter selection process.
To calibrate this version of the model, we minimize the mean squared error (MSE) between the model’s opioid and heroin overdose death trajectories and the rescaled 2012–2021 North Carolina mortality series loaded during setup. We tuned three parameters that govern the dose-dependent likelihood of overdose to minimize this MSE. The dose–response relationship we fit is:
| \[\pi_{\text{base}}(d) = \frac{1}{365} \cdot \frac{1}{1 + e^{a(b - d)}},\] | \[(4)\] |
overdose-prob-a) sets how steeply risk increases with dose, and \(b\) (overdose-prob-b) locates the 50% inflection point. If any heroin/fentanyl is taken, the daily overdose probability is:
| \[\pi_{\text{heroin}}(d, t) = m \cdot f(t) \cdot \pi_{\text{base}}(d),\] | \[(5)\] |
heroin-OD-rate-multiplier) amplifying risk relative to prescription opioids and \(f(t)\) capturing the time-varying fentanyl adulteration level. We employed simulated annealing via NetLogo’s BehaviorSearch to tune \(a\), \(b\), and \(m\) to minimize the MSE between simulated and observed overdose deaths. This probabilistic optimization technique efficiently explores complex parameter spaces by probabilistically accepting solutions that worsen the objective function to escape local minima, gradually reducing such acceptance as it converges toward the global optimum.
Experimental design
A key objective of this study is to explore how long it might take to observe a noticeable effect of prevention policies on opioid-related mortality at the population level. While some interventions, such as naloxone distribution, may demonstrate relatively prompt reductions in overdose fatalities, prevention-oriented strategies typically require a longer time horizon to produce observable change. This is because prevention measures—ranging from educational initiatives and prescription monitoring to regulatory policies-target upstream factors that influence an individual’s trajectory toward opioid misuse, often taking years to manifest in reduced mortality rates.
However, modeling each specific intervention or bundle of interventions in all of its policy and contextual nuances can become both unmanageable and quickly outdated, given the evolving nature of opioid-related interventions. Consequently, we opted for a consolidated approach that models generic reductions in transition rates to heroin/synthetic opioid use disorder. By using 50% and 100% reductions, we can capture a range of possible intervention outcomes—from partially to fully effective policies—without tying our analysis to a single policy measure. This approach ensures that our findings remain broadly relevant to a variety of present-day and future prevention strategies, illustrating how long-term reductions in opioid-related mortality might unfold under different effectiveness levels.
To better understand the dynamics surrounding opioid use, addiction, and treatment within a community modeled after North Carolina, we employed OPOSim to model several experimental scenarios, each modulating the influence of public health and public policy changes in prevention that interrupt the pathways to heroin-use disorder. In these experiments, we were particularly interested in understanding the potential time lag between implementing hypothetical prevention interventions and observing any reduction in opioid-related fatalities.
Among individuals who do not use prescription opioids, a certain percentage will begin using illicit opioids. We assume that these individuals progress to misuse illicit opioids due to prior exposure to other non-opioid substances (including marijuana, stimulants, sedatives, etc.). Nationally, it is estimated from the Substance Abuse and Mental Health Services Administration (2023) that 21.9% of the population used illicit drugs in 2021 and approximately 3.3% of the population misused opioids. Thus, the proportion that misused other drugs is 18.6%. We assign a fixed indicator of “other drug use” to 20% of the population with no prescription opioid use at year 10. For the remaining population, we assume they do not use other drugs.
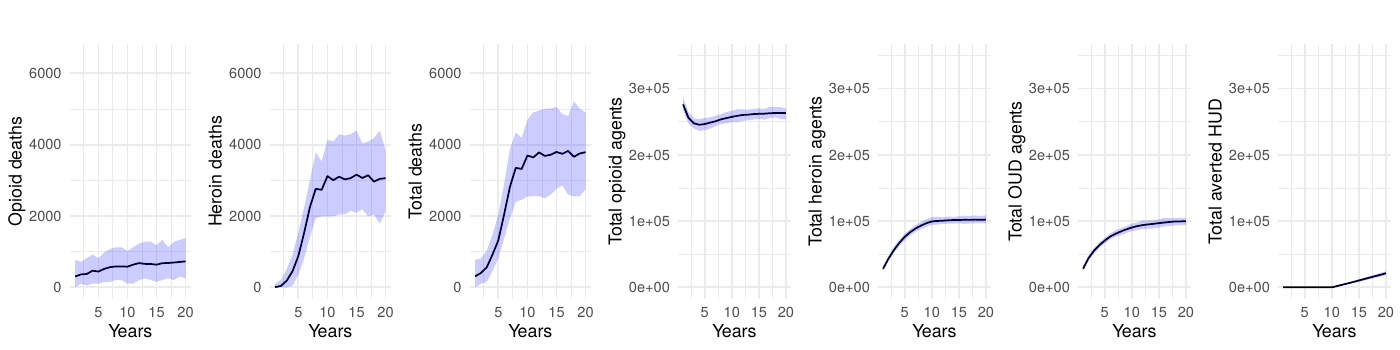
1. Baseline scenario. The baseline scenario provides a representation of the current state of opioid use within the community, without any intervention or changes to existing policies or prevention practices. This simulation scenario provides a control condition against which the effects of differential prevention policies can be compared.
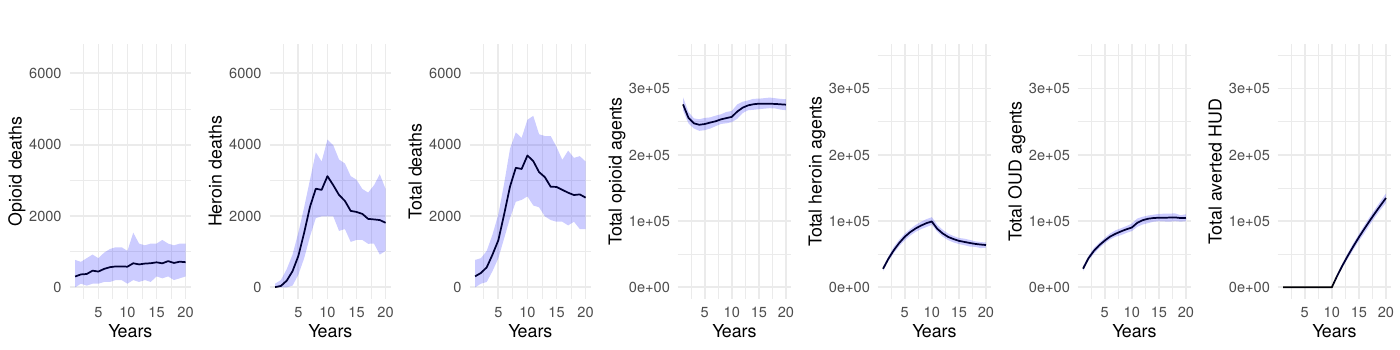
2. Reduction in transitions of any opioid use to heroin/synthetic opioid use disorder. A dual-scenario construct explores policies for people whose opioid use began with prescribed opioids. Starting in year 10, CMs who are not initial heroin users are blocked from transitioning into heroin/synthetic opioid use disorder:
- Scenario 2a. Envisions an idealistic policy yielding complete cessation of transition to heroin/synthetic opioid use disorder.
- Scenario 2b. Enacts a pragmatic policy, randomly selecting 50% of eligible individuals and blocking them from progressing to heroin/synthetic opioid use disorder.
3. Reduction in transitions of non-opioid substance use to heroin/synthetic opioid use disorder. In these two scenarios, we consider individuals who are using other substances but not opioids and the use of harm reduction strategies to reduce the transition to heroin use disorder:
- Scenario 3a. Proposes a hypothetical policy that realizes total elimination of the transition to heroin/synthetic opioid use disorder.
- Scenario 3b. Adopts a more realistic approach with a policy reducing the rate of transition by 50%.
4. Combined reduction in transitions to heroin/synthetic opioid use disorder. In this scenario, we consider individuals who are already using prescribed opioids and individuals who are using other substances but not opioids. We implement a policy which randomly selects 50% of eligible individuals from both groups and blocks them from progressing to heroin/synthetic opioid use disorder.
All simulations activate the designated interventions at the conclusion of the first ten-year warm-up phase simulating the observed trends in overdose mortality, followed by an additional ten-year analysis period to monitor the enduring effects of these policies. This design is critical to capturing both the immediate and delayed ramifications of the interventions within the community context.
We selected 10,000 agents for our simulations to ensure sufficiently large subpopulations for analysis. We further chose to run each scenario 100 times, as pilot tests showed that this number of runs was sufficient to establish reliable 95% simulation intervals without excessively increasing computational costs. Additional experiments revealed that increasing the agent count beyond 10,000 or the number of runs beyond 100 had no appreciable effect on the overall results–opioid deaths, heroin deaths, and total deaths remained consistent–while substantially increasing the simulation runtime.
Results
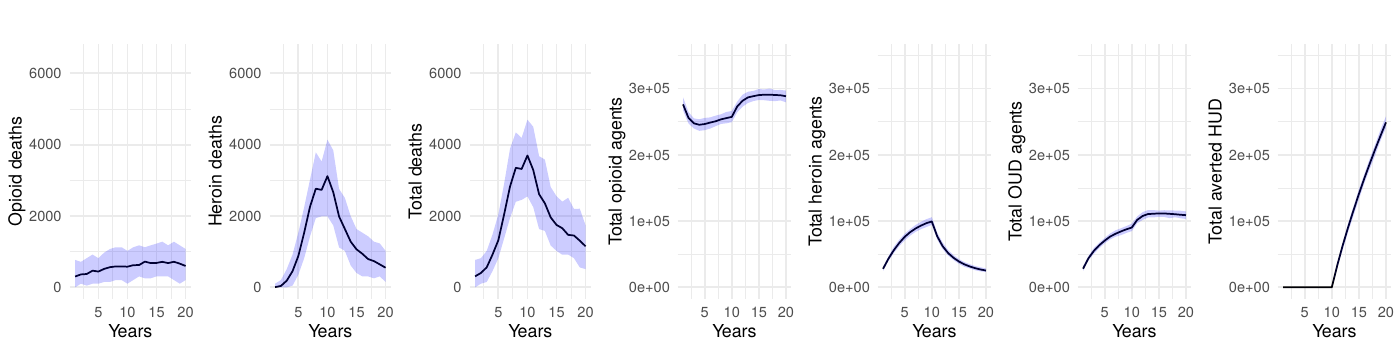
The baseline scenario without interventions served to establish a reference for the epidemic’s trajectory under current conditions, highlighting persistent high mortality rates from both prescription opioids and heroin or synthetic opioids.
Upon the application of interventions, we observed an eventual—sometimes notable—decrease in deaths. The intervention scenarios simulating complete interruption strategies yielded a marked decrease in fatalities, underscoring high potential efficacy of such measures. Even partial reduction strategies, targeting a 50% decrease in transition to heroin-use disorder, delivered a significant impact, validating the model’s sensitivity to intervention scale. However, we often observed a significant delay between the introduction of an intervention, even in the ideal-effectiveness scenario, and a strong reduction in mortality.
In scenarios employing a reduction in transition rates to heroin-use disorder, there was notable latency before a marked decrease in deaths was recorded, indicating a time-dependent diffusion of the intervention’s effects through the modeled population. For a 50% effective intervention, the reduction in mortality is smaller, and it takes longer to achieve a significant reduction in mortality.
Although a delay between the implementation of the intervention and a notable reduction is not unexpected, our model estimates the order of magnitude of this time lag. In the ideal scenario (2a), it takes approximately 5 years to reduce mortality by half and 10 years to achieve a 71% reduction in total deaths. With a 50% effective intervention targeting opioid users (scenario 2b), mortality drops by approximately 32% over 10 years. Interventions targeting individuals whose opioid use began with prescribed opioids (scenarios 2a and 2b) demonstrate substantially greater effectiveness than those targeting individuals transitioning from non-opioid substances (scenarios 3a and 3b), with the latter achieving only a 6-12% reduction in mortality after 10 years. The combined intervention (scenario 4), implementing a 50% reduction across both populations, achieves a 38% reduction in total deaths over the 10-year period. Even when the transition to disorder is halted, mortality remains high because people who misuse opioids, but do not have a disorder, are still at risk of overdose death.
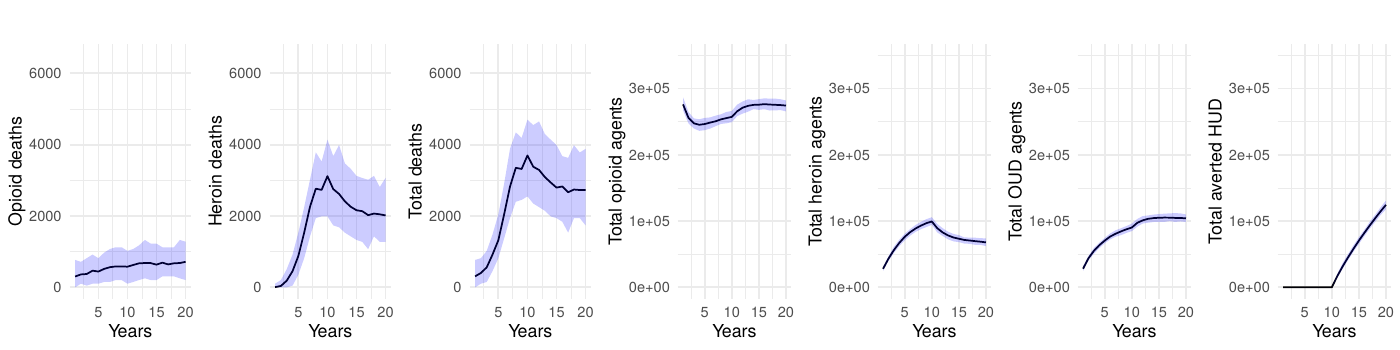
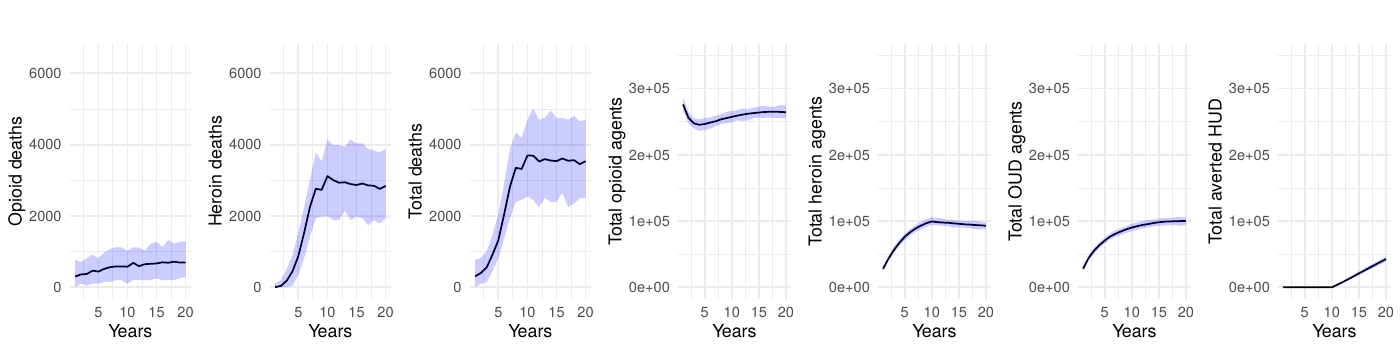
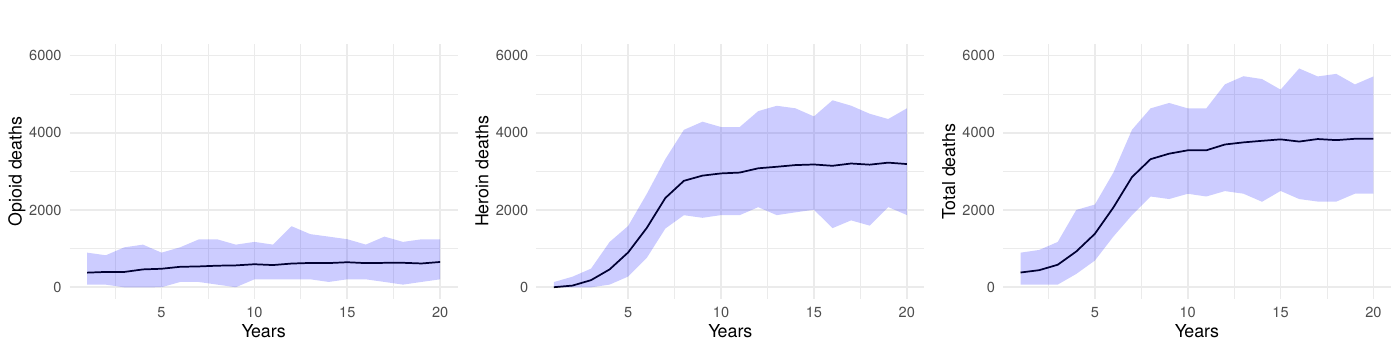
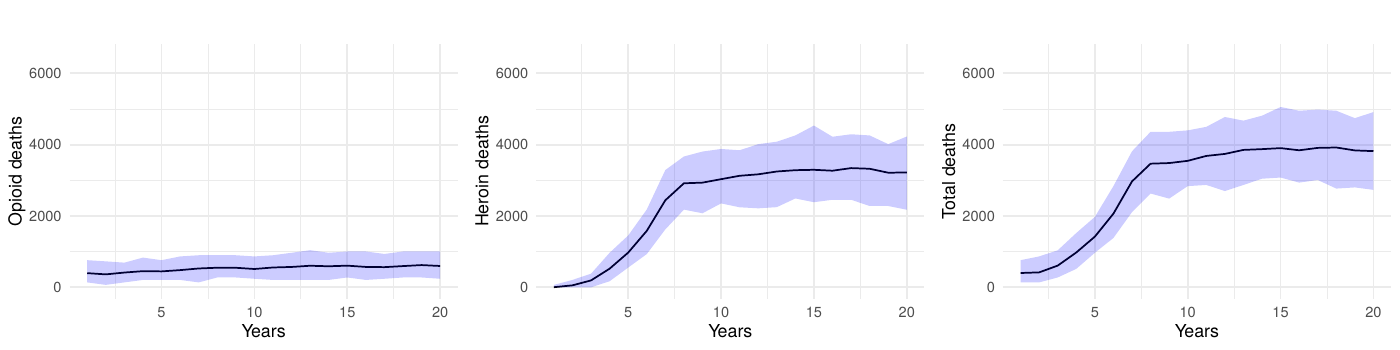
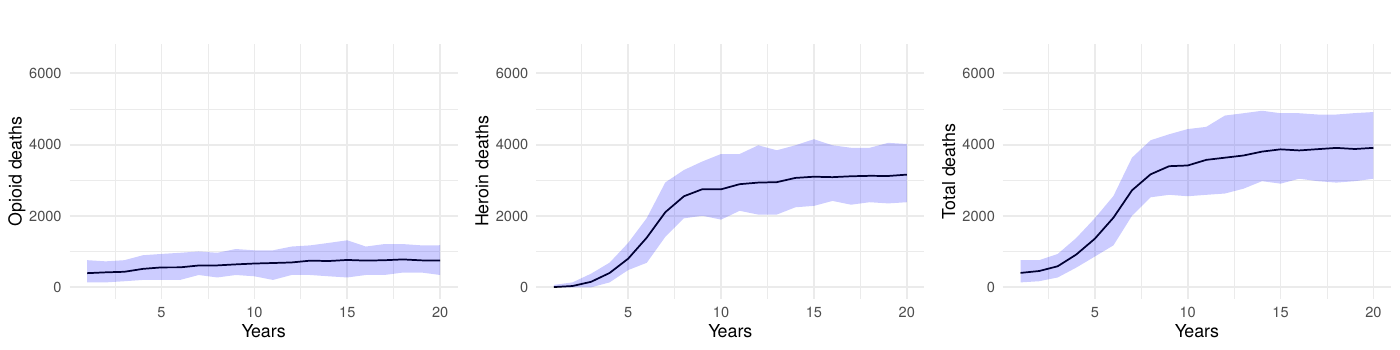
Table 1 presents the mean annual deaths across all scenarios for years 11-20. Figures 2- 7 depict the simulation results of the baseline and experimental scenarios. For each scenario, we provide six plots that capture the observed dynamics. From left to right, the plots show the mean and 95% simulation interval of: (1) the (annual) number of deaths due to prescription opioids, (2) the number of deaths due to heroin/synthetic opioids, (3) the total number of deaths, (4) the total number agents in the simulation using prescription opioids, (5) the total number of agents with opioid use disorder, and (6) the total number of agents prevented from transitioning to heroin/synthetic opioid use disorder under the given scenario.
| Year |
Scenario 1: Baseline |
Scenario 2a: 100% reduction (opioid users) |
Scenario 2b: 50% reduction (opioid users) |
Scenario 3a: 100% reduction (other drug users) |
Scenario 3b: 50% reduction (other drug users) |
Scenario 4: 50% reduction (combined) |
|---|---|---|---|---|---|---|
| 11 | 3,562 | 3,216 | 3,307 | 3,612 | 3,563 | 3,458 |
| 12 | 3,616 | 2,551 | 3,219 | 3,454 | 3,698 | 3,164 |
| 13 | 3,744 | 2,303 | 3,025 | 3,512 | 3,604 | 3,023 |
| 14 | 3,899 | 1,922 | 2,881 | 3,490 | 3,644 | 2,757 |
| 15 | 3,831 | 1,711 | 2,736 | 3,457 | 3,718 | 2,758 |
| 16 | 3,850 | 1,622 | 2,764 | 3,540 | 3,668 | 2,676 |
| 17 | 3,864 | 1,441 | 2,614 | 3,475 | 3,737 | 2,600 |
| 18 | 3,918 | 1,420 | 2,682 | 3,483 | 3,588 | 2,532 |
| 19 | 3,954 | 1,281 | 2,670 | 3,374 | 3,665 | 2,549 |
| 20 | 3,959 | 1,128 | 2,674 | 3,469 | 3,710 | 2,455 |

Sensitivity analyses
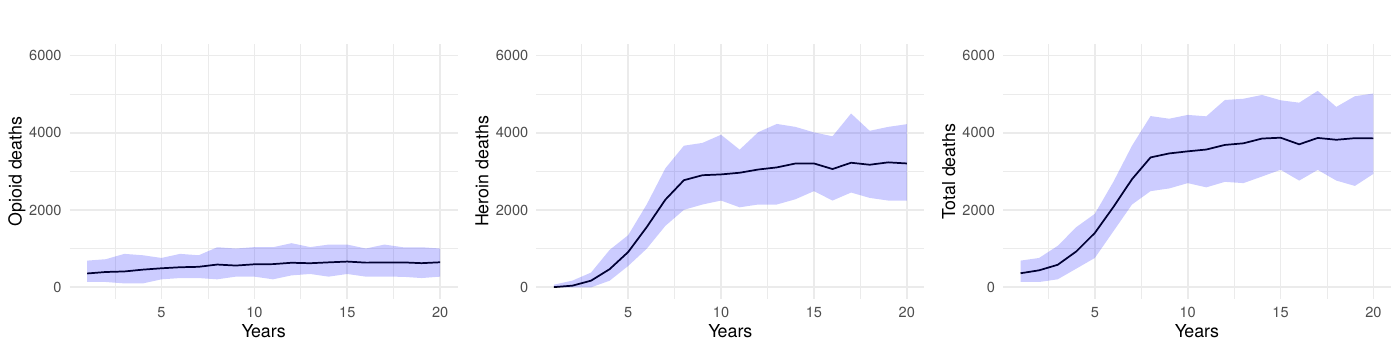
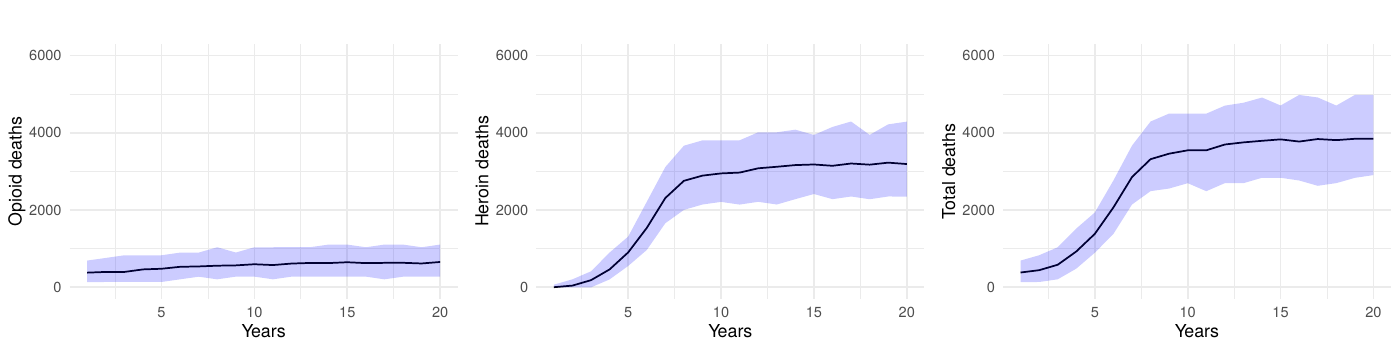
To verify that our findings were not sensitive to the chosen simulation parameters, we conducted an expanded baseline scenario using 200 runs. As illustrated in Figure 8 (100-run simulations) and Figure 9 (200-run simulations), the outcomes for opioid deaths, heroin deaths, and total deaths showed negligible differences between the two approaches. This consistency reinforces our decision to use 10,000 agents and 100 runs for the primary analyses. Finally, all simulation outputs were scaled by the calibration factor to approximate the population-level overdose deaths observed in North Carolina (approximately 10.5 million residents).
We conducted an additional sensitivity analysis focusing on the transition parameters, which are among the largest sources of variability in our model. We replaced the fixed transition probabilities with random draws from Dirichlet distributions, maintaining the baseline means while allowing for 10% variation. Each of the 100 simulation runs used a unique parameter set drawn from these distributions, and 60% simulation intervals for key outcomes (e.g., opioid-related deaths) were generated in the same manner as our main analyses.
Our results illustrated in Figure 10 show additional variation in key outcomes due to these probabilistic transitions, with the 60% simulation intervals largely overlapping those from the baseline runs. This outcome likely arises from two factors: first, the small magnitude of some transition probabilities means a 10% variance has only a modest absolute effect; second, the model’s feedback mechanisms help compensate for short-term fluctuations in transitions. As such, the primary policy-relevant conclusions – especially regarding the time required to observe mortality reductions—remain robust despite inherent uncertainties in transition parameters.
Because the model’s social structure mediates how people discover new sources of opioids, we also varied the average number of friendships assigned during network generation while holding all other parameters constant. The baseline configuration uses a mean of 11 friends per community member. When we lowered the mean to five (Figure 11), total prescription opioid deaths increased by roughly 14% across the simulation period relative to the baseline as agents relied more heavily on medical channels, while heroin/synthetic opioid deaths fell by about 4%. Raising the mean to 15 friends (Figure 12) reversed that pattern—prescription opioid fatalities decreased by approximately 6%, but heroin/synthetic opioid deaths rose by about 4%. This shift matches the model mechanism in which additional friendships create more opportunities for introductions to dealers, whereas sparser networks keep agents dependent on medical supplies. Across both experiments, total overdose mortality remained within \(\pm 2\%\) of the baseline, indicating that our primary findings are robust to plausible shifts in network connectivity even though the mix of prescription versus heroin-related harms changes.
Discussion
The agent-based model presented in this study offers a flexible platform to simulate, analyze, and test specific policies aimed at mitigating the opioid crisis. Its representation of the opioid ecosystem – including community members, physicians, pharmacies, emergency departments, and dealers – allows for a multifaceted exploration of various intervention strategies and their temporal effects on opioid use disorder and attendant fatalities. The adaptability of the model makes it a valuable tool for policymakers, researchers, and healthcare professionals seeking to understand the complex dynamics of opioid use and devise targeted solutions.
The model emphasizes the importance of prevention policies to reduce the progression to opioid misuse and disorder. Without these measures, policies targeting only overdose fatalities fail to address the root cause: opioid misuse. The results also underscore the need for harm reduction policies, as individuals misusing opioids, even without a clinically defined disorder, remain at high risk of overdose.
Our key findings indicate that interventions, even when implemented with immediate effect, do not translate into an instant reduction in opioid-related deaths. There is an observable, substantial delay, which can vary in duration based on the intensity and type of intervention, before a significant downturn in mortality is seen. Even in the most optimistic scenario with complete prevention of transitions to heroin-use disorder among opioid users (scenario 2a), it takes approximately 5 years to achieve a 50% reduction in mortality and a full decade to reach a 71% reduction. For more realistic interventions with 50% effectiveness targeting opioid users (scenario 2b), the timeline extends further, achieving only a 32% reduction after 10 years. This delay underscores the inertia within community and health systems, as changes in policy and public health strategies take time to percolate through the multiple layers of society and individual behavior. Moreover, the temporal dimension of the observed effects highlights the importance of considering long-term horizons when planning, funding, and evaluating public health initiatives. This lag is crucial for stakeholders in understanding the realistic timelines for policy actions to bear fruit, and for setting appropriate expectations for the public and policymakers.
The simulation data also captured the dynamics of the total number of agents engaged in prescription opioid use, those meeting criteria for opioid use disorder, and those averted from transitioning to heroin or synthetic opioid use disorder. Full-scale interventions led to a drastic contraction in opioid use disorder prevalence and a concomitant rise in the number of individuals who did not escalate to a more severe disorder. Critically, our results reveal substantial differences in intervention effectiveness based on target population. Interventions targeting individuals whose opioid use began with prescribed opioids (scenarios 2a and 2b) proved far more effective than those targeting transitions from non-opioid substances (scenarios 3a and 3b), with the latter achieving only modest reductions of 6-12% in mortality after a full decade. This disparity highlights the importance of tailoring prevention strategies to the primary pathways driving the epidemic. The combined intervention (scenario 4), implementing a 50% reduction across both populations, achieved a 38% reduction in total deaths, demonstrating the value of comprehensive approaches while still exhibiting the characteristic delayed effect. Following the implementation of public health strategies, a lag was observed before a reduction in the prevalence of OUD and the incidence of transition to more severe disorders as seen in the simulations. The results suggest that interventions targeting both the prevention of opioid initiation and the transition from occasional to regular heroin use are crucial in the broader strategy to combat the epidemic. Full-scale interventions, while ideal in their objectives, may not be feasible or sustainable in practice; hence, more moderate yet consistent efforts can still yield substantial public health benefits.
The model’s strength lies in its specificity to North Carolina’s context and the granularity of its agent interactions, which provides a realistic framework for understanding the intricate dynamics of opioid use within the state. However, it is critical to acknowledge the limitations inherent in any simulation. Real-world complexities and unexpected factors can alter the course of an epidemic in ways that a model may not fully capture. Additionally, while the model accounts for social networks and their impact on drug use, there are other factors, such as economic changes and policy enforcement practices, that are less easily quantified and incorporated. Our model’s results have natural limitations due to its implementation within an artificial society using hypothetical interventions. Nevertheless, it suggests the limits for idealized scenarios and provides realistic estimates of the effects that could be observed in North Carolina’s population. Artificial societies enable experimentation with potential outcomes and offer informed estimates based on existing knowledge and data.
The present model’s adaptability lays the groundwork for extensive future investigative pursuits. The introduction of geospatial details and the embedding of demographic attributes within agents are identified as immediate opportunities for advancement. Augmenting the model with these elements promises to significantly enhance the granularity and nuance of the simulation, providing a more sophisticated understanding of the patterns of illicit opioid consumption.
Conclusion
This study contributes to the understanding of how ABMs can be leveraged to simulate the complex interplay between opioid use, public health interventions, and their outcomes over time. The results of this study underscore the importance of timely and appropriately scaled interventions in mitigating the impact of opioid misuse while also underscoring that the impact of public health interventions on opioid-related deaths does not occur in immediate response to their implementation. There is an inherent delay in the system that extends over multiple years and must be considered when planning, executing, and communicating the expected benefits of such interventions. Even under the most optimistic intervention scenarios, achieving a 50% reduction in mortality requires approximately 5 years, with the full impact manifesting only after a decade. For more realistic interventions with partial effectiveness, the timeline extends further, with mortality reductions of only 30-40% achievable after 10 years. Early observations of minimal effects from prevention policies do not diminish their value; instead, they indicate that it takes time to see the true impact. Our model will serve as a foundation for modeling and development of more targeted, effective, and time-sensitive strategies with which to combat opioid misuse and its consequences in North Carolina and beyond.
Funding
Research reported in this publication was supported by the National Institute on Drug Abuse of the National Institutes of Health under award number R01DA047994. The content is solely the responsibility of the authors and does not necessarily represent the official views of the National Institutes of Health. The OPOSim model code is available from the corresponding author upon request.Appendix A: Overview, Design Concepts, and Details (ODD)
Terminology and notation
We use the term “opioids” to collectively refer to prescription opioids, heroin, and illicit synthetics. We use “prescription opioids” (PO) to refer to illicitly or legally obtained and manufactured opioids, such as oxycodone. Within the model and throughout this appendix, opioid and heroin dosage is measured using a common unit: morphine milligram equivalents (MME). Throughout the appendix, we use small caps text to refer to submodels or algorithms, italic text to refer to variables, and monospaced text to refer to values.
Purpose and patterns
The purpose of the OPOSim model is to captures the essential dynamics involved in prescription opioid use, progression to disordered use, and uptake of illicit opioids such as heroin. In particular, we aim to explore the dynamics that drive opioid-linked overdose and death primarily at the local (e.g., at the state-level or below) rather than national level; currently, this includes parameters set for North Carolina.
The patterns used to evaluate the model’s realism include trends in opioid-related deaths, initiation rates, progression to opioid use disorder (OUD), and the effects of different prevention and treatment interventions over time.
Entities, state variables, and scales
Entities
The OPOSim model uses five entity types: community members (CMs), physicians, emergency departments (EDs), pharmacies, and dealers.
Community members. Community members are the primary agents of interest within the model. These agents may experience pain, uptake opioid use, engage with the medical system, seek opioids from other CMs, and engage with illicit drug dealers.
Each CM has several associated attributes. Among these are variables to track prescription details (e.g., prescribed-dose, prescription-length), current drug supplies (opioid-supply, heroin-supply), as well as the agent’s internal state (e.g., desire, tolerance, satiation). Table 3 at the end of this section provides an exhaustive list with corresponding descriptions.
A primary attribute which determines how CMs move through the model is use-state. Table 2 summarizes the values use-state can take within the model.
| Value | Description |
|---|---|
none |
No opioid use |
po-comp |
Prescription compliant opioid use |
po-misuse |
Prescription opioid misuse |
OUD |
Opioid use disorder |
HUD |
Heroin/synthetic opioid use disorder |
quit |
Ceasing use of opioids |
CMs are first initialized with no pain, and may later develop acute or chronic pain. Differences in pain-type impact the quantity of prescription opioids needed to treat the underlying pain and the length of treatment needed, both internally and as determined by a physician.
CMs also have variables which associate them with other agents. These include visited physicians (my-physicians), a pharmacy (my-pharmacy), and – if present – a primary dealer (my-dealer). Additionally, CMs may have friendships with other CMs or dealers. These friendships are represented by graph edges.
| Variable | Description | Type |
|---|---|---|
| Agents | ||
my-physicians |
All physicians, sorted by Euclidean distance from the agent | tuple |
my-pharmacy |
Agent's pharmacy | 1-tuple |
my-dealer |
Agent's primary dealer | 1-tuple |
| States and types | ||
pain-type |
Type of pain experienced | text |
use-state |
Current opioid-use behavior | text |
next-use-state |
Next use-state; for transitioning agents between use-states |
text |
prev-use-state |
Previous use-state; for resetting relapsing agents |
text |
treatment-type |
Type of medication for opioid use disorder (MOUD) treatment currently receiving | text |
| Experiment | ||
other-drug-use? |
Agent has use of non-opioids | Boolean |
initial-heroin-user? |
Agent using heroin at initiation of experiment | Boolean |
other-drug-hud-block? |
Agent blocked from developing heroin use disorder, non-opioid drug user | Boolean |
opioid-hud-block? |
Agent blocked from developing heroin use disorder, non-heroin opioid user | Boolean |
first-drug-used |
First drug used (e.g., prescription opioids, heroin) | text |
averted-hud? |
Agent averted from developing heroin use disorder | Boolean |
| Doses and prescribers | ||
prescribed-dose |
Most recent prescribed dose, in MME | float |
required-dose-for-pain |
Dose needed to treat current pain, in MME | float |
PDMP-record |
Totality of available prescribed opioids, in MME | float |
prescription-length |
Length of most recent prescription, in days | integer |
prescribers-rx-list |
List of tuples containing physicians and prescribed doses | tuple |
blocked |
Agent prevented from receiving opioid prescription due PDMP record | Boolean |
| Drug supplies | ||
opioid-supply |
Prescription opioids in possession, in MME | float |
heroin-supply |
Heroin in possession, in MME | float |
total-drug-supply |
Sum of prescription opioids and heroin in possession, in MME | float |
| Internal states | ||
desire |
Current desired amount of opioids, in MME | float |
tolerance |
Current tolerance of opioids, in MME | float |
satiation |
Current level of satiation, bounded by 0 and 1 | float |
| Probabilities | ||
OD-probability |
Probability of overdosing over the day | float |
death-probability |
Probability of dying over the day | float |
relapse-probability |
Probability of relapsing over the day | float |
Physicians. Physicians in the model play a crucial role in opioid prescription management. They have the ability to choose to write prescriptions for opioids, titrate up a patient’s dose, and adhere to CDC guidelines for recommended dose caps.
Variables attached to physicians include the probability of prescribing opioids to a patient initially presenting with either acute or chronic pain (acute-init-prescribed, chronic-init-prescribed respectively), the probability of prescribing to an established patient with acute or chronic pain (acute-prescribing-tendency, chronic-prescribing-tendency), as well as variables related to compliance with Prescription Drug Monitoring Programs (PDMPs) and CDC recommendations (PDMP-compliance and dose-cap-compliance).
| Variable | Description | Type |
|---|---|---|
acute-init-prescribed |
Probability that the physician writes an opioid prescription for a new patient reporting acute pain | float |
chronic-init-prescribed |
Probability that the physician writes an opioid prescription for a new patient reporting chronic pain | float |
acute-prescribing-tendency |
Probability that the physician refills an existing opioid prescription or increases dosage of an opioid to a patient reporting acute pain | float |
chronic-prescribing-tendency |
Probability that the physician refills an existing opioid prescription or increases dosage of an opioid to a patient reporting chronic pain | float |
PDMP-compliance |
Probability that the physician complies with PDMP laws | float |
dose-cap-compliance |
Probability that the physician complies with cap on dosage (< 90 MME/day) | float |
num-pts |
Number of patients seen in the last month | integer |
Emergency departments. Emergency departments are isolated representations of hospital emergency departments. These agent types can distribute prescription opioids directly without including a pharmacy in the loop. Their variables include the probability of distributing prescription opioids to a patient (prescribing-tendency) and complying with CDC recommendations (PDMP-compliance and dose-cap-compliance).
| Variable | Description | Type |
|---|---|---|
prescribing-tendency |
Probability that the ED provides opioids to a patient reporting acute or chronic pain | float |
PDMP-compliance |
Probability that the ED complies with PDMP laws | float |
dose-cap-compliance |
Probability that the ED complies with cap on dosage (< 90 MME/day) | float |
num-pts |
Number of patients seen in the last month | integer |
Pharmacies. Pharmacies fill prescriptions written by physicians by distributing prescription opioids to CMs. Currently, pharmacies are limited to this action alone; in the future, we may allow pharmacies to limit distribution of prescription opioids by way of an additional PDMP check.
| Variable | Description | Type |
|---|---|---|
num-pts |
Number of patients seen in the last month | integer |
Dealers. Dealers in the model supply both prescription opioids and heroin. They manage their inventory, which includes maximum and current levels of heroin and opioid supply, measured in MME. They track the total drug supply available for distribution and the number of customers they have serviced in the past month. Dealers also face the risk of their heroin supply being adulterated with substances like fentanyl, reflecting the unpredictable nature of the illicit drug market.
| Variable | Description | Type |
|---|---|---|
max-heroin-supply |
Heroin that a dealer has when they receive their monthly restock, in MME | float |
max-opioid-supply |
Prescription opioids that a dealer has when they receive their monthly restock, in MME | float |
heroin-supply |
Current amount of heroin dealer has for distribution, in MME | float |
opioid-supply |
Current amount of prescription opioids dealer has for distribution, in MME | float |
total-drug-supply |
Sum of current prescription opioids and heroin dealer has for distribution, in MME | float |
num-customers |
Number of customers dealer has had in the last month | integer |
Environment
Global parameters. The model environment includes numerous global parameters fixed at the start of each simulation. These parameters were established by subject-matter experts after reviewing relevant literature, including gray literature, to determine reasonable estimates. Parameter estimation requires researchers to make decisions about which data to include and how to incorporate it into the model. While inherently subjective, the following guiding principles were used to parameterize the opioid simulation model. A complete list of these global parameters is available in Appendix B.
For parameters related to opioid use disorder in general (e.g., effectiveness of methadone), we relied on peer reviewed literature reporting results from randomized clinical trials or well-conducted observational studies. For parameters that were likely specific to North Carolina (e.g., entry into methadone treatment, probability of overdose), we relied on government reports such as Substance Abuse and Mental Health Services Administration (SAMHSA), Treatment Episode Data Set (TEDS) data for North Carolina, and surveillance reports from the North Carolina Department of Health and Human Services (NC DHHS). Data from the National Survey on Drug Use and Health was also used to inform the model.
We first conducted a literature search using Google, PubMed, and other relevant search engines or databases to identify peer-reviewed literature or government sources relating to the parameter of interest. We reviewed the available data and selected an appropriate parameter. Within an Excel spreadsheet, we documented the category that the parameter relates to (e.g., overdose, treatment), a short description, the value, units or type, last date updated, distribution (e.g., normal, exponential), a citation, URL, and text describing how the parameter was derived.
At least two researchers reviewed each parameter. Parameters that were over ten years old, derived from non-U.S. settings, or lacking sufficient detail or justification were discussed further, typically in team meetings. When specific parameters were not found in the literature, subject matter experts were consulted for additional information. Sensitivity analyses were conducted for parameters with high uncertainty to understand their potential impact on findings.
Spatial properties. Agents are fixed in Euclidean 2-space. The space is abstract and not representative of the geospatial properties of any real location.
Temporal properties. The environment encodes time which is simulated at one-day timesteps.
Process overview and scheduling
Process overview
The model was implemented in NetLogo, hence commands are executed asynchronously. Upon model initialization, agents are assigned an arbitrary unique identifier. Loops acting over all of an agent type (e.g. for all dealers do) act on agents sequentially with respect to their unique identifier.
The OPOSim model operates by simulating daily interactions and decisions of agents over multiple years, allowing for the observation of both immediate and long-term effects of opioid use and interventions. Key processes in the model include:
- Agent Initialization: Agents are created with specific attributes reflecting real-world distributions. These attributes include pain types, prescribed doses, tolerance, and desire levels.
- Daily Behavior Simulation: Each day, agents decide whether to seek drugs, visit healthcare providers, or interact with their social network based on their current state and defined probabilities.
- Drug-Seeking and Use: Agents’ drug-seeking behavior is influenced by their pain levels, tolerance, and social interactions. They may obtain opioids from physicians, dealers, or friends.
- Intervention Implementation: Various interventions such as PDMP compliance, naloxone availability, and MOUD use are applied to assess their impact on opioid misuse and overdose rates.
- State Transitions: Agents transition between states of opioid use (e.g., non-use, prescription compliance, misuse, OUD, HUD) based on probabilistic rules derived from empirical data.
- Feedback Mechanisms: Agents’ behaviors and outcomes (e.g., overdose) influence their future actions and states, creating dynamic feedback loops within the model.
- Emergent Outcomes: Population-level patterns such as overdose rates and the spread of heroin use emerge from the interactions of individual agents.
Scheduling
The model operates on a discrete time-step basis, with each tick representing one day. The sequence of actions within each time-step is as follows:
- Update Plots: Visual representations of key metrics are updated to reflect the current state of the simulation.
- Annual Logging: Every 365 ticks, the model logs opioid and heroin deaths for comparison with ground-truth data.
- Monthly Events: Every 30 ticks, the model resets PDMP records and counts of patients seen by physicians, pharmacies, and EDs. Dealers’ drug supplies are also restocked monthly.
- Daily Agent Actions:
- Behavior Execution: Agents execute behaviors based on their current state, which includes seeking drugs, using drugs, and interacting with other agents.
- State Transitions: Agents may transition to different states based on their interactions and internal conditions.
- Overdose and Death Probability Calculation: For agents using opioids, the probability of overdose is calculated based on their current drug intake, while the probability of death given overdose is a fixed case-fatality rate.
- Intervention Implementation: Apply any interventions that are active in the simulation to influence agent behaviors and outcomes.
- Data Collection: Key metrics such as overdose counts, death rates, and agent state distributions are recorded for analysis.
- Tick Increment: The simulation advances by one day.
Design concepts
Basic principles
The OPOSim model is designed to address the public health crisis of opioid use, focusing on community-level impacts. It is guided by two foundational principles: the influence of social networks and the necessity for dynamic state transitions. To represent the significant role of social interactions, the model includes social network dynamics to simulate how peer influence and connections affect drug use behavior. Additionally, the model incorporates dynamic state transitions, allowing agents to move between states of opioid use (e.g., non-use, prescription compliance, misuse, OUD, and heroin use) based on probabilistic rules. This approach captures the progression and potential recovery paths of individuals. The main progression of CMs through use states is stochastic; its progression is visualized in Figure 13.
Emergence
The OPOSim model simulates the complex dynamics of opioid use and its consequences within a population, allowing for emergent patterns to arise from the interactions of individual agents. At the individual level, agents make decisions based on their personal attributes, pain levels, social influences, and access to opioids. These micro-level interactions and behaviors aggregate to produce macro-level phenomena, such as the spread of opioid misuse, the development of opioid use disorders, and the incidence of overdoses and fatalities.
Adaptation
Primarily, adaptation takes the form of within-agent adaptation: either use-type or physiological. Use-type varies principally according to the transition parameters. Physical adaptation takes place through modulation of a CM’s internal state variables including desire, tolerance, and satiation.
Secondarily, adaptation takes the form of agents adding new dealers to their social network. In short, if agent \(a_0\) receives opioids from a non-dealer friend \(a_1\), who buys from a dealer \(d\), then \(a_1\) will probabilistically introduce \(a_0\) to \(d\), thereby allowing dealers to increase their connectedness within networks. See the visit-friends submodel for further details.
Objectives
CMs seek to maintain a supply of opioids to meet their desire. Those who have been prescribed a prescription seek to maintain an adequate supply of opioids to meet their pain needs.
Learning
Learning is not a component of the model.
Prediction
Prediction is not a component of the model.
Sensing
Agents are able to sense the quantity of their friends’ drug supply. This sensing capability is used to identify friends who might share opioids with the agent, should the agent have an inadequate supply to meet their own needs.
Interaction
In the OPOSim model, there are several types of interactions among agents, primarily focusing on the dynamics of opioid use, acquisition, and social influences. CMs interact directly with healthcare providers, including physicians and EDs, to obtain prescriptions for opioids. These interactions are governed by the CMs’ pain levels and their compliance or misuse tendencies. When visiting a physician or ED, CMs’ current pain state, history of opioid use, and compliance influence the likelihood and quantity of opioids prescribed. Once prescribed, CMs interact with pharmacies to fill their prescriptions. The pharmacies’ roles are to dispense the prescribed opioids, updating the CMs’ opioid supply accordingly.
CMs who misuse opioids or have developed an opioid use disorder interact with dealers to acquire opioids, particularly when their prescriptions are insufficient to meet their needs. These interactions are influenced by the availability of opioids from dealers and the CMs’ current levels of pain, and desire. Dealers respond to CMs’ requests based on their supply, which is periodically restocked.
CMs interact with their peers within their social networks. These interactions include sharing opioids and influencing each other’s drug-seeking behaviors. For example, a CM might be introduced to a dealer through a friend.
Finally, public health interventions such as naloxone availability PDMPs create indirect interactions among CMs, healthcare providers, and the community. Naloxone distribution affects the overdose outcomes of CMs, while PDMPs influence the prescribing behavior of physicians and the drug-seeking behavior of CMs by monitoring and limiting access to opioids.
Stochasticity
Stochasticity is used throughout the model. To simulate random events taking place, the model compares the parameter representing the probability of an event occurring to values generated by a random number generator.
Collectives
Collective action is not an explicit component of the model. However, throughout the model use-state act as crucial determinants of action, and may therefore be thought of as a type of collection.
Observation
The primary outcomes of interest which are monitored throughout a model run are
- Opioid-linked overdoses (ODs),
- Opioid-linked deaths,
- Heroin-linked ODs,
- Heroin-linked deaths,
as well as,
- Satiation,
- Desire,
- Drug supplies.
Initialization
The procedure is called a single time prior to the start of the model run. This initialization process sets up the simulation environment, defining global parameters, creating agent populations, and establishing initial conditions. This includes setting up trackers, prescribing parameters, intervention measures, MOUD probabilities, drug acquisition probabilities, and social network parameters.
Setting global parameters
Global parameters are initialized using the global-parameters submodel. This includes trackers for opioid overdoses, deaths, agent counts in different states, and logs of annual deaths. Parameters for prescribing tendencies, intervention compliance, MOUD probabilities, drug acquisition behaviors, and social network configurations are defined to ensure accurate simulation behavior.
Creating agent populations
Agents are created with specific attributes reflecting real-world distributions. This involves defining agent types, such as community members, physicians, dealers, and emergency departments, each with unique characteristics and behaviors.
Initial conditions
Agents are assigned initial conditions based on the defined parameters. This includes initial drug supplies, pain types, prescribed doses, tolerance, and desire levels.
The social network is established by linking agents according to the specified minimum and average number of friends. Friendship networks among agents are created by first determining the existing friendships for each agent. The number of potential friends is calculated by counting other CMs and dealers in the network. Each agent then calculates the number of new friendships to create, using a normal distribution around the average number of friends, adjusted by the minimum number of friends and existing friendships. Finally, agents create friendships with a subset of potential friends, including both other CMs and dealers, enabling a realistic social network within the simulation.
Assigning states and probabilities
Each agent is assigned an initial state, such as none, po-comp, po-misuse, OUD, or HUD, based on defined transition probabilities. These states determine the agent’s behavior and interactions within the simulation.
Establishing drug supplies
Dealers are stocked with initial supplies of heroin and prescription opioids, while agents may have personal supplies based on their state and previous interactions. These supplies are adjusted according to the parameters set during initialization.
Setting up logs
Logs for tracking various events, such as overdoses and deaths, are initialized to record the simulation’s progression.
Input data
The input data for the simulation are primarily the parameters that define the initial conditions and guide the behavior of agents within the model. Global parameters are initialized using the global-parameters submodel. This includes trackers for opioid overdoses, deaths, agent counts in different states, and logs of annual deaths. Parameters for prescribing tendencies, intervention compliance, MOUD probabilities, drug acquisition behaviors, and social network configurations are defined to ensure accurate simulation behavior. Appendix B provides the complete list of parameters used within the model.
Submodels
In our NetLogo model, the following key submodels are contained in individual .nls files sharing the name of the submodel.
global-parameters
This submodule initializes all global parameters and trackers used in the simulation. It sets default values for various variables related to opioid use, prescribing tendencies, interventions, treatments, drug acquisition probabilities, social networks, and transition probabilities between states.
go
The go function in NetLogo models typically serves as the main simulation loop, advancing the simulation through time by repeatedly executing agent behaviors and updating the environment. In our particular model, the go submodule manages the progression of time, handles periodic events (daily, monthly, annually), checks for end conditions, logs key metrics, implements interventions, updates agent states, and computes statistics to reflect the current state of the simulation.
Process Overview
- Update Plots:
- Refresh the simulation plots.
- Check Simulation End:
- Stop the simulation if the ticks reach the time-limit.
- Log Annual Opioid Deaths:
- Annually record opioid and heroin deaths for comparison to ground-truth data.
- Monthly Events:
- Reset PDMP-record for CMs and num-pts for physicians, pharmacies, and EDs.
- Restock dealers’ drug supplies and reset num-customers.
- Implement Interventions at Year 10:
- At
ticks = 3650, initialize other drug use for some agents and block HUD development based on probabilities.
- At
- Daily Events:
- Update agents’ death-probability if use-state is
none. - Transition agents between use states using switch-use-states.
- Execute actions based on agents’ use-state (
po-comp,po-misuse,OUD,HUD,quit).
- Update agents’ death-probability if use-state is
- Update Labels:
- Set labels for EDs, physicians, pharmacies, dealers, and CMs to reflect current statistics.
- Compute Statistics:
- Calculate total overdoses, deaths, opioid agents, heroin agents, OUD agents, and averted HUD cases.
- Increment Time:
- Advance the simulation clock by one tick.
initialize-po-misuse
This submodule initializes opioid misuse for agents, setting their desire and tolerance levels and potentially assigning them a dealer. It ensures agents have the necessary attributes to model prescription opioid misuse.
Process Overview
- Set Desire and Tolerance:
- If an agent’s desire is less than 1, set the agent’s desire to a value drawn from a normal distribution with a mean of 25 and a standard deviation of 5, ensuring the value is non-negative.
- Set the agent’s tolerance equal to their desire.
- Assign Dealer:
- Check the agent’s social network (friends) to see if any are connected to a dealer. If a dealer-connected friend is found, assign this friend as the agent’s dealer.
- If no dealer-connected friend is found, assign a random dealer from the entire pool of available dealers.
po-comp
This submodule simulates the behavior of prescription opioid-compliant (po-comp) agents as they seek and take opioids. It handles the process of obtaining opioids from a physician and pharmacy, updating internal states, and assessing the risk of overdose and death.
Process Overview
- Seek Opioids:
- If the opioid-supply is zero, less than the prescribed-dose, or if the prescribed-dose is less than the required-dose-for-pain, the agent visits their primary care physician using visit-physician and then the pharmacy using visit-pharmacy to obtain opioids.
- Take Opioids:
- Calculate the amount of prescription opioids to take, which is the rounded minimum of the prescribed-dose and total-drug-supply.
- Update Internal States:
- Update tolerance based on the amount of opioids taken.
- Update desire as a function of tolerance and desire-tolerance-ratio.
- Update satiation.
- Update Opioid Supply:
- Reduce the opioid-supply by the amount taken.
- Calculate Overdose and Death Probabilities:
- Calculate OD-probability based on the amount of opioids taken.
- Set death-probability to the fixed case-fatality rate (
overdose-fatality-prob).
- Handle Overdose:
- If an overdose occurs (based on OD-probability), increment the overdose count.
- Determine if the agent dies from the overdose, considering the availability and effectiveness of naloxone.
po-misuse
This submodule manages the behavior of prescription opioid misuse (po-misuse) agents, focusing on their actions to seek and take drugs. It explicitly calls the seek-drugs and take-drugs submodules.
Process Overview
- Seek Drugs:
- Call the seek-drugs submodule to find and obtain drugs from various sources such as friends, physicians, dealers, or emergency departments.
- Take Drugs:
- Call the take-drugs submodule to consume the obtained drugs, update internal states, and calculate the risks of overdose and death.
quit
This submodule simulates the behavior of agents attempting to quit drug use. It handles the reduction of drug supply, the assignment of treatment types, and the probability of relapse.
Process Overview
- Discard Heroin:
- Set heroin-supply to
0, discarding any heroin in possession.
- Set heroin-supply to
- Reduce Tolerance and Desire:
- Decrease tolerance to
0using new-tolerance.
- Decrease tolerance to
- Assign Treatment Type:
- If the agent has no assigned treatment-type and a random check against treatment-rate is successful, assign a treatment type based on treatment-access.
- Use weighted-prob to assign one of the treatment types:
methadone,buprenorphine, ornaltrexonewith respective probabilities.
- Record Relapse Probability:
- Set relapse-probability based on the relapse-prob.
- Handle Relapse:
- If a random check against relapse-prob is successful, the agent relapses, resetting treatment-type to
noneand reverting to the previous use state using initialize-po-misuse.
- If a random check against relapse-prob is successful, the agent relapses, resetting treatment-type to
request-drugs
This submodule simulates the process of an agent requesting drugs from another agent, such as a dealer or a friend. It tracks the amount of drugs requested, the amount filled, and updates the respective supplies of both the requester and the requestee. For agents using heroin, it prioritizes fulfilling the request with heroin before seeking prescription opioids. This submodel ensures that the requester receives the requested drugs up to the maximum available supply from the requestee.
Process Overview
- Initialize Request:
- Set orig-request to the amount initially requested.
- Initialize filled-request to
0.
- Update Customer Count:
- Increment the num-customers of the requestee by 1.
- Handle Heroin Request:
- If the agent’s use-state is
HUDand the requestee has heroin supply, fill the request with the available heroin up to the requested amount. - Adjust the heroin-supply of both the requester and requestee accordingly.
- If the agent’s use-state is
- Update Request for Opioids:
- Adjust the request amount by subtracting the filled heroin request.
- Reset filled-request to
0for tracking opioid requests separately.
- Handle Opioid Request:
- If the requestee has opioid supply, fill the request with the available opioids up to the remaining requested amount.
- Adjust the opioid-supply of both the requester and requestee accordingly.
seek-drugs
This submodule models the behavior of prescription opioid misuse (po-misuse) agents as they seek drugs. It determines the source of drugs based on probabilities and updates the agent’s drug-seeking behavior accordingly.
Process Overview
- Evaluate Drug Supply:
- If total-drug-supply is
0, less than prescribed-dose, less than desire, or if prescribed-dose is less than required-dose-for-pain, the agent seeks drugs.
- If total-drug-supply is
- Determine Source of Drugs:
- Select a source to visit based on the following probabilities:
friendswith probability visit-friends-probone-phywith probability visit-one-phy-probmulti-phywith probability visit-multi-phy-probdealerwith probability visit-dealer-probEDwith probability visit-ED-prob
- Select a source to visit based on the following probabilities:
- Visit Friends:
- If the selected source is
friends, call visit-friends.
- If the selected source is
- Visit One Physician:
- If the selected source is
one-phy, visit a random physician and then call visit-pharmacy.
- If the selected source is
- Visit Multiple Physicians:
- If the selected source is
multi-phy, cycle through a random subset of physicians sequentially, calling visit-physician and visit-pharmacy for each.
- If the selected source is
- Visit Dealer:
- If the selected source is
dealer, call visit-dealer.
- If the selected source is
- Visit Emergency Department (ED):
- If the selected source is
ED, call visit-ED.
- If the selected source is
switch-use-states
This submodule manages the transition of agents between different states of drug use, which can include forward transitions (towards increased use) and backward transitions (towards decreased use). Transition parameters dictate the movement between states.
Process Overview
- Initialize Agents:
- If next-use-state is
none, set prev-use-state to the current use-state, then set use-state tonone. - Reset prescription-related variables.
- Update next-use-state based on transition probabilities.
- If next-use-state is
- Move to Prescription Compliant Use:
- Transition to
po-compstate. Set prev-use-state to the current use-state and use-state topo-comp. - If first-drug-used is
none, set it topo. - If pain-type is
none, randomly determine if the pain is chronic or acute:- If chronic, set pain-type to
chronic, prescription-length to chronic-prescription-length, required-dose-for-pain to a value from a normal distribution centered on mean-chronic-pain with a standard deviation of 20, and not less than 10, set desire to required-dose-for-pain. - If acute, set pain-type to
acute, prescription-length to acute-prescription-length, required-dose-for-pain to a value from a normal distribution centered on mean-acute-pain with a standard deviation of 10, and not less than 10, set desire to required-dose-for-pain.
- If chronic, set pain-type to
- Update next-use-state based on transition probabilities.
- Transition to
- Move to Prescription Noncompliant Use:
- Transition to
po-misusestate. Set prev-use-state to the current use-state and use-state topo-misuse. - If first-drug-used is
none, set it topo. - Call initialize-po-misuse.
- Update next-use-state based on transition probabilities.
- Transition to
- Move to Prescription Opioid Use Disorder (
OUD):- Transition to
OUDstate. Set prev-use-state to the current use-state and use-state toOUD. - If first-drug-used is
none, set it toopioids. - Call initialize-po-misuse.
- Update next-use-state based on transition probabilities.
- Transition to
- Move to Heroin/Synthetic Opioid Use Disorder (
HUD):- Transition to
HUDstate and update prev-use-state. - Check if agent has been blocked from developing
HUDafter 10 years. If so, revert to prev-use-state and mark asaverted-hud?. - Otherwise, set use-state to
HUD, set first-drug-used toheroinif not already set, and call initialize-po-misuse. - Update next-use-state based on transition probabilities.
- Transition to
- Move to Quitting:
- Transition to
quitstate. Set prev-use-state to the current use-state if it is not alreadyquit. - Set use-state to
quit.
- Transition to
take-drugs
This submodule simulates agents with illicit or non-prescription drug use, including polydrug use (heroin and prescription opioids). It is not intended for prescription-compliant agents. It calculates the amount of drugs taken, updates drug supplies and internal states, and evaluates the probabilities of overdose and death.
Process Overview
- Initialize Drug Amounts:
- Set heroin-to-take and rx-opioids-to-take to
0. - Determine amount-to-take as the rounded minimum of desire and total-drug-supply.
- Set heroin-to-take and rx-opioids-to-take to
- Determine Heroin Amount:
- Agents using heroin will first draw from any heroin supply on hand before drawing from their opioid supply.
- If use-state is
HUD, calculate heroin-to-take as the minimum of the desired amount (adjusted for imprecision) and heroin-supply. The amount taken is imprecise, reflecting variations in quality and potential contamination, typically around the desired amount.
- Determine Prescription Opioid Amount:
- If heroin-to-take exceeds amount-to-take, set rx-opioids-to-take to
0. - Otherwise, calculate rx-opioids-to-take as the minimum of the remaining desired amount and opioid-supply.
- If heroin-to-take exceeds amount-to-take, set rx-opioids-to-take to
- Update Drug Supplies:
- Update heroin-supply and opioid-supply by subtracting the respective amounts taken, then update total-drug-supply.
- Update Internal States:
- Update tolerance, desire, and satiation based on the total amount of drugs taken.
- Calculate Overdose and Death Probabilities:
- Calculate OD-probability based on the total amount of drugs taken.
- If heroin is taken, adjust OD-probability with the heroin overdose rate multiplier.
- Set death-probability to the fixed case-fatality rate (
overdose-fatality-prob).
- Handle Overdose:
- If an overdose occurs (based on OD-probability), increment the respective overdose count.
- Determine if the agent dies from the overdose, factoring in the availability and effectiveness of naloxone.
visit-dealer
This submodule simulates an agent visiting their dealer to request a week’s worth of drugs, ensuring the agent can maintain their drug supply. It also handles situations where the dealer cannot meet the agent’s demand, prompting the agent to seek drugs from other dealers in their social network.
Process Overview
- Request Drugs from Dealer:
- Calculate the agent’s weekly drug request based on their desire.
- Request the calculated amount from the agent’s dealer. The request is make using the request-drugs submodel, which can be consulted for more information.
- Seek New Dealer if Needed:
- If the dealer cannot provide the desired quantity, the agent seeks a new ad hoc dealer from their social network.
- If a friend who is a dealer has enough supply, the agent requests drugs from this new dealer.
visit-ED
This submodule simulates an agent visiting an emergency department to seek opioids. It models the decision-making process of the ED in prescribing opioids, considering factors such as prescribing tendencies, dose cap compliance, and PDMP checks. Note that the ED does not write prescriptions to be filled through a pharmacy and issues only a single day’s prescription.
Process Overview
- Select ED:
- The agent visits a randomly chosen ED from the list of available EDs.
- Initialize Prescription:
- Initialize current-rx to
0. - If the agent is a new patient and does not have an assigned pain type, set pain-type to
acuteand prescription-length to acute-prescription-length.
- Initialize current-rx to
- ED Prescription Decision:
- If the ED decides to prescribe (based on prescribing-tendency), determine current-rx by sampling from a normal distribution with a mean of mean-ED-rx and a standard deviation of 19.5 MME, ensuring a minimum of 10 MME.
- Dose Cap Check:
- If the ED complies with the dose cap (90 MME/day), reduce current-rx to 90 MME if it exceeds this limit.
- PDMP Check:
- If the ED performs a PDMP check and finds the agent’s combined prescription exceeds 90 MME/day, they will not prescribe any additional opioids.
- Update the PDMP-record by adding the current-rx.
- Update Supplies:
- Update the agent’s opioid-supply by adding current-rx.
- Track ED Visits:
- Increment the number of patient visits to the ED for that month.
visit-friends
This submodule simulates an agent visiting a friend to obtain drugs when their own supply is insufficient. It helps model the social dynamics of drug acquisition and potential introduction to new dealers through social networks.
Process Overview
- Request Drugs from Friend:
- Determine the amount of drugs needed to meet the agent’s desire.
- Identify a friend who has more than the desired amount of drugs and is not a dealer.
- Request a day’s worth of drugs from the identified friend. The request is made to this friend using the request-drugs submodel. The agent only asks their friend for a day’s worth of opioids, which differs from requests made to dealers.
- Connect with Friend’s Dealer:
- If the friend has a dealer, add the dealer to the agent’s friend network.
visit-pharmacy
This submodule simulates the process of an agent visiting a pharmacy to fill their opioid prescription. It updates the agent’s opioid supply based on the prescribed dose and prescription length and increments the pharmacy’s patient count.
Process Overview
- Update Opioid Supply:
- Increase the agent’s opioid supply by the amount calculated as the product of the prescribed dose and the prescription length.
- Increment Patient Count:
- Ask the agent’s pharmacy to increment its patient count by one.
visit-physician
This submodule simulates an agent visiting a physician to obtain or adjust an opioid prescription. It ensures efficient decision-making for known and new patients, incorporating dose titration, dose cap compliance, and PDMP checks.
Process Overview
- Identify Known Patients:
- The agent chooses a physician to visit. The physician checks if the agent is a returning patient by looking up their current (last written) prescription.
- If the physician is a known prescriber, retrieve the agent’s current prescription.
- Dose Adjustment for Returning Patients:
- If the patient reports still being in pain with the current prescription, the physician may up-titrate the dose, considering acute or chronic prescribing tendencies and ensuring a minimum of 10 MME.
- The dose increase is governed by the acute prescribing tendency or chronic prescribing tendency parameters of the physician.
- The doses prescribed for acute and chronic pain differ and are centered around mean-acute-pain-Rx or mean-chronic-pain-Rx parameters.
- Initial Prescription for New Patients:
- If the agent is a new patient, the physician probabilistically determines whether to prescribe opioids based on acute or chronic prescribing tendency (acute-init-prescribed or chronic-init-prescribed parameters).
- If prescribing, the dose is sampled from a normal distribution centered on mean-acute-pain-Rx or mean-chronic-pain-Rx parameters, with a minimum of 10 MME.
- If the agent’s pain type is not already assigned, set it to acute with the corresponding prescription length.
- Dose Cap Check:
- If the prescribed dose exceeds 90 MME/day and the physician complies with the dose cap, the prescription is reduced to 90 MME per CDC recommendations.
- PDMP Check:
- If a PDMP check is performed and the patient’s combined prescriptions exceed 90 MME/day, no new prescription is given.
- If a new prescription is written, update the PDMP-record to reflect the new prescription.
- Update Records:
- Update the patient’s prescription list and the physician’s patient visit count.
- Set the current prescription to the prescribed-dose.
reporters
The reporters file is not, strictly speaking, a submodel; rather, it provides a collection of functions that can be called throughout the OPOSim model. The following algorithms are contained within this file.
OD-prob
This algorithm calculates the probability of an overdose given a specific dosage amount using a sigmoidal dose-response function. The sigmoidal model captures the nonlinear relationship between opioid dosage and overdose risk, with probability approaching zero at low doses and approaching one at high doses. The algorithm takes into account the treatment type of the agent and scales the annual overdose rate to a daily rate.
Process Overview
- Initialize Probability:
- Set the initial prob to
0.
- Set the initial prob to
- Calculate Overdose Probability:
- Use a sigmoidal model based on overdose data: \[ \begin{aligned} \Pr(\text{OD} \mid \text{dose} = \textit{amount}) &= \left[ 1 + \exp\Bigl( \textit{overdose-prob-a} \right. \\ &\qquad \left. \bigl(\textit{overdose-prob-b} - \textit{amount}\bigr) \Bigr) \right]^{-1} \end{aligned} \] where overdose-prob-a is a calibration parameter that controls the steepness of the sigmoid curve (how rapidly overdose probability increases with dose), and overdose-prob-b represents the inflection point of the sigmoid (in MME). These parameters were calibrated to match observed overdose patterns in the data and absorb various sources of model uncertainty.
- Adjust for Treatment Type:
- If the agent’s treatment-type is
methadone, set prob to methadone-OD-prob. - If the agent’s treatment-type is
buprenorphine, set prob to buprenorphine-OD-prob. - If the agent’s treatment-type is
naltrexone, set prob to naltrexone-OD-prob.
- If the agent’s treatment-type is
- Scale to Daily Rate:
- Divide the annual probability by
365to get a daily overdose probability.
- Divide the annual probability by
death-prob
This algorithm calculates the probability of death given that an overdose has occurred. The model uses a fixed case-fatality rate rather than a dose-dependent probability, as the overdose probability itself has been calibrated to match observed mortality patterns.
Process Overview
- Set Fixed Mortality Rate:
- The probability of death conditional on overdose is set to a fixed value controlled by the
overdose-fatality-probparameter. - This fixed rate reflects the case-fatality rate of opioid overdoses and is independent of dosage.
- The probability of death conditional on overdose is set to a fixed value controlled by the
- Rationale:
- Since the overdose probability (OD-prob) has been calibrated to reproduce observed mortality trajectories, the death probability conditional on overdose is held constant.
- This approach separates the risk of experiencing an overdose (dose-dependent) from the likelihood that an overdose proves fatal (fixed rate).
relapse-prob
This algorithm calculates the probability that an agent who is quitting non-prescription opioid use will relapse. The probability is based on the agent’s satiation level and their treatment type.
Process Overview
- Initialize Probability:
- Set the initial prob to
0.
- Set the initial prob to
- Calculate Base Relapse Probability:
- If the agent’s treatment-type is not
none, calculate the base relapse probability as a function of satiation: \[\textit{prob} = \text{max-relapse-prob} - (\textit{satiation} \times (\text{max-relapse-prob} - (\text{max-relapse-prob} / 100)))\]
- If the agent’s treatment-type is not
- Adjust for Treatment Type:
- If the agent’s treatment-type is
methadone, set prob to methadone-relapse-prob. - If the agent’s treatment-type is
buprenorphine, set prob to buprenorphine-relapse-prob. - If the agent’s treatment-type is
naltrexone, set prob to naltrexone-relapse-prob.
- If the agent’s treatment-type is
- Scale to Daily Rate:
- Divide the annual probability by
365to get a daily relapse probability.
- Divide the annual probability by
new-satiation
This algorithm updates the satiation level of an agent when they take opioids. Satiation reflects how well the agent’s current drug supply meets their desire.
Process Overview
- Check Zero Desire:
- If the agent’s desire is
0, the algorithm sets satiation to1and returns.
- If the agent’s desire is
- PO-Compliant Agents:
- If the agent’s use-state is
po-comp, the algorithm calculates sat as the ratio of prescribed-dose or total-drug-supply to desire, ensuring it is precision-adjusted to two decimal places. - It returns the minimum of
1and sat.
- If the agent’s use-state is
- Illicit Opioid Use Agents:
- If total-drug-supply is greater than or equal to desire, satiation is set to
1. - If total-drug-supply is less than desire, the algorithm calculates sat as the maximum of the ratio of total-drug-supply to desire or the agent’s current satiation multiplied by
0.95, ensuring it is precision-adjusted to two decimal places. - It returns the minimum of
1and sat.
- If total-drug-supply is greater than or equal to desire, satiation is set to
new-tolerance
This algorithm calculates the new tolerance level for an agent when they stop taking opioids. The tolerance decays gradually based on the agent’s tolerance-inertia and the total amount of opioids taken.
Process Overview
- Calculate New Tolerance:
- Compute the new tolerance as:
\[\textit{tol} = \textit{tolerance} + (\textit{tolerance-inertia} \times (\textit{total-opioids-to-take} - \textit{tolerance}))\] - The result is precision-adjusted to two decimal places.
- Compute the new tolerance as:
- Return New Tolerance:
- Return the calculated tol.
Appendix B: Model Parameters
See attached .xlsx file: https://www.jasss.org/29/1/5/Appendix_B._OPOSim_Model_Parameters.xlsx.
References
ADAMS, J. W., Duprey, M., Khan, S., Cance, J., Rice, D. P., & Bobashev, G. (2023). Examining buprenorphine diversion through a harm reduction lens: An agent-based modeling study. Harm Reduction Journal, 20(150). [doi:10.1186/s12954-023-00888-6]
ALTEKRUSE, S. F., Cosgrove, C. M., ALTEKRUSE, W. C., Jenkins, R. A., & Blanco, C. (2020). Socioeconomic risk factors for fatal opioid overdoses in the United States: Findings from the Mortality Disparities in American Communities Study (MDAC). PLoS One, 15(1), e0227966. [doi:10.1371/journal.pone.0227966]
BOBASHEV, G., Goree, S., Frank, J., & Zule, W. (2018). Pain town, an agent-based model of opioid use trajectories in a small community. In R. Thomson, C. Dancy, A. Hyder, & H. Bisgin (Eds.), Social, Cultural, and Behavioral Modeling. SBP-BRiMS 2018. Lecture Notes in Computer Science (Vol. 10899, pp. 274–285). Berlin Heidelberg: Springer. [doi:10.1007/978-3-319-93372-6_31]
BOBASHEV, G. V., Hoffer, L., & Lamy, F. R. (2020). Agent-based modeling to delineate opioid and other drug use epidemics. In Y. Apostolopoulos, K. H. Lich, & M. K. Lemke (Eds.), Complex Systems and Population Health (pp. 201–214). Oxford: Oxford University Press. [doi:10.1093/oso/9780190880743.003.0014]
DASGUPTA, N., Beletsky, L., & Ciccarone, D. (2018). Opioid crisis: No Easy fix to its social and economic determinants. American Journal of Public Health, 108, 182–186. [doi:10.2105/ajph.2017.304187]
DOWELL, D., Ragan, K. R., Jones, C. M., Baldwin, G. T., & Chou, R. (2022). CDC clinical practice guideline for prescribing opioids for pain — United States, 2022. MMWR Recommendations and Reports, 71(RR-3), 1–95. [doi:10.15585/mmwr.rr7103a1]
ENNETT, S. T., Faris, R., Hipp, J., Foshee, V. A., Bauman, K. E., Hussong, A., & Cai, L. (2008). Peer smoking, other peer attributes, and adolescent cigarette smoking: A social network analysis. Prevention Science, 9(2), 88–98. [doi:10.1007/s11121-008-0087-8]
FERRER-PÉREZ, C., Montagud-Romero, S., & Blanco-Gandía, M. C. (2024). Neurobiological theories of addiction: A comprehensive review. Psychoactives, 3(1), 35–47.
GOLDSTEIN, A. (2001). Addiction: From Biology to Drug Policy. Oxford: Oxford University Press.
GRIMM, V., Berger, U., Bastiansen, F., Eliassen, S., Ginot, V., Giske, J., Goss-Custard, J., Grand, T., Heinz, S. K., Huse, G., Huth, A., Jepsen, J. U., Jørgensen, C., Mooij, W. M., Müller, B., Pe’er, G., Piou, C., Railsback, S. F., Robbins, A. W., … DeAngelis, D. L. (2006). A standard protocol for describing individual-based and agent-based models. Ecological Modelling, 198(1), 115–126. [doi:10.1016/j.ecolmodel.2006.04.023]
GRIMM, V., Railsback, S. F., Vincenot, C. E., Berger, U., Gallagher, C., DeAngelis, D. L., Edmonds, B., Ge, J., Giske, J., Groeneveld, J., Johnston, A. S. A., Milles, A., Nabe-Nielsen, J., Polhill, J. G., Radchuk, V., Rohwäder, M.-S., Stillman, R. A., Thiele, J. C., & Ayllón, D. (2020). The ODD protocol for describing agent-based and other simulation models: A second update to improve clarity, replication, and structural realism. Journal of Artificial Societies and Social Simulation, 23(2), 7. [doi:10.18564/jasss.4259]
GUTKIN, B., & Ahmed, S. H. (2012). Computational Neuroscience of Drug Addiction. Berlin Heidelberg: Springer.
HAYDEN, J. A., Ellis, J., Asbridge, M., Ogilvie, R., Merdad, R., Grant, D. A. G., Stewart, S. A., & Campbell, S. (2021). Prolonged opioid use among opioid-naive individuals after prescription for nonspecific low back pain in the emergency department. Pain, 162(3), 740–748. [doi:10.1097/j.pain.0000000000002075]
HENNEBERGER, A. K., Mushonga, D. R., & Preston, A. M. (2021). Peer influence and adolescent substance use: A systematic review of dynamic social network research. Adolescent Research Review, 6, 57–73. [doi:10.1007/s40894-019-00130-0]
HOFFER, L. (2005). Junkie Business: The Evolution and Operation of a Heroin Dealing Network. Boston, MA: Cengage Learning.
HOFFER, L., & Bobashev, G. V. (2009). Researching a local heroin market as a complex adaptive system. American Journal of Community Psychology, 44(3–4), 273–286. [doi:10.1007/s10464-009-9268-2]
HOFFER, L., Bobashev, G. V., & Morris, R. J. (2012). Simulating patterns of heroin addiction within the social context of a local heroin market. In B. Gutkin & S. H. Ahmed (Eds.), The Computational Neuroscience of Drug Addiction (pp. 313–331). Berlin Heidelberg: Springer. [doi:10.1007/978-1-4614-0751-5_11]
IRVINE, M. A., Buxton, J. A., Otterstatter, M., Balshaw, R., Gustafson, R., Tyndall, M., Kendall, P., Kerr, T., Gilbert, M., & Coombs, D. (2018). Distribution of take-home opioid antagonist kits during a synthetic opioid epidemic in British Columbia, Canada: A modelling study. The Lancet Public Health, 3(5), e218–e225. [doi:10.1016/s2468-2667(18)30044-6]
JALALI, M. S., Botticelli, M., Hwang, R. C., & others. (2020). The opioid crisis: A contextual, social-ecological framework. Health Research Policy and Systems, 18(87). [doi:10.1186/s12961-020-00596-8]
KARIISA, M., Davis, N. L., Kumar, S., & others. (2022). Vital signs: Drug overdose deaths, by selected sociodemographic and social determinants of health characteristics — 25 states and the district of columbia, 2019-2020. MMWR Morbidity and Mortality Weekly Report, 71, 940–947. [doi:10.15585/mmwr.mm7129e2]
KEANE, C., Egan, J. E., & Hawk, M. (2018). Effects of naloxone distribution to likely bystanders: Results of an agent-based model. International Journal of Drug Policy, 55, 61–69. [doi:10.1016/j.drugpo.2018.02.008]
LIM, T. Y., Stringfellow, E. J., Stafford, C. A., DiGennaro, C., Homer, J. B., Wakeland, W., Eggers, S. L., Kazemi, R., Glos, L., Ewing, E. G., Bannister, C. B., Humphreys, K., Throckmorton, D. C., & Jalali, M. S. (2022). Modeling the evolution of the US opioid crisis for national policy development. Proceedings of the National Academy of Sciences, 119(23), e2115714119. [doi:10.1073/pnas.2115714119]
MONTGOMERY, S. C., Donnelly, M., Bhatnagar, P., Carlin, A., Kee, F., & Hunter, R. F. (2020). Peer social network processes and adolescent health behaviors: A systematic review. Preventive Medicine, 130, 105900. [doi:10.1016/j.ypmed.2019.105900]
NATIONAL Center for Health Statistics. (2022). U.S. Overdose deaths in 2021 increased half as much as in 2020 – But are still up 15%. Available at: https://www.cdc.gov/nchs/pressroom/nchs_press_releases/2022/202205.htm
NORTH Carolina Department of Health and Human Services. (2024). Overdose data. Available at: https://injuryfreenc.dph.ncdhhs.gov/DataSurveillance/Overdose.htm
PITT, A. L., Humphreys, K., & Brandeau, M. L. (2018). Modeling health benefits and harms of public policy responses to the us opioid epidemic. American Journal of Public Health, 108, 1394–1400. [doi:10.2105/ajph.2018.304590]
PREISS, A., Berghammer, A., & Bobashev, G. (2022). Virtual opioid user: Reproducing opioid use phenomena with a control theory model. Proceedings of the Winter Simulation Conference (WSC ’22). [doi:10.1109/wsc57314.2022.10015450]
STRANG, J., Volkow, N. D., Degenhardt, L., Hickman, M., Johnson, K., Koob, G. F., Marshall, B. D. L., Tyndall, M., & Walsh, S. L. (2020). Opioid use disorder. Nature Reviews Disease Primers, 6(3). [doi:10.1038/s41572-019-0137-5]
SUBSTANCE Abuse and Mental Health Services Administration. (2023). SAMHSA announces national survey on drug use and health results detailing mental illness, substance use levels in 2021. https://www.hhs.gov/about/news/2023/01/04/samhsa-announces-national-survey-drug-use-health-results-detailing-mental-illness-substance-use-levels-2021.html
TABATABAI, M., Cooper, R. L., Wilus, D. M., Edgerton, R. D., Ramesh, A., MacMaster, S. A., Patel, P. N., & Singh, K. P. (2023). The effect of naloxone access laws on fatal synthetic opioid overdose fatality rates. Journal of Primary Care & Community Health, 14, 21501319221147246. [doi:10.1177/21501319221147246]
VOLKOW, N. D., Koob, G. F., & McLellan, A. T. (2016). Neurobiologic advances from the brain disease model of addiction. New England Journal of Medicine, 374(4), 363–371. [doi:10.1056/nejmra1511480]
WILENSKY, U. (1999). NetLogo. Center for Connected Learning and Computer-Based Modeling, Northwestern University, Evanston, IL. Retrieved from: http://ccl.northwestern.edu/netlogo/