Modeling Sentiment Spread in Reddit's Financial Communities Through Epidemiological and Deep Learning Approaches

,
,
and
aUniversity of Turin, Physics Department, Turin, Italy; bFIDA srl, Turin, Italy; cUniversity of Turin, Computer Science Department, Turin, Italy; dINFN Section of Turin, Italy.
Journal of Artificial
Societies and Social Simulation 29 (2) 3
<https://www.jasss.org/29/2/3.html>
DOI: 10.18564/jasss.5992
Received: 06-Dec-2024 Accepted: 17-Feb-2026 Published: 31-Mar-2026
Abstract
We investigate how sentiment towards certain companies spreads in social media. We focus on Reddit's financial communities, particularly those dealing with Google, Apple, and Amazon. We reconstruct users' interaction networks and we track their sentiment over time using a few Deep Learning-based Zero-Shot approaches inspired by recent works. We then introduce an epidemiological-like model to describe sentiment propagation within these networks. Specifically, we employ a Susceptible-Infectious-Susceptible (SIS) framework, where users expressing negative sentiment are modeled as the "infectious" agents. We also introduce trust dynamics which affects the transition probabilities between susceptible and infectious states. We calibrate the model against empirical Reddit data to align with observed sentiment trends. Finally, we validate the model using short-term out-of-sample data, demonstrating its robustness and predictive capability in forecasting sentiment.Introduction
In today’s digital era, the influence of online social networks on financial markets has become increasingly pronounced. Platforms like X and Reddit have emerged as key spaces where investors exchange ideas and information, shaping market perceptions in real time. The widespread adoption of these platforms has led to the formation of online communities where sentiment, i.e. opinion about financial entities, can spread rapidly, sometimes leading to significant fluctuations in asset valuations. Numerous studies highlight the association between sentiment expressed on social media and subsequent market behavior. In Bollen et al. (2011), it is shown that the accuracy of DJIA predictions can be significantly improved by including specific public mood dimensions. In Ranco et al. (2015), the authors find a dependence between Twitter1 sentiment and abnormal returns during the peaks of Twitter volume. A further illustrative case is the phenomenon observed with GameStop stock in January 2021, as analyzed in Lucchini et al. (2022).
Meanwhile, the dynamics of how opinions spread in social communities have drawn increasing attention, with researchers often turning to epidemiological models to better understand these processes, like in Bettencourt et al. (2006) and Zhao et al. (2014). Numerous theoretical studies have analyzed the effects of various network topologies on the epidemic-like spread of opinions, either by generating specific networks, such as small-world (Zanette 2002) and scale-free networks (Nekovee et al. 2007), or by using mean-field approaches that bypass the need to generate explicit networks (Moreno et al. 2004).
In general, the field of epidemiological models and agent-based dynamics over networks has been extensively studied, ranging in a variety of areas. For example, in Pastor-Satorras & Vespignani (2001), in the context of computer viruses, the authors showed that in scale-free networks the epidemic threshold of a SIS model vanishes in the thermodynamic limit, allowing infections to persist indefinitely due to the presence of highly connected hubs. The role of the epidemic threshold for SIS dynamics on networks has also been studied in other works, such as Castellano & Pastor-Satorras (2010) and Boguná et al. (2013), using heterogeneous mean field and quenched mean field approaches. An alternative way to study similar dynamics, without being constrained by equation-based formulations, is to employ agent-based models (Hunter et al. 2017). Well-known examples include the voter model, first introduced without the support of networks (Clifford & Sudbury 1973; Holley & Liggett 1975), and later established as a classical framework on networks (Sood & Redner 2005). In this model, agents adopt the state of a randomly selected neighbour, leading to either consensus or coexistence depending on the network topology. Another influential framework is the Axelrod cultural dissemination model (Axelrod 1997), which is based on the principle of homophily: agents sharing more cultural traits are more likely to interact, and such interactions increase their similarity, potentially driving the system toward either cultural convergence or polarization. The Deffuant model (Deffuant et al. 2000) focuses on continuous opinions and bounded confidence, where agents adjust their opinions toward each other only if their initial difference is below a given threshold, capturing the tendency of individuals to be influenced only by sufficiently similar peers. These models illustrate how agent-based approaches can capture the richness of social interaction mechanisms beyond what equation-based models typically offer, providing a flexible framework to incorporate additional relational dimensions such as trust between individuals.
In fact, interpersonal relationships between agents – particularly the degree of trust – play a central role in shaping information diffusion. Trust influences how likely individuals are to adopt content shared by their peers, potentially reinforcing or inhibiting the spread of sentiment in social networks. In computer science, trust is commonly defined as “a subjective expectation an entity has about another’s future behavior” (Mui 2002), and in the context of social networks, trust is often reflected in the notion of tie strength, as stronger interpersonal ties generally correspond to more reliable and trustworthy relationships (Sherchan et al. 2013). The fact that the influence of trust on spreading dynamics is non-trivial can be seen in its critical role in determining whether the system converges to a specific state (Golub & Jackson 2010), as well as in its significant impact on facilitating widespread information diffusion (Wu et al. 2017).
Coming back to the area of online communities, experimental studies focusing on social media data have also applied epidemic models to examine rumor spreading, but without incorporating network topology. For instance, in Skaza & Blais (2017), the authors analyze trending Twitter hashtags, treating them as infectious. Similarly, Jin et al. (2013) demonstrates how the spread of both true news and rumors on Twitter can be modeled using epidemiological population-based frameworks.
The combination of theoretical works on synthetic networks and empirical approaches based on social media data, however, remains under-explored, particularly concerning how the structural characteristics of online social networks interact with the underlying mechanisms of sentiment propagation. This intersection is critical, as the topology of a network – such as the presence of clusters or influential nodes – can significantly influence the rate and extent of information diffusion.
In addition to modeling real networks, another powerful tool for understanding opinion dynamics in financial markets is sentiment analysis (Mishev et al. 2020). Sentiment analysis uses Natural Language Processing (NLP) and machine learning algorithms to analyze text, enabling the labeling of posts as positive or negative -or neutral, in some cases (Wankhade et al. 2022). In the financial context, this method can reveal how investors’ sentiment fluctuates in response to market news, corporate events, or broader economic conditions (Kearney & Liu 2014).
Early approaches to sentiment extraction using machine learning techniques apply various classifiers and dictionary-based models on datasets of tweets, news, and micro-blogs (Atzeni et al. 2017; Wang et al. 2015). New developments in NLP and deep learning have significantly improved the sentiment extraction from financial texts. Recent works have demonstrated the effectiveness of transformer models, such as BERT and RoBERTa, in improving sentiment analysis performance (Yang et al. 2018; Zhao et al. 2020). These approaches outperform traditional dictionary-based models, highlighting the superiority of the transformer architecture in this domain.
All the aforementioned approaches rely on labeled data, which is often challenging to obtain for fine-tuning language models in sentiment analysis. As a result, researchers are frequently limited to using a small number of available datasets or resort to manual annotation, which is not only resource-intensive and time-consuming but also prone to be of lower quality.
In this context, our research aims to provide a deeper understanding of sentiment dynamics within financial communities by leveraging advanced modeling techniques and sentiment analysis tools. Our research specifically targets Reddit, focusing on its finance and economics communities where discussions revolve around major companies such as Google, Apple, and Amazon. We collect 18 months worth of data, including both user submissions and comments, which we use to construct three distinct networks representing interactions among users discussing these companies. Additionally, we track sentiment trends over time, creating three time series that quantify the percentage of negative sentiment directed at each company. The data extracted from Reddit does not include sentiment labels, so we apply deep learning-based zero-shot methods to infer sentiment, thus avoiding the need for manual annotation. We specifically test three zero-shot approaches using varied strategies and assess their effectiveness in sentiment detection. We then develop an agent-based model to examine the evolution of sentiment, where each agent corresponds to a node of the users’ network. The model we propose builds on SIS dynamics, incorporating the concept of trust among agents as a key factor in determining their probability of transitioning between states. We model sentiment diffusion using a time series of sentiment data for each company. We test three separate models, calibrating them against empirical data to find the best fit. Finally, we validate the model on short-term out-of-sample data to test the model’s ability to forecast future sentiment evolution.
From the calibration, we gain insights into the traders’ actual behavior, while the validation results indicate that our model performs well in predicting short-term sentiment trends.
Data
Reddit is one of the most-visited forums in the world. It can be defined as a social news aggregation, content rating, and social network. Its network is organized in communities named "subreddits", which are forums dedicated to a specific topic. Every user is enrolled in one or more subreddits, where he can post submissions or comment on other users’ submissions. Reddit is a complex network of users and their interactions create a dynamic and evolving web of relationships. Indeed, the network is not static: it continuously adapts as users join new subreddits, contribute content, and interact with others. Clusters of users naturally form around shared interests, with users spreading information and influencing collective behaviors.
Data extraction and filtering
We collected Reddit data from January 2015 to June 2016, focusing on a period sufficiently far from the major financial crises of the late 2000s. By selecting this timeframe, we aimed to capture traders’ opinions less likely to be influenced by the aftermath of significant market crashes. This approach allows for a clearer analysis of sentiment trends and market behaviors under stable economic conditions. These data were obtained from Academic Torrents, an open-access platform that shares large datasets for academic research purposes (Cohen & Lo 2014; Lo & Cohen 2016). We filtered our dataset to include only posts from 42 subreddits focused on finance and economics (see Table 1). Next, we selected posts that specifically mentioned three company names and their ticker symbols: ‘Apple’ (AAPL), ‘Amazon’ (AMZN), and ‘Google’ (GOOG). Starting in October 2015, we expanded our criteria to include references to ‘Alphabet,’ due to the cessation of Google as a single company and the creation of the conglomerate holding company Alphabet Inc., which includes Google. To enhance the qualitative content of the dataset, we excluded posts containing the keywords ‘gift card’ and both ‘pc’ and ‘repair’ in the same sentence, which indicate the discussion was about the companies’ products rather than their financial aspects.
| Topics | Subreddits |
|---|---|
| General Finance and Personal Finance | personalfinance, Frugal, povertyfinance, MiddleClassFinance, FinancialPlanning, StudentLoans, CRedit |
| Investing and Investment Strategies | investing, InvestmentClub, Bogleheads, investingforbeginners, ValueInvesting, SecurityAnalysis, algotrading, finance |
| Stock Market and Trading | StockMarket, wallstreetbets, wallstreet, wallstreetdd, Daytrading, RealDayTrading, options, pennystocks, RobinHoodPennyStocks, RobinHood |
| Digital and Currency Trading | CryptoCurrency, Forex |
| Economics and Global Markets | economy, Economics, GlobalMarkets |
| Financial Independence and Frugality | financialindependence, leanfire, flatFIRE |
| Entrepreneurship and Business | Entrepreneur, smallbusiness, business, Flipping, DropShipping101 |
| Extra Income and Gig Economy | beermoney, giftcardexchange, churning |
| Dividends and Income Investing | dividends |
We gathered two datasets: one for submissions and one for comments on submissions. Each dataset includes several attributes, including authors’ IDs and its publication date-time. Data is described by the attributes listed in Table 2. In the context of the dataset containing submissions, the “Selftext" attribute serves as the principal source of textual content. However, in instances where”Selftext" is absent, the “Title" of the submission is utilized as a substitute. Regarding the comments dataset, the ”Body" attribute is employed as the designated text source.
| Source | Attribute | Description |
|---|---|---|
| Submissions and comments | Id | Personal id of the author of a submission or a comment |
| Author | Username of the author of a submission or a comment | |
| Name | Code associated to each submission or comment | |
| Subreddit | Name of the subreddit where a submission or a comment is posted | |
| Subreddit id | Id of the subreddit where a submission or a comment is posted | |
| Created UTC | Date-time when a submission or a comment was created | |
| Submissions | Title | Title of a submission |
| Selftext | Text of a submission | |
| Comments | Body | Text of a comment |
| Parent id | Name of the post, be it a submission or a comment, to which a comment replies | |
| Link id | Name of the submission which started the thread where a comment is written | |
Network reconstruction
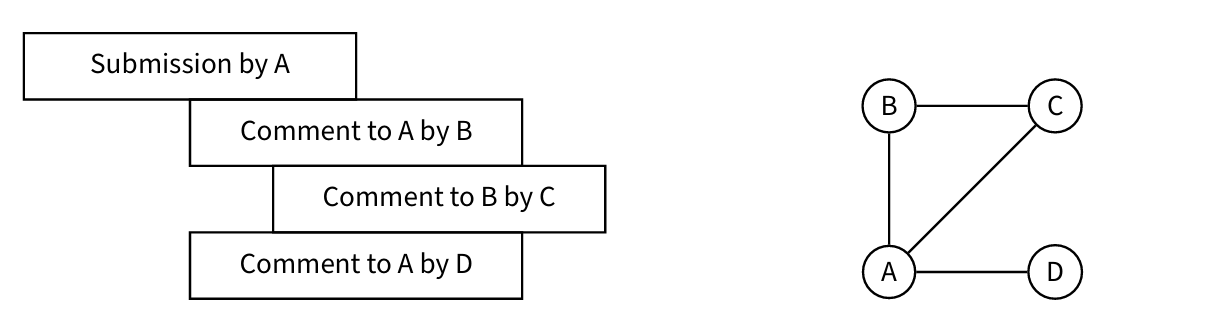
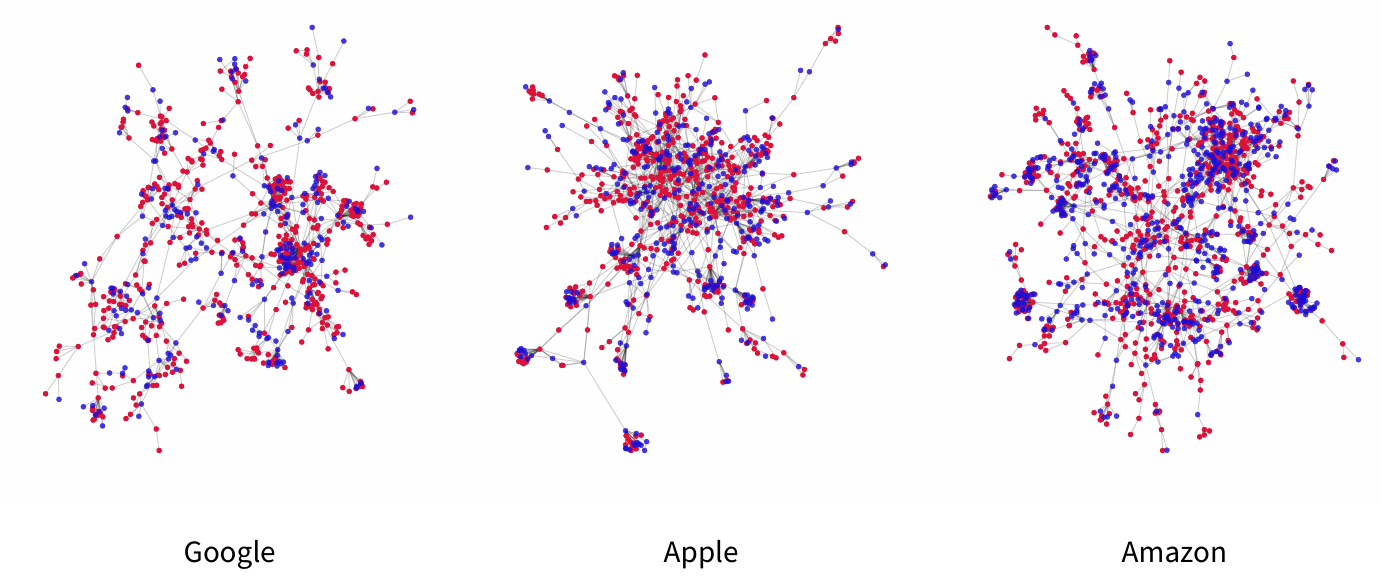
We used the extracted data to build three networks of interacting agents talking about financial aspects of the three companies. In our networks each node corresponds to a Reddit user which is the author of a submission or a comment, following the approaches of De Francisci Morales et al. (2021), Lucchini et al. (2022) and Mancini et al. (2022). In particular, we merged the submissions and comments datasets to build an undirected network where links are added:
- between the author of a submission/comment and every author of a comment directly replying to that submission/comment;
- between the author of a submission and every author of a comment in the thread of that submission, even if he is not directly replying to the submission, but to another comment.
An example is shown in Figure 1. The previous rules create links among users reacting to a single submission. Links between different submissions are formed by users who write or comment on different submissions. Even if networks for each company are created independently, users can belong to more than one network. In particular, if a user posts about more than one company, even in the same submission/comment, he will be part of all the corresponding networks. After building the networks, in line with the approach of (Mancini et al. 2022), we removed all the nodes whose author is [deleted] and AutoModerator: the first label represents unsubscribed users whose sentiment cannot change because they are not exposed to the network anymore, while the second is related to a Reddit bot. To effectively model the spread of sentiment across the entire network of users, we ensured that our analysis captured a connected network. Therefore, for each company, we focused exclusively on the largest connected component extracted from the full network, as in (Mancini et al. 2022).
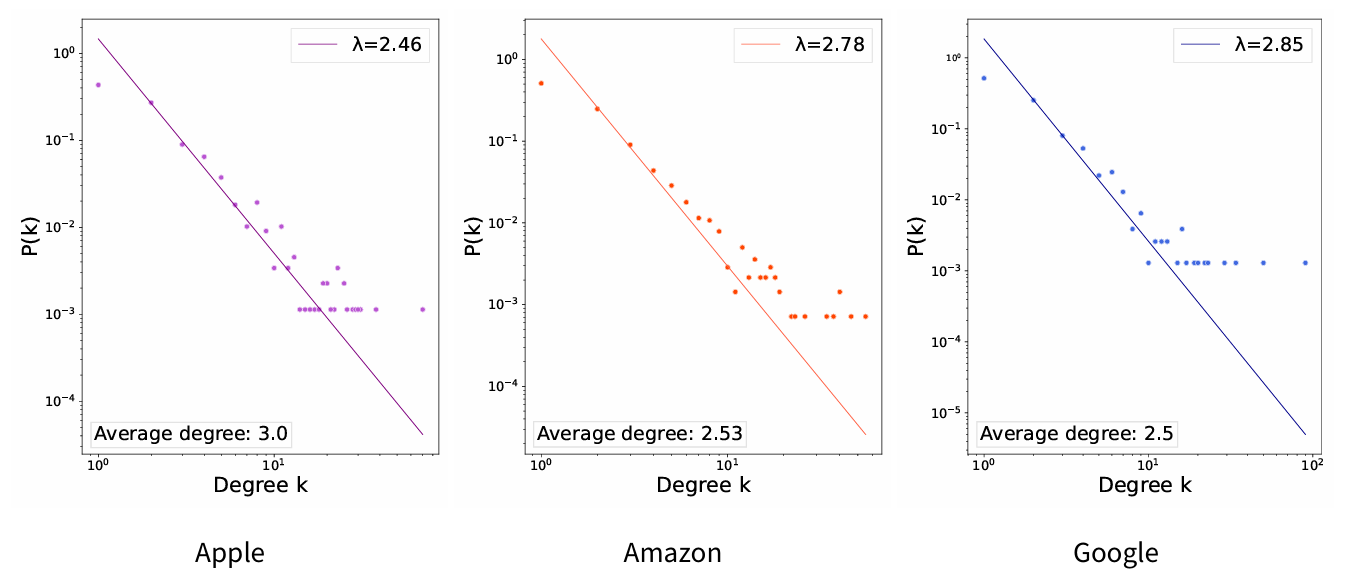
To build the networks of users, we considered data from the first five months of 2015 only. This time frame was chosen because it provides a more manageable and cohesive subset of the data, in contrast to the full 18-month period from 2015 to 2016. Additionally, users who participate early in the period are more likely to contribute multiple posts in the future, thereby forming meaningful connections within the network. In contrast, users who first engage toward the end of the two years are less integrated into the network, as their limited activity does not reflect sustained interaction. The number of nodes and edges for each network, together with general statistics about each dataset numerosity, are provided in Table 3. As expected, the three networks show power-law degree distributions (see Figure 2).
| Company | Network | Dataset (5 months) | Dataset (18 months) | |||
| Nodes | Edges | Submissions | Comments | Submissions | Comments | |
| 771 | 963 | 3821 | 17308 | 11’896 | 64’800 | |
| Apple | 882 | 1’323 | 1321 | 6346 | 4’328 | 25’120 |
| Amazon | 1’397 | 1’769 | 6350 | 12776 | 16’080 | 51’367 |
We introduce temporal dynamics into the data by segmenting the company datasets based on the comments’ and submissions’ creation date "Created UTC". Specifically, we organize the text data into weekly intervals, resulting in \(N_w = 76\) subsets, each containing several submissions and comments varying between 130 and 1103. The weekly time series of texts enables us to model the evolution of opinions and, consequently, the sentiment within the networks about the companies over time.
Method
Agent variables
To describe the temporal dynamics of sentiment we introduce a mechanistic model in which agents interact within a contact network. Sentiment towards each company of our study is treated separately while applying the same model. In particular, we consider \(N\) agents, each located in a fixed node of one of three networks built in Section 2.3. For agent \(i, i=1,\dots, N\) there is a set of neighbors \(\mathcal{N}_i\), with cardinality \(|\mathcal{N}_i|\) which is also the degree of the node associated to agent \(i\). Moreover, each agent is described by two time-dependent variables: state and trust. The state is defined by the discrete variable \(s_{i,t}\), depending on time \(t\); in particular \(s_{i,t}\) can assume values in \(\{S, I\}\), where \(S\) represents the condition of being susceptible to negative sentiment and \(I\) represents the condition of being infected, and thus infectious, by negative sentiment. Linking these two states with real data, we assume that \(S\) corresponds to users who post positive texts, while \(I\) refers to users who publish negative content. Agents can change their states, from S to I and vice versa, according to transition rates like those of an SIS model. In fact, the dynamics of \(s_{i,t}\) is the agentized version of the dynamics described by an SIS model, where instead of considering single agents there is an Ordinary Differential Equations (ODEs) system describing the dynamics of two compartments representing respectively the total number of infected agents and the total number of susceptible agents. For the purpose of completeness, the equations of a continuous SIS model are given below. In this case \(\tilde{N}\) is the size of the population, which is divided into the two compartments \(\tilde{S}\) and \(\tilde{I}\):
| \[\left\{ \begin{array}{l} \frac{d\tilde{I}}{dt}=\beta\frac{\tilde{I}}{\tilde{N}}\tilde{S}-\gamma \tilde{I}\\ \frac{d\tilde{S}}{dt}=-\beta\frac{\tilde{I}}{\tilde{N}}\tilde{S}+\gamma \tilde{I} \end{array}\right. \] | \[(1)\] |
The second variable describing agents is trust, which represents the reliability between agents. In particular, \(T_{(i,j),t}\) stands for agent’s \(j\) trust in agent \(i\), at time \(t\), \(\forall\) \(i,j=1, \dots ,N\). Each \(T_{(i,j),0}\) is initiated equal to \(0.5\) for each agent, assuming no a priori knowledge of trust distribution.
At each time step, every agent updates its state. The probabilities used for the update are \(\gamma\) and \(p\); \(\gamma\) corresponds to the transition rate from \(\tilde{I}\) to \(\tilde{S}\) of the continuous model in Equation 1, and is independent of the number or state of contacts, as occurs in a classical SIS, while \(p\) is given by:
| \[p=\beta\frac{\sum_{j \in \mathcal{N}_{i,I}}T_{(i,j),t}}{|\mathcal{N}_i|} \] | \[(2)\] |
This mechanism assigns the transmission probability \(p\) to socially driven contagion of negative sentiment, while \(\gamma\) models a recovery process toward positive sentiment that is independent of direct social interactions. The two mechanisms are therefore intended to capture different types of dynamics: interaction-driven contagion on the one hand, and individual-level processes on the other. Negative sentiment is assumed to spread through social interactions due to its higher contagious potential, which is consistent with the well-documented negativity bias-the tendency for negative information to have a stronger impact on cognition and behavior than positive information (Rozin & Royzman 2001). This asymmetry has also been observed in online social networks, where negative content is more likely to generate larger information cascades (Alvarez et al. 2015). In contrast, recovery toward positive sentiment is not modeled as a contagion process but as a spontaneous transition, representing individual-level mechanisms such as emotional attenuation over time, shifts in attention, or exposure to external information sources not explicitly included in the interaction network. These assumptions are driven by the outcome of the models described in Hill et al. (2010). Such models, data-driven, are able to interpret dynamics observed in data implementing connection driven transition to negative and spontaneous transition to positive conditions. A possible extension of our work could investigate effects on the dynamics introduced by a mild impact of pairwise connections in the transition to positive.
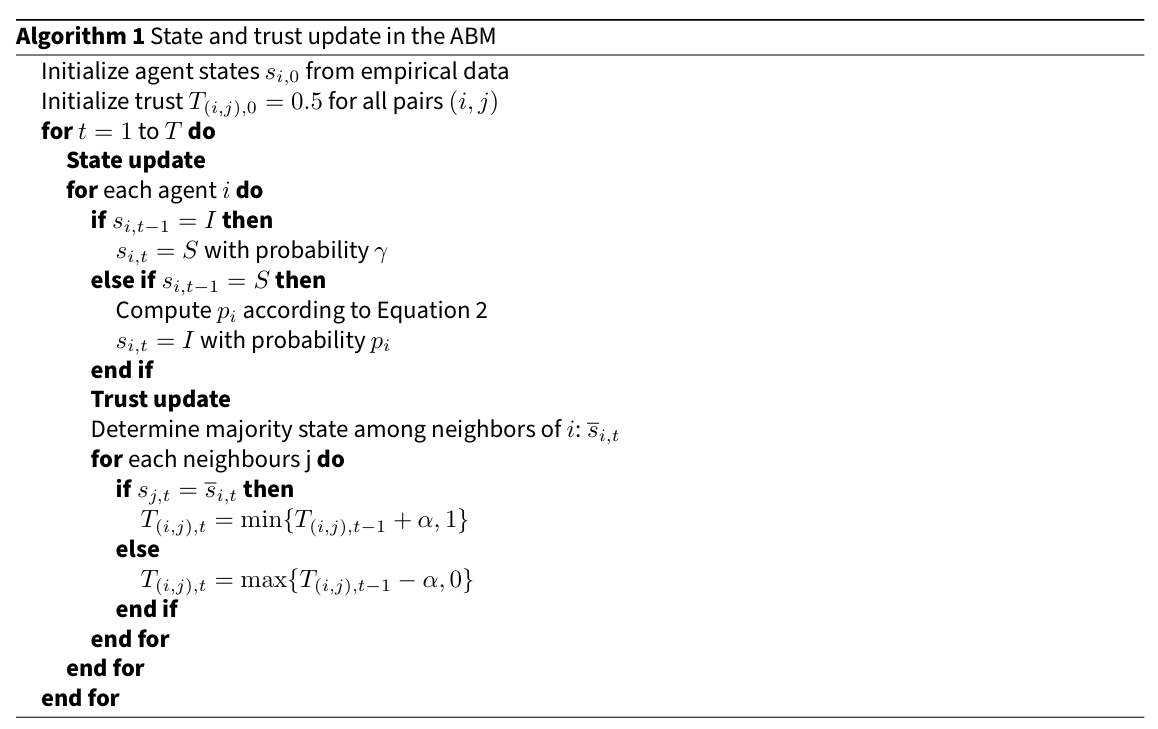
The dynamics is implemented using synchronous updates: at each discrete time step, all agents first update their state variables based on the values at time \(t-1\), and subsequently update trust values. The updating procedure of the model is summarized in Algorithm 1. The trust update mechanism is based on the principle that each agent tends to align with the majority opinion of its neighbors. This assumption is consistent with the well-known property of homophily in social networks, where individuals with similar attributes or opinions are more likely to form connections (McPherson et al. 2001). Homophily has also been shown to influence trust dynamics, as stronger or weaker social ties often emerge based on the degree of similarity in status and values between individuals (van de Bunt et al. 2005). Ideally, if agent \(i\) advises agent \(j\) to choose opinion \(I\) over \(S\), and then the majority of agent’s \(j\) neighbors has opinion \(S\), then agent \(j\) will decrease its trust in agent \(i\) of a quantity \(\alpha\); on the contrary, if the most common opinion among neighbors of agent \(j\) is \(I\), the advice will increase its trust in agent \(i\) of \(\alpha\). Therefore, defining \(\overline{s}_{i,t}\) as the most common state among agent’s \(i\) neighbors, the trust update happens as follows:
| \[T_{(i,j),t} = \left\{ \begin{aligned} &\min\{T_{(i,j),t-1} + \alpha, 1\} &\text{if } s_{j,t} = \overline{s}_{i,t} \\ &\max\{T_{(i,j),t-1} - \alpha, 0\} &\text{if } s_{j,t} \neq \overline{s}_{i,t}. \end{aligned} \right.\] | \[(3)\] |
Zero-Shot Sentiment analysis
We employ a deep learning-based sentiment analysis to estimate the sentiment of each agent in our network. Following the approach of Wang et al. (2014), we treat sentiment as binary, considering it as positive or negative, which can be considered analogous as using the label “bullish” and “bearish” (Bartov et al. 2018; Liu & Son 2024). Positive sentiment reflects an optimistic view of the company, while negative sentiment indicates a pessimistic perspective. Given the absence of annotated sentiment data, we cannot train or fine-tune a model in a straightforward fashion. Hence, we test three Zero-Shot Sentiment classification strategies. Here we describe them and motivate their use and strengths.
NLI model
The first model is BART-MNLI (Lewis et al. 2019; Yin et al. 2019), a bart-large version pre-trained on the NLI dataset (Williams et al. 2018). It is a 407M parameters LLM capable of obtaining outstanding results in language generation, comprehension, and classification (Yin et al. 2019). BART-MNLI has been successfully used in different classification tasks like news classification (Pelicon et al. 2020) and sentiment analysis (Tesfagergish et al. 2022). Its strengths are its size, robustness, and general knowledge of the human language.
We used this model inside a NLI-based zero-shot classification pipeline (Lewis et al. 2019) to get the output probability \(p_n(x)\) for a text \(x\) of having negative sentiment (and consequently the output probability \(p_p(x) = 1-p_n(x)\) of having a positive sentiment). Texts with the highest positive or negative probability are selected to create a pseudo-annotated dataset. In particular, setting a threshold probability \(\tau\) we can define two subsets of the full dataset:
- \(X_n = \{x_i \in X : p_n(x_i) > \tau \}\), i.e. Reddit posts whose probability of having negative sentiment is higher than \(\tau\);
- \(X_p = \{x_i \in X : p_p(x_i) > \tau \}\), analogue but with positive sentiment.
We merge the two subsets as \(X_{\text{self}} = X_n \cup X_p\) and obtain a self-annotated dataset that serves as a training set for further refinement discussed in Section 3.11. In our experiments we used the full data extracted from the 42 selected subreddits (see Table 1) in January 2015. In this analysis, texts were not filtered by company, as sentiment is considered independent of the specific organization. This choice enables us to focus on the general language used typically by Reddit investors. Finally, we set \(\tau=0.9\) which generates an \(X_{\text{self}}\) composed of 6K posts extracted from the total 25K of the original dataset, which are divided into 49.6% with positive sentiment and 50.4% with negative sentiment.
Fine-Tuned DistilBERT model
The second model is distilbert-base-uncased-finetuned-sst-2-english, a DistilBERT version finetuned on the SST2 dataset (Socher et al. 2013). SST2 dataset is a binary version of the Stanford Sentiment Treebank dataset, introduced in Pang & Lee (2005), which contains 70K sentences annotated with sentiment by three human judges. The model has 67M parameters only but its strength is being fine-tuned on a sentiment analysis downstream task using a large dataset.
Custom DistilBERT fine-Tuned with Self Learning
The last model is distilbert-base-uncased with custom fine-tuning. In particular, we follow a self-learning approach as in Du et al. (2021), Zou et al. (2019). We use the self-annotated dataset \(X_{\text{self}}\) to fine-tune the base DistilBERT model on our sentiment analysis task. Its strength is being fine-tuned on data belonging to the same downstream task it is going to be used on. The difference between the two DistilBERT-based approaches is that despite having the same number of parameters, the first performs zero-shot classification leveraging knowledge extracted from a bigger dataset in a transfer learning fashion, while the second one relies on a smaller but pertinent dataset as in unsupervised task-adaptation (Gera et al. 2022).
Sentiment diffusion modeling
After partitioning the dataset into weeks we compute the sentiment of each post obtaining a fraction of positive and negative posts for each time unit. Thus, defining \(N_t\) and \(P_t\) as the absolute number of negative and positive posts for each week \(t\), we obtained the negative sentiment time series given by:
| \[\{n_t\}, \text{ with } t = 0, \dots, N_{w-1} \text{ where} \quad n_t=\frac{N_t}{P_t+N_t}.\] | \[(4)\] |
We then use the observed series of negative sentiment fractions to compute its exponential moving average. Specifically, for each \(\{n_t\}\) we build a \(\{n^{'}_{t}\}\), such that:
| \[n^{'}_{t} = \left\{ \begin{aligned} &n_0 &\text{if } t = 0 \\ &\rho n_t + (1 - \rho) n^{'}_{t-1} &\text{if } t \neq 0 \end{aligned} \right. \] | \[(5)\] |
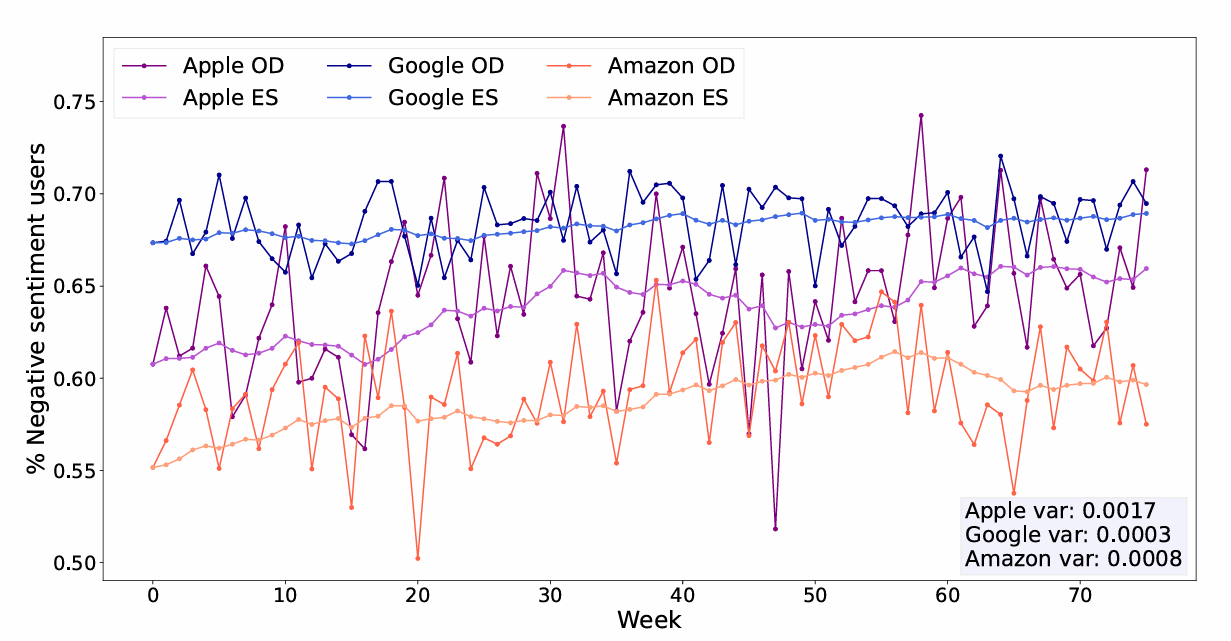
We end up with three pairs of time series each containing the original and the averaged negative sentiments for the Apple, Amazon, and Google datasets (Figure 3).
We approach the task of modeling sentiment diffusion by treating the moving average series \(\{n^{'}_{t}\}\) as the true time series representing sentiment for each company under investigation. This smoothed series is employed to capture underlying trends and filter out short-term fluctuations, providing a more stable representation of sentiment dynamics over time. We hypothesize that the mechanisms governing sentiment diffusion can be effectively described using the SIS-based model described in the previous section. To match the observed sentiment series \(\{n^{'}_{t}\}\), we simulate each of the three SIS-based models over time. By iteratively calibrating its parameters, we aim to identify the model that most accurately replicates the sentiment series. Once the best-fitting model is identified, it is used to make short-term future predictions of the sentiment time series. We expect the models to forecast how sentiment is likely to evolve in the near future based on the underlying diffusion processes grounded by them. The first 68 weeks of data are utilized for calibrating the parameters of the SIS-based models. The remaining 8 weeks of data are reserved for out-of-sample testing, during which we evaluate the predictive accuracy of the models.
Experiments
Zero-Shot models human evaluation
A key challenge in our work is the implementation of a Zero-Shot setting where the texts lack predefined positive or negative labels. The absence of true labels complicates the evaluation process, making it challenging to assess the performance of the three models. Following standard protocols for such scenarios, we evaluate the models by comparing their outputs against human annotations of the selected texts (Artstein & Poesio 2008; Basile et al. 2018). As authors, we independently annotate the texts, ensuring that we do so without any knowledge of the models’ predictions. We randomly selected 3 texts for each week, for a total of 228, and manually annotated them with their sentiment. We agreed on 177 which we use as a labeled test set. Using both full sets of annotations, we compute Cohen’s Kappa coefficient \(\kappa\), which measures the agreement between annotators (Artstein & Poesio 2008; Kenyon-Dean et al. 2018). A value of 0.55 suggests a sufficiently high level of agreement between the authors, excluding that the agreement occurred by chance. We note, however, that since the score is close to 0.5, the sentiment classification task remains challenging, even for human evaluators. We use the labeled test set to evaluate the three Zero-Shot sentiment classification models.
Network initialization
To conduct experiments by running the model on the networks, it is necessary to initialize each node of the three networks to a \(S\) or \(I\) state. This must be done for the initial state of each network only, \(t=0\), i.e. the first week of January, as the successive states of the systems will be given by the models simulations. To have a value at \(t=0\) in our network, a user must belong both to the set of users who posted in the first week of January and to the connected component of users who forms the network.
These two sets of users are, in practice, partially overlapping sets: the set of users who posted in five months is bigger than the one of users who posted during one week while, since we only consider a connected component of the full network of users, the first week of submissions might include some of the isolated or deleted users. The numbers of users who have value in \(t=0\) for each network are given in Table 4. We randomly initialize the sentiment of users belonging to the networks who have not posted during the first week. The initialization is performed so that the true fraction of negative users \(n_0\) calculated by the Zero-Shot model is respected.
Let \(N_u\) be the total number of users in one of the networks and \(N_p\) and \(N_n\) be the numbers of actual positive and negative users. The remaining \(I = N_u - (N_p + N_n)\) nodes are initialized so that:
| \[\frac{N_n + I_n}{N_u} = \frac{N_n + I_n}{N_n + I_n + N_p + I_p} = n_0,\] | \[(6)\] |
| Network | Nodes \(1\)st week | % Nodes \(1\)st week |
|---|---|---|
| 73 | 9.47 | |
| Apple | 39 | 4.42 |
| Amazon | 171 | 12.24 |
Simulations
To run simulations we used AgentPy, a Python library suited for agent-based modelling (Foramitti 2021). Each agent was associated with an author, with initial conditions as defined in Section 4.1, and could interact with its neighbors as described in the "Method" Section. Each time step in the simulations corresponds to one observation interval in the empirical time series, i.e., one week. We aimed to identify the combination of parameters that best fit the observed data.
Given the stochastic nature of agent-based models, each simulation was repeated multiple times, enforcing the same statistical seed for random numbers generation. Specifically, during the parameter sweeps for model calibration, each simulation was iterated ten times. For the best-fit parameter combination, the simulation was iterated 100 times to validate the model. During the calibration phase, the model’s best fit was determined by minimizing the Mean Squared Error (MSE) between each negative sentiment time series exponentially smoothed and the corresponding average series obtained for each set of parameter configurations. The three parameters we calibrated are \(\alpha\), \(\beta\), and \(\gamma\), representing respectively the increase-decrease parameter for trust, the transition rate from \(S\) to \(I\) in \(SIS\), and the probability of transition from \(I\) to \(S\). We made parameter \(\beta\) vary in interval \([0,1]\), and parameters \(\alpha\) and \(\gamma\) in interval \([0,0.1]\). After completing the calibration, we proceeded to the validation, considering also the remaining 8 weeks.
Results
Sentiment classification
Table 5 shows the accuracies of the three zero-shot sentiment classification models evaluated on the dataset described in the Section "Zero-Shot models human evaluation". DistilBERT fine-tuned on the SST2 dataset has the lowest accuracy, meaning that transfer learning from a big but diverse dataset is not sufficient to understand the sentiment in this specific task. In contrast, BART and our fine-tuned model demonstrate superior performance metrics. The exceptional performance of BART underscores the robustness of LLMs and the critical role of training language models on expansive corpora across diverse downstream tasks. This result highlights the capacity of LLMs to generalize effectively across different and unseen contexts, reinforcing the value of extensive and varied pre-training. Moreover, it is important to note that the self-annotated dataset used to fine-tune DistilBERT was generated using BART. For the fine-tuned DistilBERT, although the labeled dataset used in our study is relatively small, it proves to be highly effective due to its similarity to the data on which the model was ultimately evaluated. This highlights the value of domain-specific labeled data, even when limited in size. Fine-tuned DistilBERT achieves performance on par with BART while being significantly smaller in size. Preferring a model that balances high accuracy with computational efficiency, we elected to utilize this DistilBERT version as the sentiment predictor for the rest of the analysis.
| Models | Accuracies |
|---|---|
| BART-MNLI | 0.84 |
| Custom DistilBERT fine-Tuned with Self Learning | 0.83 |
| DistilBERT fine-Tuned on SST2 | 0.68 |
Calibration results
The calibration phase, involving the minimization of MSE, yielded the parameters values that can be found in Table 6.
| Parameter | Apple | Amazon | |
|---|---|---|---|
| \(\alpha\) | \(0.0147\) | \(0.0722\) | \(0.0150\) |
| \(\beta\) | \(0.1000\) | \(0.4556\) | \(0.0500\) |
| \(\gamma\) | \(0.0170\) | \(0.0900\) | \(0.0100\) |
Comparing the three original time series, we find that the Apple series shows the highest variability. This is clear from the variances in Figure 3, where the variance of the Apple series is about an order of magnitude larger than the other two. This greater variability can be explained by the parameter values obtained from the calibration. The parameter \(\alpha\) represents the adjustment in trust following an update. Notably, \(\alpha\) is nearly five times larger for Apple compared to Google and Amazon, indicating that users interested in Apple are more prone to significant shifts in trust. This suggests a more variable behavior among this group, contributing to a more unstable trajectory in the series representing the infected population. The parameter \(\gamma\) represents the probability of an agent transitioning from state \(I\) to state \(S\). For Apple, \(\gamma\) is nearly five times larger than for Google and nine times larger than for Amazon, reinforcing the observation that Apple users are more likely to transition between states. Although \(\beta\) does not directly represent the probability of transition from state \(S\) to state \(I\), as it is also influenced by trust, the same conclusions apply to this parameter as well.
Moreover, at the beginning of the simulations, each node’s trust values were initialized to \(0.5\). Therefore, the probability of a susceptible node transitioning to the state \(I\) is given by \(p=0.5\beta\). Consequently, the basic reproductive number defined in (Barrat et al. 2008) as \(R_0=\langle k \rangle \frac{p}{\gamma}\) is \(R_0=\langle k \rangle \frac{0.5\beta}{\gamma}\), where \(\langle k \rangle\) is the average degree of the network. This value is crucial since it has to be larger than \(1\) for the spreading to occur. Indeed, the calibrated parameters led to three values of \(R_0\) higher than \(1\), specifically we obtained \(7.35, 7.67\), and \(6.33\) for Google, Apple, and Amazon respectively.
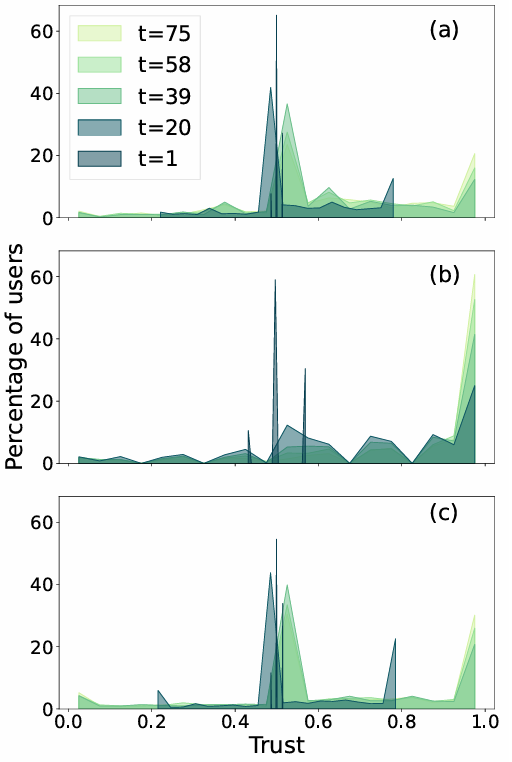
After estimating the parameters, we examine the empirical distribution of trust values during the simulations. Figure 7 shows these distributions at different time steps. For each company, we observe that trust becomes heterogeneous, with values tending more towards 1 than 0, indicating an increasing number of agents exhibiting high trust in their neighbors. However, while for Apple trust clearly shifts toward high values for the majority of agents, in the case of Google and Amazon it remains more broadly distributed across the possible range, with many agents still clustered around 0.5. This difference is consistent with the trust parameter \(\alpha\), which is four times larger for Apple than for the other two companies, leading to a faster evolution of trust.
Validation and forecasting
The forecasts performed in the validation procedure are presented in Figure 5, where simulations are run for \(76\) steps, corresponding to the full length of the negative sentiment time series. As it can be seen, the majority of the original companies’ time series falls outside the confidence intervals. This is not surprising, in fact, the model has an intrinsic stochastic nature, testified also by the large \(3\sigma\) halo, representing all simulated time series within three standard deviations from the mean series.
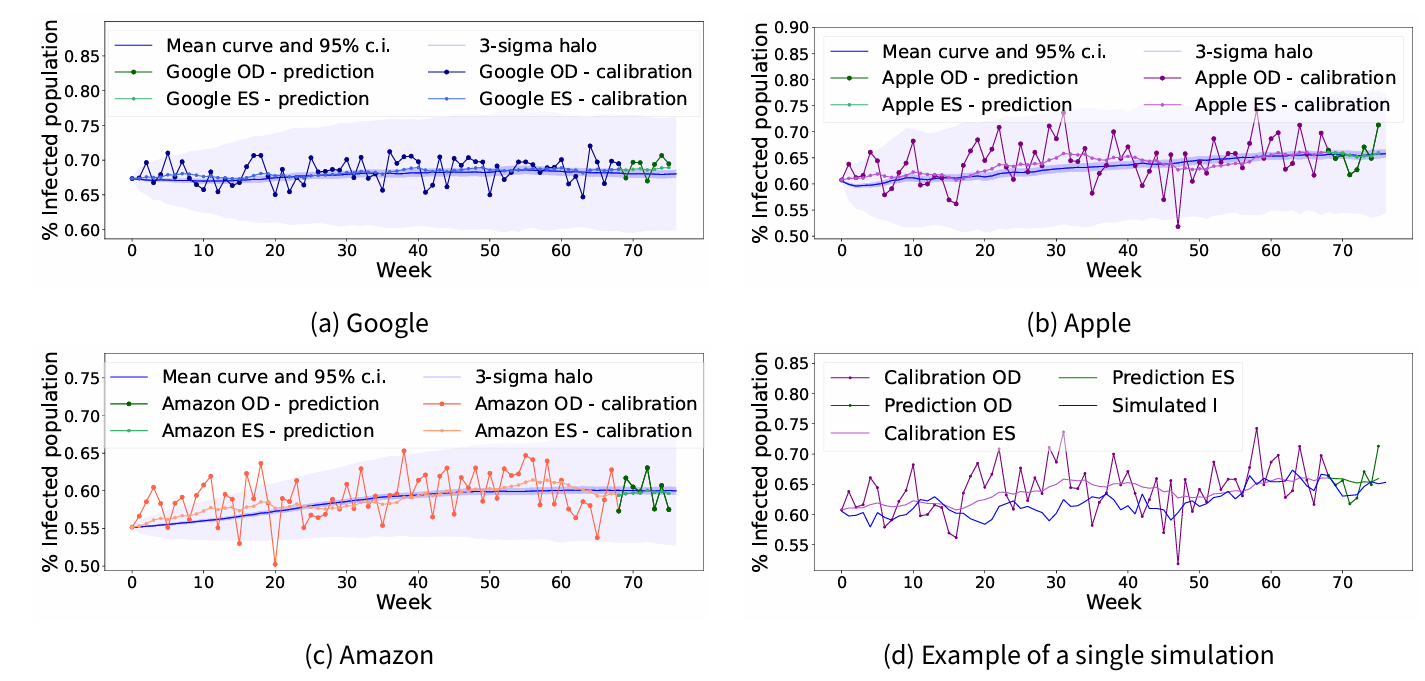
Considering the exponentially weighted moving average of the original data, which can be interpreted as a de-noised version of the original series, we observe that results vary depending on the company. Specifically, on the calibration set the Google series is well-predicted with \(71\%\) of points falling in the \(95\%\) confidence interval. Amazon and Apple intervals successfully capture respectively the \(34\%\) and \(30\%\) only, still capturing a global increasing trend in negative sentiment diffusion.
In contrast, on the validation set Apple’s model gives the best forecast performance with a \(95\%\) confidence interval that includes all data points, further accurately reflecting the concave trend. Google and Amazon’s intervals show strong agreement between the smoothed data and the model’s predictions, both including six out of eight data points. Google’s model specifically struggles to capture the trend in the later points, predicting a decrease in negative sentiment while real data points show an upward trend.
Comparison with classical SIS model
For completeness, we compare the ABM with the classical SIS model based on Ordinary Differential Equations (ODEs), as described in Equation 1. The ODE model was fitted to the same sentiment time series used for the ABM calibration, consisting of 68 data points. We used a least-squares optimization approach: the ODE was first integrated, and the parameters \(\beta\) and \(\gamma\) were then estimated by minimizing the MSE between the model output and the observed data. The initial condition for the simulation was set to the first observed value in the time series.
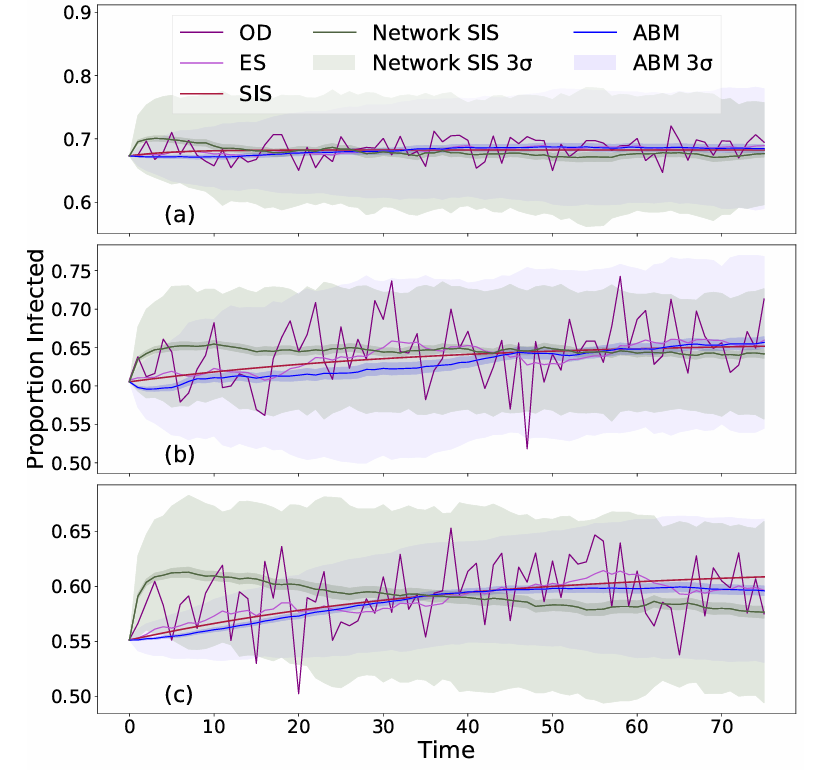
Table 7 shows the parameters obtained by the fit, and Figure 6 shows the fitted results as red curves, including a prediction over the last 8 points of the series. The fitted curves follow the general trend of the data and provide results similar to the average behavior of the ABM simulations. Table 8 presents the distance between the outputs of the models and the smoothed data for the last 8 data points of the series, showing that the ODE model exhibits a discrepancy of the same order of magnitude as the ABM in the prediction set. The distance is computed for each company as:
| \[d=\sum_{i=69}^{76} |n_t^{model}-n_t^{'}|\] | \[(7)\] |
| Parameter | Apple | Amazon | |
|---|---|---|---|
| \(\beta_{NSIS}\) | \(0.0488\) | \(0.0400\) | \(0.0392\) |
| \(\gamma_{NSIS}\) | \(0.0290\) | \(0.0317\) | \(0.0309\) |
| \(\beta_{ODE}\) | \(0.3014\) | \(0.0464\) | \(0.0465\) |
| \(\gamma_{ODE}\) | \(0.0957\) | \(0.0159\) | \(0.0178\) |
Comparisons with model without trust
To evaluate the impact of trust we also compare our model with a SIS on network without trust. This is equivalent to set the trust to \(1\) for each agent and to avoid updating it. This way, Equation 2 simply become:
| \[p=\beta \frac{|\mathcal{N}_i,I|}{|\mathcal{N}_i|}\] | \[(8)\] |
for each susceptible agent. To calibrate and validate the parameters, we adopted the same approach that was used for the ABM. The resulting parameters for each company are reported in Table 7, while Figure 6 shows the validation results, compared to the ODE SIS and the ABM.
For none of the companies do the last 8 data points fall within the \(95\%\) interval of the curves; moreover, comparing the discrepancy between these data points and the average curves of each model (Table 8), it emerges that the average distance for the SIS on network without trust is always one order of magnitude greater than the other two models. Another relevant aspect is that each curve in this case initially increases, reaches a maximum, and then decreases, failing to reproduce the overall increasing trend observed in the data. This highlights that the macroscopic effect of the trust-related parameter \(\alpha\) in the ABM is to modulate the duration of the growth phase of the SIS model, thereby capturing the trend more accurately. These results indicate that the heterogeneity of trust among agents, and its evolution over time, should be taken into account when modeling sentiment spreading.
| Model | Apple | Amazon | |
|---|---|---|---|
| ODE SIS | \(0.0047\) | \(0.0044\) | \(0.0097\) |
| SIS on Network | \(0.0146\) | \(0.0120\) | \(0.0153\) |
| ABM | \(0.0022\) | \(0.0048\) | \(0.0017\) |
Discussion and Conclusions
This study aimed to explore the dynamics of sentiment diffusion in online financial communities, specifically focusing on Reddit, where investor sentiment can spread rapidly and potentially impact market behavior. By combining sentiment analysis and agent-based modeling with epidemiological theory, we examined the spread of negative sentiment in discussions about major companies such as Google, Apple, and Amazon. Notably, we show that sentiment labels, often missing in social media posts, can be effectively inferred using a zero-shot approach. Our findings reveal that the mechanistic model we propose effectively captures large-scale trends in sentiment dynamics, reinforcing the analogy between disease contagion and social contagion. In comparison to both the deterministic ODE formulation and the network-based SIS model without trust, our agent-based model better reproduces the observed variability and the growth phase of negative sentiment, highlighting the role of stochastic interactions and evolving trust relationships. Additionally, we found that Apple traders exhibit more extreme shifts in behavior compared to other traders, resulting in larger fluctuations in sentiment. Overall, this study provides valuable insights into the mechanisms driving sentiment diffusion in online financial communities, laying the groundwork for future research at the intersection of social contagion and financial market dynamics. In addition, it serves as an example of the integration of agent-based models and opinion dynamics with advanced deep learning techniques. This multidisciplinary approach bridges theoretical modeling with practical applications by leveraging actual data and state-of-the-art NLP tools.
This study has some limitations. It provides insights into the general trends of negative sentiment dynamics but does not fully capture the highly variable patterns of short-term fluctuations. The fact that we did not include a separate category for neutral sentiment may have added noise to the data, making these fluctuations appear even more variable. Additionally, the model focuses on stationary conditions, limiting its applicability to scenarios with sharp fluctuations or sentiment peaks, such as those observed in the GameStop short squeeze of 2021. It should also be noted that our dataset covers discussions up to 2016, whereas online financial communities have since evolved, particularly with the emergence of meme stocks and coordinated retail trading, which may amplify and accelerate sentiment contagion. Moreover, our analysis focuses on large technology companies, which are among the most discussed firms online and therefore provide a rich statistical basis for modeling sentiment diffusion. Since the period under study did not include major market shocks, the results may reasonably generalize to other stable companies outside of exceptional events. However, different dynamics could emerge in sectors with lower trading volumes or on finance-specific platforms, where discussions and mechanisms of influence may follow different patterns than on Reddit.
Future work will focus on extending the model to account for sentiment peaks by incorporating dynamics inspired by SIR or SIRS frameworks, which will allow the model to better capture transient shifts in sentiment. Another possible direction for future research is to initially consider all three sentiment categories (positive, negative, neutral) and subsequently remove the contribution of neutral posts, which may reduce noise while retaining valuable information from the data. Further extensions will enable agents to engage in trading based on sentiment, generating a time series of prices. In this context, the update of trust should also be refined, considering not only agents’ desire for conformity with their neighbors but also the rewards they obtain from trading activities.
Data Availability and Experiment Reproducibility
Filtered data and codes are available in the following GitHub repository: https://github.com/marta-baratto/Reddit_sentiment.
Notes
- X’s name until May 17, 2024↩︎
References
ALVAREZ, R., Garcia, D., Moreno, Y., & Schweitzer, F. (2015). Sentiment cascades in the 15M movement. EPJ Data Science, 4(1), 6.
ARTSTEIN, R., & Poesio, M. (2008). Inter-coder agreement for computational linguistics. Computational Linguistics, 34(4), 555–596.
ATZENI, M., Dridi, A., & Reforgiato Recupero, D. (2017). Fine-grained sentiment analysis on financial microblogs and news headlines. In M. Dragoni, M. Solanki, & E. Blomqvist (Eds.), Semantic Web Challenges (pp. 124–128). Cham: Springer International Publishing.
AXELROD, R. (1997). The dissemination of culture: A model with local convergence and global polarization. Journal of Conflict Resolution, 41(2), 203–226.
BARRAT, A., Barthélemy, M., & Vespignani, A. (2008). Dynamical Processes on Complex Networks. Cambridge: Cambridge University Press.
BARTOV, E., Faurel, L., & Mohanram, P. S. (2018). Can Twitter help predict firm-level earnings and stock returns? The Accounting Review, 93(3), 25–57.
BASILE, V., Novielli, N., Croce, D., Barbieri, F., Nissim, M., & Patti, V. (2018). Sentiment polarity classification at EVALITA: Lessons learned and open challenges. IEEE Transactions on Affective Computing, 12(2), 466–478.
BETTENCOURT, L. M. A., Cintrón-Arias, A., Kaiser, D. I., & Castillo-Chávez, C. (2006). The power of a good idea: Quantitative modeling of the spread of ideas from epidemiological models. Physica A: Statistical Mechanics and Its Applications, 364, 513–536.
BOGUNÁ, M., Castellano, C., & Pastor-Satorras, R. (2013). Nature of the epidemic threshold for the susceptible-infected-susceptible dynamics in networks. Physical Review Letters, 111(6), 068701.
BOLLEN, J., Mao, H., & Zeng, X. (2011). Twitter mood predicts the stock market. Journal of Computational Science, 2(1), 1–8.
CASTELLANO, C., & Pastor-Satorras, R. (2010). Thresholds for epidemic spreading in networks. Physical Review Letters, 105(21), 218701.
CLIFFORD, P., & Sudbury, A. (1973). A model for spatial conflict. Biometrika, 60(3), 581–588.
COHEN, J. P., & Lo, H. Z. (2014). Academic Torrents: A community-maintained distributed repository. Annual Conference of the Extreme Science and Engineering Discovery Environment.
DE Francisci Morales, G., Monti, C., & Starnini, M. (2021). No echo in the chambers of political interactions on Reddit. Scientific Reports, 11(1), 2818.
DEFFUANT, G., Neau, D., Amblard, F., & Weisbuch, G. (2000). Mixing beliefs among interacting agents. Advances in Complex Systems, 3(01n04), 87–98.
DU, J., Grave, E., Gunel, B., Chaudhary, V., Celebi, O., Auli, M., Stoyanov, V., & Conneau, A. (2021). Self-training improves pre-training for natural language understanding. Proceedings of the 2021 Conference of the North American Chapter of the Association for Computational Linguistics: Human Language Technologies.
FORAMITTI, J. (2021). AgentPy: A package for agent-based modeling in Python. Journal of Open Source Software, 6(62), 3065.
GERA, A., Halfon, A., Shnarch, E., Perlitz, Y., Ein-Dor, L., & Slonim, N. (2022). Zero-shot text classification with self-training. arXiv preprint. arXiv:2210.17541.
GOLUB, B., & Jackson, M. O. (2010). Naïve learning in social networks and the wisdom of crowds. American Economic Journal: Microeconomics, 2(1), 112–149.
HILL, A. L., Rand, D. G., Nowak, M. A., & Christakis, N. A. (2010). Emotions as infectious diseases in a large social network: The SISa model. Proceedings of the Royal Society B: Biological Sciences, 277(1701), 3827–3835.
HOLLEY, R. A., & Liggett, T. M. (1975). Ergodic theorems for weakly interacting infinite systems and the voter model. The Annals of Probability, 3(4), 643–663.
HUNTER, E., Mac Namee, B., & Kelleher, J. D. (2017). A taxonomy for agent-based models in human infectious disease epidemiology. Journal of Artificial Societies and Social Simulation, 20(3), 2.
JIN, F., Dougherty, E., Saraf, P., Cao, Y., & Ramakrishnan, N. (2013). Epidemiological modeling of news and rumors on Twitter. Proceedings of the 7th Workshop on Social Network Mining and Analysis.
KEARNEY, C., & Liu, S. (2014). Textual sentiment in finance: A survey of methods and models. International Review of Financial Analysis, 33, 171–185.
KENYON-DEAN, K., Ahmed, E., Fujimoto, S., Georges-Filteau, J., Glasz, C., Kaur, B., Lalande, A., Bhanderi, S., Belfer, R., Kanagasabai, N., Sarrazingendron, R., Verma, R., & Ruths, D. (2018). Sentiment analysis: It’s complicated! Proceedings of the 2018 Conference of the North American Chapter of the Association for Computational Linguistics: Human Language Technologies, Volume 1 (Long Papers), New Orleans, Louisiana.
LEWIS, M., Liu, Y., Goyal, N., Ghazvininejad, M., Mohamed, A., Levy, O., Stoyanov, V., & Zettlemoyer, L. (2019). BART: Denoising sequence-to-sequence pre-training for natural language generation, translation, and comprehension. arXiv preprint. arXiv: 1910.13461.
LIU, Q., & Son, H. (2024). Methods for aggregating investor sentiment from social media. Humanities and Social Sciences Communications, 11(1), 1–22.
LO, H. Z., & Cohen, J. P. (2016). Academic Torrents: Scalable data distribution. Neural Information Processing Systems Challenges in Machine Learning (CiML) workshop.
LUCCHINI, L., Aiello, L. M., Alessandretti, L., De Francisci Morales, G., Starnini, M., & Baronchelli, A. (2022). From Reddit to Wall Street: The role of committed minorities in financial collective action. Royal Society Open Science, 9(4), 211488.
MANCINI, A., Desiderio, A., Di Clemente, R., & Cimini, G. (2022). Self-induced consensus of Reddit users to characterise the gamestop short squeeze. Scientific Reports, 12(1), 13780.
MCPHERSON, M., Smith-Lovin, L., & Cook, J. M. (2001). Birds of a feather: Homophily in social networks. Annual Review of Sociology, 27(1), 415–444.
MISHEV, K., Gjorgjevikj, A., Vodenska, I., Chitkushev, L., & Trajanov, D. (2020). Evaluation of sentiment analysis in finance: From lexicons to transformers. IEEE Access, 8.
MORENO, Y., Nekovee, M., & Pacheco, A. F. (2004). Dynamics of rumor spreading in complex networks. Physical Review E, 69(6), 066130.
MUI, L. (2002). Computational models of trust and reputation: Agents, evolutionary games, and social networks. PhD Thesis, Massachusetts Institute of Technology.
NEKOVEE, M., Moreno, Y., Bianconi, G., & Marsili, M. (2007). Theory of rumour spreading in complex social networks. Physica A: Statistical Mechanics and Its Applications, 374, 457–470.
PANG, B., & Lee, L. (2005). Seeing stars: Exploiting class relationships for sentiment categorization with respect to rating scales. arXiv preprint cs/0506075.
PASTOR-SATORRAS, R., & Vespignani, A. (2001). Epidemic spreading in scale-free networks. Physical Review Letters, 86(14), 3200.
PELICON, A., Pranjić, M., Miljković, D., Škrlj, B., & Pollak, S. (2020). Zero-shot learning for cross-lingual news sentiment classification. Applied Sciences, 10(17), 5993.
RANCO, G., Aleksovski, D., Caldarelli, G., Grčar, M., & Mozetič, I. (2015). The effects of Twitter sentiment on stock price returns. PLos One, 10(9), e0138441.
ROZIN, P., & Royzman, E. B. (2001). Negativity bias, negativity dominance, and contagion. Personality and Social Psychology Review, 5(4), 296–320.
SHERCHAN, W., Nepal, S., & Paris, C. (2013). A survey of trust in social networks. ACM Computing Surveys (CSUR), 45(4), 1–33.
SKAZA, J., & Blais, B. (2017). Modeling the infectiousness of Twitter hashtags. Physica A: Statistical Mechanics and Its Applications, 465, 289–296.
SOCHER, R., Perelygin, A., Wu, J., Chuang, J., Manning, C. D., Ng, A., & Potts, C. (2013). Recursive deep models for semantic compositionality over a sentiment treebank. Proceedings of the 2013 Conference on Empirical Methods in Natural Language Processing, Seattle, Washington, USA.
SOOD, V., & Redner, S. (2005). Voter model on heterogeneous graphs. Physical Review Letters, 94(17), 178701.
TESFAGERGISH, S. G., Kapočiūtė-Dzikienė, J., & Damaševičius, R. (2022). Zero-shot emotion detection for semi-supervised sentiment analysis using sentence transformers and ensemble learning. Applied Sciences, 12(17).
VAN de Bunt, G. G., Wittek, R. P., & de Klepper, M. C. (2005). The evolution of intra-organizational trust networks: The case of a German paper factory - An empirical test of six trust mechanisms. International Sociology, 20(3), 339–369.
WANG, G., Sun, J., Ma, J., Xu, K., & Gu, J. (2014). Sentiment classification: The contribution of ensemble learning. Decision Support Systems, 57, 77–93.
WANG, G., WANG, T., WANG, B., Sambasivan, D., Zhang, Z., Zheng, H., & Zhao, B. Y. (2015). Crowds on wall street: Extracting value from collaborative investing platforms. Proceedings of the 18th Acm Conference on Computer Supported Cooperative Work & Social Computing, 17–30. https://doi.org/10.1145/2675133.2675144
WANKHADE, M., Rao, A. C. S., & Kulkarni, C. (2022). A survey on sentiment analysis methods, applications, and challenges. Artificial Intelligence Review, 55(7), 5731–5780.
WILLIAMS, A., Nangia, N., & Bowman, S. (2018). A broad-coverage challenge corpus for sentence understanding through inference. Proceedings of the 2018 Conference of the North American Chapter of the Association for Computational Linguistics: Human Language Technologies, Volume 1 (Long Papers).
WU, H., Arenas, A., & Gómez, S. (2017). Influence of trust in the spreading of information. Physical Review E, 95(1), 012301.
YANG, S., Rosenfeld, J., & Makutonin, J. (2018). Financial aspect-based sentiment analysis using deep representations. arXiv preprint. arXiv:1808.07931.
YIN, W., Hay, J., & Roth, D. (2019). Benchmarking Zero-Shot text classification: Datasets, evaluation and entailment approach. Proceedings of the 2019 Conference on Empirical Methods in Natural Language Processing and the 9th International Joint Conference on Natural Language Processing (EMNLP-IJCNLP).
ZANETTE, D. H. (2002). Dynamics of rumor propagation on small-world networks. Physical Review E, 65(4), 041908.
ZHAO, L., Li, L., & Zheng, X. (2020). A BERT based sentiment analysis and key entity detection approach for online financial texts. arXiv preprint. arxiv: 2001.05326.
ZHAO, L., Wang, J., Huang, R., Cui, H., Qiu, X., & Wang, X. (2014). Sentiment contagion in complex networks. Physica A: Statistical Mechanics and Its Applications, 394, 17–23.
ZOU, Y., Yu, Z., Liu, X., Kumar, B., & Wang, J. (2019). Confidence regularized self-training. Proceedings of the IEEE/CVF International Conference on Computer Vision.