Explaining the “Harmonic” Signature in a Tag-Based Model of the Evolution of Altruism

aSchool of Complex Adaptive Systems, Arizona State University, United States; b Max Planck Institute for Geoanthropology, Jena, Germany.
Journal of Artificial
Societies and Social Simulation 29 (4) 11
<https://www.jasss.org/29/4/11.html>
DOI: 10.18564/jasss.6197
Received: 12-Dec-2025 Accepted: 24-Sep-2026 Published: 31-Oct-2026
Abstract
This paper offers an explanation for the anomalous and unexplained behavior of an agent-based model previously described in JASSS in 2015. In their model of tag-based altruism, Shutters and Hales described a curious and unexpected “harmonic” or quantized signature observed in the model's output. This manuscript synthesizes two lines of analysis in an attempt to explain these results. First, it provides a conceptual explanation for the presence of sharp thresholds in the evolved donation rate when the number of interactions per generation \(P\) crosses integer multiples of the benefit–cost ratio \(b/c\). Second, it presents a minimal analytic toy model that reproduces quantized cooperation levels with thresholds at \(P \approx n(b/c)\). Throughout, this study interprets these results in the broader context of graph-structured cooperation and tag-based altruism in evolutionary game theoryIntroduction
In a 2015 article in this journal, Shutters and Hales (hereafter SH) reported a curious and unexpected “harmonic signature” in an agent-based model of tag-based altruism on networks (Shutters & Hales 2015b): as the number of interaction opportunities per agent per generation \(P\) increases, the evolved donation rate does not vary smoothly but instead lies on a set of discrete curves separated by sharp drops at \(P = n(b/c)\), where \(n\) is a positive integer and \(b/c\) is the benefit-cost ratio of altruistic acts (Shutters & Hales 2015a). This behavior is not predicted by standard theories of cooperation on graphs or well-mixed populations (Nowak 2006; Nowak & May 1992; Ohtsuki et al. 2006; Szabó & Fáth 2007), nor by earlier tag-based models of which SH was an extension (Riolo et al. 2001; Roberts & Sherratt 2002; Spector & Klein 2006).
The present manuscript brings together a conceptual analysis of the SH model and a deliberately minimal analytical model. To make the argument explicit, the explanation is organized around three questions. First, why do donation rates change sharply at thresholds near \(n(b/c)\), while changing much less between thresholds? Second, why does crossing such a threshold from below produce a downward shift in donation rather than an upward shift? Third, why does donation often increase with \(P\) within each interval between successive thresholds? The main text answers these questions in mechanism-level terms. Appendix A gives a simplified payoff model showing how saturating benefits and linearly accumulated costs produce critical values of \(P\) that scale with \(b/c\). Appendix B then states the central threshold logic as formal propositions and proofs. The aim is explanatory rather than experimental: the paper analyzes previously reported simulation results and does not introduce new simulation runs.
Together, these pieces do not constitute a full closed-form solution of the original SH model (Shutters & Hales 2015b) – this would require solving a very high-dimensional stochastic process over network positions, tags, tolerances, strategies, and reproduction events. They do, however, provide a coherent theoretical account of why the harmonic signature appears, how thresholds at \(P \approx n(b/c)\) arise, and what kind of functional forms are compatible with the observed branch structure.
The emergence of quantized altruism curves
In the original SH agent-based model, the level of evolved altruism (measured as the donation rate – the fraction of interactions where agents donate) does not vary smoothly with certain model parameters (Shutters & Hales 2015a). Instead, it falls onto a set of distinct curve segments separated by abrupt drops (Figure 1). In particular, when the number of pairwise interactions per agent per generation \(P\) is increased, the donation rate generally rises, but at each point where \(P\) equals a multiple of the benefit-to-cost ratio \((b/c)\) of altruism, the system “jumps” down to a lower branch. The authors originally called this a “harmonic signature”, since the donation outcomes cluster along discrete “harmonic” curves as \(P\) crosses each multiple of \(b/c\).
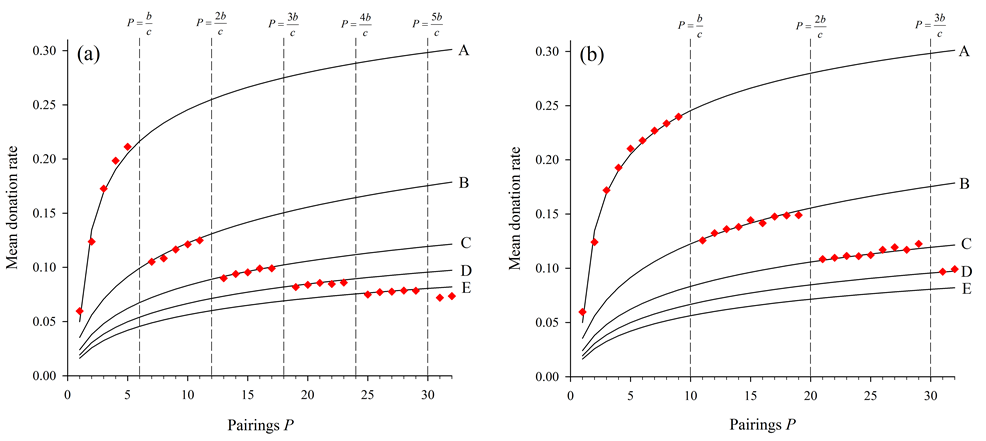
A perhaps clearer description is a quantized signature: only certain quantized levels of altruism are realized, rather than every intermediate value (Figure 1). The model outcomes for different \(b/c\) values all align with a single family of curves A, B, C, … (each curve corresponding to one interval between successive multiples of \(b/c\)). When \(P\) lies between 0 and \(b/c\), the donation rate falls on “Curve A”; when \(P\) is between \(b/c\) and \(2b/c\), it falls on “Curve B”; and so on. Crossing \(P = b/c, 2b/c, 3b/c, \ldots\) triggers sharp downward discontinuities, dropping the population onto the next lower curve. This quantized outcome is robust across different scenarios: varying \(b/c\) shifts where the drops occur (always at \(P = n(b/c)\)) without altering the shape of the fundamental curves. The result is a striking stepwise pattern in which mean altruism levels appear constrained to a small number of predictable curves rather than forming one continuous surface.
Why is this so surprising?
Based on standard intuition in evolutionary game theory and agent-based modelling, one would expect that gradually increasing interaction frequency \(P\) would lead to a smooth change in cooperation level. Instead, this model produces phase-like transitions at specific critical points. The donation rate increases within each \(P\)-range, but then “resets” to a lower level each time \(P\) hits a multiple of \(b/c\), creating a quantized ladder of outcomes. In well-mixed or classic evolutionary game models (Axelrod 1984; Nowak 2006), cooperation typically declines more steadily as cost accumulates, or follows a threshold rule (e.g., Ohtsuki’s rule; Ohtsuki et al. 2006) for graphs where cooperation is favored if network degree \(k < b/c\)).
But the SH model displays repeated thresholds at \(k\)-independent positions (multiples of \(b/c\)), a phenomenon not explained by standard theory. It suggests that something in the model’s design, and in particular in the way repeated local interactions are accumulated before selection, is creating discrete cooperation “modes” that defy a purely linear intuition. In the following sections, the explanation is developed from two perspectives: (1) the specific design and mechanics of the simulation, and (2) a more general theoretical interpretation of what underlying principle may be at work.
Relation to accumulated-payoff models on networks
The cumulative-payoff component of the SH model connects the puzzle to a broader literature on payoff accounting in evolutionary games on networks. In many network models, accumulated payoffs amplify the effects of degree, interaction frequency, or local clustering, while average or degree-normalized payoffs can weaken or remove the cooperative advantage produced by heterogeneous structure (Gómez-Gardeñes et al. 2007; Santos & Pacheco 2005, 2006; Szabó & Fáth 2007). This distinction is emphasized in recent agent-based evolutionary game modelling guidance (Izquierdo et al. 2024; see especially Chapter IV-4) and in studies showing that update rules, payoff computation, and timing can substantially alter cooperation levels (Antonioni & Tomassini 2012; Maciejewski et al. 2014; Szolnoki et al. 2008; Tomassini et al. 2007; Wu et al. 2005, 2007).
The novelty claimed here is therefore not that accumulated payoffs matter in general. Rather, the contribution is to explain a more specific pattern: in the SH model, accumulated per-generation costs, stochastic repeated local pairing, and tag-mediated selectivity jointly produce repeated branch changes at approximately integer multiples of \(b/c\). This places the harmonic signature within the existing accumulated-versus-average-payoff literature while identifying the additional mechanism needed to explain why the branch changes occur at these particular values of \(P\).
Model Design Factors and Potential Artifacts
Several features of the model’s design drive the emergence of these quantized curves. Understanding these mechanics reveals that the so-called harmonic signature is not due to a coding bug or trivial artifact, but rather is an emergent consequence of how interactions and selection are structured in the simulation. Key factors include:
Discrete generations with cumulative fitness
In each generation, every agent engages in \(P\) interaction pairings before any reproduction occurs. During those \(P\) encounters, an altruistic agent may pay many costs (each donation costs \(c\)) and receive benefits (each time it receives a donation, it gains \(b\)). Crucially, these payoffs are accumulated, not averaged: an agent’s total fitness is the sum of all benefits minus costs over \(P\) interactions. This means that the total burden of altruism grows linearly with \(P\). If \(P\) is small, an altruist can lose only a small total amount per generation by helping others, but if \(P\) is large, an altruist may incur a large cumulative cost before reproducing.
The threshold can be stated precisely in payoff-comparison terms. Suppose that, relative to a local defector, an altruistic agent receives \(m\) additional benefit units during a generation but pays the cost of \(P\) donations. The relevant payoff difference is:
| \[\Delta_m(P)=mb-Pc.\] | \[(1)\] |
Because \(m\) is an integer count of benefit units, the sign of this comparison can change only when \(Pc\) crosses an integer multiple of \(b\), i.e., at \(P=m(b/c)\). Between two successive thresholds \(n(b/c)\) and \((n+1)(b/c)\), the sign of every such integer-benefit comparison is fixed, apart from equality at a boundary. Appendix B formalizes this as Proposition 1.
For instance, with \(b=1\) and \(c=0.1\) (so \(b/c = 10\)), when \(P = 10\) an altruist who donated in every interaction would pay a total cost \(10 \times 0.1 = 1.0\), which equals the benefit of a single donation. Thus \(P=b/c\) is the point at which one extra benefit unit no longer compensates for the cumulative cost of \(P\) donations. At higher thresholds, the same arithmetic applies to two, three, or more extra benefit units: crossing \(P=n(b/c)\) removes the payoff advantage from comparisons in which the altruist’s relative benefit advantage is exactly \(n\) units of \(b\).
This also explains the direction of the discontinuity. Increasing \(P\) increases the cost term \(Pc\) while leaving the integer benefit count in a given comparison unchanged over that comparison. Thus, when a threshold is crossed from below, some comparisons that previously favored the altruist become ties or comparisons favoring the defector. The reverse does not occur merely by increasing \(P\). Appendix B states this monotonic loss of cooperator-favoring comparisons as Proposition 2. In the full SH model, selection, mutation, tags, and local reproduction translate these local payoff-ordering changes into the observed downward branch shift.
Stochastic pairing vs. symmetric interaction
The model uses stochastic pairing with replacement: each agent’s \(P\) partner choices are random draws, so neighbors can be picked multiple times or sometimes not at all in a given generation. This is a critical design choice. It means interactions per neighbor are uneven–some neighbors might interact many times, others few times or not at all in a generation. This heterogeneity in interaction counts turns out to be vital for sustaining altruism. In fact, SH demonstrated this by comparing to a symmetric pairing scenario: if each agent is forced to interact equally with every neighbor (distributing interactions evenly), altruism collapses to minimal levels for all \(P\). Under symmetric interactions (analogous to an unweighted, regular network where every link is used equally), changing \(P\) has virtually no effect on cooperation, and donation rates stay near zero regardless of \(P\). The nonlinearity arises because stochastic pairing produces a distribution of partner-specific interaction counts rather than a single deterministic count; selection can then act on the favorable and unfavorable tails of that distribution.
At low \(P\), interaction randomness creates chances for altruistic clusters to concentrate their helping mostly among themselves, while some selfish neighbors might be missed by these interactions. For example, by chance an altruistic agent might interact disproportionately with another altruist neighbor (exchanging benefits) and only rarely with a cheating neighbor, yielding a net fitness boost for altruists in that generation. This stochastic asymmetry lets pockets of altruism survive and prosper where a perfectly even interaction schedule would have doomed them. In effect, random pairing introduces variance in how costs and benefits are distributed across partner identities, which is essential for the emergence of high-cooperation outcomes.
As \(P\) increases, however, each agent samples its neighborhood more exhaustively so that the random process begins to approximate a uniform, symmetric distribution of interactions. Every neighbor is likely to be interacted with many times, so the heterogeneity advantage disappears at large \(P\). The simulation results show exactly this trend: as \(P\) grows, altruism declines toward the low baseline that symmetric interactions would predict, but it does so in abrupt steps rather than as a continuous decline.
Adaptive tolerance thresholds (tags)
Each agent’s donation behavior is governed by a “tag similarity” rule with an evolvable tolerance \(T\). An altruist will donate to a neighbor only if the neighbor’s tag is within \(T\) of its own tag. In other words, the neighbor must be sufficiently similar to receive a donation. This mechanism allows dynamic formation of altruistic clusters: agents with similar tags and high tolerance reciprocate altruism, while agents that are too different are effectively excluded from receiving donations. Similar tag-mediated clustering mechanisms are explored in other models of ethnocentrism and tag-based altruism (e.g., Axelrod et al. 2004; Hammond & Axelrod 2006).
The tolerance threshold \(T\) evolves under selection, and it tends to adjust to the interaction regime. When \(P\) is small (few interactions), the cost of being generous is low, so altruists can afford a broader tolerance: they will help a wider range of neighbors. This yields a relatively high overall donation rate because many encounters meet the similarity criterion.
As \(P\) rises, however, donating widely becomes more costly (many interactions \(\times\) cost each). Altruists under pressure will evolve narrower tolerance, effectively becoming more selective about whom they help. Narrower tolerance means only very like-tagged neighbors (often forming a tight-knit cluster) receive donations; others, even if within physical reach, are ignored. This self-limiting strategy protects altruists from paying the cost to help distant or mismatched individuals, including potential cheaters with different tags, but it also reduces the proportion of encounters that result in donation.
Thus, the population’s mean donation rate drops whenever altruists are forced to ratchet down their tolerance. The quantized drops at \(P = b/c, 2b/c, \ldots\) can be understood as points where the evolutionarily stable tolerance shrinks significantly. For example, just below \(P = b/c\), altruists might sustain a moderate tolerance that yields frequent donations. Once \(P\) crosses that threshold, those tolerant altruists can be exploited too much; the fitter strategy is to sharply lower \(T\) (donate only to a tighter tag group).
The result is a sudden fall to a lower donation equilibrium. After the drop, altruists that remain form tighter tag clusters but still benefit from mutual help within those clusters. As \(P\) continues to increase in the new regime, these clusters can interact more frequently among themselves, allowing donation rates to increase again until the next threshold where tolerance must readjust downward. In summary, tag-based tolerance adaptation injects a nonlinear feedback: altruism levels stay high until a critical interaction frequency makes broad altruism unsustainable, at which point the population jumps into a more insular cooperative mode (lower \(T\), fewer donations).
Local reproduction and competition
The model’s reproduction step uses tournament selection between neighbors: each agent compares fitness with one random neighbor and the “winner” (higher payoff) survives or is copied. This localized selection means that altruistic clusters can outperform and replace neighboring cheaters if their local fitness is higher. When interactions are infrequent and uneven, altruist-rich clusters often have much higher local fitness than scattered cheaters, so altruists spread. But at the \(P\) thresholds, a cheater placed inside an altruist cluster (for instance, arising via mutation with a matching tag) suddenly gains a larger advantage. At \(P = b/c\), a tag-matching cheater can reap roughly the same total benefits as its altruistic neighbors without paying any cost, so it will win local competitions and start to take over the cluster.
This selection pressure hastens the collapse of the high-donation regime at the threshold. After the drop, the new lower donation regime (with narrow tolerance clusters or fewer altruists) finds a balance where cheaters’ advantage is limited again, for instance if clusters are so tight or tolerance so low that cheaters rarely receive donations. The local nature of competition thus reinforces the stepwise transitions: each branch is like a different selection equilibrium where altruist and cheater strategies coexist in a certain proportion. As \(P\) increases past a multiple of \(b/c\), that equilibrium becomes unstable and flips to a new one. The donation rate can only fall on those equilibrium levels, not in between, giving the quantized appearance.
In summary, the design of the simulation creates conditions for critical thresholds. The combination of cumulative interaction costs, random pairing heterogeneity, and evolving tag-based donation rules yields a scenario where increasing interaction frequency \(P\) gradually erodes the advantages of altruism until, at specific points, the system undergoes a sudden reconfiguration. These reconfigurations manifest as the abrupt drops onto lower donation curves. Importantly, this is not a quirk of a particular implementation; the findings were replicated across independent implementations of the same pseudocode. Nor is it limited to one network structure: it appears in rings, lattices, random graphs, and scale-free networks alike, whenever interactions are stochastic. Thus, while the effect arises from the model’s mechanics, it points to a more general phenomenon rather than a coding error or purely artificial artifact.
Fundamental Dynamics Underlying the Discrete “Harmonics”
Beyond the specifics of the code, we can interpret the harmonic/quantized signature as revealing a fundamental dynamic in repeated local interactions. In essence, the model is highlighting how cooperation in structured populations is highly sensitive to the frequency of interaction, not just the network structure or payoff ratio in isolation. The discontinuities at \(P = b/c, 2b/c, \ldots\) suggest threshold points in the system’s dynamics. The next subsections connect the three questions stated in the introduction to the mechanisms just described.
Threshold of interaction frequency for cooperation
The multiples of \(b/c\) act like critical frequencies at which the net gains of a given altruistic mode turn zero or negative. This echoes known results in evolutionary theory; for instance, Ohtsuki’s rule for graph-structured games (Ohtsuki et al. 2006) states that cooperation can evolve when \(b/c>k\) (the benefit-cost ratio exceeds the average degree). In the SH case, \(k\) (network degree) is held fixed, but \(P\) (interaction count per generation) plays a related role because it determines how much cost can accumulate before reproduction. The first major drop occurs at \(P=b/c\), the point at which one donor’s cumulative cost equals one recipient benefit. More generally, if a mode relies on \(n\) additional benefit units to compensate the cost of donation, it is vulnerable when \(P\) reaches \(n(b/c)\).
This provides an answer to the first question. Between adjacent thresholds, the same payoff comparisons remain ordered in the same way under the stylized comparison in Appendix B. At the threshold itself, at least one class of local comparison can change sign. The full ABM then expresses that change as a reorganization in tag tolerance, local cluster composition, and donation rate.
This also answers the second question. The drop is downward because increasing \(P\) increases the cumulative cost term while leaving the relevant discrete benefit count fixed within a comparison. Crossing a threshold therefore removes some cooperator advantages; it does not create new advantages for donors in the same local payoff comparison. Thus, the high-donation mode becomes unstable and the system moves to a more selective mode with a lower observed donation rate.
Role of interaction heterogeneity (variance vs. mean)
Another way to view the harmonic signature is through the lens of statistical variance. Cooperation in this model benefits from variance in interaction counts across pairs. When \(P\) is small, variance is high: some neighbors may interact zero times, others two or three times. This variance allows two kinds of outcome to coexist: lucky clusters, in which altruists mostly meet other altruists, and unlucky links, in which altruists meet cheaters too often. Evolution can then favor those lucky clusters. Importantly, the uneven distribution does not mean that an all-giving altruist pays less than \(Pc\) in total initiated costs. Rather, it changes which neighbors receive those costly acts and which reciprocal benefits are activated.
As \(P\) increases, the distribution of interactions per neighbor becomes tighter around the mean by the law of large numbers. Essentially, higher \(P\) washes out chance fluctuations and enforces a more uniform experience for all agents. The harmonic drops mark the points where this increasing uniformity, together with the linear accumulation of cost, is strong enough to undermine the previously viable cooperation mode. At \(P = b/c\), even previously “lucky” altruists can no longer rely on one additional benefit unit to offset the cost of a full set of donations.
Therefore, the discontinuous decline in donation can be interpreted as a transition from a variance-dominated regime to a more mean-dominated regime. In the variance-dominated regime (lower \(P\)), cooperative behavior can exploit the randomness because some agents fare very well, boosting altruism. In the mean-dominated regime (higher \(P\)), everyone experiences nearly the same proportion of defectors and cooperators, so the usual tragedy of the commons exerts stronger pressure and reduces altruism.
The quantized curves are the remnants of variance-driven pockets of cooperation that can survive up to specific limits. This also explains why the authors speak of a harmonic pattern: like resonance peaks, \(P = n(b/c)\) are points where the system’s variability gives way to symmetry, forcing cooperation to drop to a well-defined lower level.
Altruistic tag clusters as discrete modes
The tag-based mechanism effectively creates cooperation modes: subpopulations of agents that cooperate internally. Each mode is characterized by how inclusive the altruists are (their tolerance \(T\) and tag cluster size) and how they balance helping versus self-protection. These modes correspond to the different branches (curves A, B, C, …) observed in Figure 1. When \(P\) is low, the stable mode is a large, inclusive altruistic cluster (high \(T\), many agents sharing donations), so high donation rates result. When that mode becomes unsustainable at the threshold, the system shifts to a mode of smaller or more selective clusters (lower \(T\)). This new mode has fewer donation events because each cluster is more exclusive, producing a lower overall donation rate.
Yet within each tight cluster, altruists still help each other frequently, so as \(P\) continues to rise, those within-cluster interactions can increase the expected number of activated cooperative encounters and thus gradually raise the donation rate again. This provides an answer to the third question. Appendix B formalizes the simplest version of this claim: within a fixed viable mode, the probability of activating a cooperative neighbor increases smoothly with \(P\), even though the mode eventually loses viability because costs continue to accumulate while benefits saturate.
In essence, each quantized plateau corresponds to altruism operating at a different scale: first at the whole-neighborhood scale, then at a smaller subgroup scale, then even smaller, and so on. The fact that these are quantized suggests that only certain structured configurations of altruists are evolutionarily stable for a given interaction frequency range. The system cannot settle at every intermediate form; it selects a mode that either uses variance to maintain large clusters (when \(P\) is low) or reduces exposure to survive high \(P\). Any halfway strategy is unstable, leading to the crisp boundaries between modes.
Universality across network structures
Figure 2 demonstrates that this quantized signature is not an idiosyncrasy of the ring network, but seems to be a broader phenomenon within the family of repeated local-interaction structures studied by SH. The figure plots the evolved donation rate versus \(P\) for several different network topologies (ring lattice, regular lattices with degree 4 and 8, a random regular graph, and a scale-free network), all with \(b/c = 8\). In every case the donation rate rises and then drops sharply at \(P = 8\) (\(b/c\)) and again at \(P = 16\) (\(2b/c\)). The levels of altruism differ by topology (e.g., the scale-free network achieves a higher donation rate than the ring; cf. Santos & Pacheco 2005), but the timing of the drops is the same, and the outcome curves in each \(P\)-range are parallel.
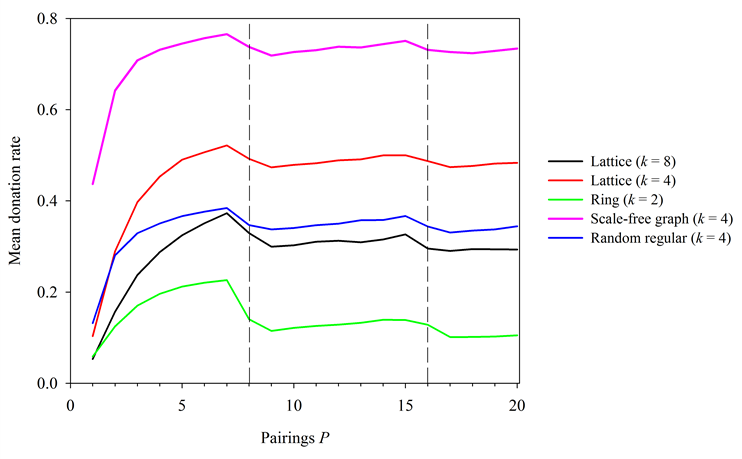
This implies that the mechanism causing the harmonic pattern is not the specific network geometry alone. All these networks share the feature that interactions are local and randomly repeated; thus all exhibit the critical \(P = n(b/c)\) effect. The quantized curves observed may therefore represent a more general mechanism for repeated local interactions with accumulated costs and saturating local benefits: within this class, cooperation plateaus can be separated by drops at frequencies where cumulative costs equal integer numbers of benefit units.
In social terms, this could mean that there is a natural upper limit to how frequently altruistic acts can occur in a community, relative to their benefit–cost ratio, before the cooperative structure must reorganize. If everyone interacts too frequently without adjusting who they help, free-riders gain the upper hand and the community’s level of cooperation steps down. This insight is not immediately obvious from models that hold interaction frequency constant, couple it directly to network degree, or average it away. Here, the explicit variation of \(P\) uncovers a latent quantization in cooperative outcomes that might otherwise be missed. This indicates that the harmonic signature is a phenomenon driven by interaction frequency relative to \(b/c\), in interaction with stochastic local pairing and tag-mediated selectivity, rather than an artifact of a particular network.
Conclusion: Why the Output is “Quantized”
Bringing the strands together, the curious curves in Figure 1 and Figure 2 emerge because of an interplay between model-specific mechanisms and a deeper principle of cooperative interactions. On one hand, the design of the simulation (random partner selection, threshold-based giving, and fitness accumulated over many encounters) creates the conditions for discontinuities. It amplifies the effects of interaction frequency: at certain points, altruistic strategy must fundamentally shift to remain viable, causing a discontinuous drop in observed cooperation.
On the other hand, this appears to reflect a threshold property: cooperation in a structured population can sustain a given high-donation mode only up to a certain interaction frequency per generation, roughly determined by the benefit-cost ratio and by the number of effective reciprocal benefits available in a local cluster. Beyond that point, the system moves to a different regime of cooperation at a lower level. What is remarkable is that these regimes are quantized: the model produces a limited set of stable cooperation modes rather than a continuum. This was not predicted by existing theory, making it a novel insight from the agent-based approach.
In more intuitive terms, altruistic communities thrive on being somewhat selective and not overburdening their members. If individuals help too many others too frequently, they become vulnerable to exploitation and their generosity must contract. The agent-based model made this evident by varying \(P\). Each abrupt drop is essentially the population reorganizing its altruistic behavior to a safer mode (more clustered, less frequent helping) once a critical interaction rate is hit. This quantized pattern was hidden in prior studies because researchers often either fixed the number of interactions or coupled it directly to network size (making \(P\) and degree confounded). SH decoupled these factors and discovered the harmonic signature, challenging the community to explain it.
From a theoretical standpoint, the harmonic signature underscores that interaction frequency is as important as network structure in evolutionary outcomes. It highlights a non-obvious property: stochastic interaction patterns can support high cooperation up to precise limits, beyond which cooperation falters in a stepwise fashion. This is not accounted for in classic models that assume well-mixed averaging or static interaction counts. Therefore, the curves should not be dismissed as a mere artifact. They point to a dynamic that may be present in systems where agents repeatedly interact, accumulate gains and losses over a generation, and can adjust their selectivity.
Framed this way, the quantized signature connects to a broader theme in the study of cooperation: that cooperative outcomes in structured populations often behave less like a smooth continuum and more like a set of discrete regimes separated by abrupt transitions. Phase-transition-like behavior and sharp thresholds are well documented in evolutionary games on graphs (Szabó & Fáth 2007), and threshold rules such as Ohtsuki’s \(b/c > k\) (Ohtsuki et al. 2006) already show that cooperation can switch on or off at critical parameter values. What the SH model adds is a repeated threshold structure along a single axis — interaction frequency — rather than a single on/off transition. The quantized curves can therefore be read as a sequence of cooperation regimes, each stable over a band of interaction frequencies, echoing the more general observation that heterogeneity and payoff accounting can carve the space of cooperative outcomes into discrete, self-consistent modes rather than a continuous gradient (Santos & Pacheco 2006; Szabó & Fáth 2007). Viewed in this light, the harmonic signature is less an isolated curiosity of one tag-based model and more a particularly clean example of a phenomenon the cooperation literature has approached from several directions.
Standard evolutionary game-theoretic intuition did not predict quantized cooperation levels, but this model suggests such plateaus can exist. Whether one frames it as an artifact of a specific simulation design or a more general social principle depends on context, but the safest interpretation is that it is an emergent phenomenon of the evolutionary process under specific but plausible conditions: local, repeated interactions with accumulated payoffs and tag-based altruism.
In conclusion, the reason the output quantity (donation rate) falls only on those quantized curves is that the evolutionary system finds stable altruism only at certain discrete levels, determined by interaction frequency relative to the benefit-cost ratio and by the effective scale of altruistic clusters. Each curve represents a consistent balance between altruistic giving and exploitation that can persist for a range of \(P\), until a multiple of \(b/c\) disrupts that balance. When that disruption happens, the system transitions to the next equilibrium state: a new quantized level of cooperation.
These findings invite us to revise our mental models of cooperation: instead of a smooth continuum, cooperation might occur in steps or plateaus under varying interaction conditions. What initially looked like a mysterious harmonic pattern is explained by the model’s architecture and by the threshold arithmetic of accumulated costs. A more general rule suggested by this analysis is that, to sustain altruism, interaction frequency and cooperative selectivity must remain proportional to the benefit-cost ratio. If this proportionality is maintained, altruism can flourish; if it is breached at distinct points, cooperation realigns itself on a lower quantized plane. This insight was not obvious beforehand, making the results both unexpected and theoretically rich in the context of agent-based social simulation.
Model availability and scope of the present analysis
The present paper introduces no new simulation code, simulation data, or reruns of the SH model. Its contribution is analytical and explanatory: it attempts to explain the harmonic signature already reported by SH using a mechanism-level reading of the model and a simplified mathematical abstraction. Readers who wish to inspect or rerun the original computational model can use the CoMSES Computational Model Library entry for the SH model (Shutters & Hales 2015b). The toy model in Appendix A is not a reimplementation of that model; it is an analytical abstraction designed to isolate the threshold mechanism.
Appendix A: A Toy Analytical Model of the Shutters-Hales (SH) ABM
This appendix builds a toy model demonstrating a clean threshold in \(P\) that scales like \(b/c\). It is critical to clarify that this is not a closed-form solution of the full SH model (Shutters & Hales 2015b). Instead, it is an analytical toy model that captures the key mechanisms emphasized in the main text: benefits from a finite local neighborhood saturate, while donation costs grow linearly with the number of interactions \(P\), which forces a threshold \(P^* \propto b/c\). Consider it a mathematical exploration of the model showing that, if several selective “cooperation modes” are available, the result is multiple thresholds \(\implies\) quantized regimes.
The toy model intentionally differs from the SH ABM in several ways:
- the local neighborhood is treated as fixed during the payoff calculation;
- neighbors are summarized as “good” or “bad” rather than being generated endogenously by evolving tags and tolerances;
- mutation, tag drift, network position, and local tournament reproduction are not explicitly simulated;
- payoffs are expected values, not realized stochastic histories; and
- benefit from a given cooperative neighbor is treated as saturating within a generation.
These simplifications are deliberate. They isolate the threshold mechanism and are not intended to replace simulation of the full model.
A minimal “cluster with repeated interactions” model
Consider one altruistic “cluster” sitting in a fixed neighborhood:
- Each agent has \(K\) neighbors.
- A fraction \(\varphi\) of these neighbors are “good” neighbors (same tag / same group) who are willing to reciprocate altruism.
- The remaining neighbors are “bad” neighbors (cheaters or tag-dissimilar) who never reciprocate.
Now impose the key features from SH:
- Each agent initiates \(P\) interactions per generation with neighbors, with replacement (i.e., random draws from the \(K\) neighbors, independent each time).
- In every interaction, a cooperator pays cost \(c\) to help the neighbor in this simplest version; a defector never pays.
- Benefits saturate at most once per neighbor per generation: if a good neighbor is encountered at least once in a generation and helped, that relationship yields benefit \(b\) for that generation.
- Interacting with the same good neighbor ten times in that generation does not yield \(10 \times b\); once is enough. Extra help is just extra cost.
This “one benefit per neighbor per generation” assumption is the analytic stand-in for the saturating partner benefit that a fixed local cluster can provide in one generation, while the cost of helping every time an agent donates grows linearly with \(P\).
Expected number of distinct good neighbors you touch
You draw \(P\) neighbors with replacement from the set of \(K\) neighbors.
- Probability a particular neighbor is never selected in \(P\) draws \(=(1-1/K)^P\).
- Probability you touch that neighbor at least once \(=1-(1-1/K)^P\).
There are \(\varphi K\) good neighbors, so the expected number of distinct good neighbors you meet at least once is
| \[\mbox{GoodDistinct}(P)=\varphi K(1-(1-1/K)^P).\] | \[(2)\] |
Each such neighbor yields benefit \(b\), so the expected benefit for a cooperator is
| \[B(P)=b \varphi K(1-(1-1/K)^P).\] | \[(3)\] |
Cost of cooperation
By assumption, a cooperator always donates whenever it acts as donor in this simplest toy model. It initiates exactly \(P\) interactions per generation, so:
| \[C(P)=cP.\] | \[(4)\] |
Alternatively, one can assume it donates only to good neighbors, so that \(C(P)\) becomes \(c \times\) the expected number of good-donor interactions, which is still linear in \(P\) for a fixed donation rule and therefore does not change the qualitative result.
Payoff of cooperator vs. defector
Now let us compare a pure cooperator to a pure defector embedded in the same neighborhood. Cooperator payoff is
| \[W_C (P)=B(P)-C(P)=b\varphi K(1-(1-1/K)^P)-cP,\] | \[(5)\] |
while defector payoff (in the simplest version, where only cooperators initiate helpful relationships) is
| \[W_D (P)=0.\] | \[(6)\] |
The key object is the fitness difference:
| \[F(P):=W_C (P)-W_D (P)=b\varphi K(1-(1-1/K)^P)-cP.\] | \[(7)\] |
Cooperation is favored (can invade/stay) when \(F(P)>0\), and disfavored when \(F(P)<0\).
Proving there is a unique critical \(P^*\)
We now show that, under a mild condition on \(b,c,\varphi\), there is exactly one positive \(P^*\) where \(F(P^*)=0\), and that \(F(P)>0\) for \(0<P<P^*\) while \(F(P)<0\) for \(P>P^*\). This gives a clean, formally proved threshold in \(P\).
Values and derivatives at 0 and \(\infty\)
At \(P=0\) there are no interactions, no cost, and no benefit, so that
| \[F(0)=b\varphi K(1-1^0)-c0=0.\] | \[(8)\] |
For very large \(P\), \((1-1/K)^P\to 0\) and thus the benefit term saturates at \(b\varphi K\), while the cost term grows linearly without bound. Hence
| \[\lim_{P \to \infty}F(P)=-\infty.\] | \[(9)\] |
Now consider the derivative:
| \[\begin{split} F'(P) &= b\varphi K \frac{d}{dP}(1-(1-1/K)^P)-c \\ &=b\varphi K\bigl[-(1-1/K)^P \ln(1-1/K)\bigr]-c. \end{split}\] | \[(10)\] |
Because \(0<1 - 1/K<1\), we have \(\ln(1 - 1/K)<0\), so \(-\ln(1 - 1/K)>0\). The second derivative is
| \[F''(P)=b\varphi K\bigl[-\ln(1-1/K)\bigr]\ln(1-1/K)(1-1/K)^P<0.\] | \[(11)\] |
Thus \(F\) is strictly concave in \(P\): its slope decreases monotonically as \(P\) increases.
At \(P=0\),
| \[F'(0)=b\varphi K\bigl[-\ln(1-1/K)\bigr]-c.\] | \[(12)\] |
If
| \[b\varphi K\bigl[-\ln(1-1/K)\bigr]>c,\] | \[(13)\] |
then cooperation has a positive initial slope advantage. For large \(K\), \(-\ln(1-1/K)\approx1/K\), so this condition is approximately \(b\varphi>c\).
Under this condition, \(F(0)=0\) and \(F\) initially increases above zero. Since \(F\) is strictly concave and \(\lim_{P\to\infty}F(P)=-\infty\), it can cross the horizontal axis exactly once for \(P>0\). Therefore there is a unique positive root \(P^*>0\) satisfying \(F(P^*)=0\), and
| \[F(P) = \left\{\begin{array}{ll} >0 & \text{for } 0 < P < P^*\\ =0 & \text{for } P = P^*\\ <0 & \text{for } P > P^*. \end{array}\right.\] |
This formally exhibits a critical interaction number \(P^*\) at which the cooperation regime flips in the simplified payoff comparison.
How does \(P^*\) scale with \(b/c\)?
We now consider how \(P^*\) depends on \(b\) and \(c\). The defining equation is
| \[F(P^*)=0 \Leftrightarrow b\varphi K \bigl(1-(1-1/K)^{P^*}\bigr) = cP^*.\] | \[(14)\] |
While there is no elementary closed-form solution for \(P^*\), we can understand the asymptotics. When \(P^*\) is large compared to \(K\), \((1-1/K)^{P^*}\approx e^{-P^* /K}\) is very small, so the benefit term saturates near \(b\varphi K\):
| \[b\varphi K(1-e^{-P^* /K}) \approx b\varphi K.\] | \[(15)\] |
The equality is then approximately \(b\varphi K \approx cP^*\), and thus
| \[P^* \approx (b/c) \varphi K.\] | \[(16)\] |
Thus, \(P^*\) is proportional to \(b/c\). The proportionality factor \(\varphi K\) is the effective number of good neighbors from which a cooperator can obtain saturated benefits in a generation. This is the mathematical core of the “critical \(P\) compared to \(b/c\)” finding in the SH model.
From one threshold to quantized regimes
To mimic the multiple branches (A, B, C, …) in Figure 1, let us now introduce several possible cooperation modes. Each mode \(j\) has two key quantities:
- an effective benefit capacity \(M_j\), interpreted as the number of reciprocal neighbors or relationships that can be activated in that mode; and
- a donation exposure \(q_j \in (0,1]\), interpreted as the fraction of initiated interactions that generate a donation cost under that mode’s tolerance/selectivity rule.
Broad modes have high donation rates and large exposure; restrictive modes have lower donation rates and lower exposure.
For mode \(j\), the same calculation gives
| \[F_j(P) = bM_j(1-(1-1/K)^P )-cq_jP,\] | \[(17)\] |
so that mode \(j\) is viable when \(F_j(P)>0\). Its threshold satisfies
| \[P_j^* \approx (b/c)\frac{M_j}{q_j}\] | \[(18)\] |
in the saturated-benefit regime. This expression clarifies why a lower-donation mode can survive at higher \(P\): even if it has fewer activated cooperative relationships, it also sharply reduces cost exposure through lower tolerance or more selective donation.
Now consider an evolutionary dynamic where:
- For small \(P\), a broad mode is feasible, so it dominates and the donation rate is high (corresponding to branch A).
- As \(P\) passes that mode’s threshold, the broad mode becomes unfavorable; a more selective mode can still be favorable because its lower \(q_j\) reduces the cost slope (branch B).
- As \(P\) passes the next threshold, the system shifts to an even more selective mode (branch C), and so on.
If the dynamics select the currently viable mode with the largest donation rate, then the observed donation rate as a function of \(P\) can be represented schematically as
| \[D(P) = \max_{j:F_j(P)>0} d_j(P),\] | \[(19)\] |
where \(d_j(P)\) is the donation rate associated with mode \(j\). Because each \(F_j\) has a single positive zero and these positive zeros scale like \((b/c)(M_j/q_j)\), we have:
- Intervals in \(P\) where a given mode is the highest-donation viable mode.
- Kinks or jumps at the \(P_j^*\) where the active mode changes.
- Downward jumps in observed donation when the lost mode had a higher donation rate than the next viable mode.
If the ratios \(M_j/q_j\) are approximately integer-spaced, then these thresholds line up at multiples of \(b/c\), exactly as in the empirical harmonic signature shown in Figure 1. Mathematically we may conclude that each mode is stable only for a band of \(P\) values roughly proportional to an integer multiple of \(b/c\); as \(P\) increases, the system is forced to step down from one mode to the next; and the observable donation rate therefore lies on piecewise curves, with transitions at approximately integer multiples of \(b/c\).
Analytical summary
To summarize, this toy model:
- Defines a fully explicit toy model of repeated local interactions with saturating benefit and linear cost.
- Computes the payoff difference \(F(P)\) analytically.
- Proves existence and uniqueness of a critical \(P^*\) where cooperation flips from advantageous to disadvantageous, and shows \(P^* \propto b/c\).
- Shows how several discrete cooperation modes with different benefit capacities and cost exposures naturally lead to multiple thresholds at \(P_j^* \approx (b/c)(M_j/q_j)\), resulting in a quantized set of regimes.
This is the mechanism described informally in the main text of this paper:
- Within each \(P\)-range, the system sits in one cooperation mode (one type of altruistic clustering/tolerance structure).
- As \(P\) crosses a critical value proportional to \(b/c\), that mode becomes unsustainable and the system jumps to a different mode with lower effective altruism \(\Rightarrow\) a new branch/curve.
Appendix B: Formal Threshold Propositions
This appendix formalizes the threshold arguments used in the main text. The propositions are not a closed-form solution of the full SH ABM. They isolate the arithmetic of accumulated costs and integer benefit counts that explains why payoff orderings are stable between thresholds, why increasing \(P\) causes downward rather than upward changes in cooperation, and why donation can nevertheless rise within a fixed mode.
Let \(r=b/c\) and define the half-open threshold interval
| \[I_n=[nr,(n+1)r), \quad n=0,1,2,\ldots.\] | \[(20)\] |
For an altruistic agent compared with a local defector, let \(m\) be the number of additional benefit units obtained by the altruist relative to the defector during the relevant local comparison. The stylized payoff difference is
| \[\Delta_m(P)=mb-Pc=b\left(m-\frac{P}{r}\right),\] | \[(21)\] |
where \(m\) is a non-negative integer. Here \(m\) denotes the altruist’s relative benefit–unit advantage introduced in the main text, while \(n\) indexes the threshold interval; the two are related but distinct.
Proposition 1: payoff-order stability within threshold intervals
For any \(P_1,P_2\in I_n\) and any non-negative integer \(m\), the sign of \(\Delta_m(P)\) is the same for \(P_1\) and \(P_2\), except for the boundary tie that occurs when \(P=nr\) and \(m=n\).
Proof. If \(P\in I_n\), then \(n\le P/r < n+1\). If \(m\le n\), then \(m-P/r\le 0\) throughout the interval, with equality only when \(m=n\) and \(P=nr\). If \(m\ge n+1\), then \(m-P/r>0\) throughout the interval. These two cases exhaust all non-negative integers \(m\). Therefore the sign of \(\Delta_m(P)\) is constant within \(I_n\), apart from the lower-boundary equality noted above. ■
This proposition answers the first question in the main text: as long as \(P\) remains between two successive multiples of \(b/c\), local payoff orderings based on integer benefit counts do not change. This makes smooth within-branch movement plausible and explains why the large qualitative changes are concentrated at the boundaries.
Proposition 2: crossing a threshold removes cooperator-favoring comparisons
For each \(n\ge 0\), consider the comparison with \(m=n+1\). If \(P_1<(n+1)r\) and \(P_2\ge(n+1)r\), then \(\Delta_{n+1}(P_1)>0\) while \(\Delta_{n+1}(P_2)\le0\). Moreover, because \(\Delta_m(P)\) is strictly decreasing in \(P\) for every fixed \(m\), increasing \(P\) cannot turn a defector-favoring comparison into an altruist-favoring comparison in this stylized payoff comparison.
Proof. For \(m=n+1\),
| \[\Delta_{n+1}(P)=b\left(n+1-\frac{P}{r}\right).\] | \[(22)\] |
If \(P_1<(n+1)r\), then \(P_1/r<n+1\), so \(\Delta_{n+1}(P_1)>0\). If \(P_2\ge(n+1)r\), then \(P_2/r\ge n+1\), so \(\Delta_{n+1}(P_2)\le0\). Finally,
| \[\frac{d\Delta_m}{dP}=-c<0,\] | \[(23)\] |
so the comparison is strictly decreasing in \(P\) for every fixed \(m\). ■
This proposition answers the second question in the main text: crossing a threshold from below removes a class of comparisons that previously favored altruists. Because increasing \(P\) increases cumulative costs, the immediate direction of pressure is downward in donation rate.
Proposition 3: within-mode activation increases with \(P\)
Consider a fixed viable cooperation mode with \(K_j\) potential cooperative neighbors and per-encounter donation exposure \(q_j>0\). A simple expression for the expected activated donation opportunity in that mode is
| \[d_j(P)=q_j\left(1-(1-1/K_j)^P\right).\] | \[(24)\] |
For integer \(P\ge0\), \(d_j(P+1)>d_j(P)\) whenever \(K_j>1\).
Proof. The discrete difference is
| \[\begin{split} d_j(P+1)-d_j(P) &= q_j\left[(1-(1-1/K_j)^{P+1})-(1-(1-1/K_j)^P)\right]\\ &=q_j(1-1/K_j)^P\left(\frac{1}{K_j}\right)>0. \end{split}\] | \[(25)\] |
Thus, within a fixed mode, the expected activation of cooperative opportunities increases smoothly with \(P\). ■
This proposition answers the third question in the main text. Within a given cooperation mode, increasing \(P\) increases the chance that cooperative ties are activated, so donation can rise within a branch. This does not contradict the threshold results, because Appendix A shows that costs continue to accumulate linearly while benefits saturate. Eventually, the mode loses viability and the system shifts downward to a more selective branch.
Taken together, the three propositions identify the formal core of the explanation: payoff comparisons are stable within threshold intervals, increasing \(P\) removes cooperator-favoring comparisons at thresholds, and fixed modes can still show rising donation within an interval before becoming unsustainable.
References
ANTONIONI, A., & Tomassini, M. (2012). Cooperation on social networks and its robustness. Advances in Complex Systems, 15(supp01), 1250046. [doi:10.1142/s0219525912500464]
AXELROD, R. (1984). The Evolution of Cooperation. New York, NY: Basic Books.
AXELROD, R., Hammond, R. A., & Grafen, A. (2004). Altruism via kin-selection strategies that rely on arbitrary tags with which they coevolve. Evolution, 58(8), 1833–1838. [doi:10.1111/j.0014-3820.2004.tb00465.x]
GÓMEZ-GARDEÑES, J., Campillo, M., Florı́a, L. M., & Moreno, Y. (2007). Dynamical organization of cooperation in complex topologies. Physical Review Letters, 98(10), 108103.
HAMMOND, R. A., & Axelrod, R. (2006). The evolution of ethnocentrism. Journal of Conflict Resolution, 50(6), 926–936. [doi:10.1177/0022002706293470]
IZQUIERDO, L. R., IZQUIERDO, S. S., & Sandholm, W. H. (2024). Agent-Based Evolutionary Game Dynamics. Madison, WI: University of Wisconsin Pressbooks.
MACIEJEWSKI, W., Fu, F., & Hauert, C. (2014). Evolutionary game dynamics in populations with heterogeneous structures. PLoS Computational Biology, 10(4), e1003567. [doi:10.1371/journal.pcbi.1003567]
NOWAK, M. A. (2006). Five rules for the evolution of cooperation. Science, 314(5805), 1560–1563. [doi:10.1126/science.1133755]
NOWAK, M. A., & May, R. M. (1992). Evolutionary games and spatial chaos. Nature, 359(6398), 826–829. [doi:10.1038/359826a0]
OHTSUKI, H., Hauert, C., Lieberman, E., & Nowak, M. A. (2006). A simple rule for the evolution of cooperation on graphs and social networks. Nature, 441(7092), 502–505. [doi:10.1038/nature04605]
RIOLO, R. L., Cohen, M. D., & Axelrod, R. (2001). Evolution of cooperation without reciprocity. Nature, 414(6862), 441–443. [doi:10.1038/35106555]
ROBERTS, G., & Sherratt, T. N. (2002). Does similarity breed cooperation? Nature, 418(6897), 499–500. [doi:10.1038/418499b]
SANTOS, F. C., & Pacheco, J. M. (2005). Scale-free networks provide a unifying framework for the emergence of cooperation. Physical Review Letters, 95(9), 098104. [doi:10.1103/physrevlett.95.098104]
SANTOS, F. C., & Pacheco, J. M. (2006). A new route to the evolution of cooperation. Journal of Evolutionary Biology, 19(3), 726–733. [doi:10.1111/j.1420-9101.2005.01063.x]
SHUTTERS, S. T., & Hales, D. (2015a). Altruism displays a harmonic signature in structured societies. Journal of Artificial Societies and Social Simulation, 18(3), 2. [doi:10.18564/jasss.2780]
SHUTTERS, S. T., & Hales, D. (2015b). The emergence of tag-mediated altruism in structured societies (Version 1.2.0). CoMSES Computational Model Library. 10.25937/503k-7517
SPECTOR, L., & Klein, J. (2006). Genetic stability and territorial structure facilitate the evolution of tag-mediated altruism. Artificial Life, 12(4), 553–560. [doi:10.1162/artl.2006.12.4.553]
SZABÓ, G., & Fáth, G. (2007). Evolutionary games on graphs. Physics Reports, 446(4–6), 97–216.
SZOLNOKI, A., Perc, M., & Danku, Z. (2008). Towards effective payoffs in the prisoner’s dilemma game on scale-free networks. Physica A: Statistical Mechanics and Its Applications, 387(8–9), 2075–2082. [doi:10.1016/j.physa.2007.11.021]
TOMASSINI, M., Pestelacci, E., & Lüthi, L. (2007). Social dilemmas and cooperation in complex networks. International Journal of Modern Physics C, 18(7), 1173–1185. [doi:10.1142/s0129183107011212]
WU, Z.-X., Guan, J.-Y., Xu, X.-J., & Wang, Y.-H. (2007). Evolutionary prisoner’s dilemma game on Barabási-Albert scale-free networks. Physica A: Statistical Mechanics and Its Applications, 379(2), 672–680. [doi:10.1016/j.physa.2007.02.085]
WU, Z.-X., Xu, X.-J., & Wang, Y.-H. (2005). Does the scale-free topology favor the emergence of cooperation?arXiv preprint, physics/0508220