Emergent Collapse and Resilience in Sequential Task Networks: A Dynamic Agent Based Simulation of Error Management, Incivility and Managerial Oversight

Hellenic American University, Greece
Journal of Artificial
Societies and Social Simulation 29 (4) 9
<https://www.jasss.org/29/4/9.html>
DOI: 10.18564/jasss.6297
Received: 22-Mar-2026 Accepted: 06-Oct-2026 Published: 31-Oct-2026
Abstract
Organizations operate under conditions of imperfect performance where human error is inevitable. Traditional theoretical frameworks often treat errors in isolation, focusing on discrete antecedents and immediate corrective responses. However, managerial responses to errors generate profound secondary effects that accumulate over time, influencing organizational culture, employee resilience and workforce sustainability. The present research introduces an agent-based simulation of a work team completing a fixed sequence of tasks under varying degrees of managerial oversight and response policies. The model uniquely isolates the mechanical loss of throughput caused by errors from the psychological and cultural consequences of managerial reactions, which are categorized into ignoring, correcting, or punishing. Furthermore, the model incorporates an autonomous self-notice mechanism, allowing workers to correct themselves in the absence of managerial intervention. By tracking the accumulation of worker resentment and the temporary enhancements in learning, the simulation acts as a dynamic laboratory to observe delayed consequences, nonlinear tipping points, and systemic organizational collapse. Statistical analyses of the simulation outputs reveal that while highly monitored punitive environments generate high short-term operational throughput, they simultaneously induce critical levels of interactional injustice and resentment, ultimately engineering a rapid cascading turnover and the highest probability of systemic collapse. Conversely, corrective policies combined with active monitoring achieve equivalent throughput while minimizing error rates and sustaining workforce viability. A comprehensive sensitivity analysis extending the design across all eight sweep parameters simultaneously establishes that error accumulation is primarily determined by structural factors, agent-level mistake propensity (η²p = 0.347) and task difficulty (η²p = 0.261), while resignation dynamics, resentment accumulation, and systemic collapse timing remain predominantly governed by managerial policy, a hierarchical finding independently validated by a Random Forest surrogate model achieving cross-validated R² values of up to 0.912. Further Interaction analysis reveals that the monitoring configuration that minimizes errors is precisely the configuration that maximizes workforce attrition when paired with punitive policy, crystallizing a fundamental paradox of organizational control. Composite objective analysis confirms that the punishing style constitutes the most harmful managerial configuration across all stakeholder weighting scenarios without exception, while seed robustness checks across thirty independent initializations per parameter configuration confirm that all primary inferences are stable and not attributable to stochastic variation. Additionally, the data indicate that while task difficulty primarily drives the sheer volume of errors, the underlying resilience profile of the workforce ultimately dictates the threshold for withdrawal behaviors. The study bridges the gap between the operational mechanics of task completion and the social dynamics of workplace mistreatment, illustrating how short-term punitive success often masks long-term structural fragility and how the consequences of managerial policy are fundamentally contingent on the structural environment in which they are applied.Introduction
The inevitability of human error remains a fundamental challenge in organizational operations (Van Dyck et al. 2005). In complex work environments, individuals face cognitive demands, time pressures, and structural constraints that make imperfect performance a practical certainty. Errors are unintentional deviations from established goals that consume organizational resources without advancing task completion, so that when a worker expends effort but commits a mistake, that worker’s capacity is spent for the period while effective throughput remains stagnant. This creates a direct performance tradeoff in which efficiency is continually undermined by the frequency and severity of mistakes. Treating errors as isolated operational failures, however, understates their systemic significance, because the way an organization absorbs, processes, and responds to these deviations shapes not only its immediate productivity but also its longer term adaptive capacity and the wellbeing of its workforce.
Managerial oversight is conventionally understood as an operational control mechanism intended to secure compliance, maintain quality standards, and allocate resources efficiently. Oversight also operates, however, as a cultural signal. When a manager observes an error and selects a response, that interaction does more than repair a flawed task, because it communicates the organization’s stance on psychological safety, risk tolerance, and interpersonal respect (Edmondson & Bransby 2023). An oversight regime that monitors heavily and responds punitively cultivates an environment of fear and compliance, whereas one that treats errors as informational inputs for improvement supports an error management culture (Van Dyck et al. 2005). The policies that managers adopt therefore do not merely record behavioral deviations; they help construct the social reality of the workplace, determining whether an error becomes an occasion for capability development or a source of interpersonal friction and withdrawal.
This cultural dimension is closely bound to workplace mistreatment and, in particular, to incivility, defined as low intensity deviant behavior with an ambiguous intent to harm that violates the norms of mutual respect (Andersson & Pearson 1999). Incivility is neither rare nor trivial. Recent syntheses identify it as among the most common workplace stressors, with meta-analytic prevalence estimates approaching three quarters of employees, and they connect it to a broad network of affective, health related, and behavioral consequences (Han et al. 2022; Magley et al. 2026). A punitive or excessively critical response to error frequently registers as incivility, because a public reprimand, a scornful remark, or a dismissive reaction is often experienced not as legitimate correction but as an interpersonal offense. Because the intent behind managerial frustration is ambiguous, these low intensity interactions consume the cognitive and emotional resources of the employee, and where an error response climate tolerates or rewards incivility as an instrument of control, the organization converts routine operational feedback into a chronic psychological stressor. Meta-analytic evidence links this exposure to heightened turnover intention across different sources of incivility (Namin et al. 2022), which ties the interpersonal texture of oversight directly to the erosion of the workforce.
The relationship among managerial incivility, error correction, and performance is nonlinear, and it is not well captured by static, cross sectional observation. A punitive environment may at first appear effective, suppressing visible errors through fear and compliance, yet this short-term gain is routinely offset by the largely invisible accumulation of worker resentment. As negative experiences compound, the workforce approaches a critical threshold, and once that threshold is crossed the system can pass a tipping point into cascading turnover and operational breakdown (Rudolph & Repenning 2002). Capturing how local manager to worker interactions escalate into system level failure, including the temporal delay between an oversight policy and the eventual collapse of the team, requires a dynamic rather than a static representation. The present research therefore develops an agent-based simulation in which heterogeneous workers and a single manager interact over time, so that the delayed and nonlinear consequences of feedback policy become observable.
Conceptual Background
Workplace incivility and its escalation
Workplace incivility occupies the subtle end of the organizational mistreatment spectrum. Unlike overt harassment or physical aggression, it is defined by low intensity and an ambiguous intent to harm, and behaviors such as eye rolling, ignoring input, or delivering unusually harsh criticism under the guise of performance management violate the norms of mutual respect on which cooperative work depends (Andersson & Pearson 1999; Magley et al. 2026). The ambiguity of intent is central to the harm, because it obliges the target to spend cognitive resources interpreting the interaction, and this interpretive burden depletes emotional reserves and turns ordinary operational exchanges into a source of chronic strain. A meta-analysis spanning two decades of research confirms that experienced incivility is embedded in a broad network of antecedents, consequences, and boundary conditions, and that its behavioral consequences include withdrawal and reduced contribution (Han et al. 2022).
Incivility rarely stays contained between two individuals. Exposure to uncivil behavior can provoke reciprocal incivility and an escalation spiral, and the relational structure of a team either buffers or amplifies these exchanges (Andersson & Pearson 1999). Rudeness can also propagate through social exposure in a contagion like manner, so that even a single episode can shape the subsequent behavior of observers and third parties (Foulk et al. 2016). As mistreatment moves from managers to subordinates and then among peers, a localized norm violation can establish a more hostile baseline that spreads through the team. A recent systematic review of twenty four years of incivility research organizes these antecedents, mechanisms, and boundary conditions and documents both the prevalence of the phenomenon and the fragmentation of prior evidence on how it unfolds, which underscores the value of frameworks that make its dynamics explicit (Yaqoob et al. 2026).
The cumulative effect of these interactions is a potent occupational stressor. Targets report lower job satisfaction, weaker organizational commitment, and elevated psychological distress, and as the toll mounts they engage in self protective withdrawal that appears first as reduced discretionary effort and organizational citizenship and, in time, as absenteeism and formal resignation (Han et al. 2022). Meta-analytic evidence links incivility to heightened turnover intention across coworker, supervisor, and other sources (Namin et al. 2022). The macro counterpart of this individual process is turnover contagion, for which recent empirical work finds that voluntary departures are positively associated across successive periods, so that exits beget further exits (Cui et al. 2026). Taken together, these findings connect the micro dynamics of interpersonal disrespect to macro level deficits in productivity and workforce stability, which is the causal chain the present model is built to trace.
Feedback, monitoring and learning after errors
Following an error, the managerial response functions as a social signal about organizational priorities, and managers generally draw on one of three feedback regimes. Ignoring the error conveys an absence of oversight or a tacit acceptance of substandard work, which may relieve immediate stress but forecloses the opportunity to improve. Correction supplies constructive, task focused information aimed at the root cause and signals an environment invested in development. Punishment penalizes the individual for the deviation and relies on negative reinforcement to deter future failure (Hinkin & Schriesheim 2008).
These regimes diverge sharply in their consequences. Constructive correction supports learning by exposing informational gaps and aligning worker action with the required standard, and where psychological safety is preserved the worker uses the feedback to heighten caution and refine technique, producing a measurable but temporary reduction in the probability of subsequent error. When feedback is delivered punitively, its informational value is overshadowed by the threat it imposes, because harsh criticism or disciplinary action provokes defensive self protection rather than task mastery, and the resulting humiliation degrades self efficacy and breeds animosity toward the manager (Carson et al. 1991). The efficacy of any regime therefore depends on the consistency of its application and the perceived legitimacy of the manager, since responses judged unfair or arbitrary accelerate resentment and reduce the probability that genuine learning occurs.
This logic situates the model within the error management tradition, which distinguishes error prevention from error management. Whereas prevention pursues the elimination of all deviation, error management accepts the inevitability of human fallibility and treats mistakes as informational assets that expose latent system vulnerabilities (Van Dyck et al. 2005). Its cornerstone is psychological safety, the shared belief that the team is safe for interpersonal risk taking, which recent syntheses position as a foundational condition for learning, voice, and adaptive performance in complex interdependent work (Edmondson & Bransby 2023). Without it, workers conceal mistakes to avoid punitive repercussions, which prevents the organization from addressing root causes; with it, they disclose errors and seek assistance. The learning that follows correction is rarely a permanent transformation of capability but a transient adaptation, in which the worker exhibits heightened vigilance for a short window before cognitive fatigue returns performance to baseline (Hinkin & Schriesheim 2008).
Managerial monitoring is the structural mechanism through which organizations maintain visibility over operations. High monitoring intensity captures the majority of deviations and, in principle, creates ample opportunity for correction, yet it simultaneously raises exposure to evaluation and alters the behavioral calculus of workers operating under constant observation. While intended as support and quality control, excessive monitoring often functions as a job demand in its own right, because the pressure of continuous surveillance draws down cognitive resources, elevates stress, and accelerates fatigue, degrading the very performance it was meant to protect (Bakker et al. 2023). Monitoring intensity thus behaves as a multiplier on the feedback regime. Combined with constructive correction it drives continuous supportive adaptation and high team learning, but combined with a punitive style it ensures that every minor deviation is caught and penalized, which rapidly accelerates the accumulation of resentment.
Resilience, resentment and withdrawal
Human performance is governed by finite cognitive and emotional resources. The continuous navigation of complex tasks together with interpersonal stressors such as punitive feedback systematically depletes these reserves, so that every negative interaction acts as a small extraction of resilience. Individuals recover from isolated stressful events, but the chronic accumulation of negative experience without adequate recovery produces severe resource depletion. The job demands resources framework formalizes this balance: job demands such as task complexity and punitive oversight draw down the worker, while job resources such as autonomy and constructive feedback help achieve work goals and stimulate growth, and when demands consistently outweigh resources the worker enters a health impairment process that culminates in burnout (Bakker et al. 2023).
As exhaustion deepens and resilience is consumed, withdrawal becomes increasingly likely, and when accumulated resentment and strain breach the tolerance threshold of the individual the outcome is formal resignation. If several workers reach their thresholds in close temporal proximity, the organization experiences cascading turnover that strips the system of critical capacity, shifts an unsustainable workload onto the remaining staff, and can precipitate total systemic collapse (Rudolph & Repenning 2002). This trajectory is not uniform across the workforce. Workers do not possess identical reservoirs of resilience, nor do they interpret stressors identically, and individual differences in baseline tolerance, coping, and recovery mean that resentment accumulates at variable speeds, a heterogeneity that is essential for reproducing realistic turnover patterns.
The resentment that drives this process is grounded in organizational justice and, in particular, in interactional justice, the perceived fairness of the interpersonal treatment employees receive during organizational procedures (Skarlicki & Folger 1997). When managers deliver feedback in a punitive, demeaning, or excessively harsh manner, employees perceive a violation of interactional justice and respond with protective and retaliatory behavior, including counterproductive work behavior such as deliberate inefficiency, and ultimately with exit once the cost of remaining exceeds the benefit of the employment (Colquitt et al. 2001). This translation of injustice into resignation is rarely the product of a single event. It is a threshold process in which resentment functions as an internal counter that increments with each punitive interaction, each instance of incivility, and each unaddressed error, and at the moment cumulative resentment exceeds the individual resilience threshold the behavioral shift to withdrawal is sudden and near absolute.
Computational Foundations and the Present Contribution
Agent-based modeling and emergent organizational dynamics
Agent-based modeling offers a generative methodology for studying organizations as complex adaptive systems in which macro level outcomes emerge from repeated micro level interactions among heterogeneous agents. Rather than representing an organization through an average worker operating under smooth functional relationships, an agent-based model preserves discrete decision rules, local feedback, and interdependence, so that system level patterns arise from the interactions themselves rather than being imposed by assumption. This property is decisive for the present problem, in which the object of interest is not a linear trend but a qualitative regime shift such as abrupt failure, cascading withdrawal, or a collapse in productive capacity. Simulation is well suited to advancing organizational theory precisely when interaction effects, adaptation, and endogenous feedback dominate the dynamics of interest (Harrison et al. 2007; Macy & Willer 2002), which is the regime the present model is designed to represent.
These dynamics are characteristically nonlinear and path-dependent. Complexity oriented organization science has long observed that small differences in local conditions can generate disproportionate differences in outcomes, including punctuated shifts between stable and unstable regimes (Anderson 1999), and that once a system crosses a tipping point, self-reinforcing mechanisms and increasing returns can lock in trajectories that are difficult to reverse even when superior alternatives were once available (Sydow et al. 2009). Computational models of strategy reach a parallel conclusion, since local search on rugged fitness landscapes produces persistent dependence on initial positions as early choices constrain which peaks remain reachable (Levinthal 1997). A model of team viability under managerial pressure must therefore preserve the local conditions and history that determine whether a team stabilizes or tips into decline.
This is where equation based approaches encounter difficulty, because they typically require continuous approximations and mean field assumptions that blur the individual heterogeneity on which threshold mechanisms depend. Threshold models show that the exact distribution of individual thresholds can produce markedly different collective outcomes even when groups share similar means, so that macro averages are an unreliable guide to the micro mechanisms that generated them (Granovetter 1978). Network cascade models extend this insight by showing that large failures can be rare yet severe, triggered by small shocks that propagate through local threshold dynamics rather than proportional response (Watts 2002), and classical segregation models establish that macro structure can arise from mild individual preferences through iterative local adjustment (Schelling 1971). Together these results motivate treating organizational collapse as a sequence of threshold breaches under heterogeneity, which is the mechanism the present model formalizes through resignation thresholds that depend on the depletion of individual resilience.
Short-term fixes, incivility, and psychological depletion
A substantial computational tradition documents performance traps, capability traps, and firefighting dynamics in which locally rational decisions become globally self-defeating. System dynamics research shows that decision makers misperceive feedback, respond to short-term pressure, and inadvertently amplify oscillation, delay, and instability (Sterman 1989). The capability trap framework demonstrates how time pressure leads actors to substitute quick fixes for fundamental improvement, yielding immediate relief while eroding the long-run capacity needed to prevent recurrence and sustaining a reinforcing cycle of underinvestment (Repenning & Sterman 2002), and related work on firefighting in product development shows how reactive work allocation crowds out learning and process improvement (Repenning 2001). This logic maps directly onto the present model, in which punitive and high surveillance conditions can appear productive in the short run while generating the latent conditions for long-run collapse through the accumulation of resentment and subsequent withdrawal.
The interpersonal side of the model rests on a parallel empirical literature. Incivility escalates through spirals of reciprocation without requiring overt aggression as a starting condition (Andersson & Pearson 1999), is widespread and meaningfully associated with withdrawal and distress, and is frequently instigated by more powerful organizational actors (Cortina et al. 2001). Of particular importance for a computational treatment, uncivil behavior can spread through social exposure in a contagion like manner, and this diffusion can follow even single episodes to produce second order consequences for observers and third parties (Foulk et al. 2016). These findings support representing incivility as a process in which local interactions alter the future behavioral probabilities of the agents involved rather than as a static individual attribute.
These interpersonal mechanics connect to established processes of organizational justice and occupational health. Perceptions of interpersonal fairness bear distinct relationships with withdrawal and with the evaluation of authority, and the several dimensions of justice contribute incremental explanatory power beyond one another (Colquitt et al. 2001). Occupational health models such as the job demands resources framework formalize how high demands and insufficient resources generate the exhaustion and disengagement that predict reduced performance and withdrawal (Demerouti et al. 2001), and incivility in particular has been linked to daily trajectories of stress and engagement that supervisor support can buffer (Beattie & Griffin 2014) and to nonwork impairment such as disturbed sleep through rumination, moderated by recovery experiences (Demsky et al. 2019). Taken together, these literatures justify a design that couples operational errors, managerial responses, and agent level psychological resources within a single dynamic process rather than treating them as separate domains.
Review scholarship, the present gap, and the contribution
Successive reviews confirm both the maturation of agent-based modeling within management research and the specific gap that the present model addresses. Fioretti (2013) sets out the methodological case for agent-based simulation in organization science, showing how reproducing the interactions among organizational members in an artificial environment allows decision making to be derived from individual behavior rather than assumed at the aggregate. Wall (2016) surveys the use of agent-based modeling across managerial science and demonstrates, through an illustrative study, how the approach applies to coordination, control, and decision making in firms. Gómez-Cruz et al. (2017) review 181 articles published between 2000 and 2016 and conclude that agent-based simulation provides a rigorous framework for describing, explaining, and predicting organizational processes, while noting a persistent demand for greater methodological transparency. Wu et al. (2024) extend this stocktaking through a quarter century of bibliometric mapping covering 1998 to 2022, identifying four enduring clusters, namely team behavior under complex environments, organizational structure and design, knowledge management, and organizational decision making, and they likewise emphasize transparency of model reporting as a central expectation of the field. The broader methodological principle, that simulation is appropriate when interdependent behaviors and heterogeneous micro rules generate emergent outcomes that cannot be derived analytically, is itself well established (Bonabeau 2002).
Two implications follow, and together they define the contribution of the present study. The recurrent call for transparency is the reason the model is documented in full according to the ODD protocol, with its complete parameterization and submodel specification made explicit, so that it can be reproduced and scrutinized. More substantively, although team behavior and organizational decision making are well established clusters within the surveyed work, an integrated model that couples the operational mechanics of error generation to the interactional mechanics of managerial response and resilience depletion, and that yields survival style outcomes such as time to first resignation and time to collapse, remains comparatively rare. The sequential task structure with capacity spillover makes delayed consequences observable, because early managerial policy shapes later capacity bottlenecks through endogenous resignations, providing a tractable micro foundation for the central lesson of performance trap research that locally beneficial interventions can accumulate hidden strain that later precipitates a sharp nonlinear breakdown (Repenning & Sterman 2002). The present model is thus positioned within the team behavior and decision making clusters while extending them toward the explicit representation of cultural erosion and workforce withdrawal.
Research Questions and Expected Contribution
This gap defines the questions the model is built to answer. The present research is organized around four questions concerning the dynamic relationship between managerial oversight and the viability of a work team.
First, how does the interaction between monitoring intensity and the stylistic distribution of managerial responses determine the lifespan of the team? The simulation examines whether intensive monitoring combined with a primarily corrective policy sustains a state of continuous learning, and conversely how rapidly intensive monitoring combined with a punitive policy drives the system toward collapse.
Second, under what parameter configurations does an organization experience the illusion of success, in which a punitive regime lowers error rates through immediate behavioral restriction while accumulating the invisible resentment that produces severe turnover over the longer run?
Third, to what extent can high worker resilience substitute for active oversight? The model examines climates of very low managerial interference in order to determine whether the autonomous self-notice mechanism can sustain the learning loops that correction would otherwise provide.
Fourth, how sensitive is the time to collapse to exogenous factors such as task difficulty and workforce heterogeneity? By varying baseline mistake probabilities and the distribution of resilience thresholds, the research isolates how heterogeneous teams degrade differently from homogeneous ones.
In addressing these questions the present research offers three contributions. First, it formalizes error governance as a dynamic laboratory, rendering testable a class of management propositions that are difficult to access through static empirical observation. Second, it establishes an explicit link between operational error management and the study of workplace mistreatment, translating the psychological toll of incivility and interactional injustice into a quantifiable resentment variable that competes directly with operational learning, and thereby connecting literatures that are usually treated separately. Third, it advances the understanding of organizational tipping points by exposing the accumulation of internal strain that precedes visible structural failure, which clarifies why short-term punitive success can be misleading.
Model Description – ODD Protocol
The simulation model is described below according to the Overview, Design concepts and Details (ODD) protocol for individual and agent-based models (Grimm et al. 2020). The model is implemented in NetLogo 7.0.0. All numerical values reported in this section correspond to the parameter settings used in the simulation experiments, and the formal expressions referenced throughout are those presented in the submodel specification (Equations 1-32).
Find the downloadable code, model and high resolution flowchart at Antonis Chatzipanagiotou (2026, August 31). “Emergent Collapse and Resilience in Sequential Task Networks” (Version 1.0.0). CoMSES Computational Model Library. Available at: https://www.comses.net/codebases/ae8a1f9c-26bf-433b-9775-473f69e27b5e/releases/1.0.0/
Purpose and patterns
The purpose of the model is to examine how the managerial response to inevitable human error governs both the operational throughput and the long-term cultural viability of a work team. The model is designed to isolate the mechanical loss of throughput produced by errors from the psychological and cultural consequences of how a manager reacts to those errors, where the available reactions are ignoring, correcting and punishing. A secondary purpose is to determine the conditions under which short-term error suppression coincides with long-term workforce attrition, and to render the causal chain from the local manager to worker interaction up to the macro level outcome of systemic collapse explicitly observable.
The model is considered useful to the extent that it reproduces a set of qualitative patterns drawn from the organizational literature: the emergence of sudden cascading turnover and tipping point dynamics rather than smooth linear decline (Granovetter 1978; Rudolph & Repenning 2002); the divergence between short-term operational performance and long-term sustainability under punitive oversight; and the heterogeneity of withdrawal timing across agents with differing tolerance for negative interactions.
Entities, state variables and scales
The model contains three categories of entity: a population of worker agents, a single managerial oversight entity and a global task environment.
Worker agents. Each worker \(i\) is characterized by the following state variables. The work capacity \(u_i\) is a fixed maximum quantity of effort that can be exerted per tick, assigned at initialization and not subsequently modified except that it is set to zero upon resignation (Equation 4). The baseline mistake probability \(p_i^{base}\) takes a value in the set \(\{0.2, 0.5, 0.8\}\) and represents the agent’s intrinsic propensity to commit an error on a given work segment. The operative mistake probability \(p_i(t)\) is the value actually in force at tick \(t\), equal to the baseline except during an active learning window, when it is reduced (Equations 19-21). The resilience threshold \(R_i\) takes a value in the set \(\{3, 5, 8\}\) and represents the absolute number of resentment generating interactions the agent can absorb before withdrawing. The resentment stock \(x_i(t)\) is an integer counter initialized at zero that accumulates over the run (Equation 22). The resignation status \(q_i(t)\) is a binary indicator equal to one when the agent has resigned and zero otherwise (Equation 23). A learning timer records the tick at which the current learning window expires and thereby determines whether the agent is currently in a learning state (Equations 18 and 21). Each worker also carries purely visual attributes, namely a fixed position on a circle and a shape and color that change to red upon resignation. These visual attributes have no influence on the dynamics.
Managerial oversight entity. A single manager is defined by two global policy attributes that are held constant within a run. The management style takes one of three values, laissez-faire, corrective or punishing, and determines the probability distribution over reactions to a noticed error. The interference level takes one of three values, absent, medium or keen-eye, and determines the probability that any given error is noticed. The manager additionally maintains a set of event counters that tally, across the run, the number of errors that were not noticed, ignored, corrected and punished.
Task environment. The task environment consists of an ordered list of \(K\) tasks that must be completed strictly in sequence. Each task \(k\) carries a required number of workpoints \(W_k\), drawn at initialization. The environment tracks the index of the current task \(c(t)\) and the remaining workpoints on that task \(R(t)\) (Equations 1-3).
Scales. Time advances in discrete steps referred to as ticks. A single run continues until a stopping condition is met (Equation 32) and has no fixed horizon. The model has no operative spatial scale: the circular arrangement of workers is a visualization device only and does not mediate any interaction or proximity effect.
Process overview and scheduling
Within each tick the following actions are executed in order.
- Learning expiration check. At the start of the tick, the learning timer of every active worker is evaluated. Any worker whose learning window has expired has its operative mistake probability returned to baseline; any worker still inside its window retains the suppressed value (Equations 10 and 21).
- Effort application. The set of active workers is randomly shuffled to represent asynchronous effort, and each active worker in turn applies effort to the current task in segments until its capacity for the tick is exhausted or all tasks are completed. A segment is the smaller of the worker’s remaining capacity and the remaining workpoints of the current task, and a single Bernoulli trial against the worker’s operative mistake probability is resolved for each segment (Equation 8). A successful segment reduces the remaining workpoints of the current task by the effort applied, whereas an unsuccessful segment consumes the effort, produces no progress and registers an error event (Equations 9-12). Effort is consumed regardless of success. If a task is completed while a worker retains unused capacity, the residual capacity spills over directly into the subsequent task, where it constitutes a new segment and is subject to its own mistake trial (Equation 5).
- Managerial observation and response. All error events generated during the tick are processed as an event list. For each error event, the manager notices the error with a probability determined by the interference level (Equation 15). A noticed error is met with one reaction drawn from the style dependent distribution over ignoring, correcting and punishing.
- Psychological consequence. A corrective or punishing reaction produces exactly one of two mutually exclusive psychological outcomes, learning or resentment, with the probability of resentment determined jointly by the reaction and the worker’s resilience (Equation 16). An error that is either not noticed or noticed and ignored does not generate resentment, but instead opens a self-notice pathway in which the worker may detect its own error with a probability determined by resilience (Equation 17).
- State updates. A learning outcome, whether triggered by managerial correction or by self-notice, sets the learning timer and suppresses the operative mistake probability for the duration of the window (Equations 18 and 19). A resentment outcome increments the resentment stock by one (Equation 30). Any worker whose resentment stock reaches or exceeds its resilience threshold resigns immediately, whereupon its capacity is set to zero and it ceases to participate in subsequent work (Equation 23).
- Aggregation and termination. Aggregate climate and performance metrics are updated, the relevant event times are recorded if their conditions are newly satisfied (Equations 27 and 28), and the stopping conditions are evaluated (Equation 32). If no stopping condition is met, the tick counter advances.
Design concepts
Basic principles. The model integrates several established theoretical traditions. Error response is grounded in error management culture and the informational value of mistakes (Van Dyck et al. 2005); the cost of punitive reactions is grounded in workplace incivility and interactional justice (Andersson & Pearson 1999; Skarlicki & Folger 1997); the translation of cumulative negative experience into withdrawal is grounded in the job demands resources logic of resource depletion (Demerouti et al. 2001; Schaufeli & Taris 2014); and the macro level collapse dynamics are grounded in threshold and cascade models of collective behavior and in disaster and capability trap dynamics (Granovetter 1978; Rudolph & Repenning 2002; Watts 2002).
Emergence. Systemic collapse, cascading turnover and the timing of tipping points are not imposed by any rule but emerge from the accumulation of local manager to worker interactions across a workforce of heterogeneous thresholds. The relationship between the imposed managerial policy and the macro level outcomes is therefore the principal emergent property under study.
Adaptation. Worker agents do not optimize and do not select among alternative behaviors. Their only adaptive responses are the transient suppression of mistake probability that follows a learning event and the terminal withdrawal that follows the breach of the resilience threshold. Both responses are reactive consequences of the workers accumulated experience rather than the result of any deliberation.
Objectives. Agents possess no explicit objective function that they seek to maximize. The withdrawal decision is governed by a fixed threshold on accumulated resentment rather than by any utility calculation.
Learning. Learning is represented as a temporary reduction in the operative mistake probability following corrective feedback or self-notice. The reduction follows a fixed step-down from the baseline tier, namely 0.8 reduces to 0.5, 0.5 reduces to 0.2 and 0.2 reduces to 0, and it persists for the workers next two work ticks before the operative probability reverts to baseline (Equations 18-21). A learning event that occurs while a worker is already learning restarts the window from the baseline tier rather than compounding the reduction. Learning therefore confers no permanent change in agent disposition.
Prediction. Agents do not form predictions about future states and do not anticipate the consequences of their actions.
Sensing. The manager senses errors imperfectly, noticing any given error only with the detection probability set by the interference level. Workers sense their own errors only through the self-notice pathway and only for errors that the manager has not acted upon. Workers do not sense the internal states, resentment levels or resignation status of other workers.
Interaction. The only interaction in the model is the vertical exchange between the manager and an individual worker following an error. There is no lateral, peer to peer interaction: resentment and learning accumulate within each worker exclusively through its own interactions with the manager and its own self-notice events, and no contagion of resentment or incivility passes between workers.
Stochasticity. Stochastic elements include the random assignment of task targets and worker traits at initialization, the random shuffling of workers within each tick, the Bernoulli mistake trial on each work segment, the detection of each error, the selection of the managerial reaction, the resolution of the learning versus resentment outcome and the self-notice trial. To separate parametric effects from stochastic variation, each parameter configuration is run across thirty independent random seeds.
Collectives. The work team is represented as an unstructured aggregate of independent workers. No subgroups, coalitions or formal network ties are defined among the workers.
Observation. The model records, at the level of the run and over time, cumulative throughput and efficiency (Equations 11 and 13), cumulative errors and the error rate (Equations 12 and 14), the count and proportion of resignations (Equations 24-26), the average and standard deviation of resentment among active workers (Equation 30), the size of the active workforce (Equation 29), the tick of first resignation and the tick of collapse (Equations 27 and 28) and the counts of learning events, with manager induced learning and self-noticed learning tallied separately so that the source of any behavioral adaptation can be identified.
Initialization
At the start of each run the task list is generated by first drawing a pool of 45 task targets, each an integer required workpoint value drawn at random from the range 1 to 50, and then retaining the first K of them, where K is set by the task difficulty condition: 15 tasks for the easy condition, 30 for the medium condition and 45 for the hard condition. The tasks must be completed strictly in sequence.
A number of worker agents is then instantiated and arranged on a circle for visualization. In the experiments reported here the capacity mode is fixed to normal, so each worker is assigned a fixed capacity \(u_i\) drawn from a normal distribution defined by the work unit mean and the work unit standard deviation, then constrained to the interval from 0 to 10 and rounded to the nearest multiple of 0.25 (Equation 4). The baseline mistake probability \(p_i^{base}\) is assigned from the tiers \(\{0.2, 0.5, 0.8\}\) and the resilience threshold \(R_i\) from the tiers \(\{3, 5, 8\}\), in each case according to the corresponding profile setting.
The profile settings govern the composition of the team rather than the trait of any single worker. A profile set to uniform draws each worker’s tier independently and at random across the three tiers, producing a heterogeneous team with no target composition. A profile set to low, medium or high instead imposes a fixed 70, 20, 10 percent composition dominated by the named tier: the low profile assigns roughly 70 percent of workers to the low tier, 20 percent to the middle tier and 10 percent to the high tier; the medium profile assigns roughly 70 percent to the middle tier, 20 percent to the low tier and 10 percent to the high tier; and the high profile assigns roughly 70 percent to the high tier, 20 percent to the middle tier and 10 percent to the low tier. The percentages are converted to integer worker counts by a largest remainder rule, and the workers are then assigned to tiers at random, so that the realized composition matches the target proportions as closely as the team size permits. The mistake profile and the resilience profile are set independently of one another.
Every worker begins with a resentment stock of zero, a resignation status of zero and no active learning window, so that the operative mistake probability initially equals the baseline. The tick counter is set to zero.
The capacity mode and the trait assignment mode are themselves model settings rather than swept parameters. The number of workers, the work unit mean and standard deviation, the mistake and resilience profiles, the management style and the interference level constitute the experimental parameters of the simulation, and their sweep levels are reported under Input data.
Input data
The model does not use empirical input data or external time series to drive its dynamics. All quantities are generated endogenously from the parameter settings and the stochastic processes described above.
The experimental design is a full factorial sweep over eight parameters, with each parameter configuration replicated across thirty independent random seeds. The eight parameters and their levels are the management style (laissez-faire, corrective or punishing), the manager interference (absent, medium or keen-eye), the task difficulty (easy, medium or hard), the mistake profile (uniform, low, medium or high), the resilience profile (uniform, low, medium or high), the number of workers (5, 10, 15, 20, 25 or 30), the work unit mean (4, 7 or 10) and the work unit standard deviation (0.5, 1.5 or 2.5).
Worker capacity is drawn from a normal distribution parameterized by the work unit mean and standard deviation, then constrained to the interval from 0 to 10 and rounded to the nearest multiple of 0.25, the capacity mode having been fixed to normal for all reported runs. The model additionally exposes a broader interactive configuration in which the capacity mode may instead be set to uniform and traits may be assigned manually, but neither option is exercised in the experiments reported here.
The fixed quantitative settings of the behavioral submodels, which are held constant across the sweep, are as follows. The detection probability by interference level is absent 0.25, medium 0.50 and keen-eye 0.75. The reaction distribution by management style allocates probability 0.70 to the reaction that defines the style and 0.15 to each of the other two reactions: the laissez-faire style ignores with probability 0.70 and corrects or punishes with probability 0.15 each; the corrective style corrects with probability 0.70 and ignores or punishes with probability 0.15 each; and the punishing style punishes with probability 0.70 and ignores or corrects with probability 0.15 each.
The base resentment probability is 0.15 for a corrective reaction and 0.85 for a punishing reaction, each scaled by the resilience factor (1 minus \(R_i\) divided by 10) and clamped to the interval from 0 to 1 (Equation 16). The self-notice probability is 0.05 at resilience 3, 0.10 at resilience 5 and 0.20 at resilience 8 (Equation 17). A learning event suppresses the operative mistake probability for the worker’s next two work ticks before it reverts to baseline (Equations 18-21).
Submodels
Each task (\(k\)) has a required number of workpoints \(W_{k} > 0\). The remaining workpoints at time \(t\) for the current task are denoted \(R(t)\). The model enforces strict sequentiality: task \(k\) must be completed before task \(k+1\) can begin. Let the current task index be \(c(t)\). Then:
| \[R(t) = W_{c(t)} - \text{completed workpoints on task }c(t) \] | \[(1)\] |
| \[\text{if }R(t) \leq 0\text{ then }c(t) \leftarrow c(t) + 1,\quad R(t) \leftarrow W_{c(t)} \] | \[(2)\] |
| \[\text{finished}(t) = \mathbb{I}\left\lbrack c(t) > K \right\rbrack\quad\text{equivalently}\quad\mathbb{I}\left\lbrack \text{tasks completed} = K \land R(t) = 0 \right\rbrack \] | \[(3)\] |
Worker capacity and effort allocation
Each worker has a fixed work unit capacity (\(u_{i} \geq 0\)) drawn at initialization. Resigned workers contribute no work. Let resignation status be (\(q (t) \in \{0, 1\}\)) where \(q_{i} (t) = 1\) indicates resigned. Then the available capacity for worker \(i\) at tick \(t\) is
| \[\text{cap}_{i}(t) = \left( 1 - q_{i}(t) \right)\, u_{i} \] | \[(4)\] |
Work is allocated in segments because tasks may complete mid tick and spillover is permitted. For each worker \(i\) and tick \(t\), the worker repeatedly applies effort to the current task until either capacity is exhausted or all tasks are finished. At any internal segment s, the amount of effort assigned is:
| \[a_{i,s}(t) = \text{min}\left\{ \text{cap}_{i}^{\text{left}}(t),\, R(t) \right\} \] | \[(5)\] |
The model level potential work per tick is the sum of capacities of active workers:
| \[\text{PotentialWork}(t) = \sum_{i = 1}^{N}\left( 1 - q_{i}(t) \right)\, u_{i} \] | \[(6)\] |
Cumulative potential work is
| \[\text{PotentialWorkTotal}(T) = \sum_{t = 0}^{T}\text{PotentialWork}(t) \] | \[(7)\] |
Mistake process and effective progress
Each worker has a baseline mistake probability \(p_{i}^{base} \in \{0.2,0.5,0.8\}\) assigned at initialization according to the chosen profile distribution. Learning can temporarily reduce this probability, so the operative mistake probability is \(p_{i}(t)\).
For each work segment \(a_{i,s}(t)\), a Bernoulli trial determines whether the segment produces progress:
| \[M_{i,s}(t) \sim \text{Bernoulli}\left( p_{i}(t) \right) \] | \[(8)\] |
Thus, progress on a segment is:
| \[\Delta P_{i,s}(t) = \left( 1 - M_{i,s}(t) \right)\, a_{i,s}(t) \] | \[(9)\] |
Total progress per tick is:
| \[\text{Progress}(t) = \sum_{i}^{}{\sum_{s}^{}\Delta}P_{i,s}(t) \] | \[(10)\] |
| \[\text{ProgressTotal}(T) = \sum_{t = 0}^{T}\text{Progress}(t) \] | \[(11)\] |
Errors are counted per mistake event, not per workpoint. Let \(E_{i}(t)\) be errors made by worker \(i\) in tick \(t\), equal to the number of segments with \(M_{i,s}(t)=1\). Total errors per tick and cumulative errors are:
| \[\text{TotalErrors}(t) = \sum_{i}^{}E_{i}(t),\quad\quad\text{TotalErrorsCum}(T) = \sum_{t = 0}^{T}\text{TotalErrors}(t) \] | \[(12)\] |
These definitions yield the primary performance ratios used in analysis. Efficiency is defined as the fraction of potential work converted into progress:
| \[\text{Efficiency}(T) = \frac{\text{ProgressTotal}(T)}{\text{PotentialWorkTotal}(T)} \] | \[(13)\] |
| \[\text{ErrorRate}(T) = \frac{\text{TotalErrorsCum}(T)}{\text{PotentialWorkTotal}(T)} \] | \[(14)\] |
Manager observation and response
Every mistake event becomes an element of an event list processed at the end of the tick. For each mistake event by worker \(i\) at tick \(t\), the manager notices the error with probability n determined by manager interference:
| \[n = \left\{ \begin{matrix} 0.25 & \text{absent} \\ 0.50 & \text{medium} \\ 0.75 & \text{keen eye} \end{matrix} \right.\ \] |
| \[Z_{i,e}(t) \sim \text{Bernoulli}(n) \] | \[(15)\] |
If \(Z_{i,e}(t) = 0\), the event is classified as not noticed and triggers the no feedback pathway.
If \(Z_{i,e}(t) = 1\), the manager selects an action \(A_{i,e}(t) \in \{ignore, corrective, punishing\}\). The action probabilities depend on manager style. Let \(r \sim Uniform(0,1)\). Then for laissez-faire:
| \[P\left( \text{ignore} \right) = 0.70,\quad P\left( \text{corrective} \right) = 0.15,\quad P\left( \text{punishing} \right) = 0.15\] |
For corrective style:
| \[P\left( \text{corrective} \right) = 0.70,\quad P\left( \text{ignore} \right) = 0.15,\quad P\left( \text{punishing} \right) = 0.15\] |
For punishing style:
| \[P\left( \text{punishing} \right) = 0.70,\quad P\left( \text{ignore} \right) = 0.15,\quad P\left( \text{corrective} \right) = 0.15\] |
This yields the manager response counts. Each error event increments exactly one of the manager event counters: not noticed, ignore, corrective, punishing.
Learning versus resentment as mutually exclusive outcomes
If the manager response is corrective or punishing, the event produces exactly one psychological outcome: learning or resentment. The probability of resentment depends on both manager response and resilience.
Each worker has a resilience threshold \(R_{i} \in \{3,5,8\}\). The model converts this to a resentment probability by scaling a base rate by (\(1 - R_{i} / 10\)) and clamping into \([0,1]\). Let the base resentment probabilities be \(b_{corr} = 0.15\) for corrective and \(b_{pun} = 0.85\) for punishing. Then
| \[\begin{array}{r} \pi_{i,\text{corr}} = \text{clamp}\left( b_{\text{corr}}\,\left( 1 - R_{i}/10 \right),\, 0,\, 1 \right) \\ \pi_{i,\text{pun}} = \text{clamp}\left( b_{\text{pun}}\,\left( 1 - R_{i}/10 \right),\, 0,\, 1 \right) \end{array}\] |
If the action is corrective, resentment occurs with probability \(\pi_{i,corr}\) if the action is punishing, resentment occurs with probability \(\pi_{i,pun}\). Define:
| \[Y_{i,e}(t) \sim \text{Bernoulli}\left( \pi_{i,a} \right) \] | \[(16)\] |
| \[Y_{i,e}(t) = 1 \Rightarrow \text{resentment increment},\quad\quad Y_{i,e}(t) = 0 \Rightarrow \text{learning trigger}\] |
Self-notice learning without feedback
When there is no manager feedback, meaning either the error is not noticed or it is noticed but ignored, the worker may self-notice the mistake. The self-notice probability depends on resilience:
| \[s_{i} = \left\{ \begin{matrix} 0.05 & R_{i} = 3 \\ 0.10 & R_{i} = 5 \\ 0.20 & R_{i} = 8 \end{matrix} \right.\ \] |
| \[S_{i,e}(t) \sim \text{Bernoulli}\left( s_{i} \right) \] | \[(17)\] |
If \(S_{i,e}(t) = 1\), the worker receives the same learning effect as manager triggered learning, but it is counted separately from manager induced learning totals. If \(S_{i,e}(t) = 0\), no learning is applied.
Learning effect dynamics
Learning is a temporary reduction in mistake probability for a fixed duration. Let the operative mistake probability be \(p_{i}(t)\) and baseline be \(pi^{base}\). When learning occurs at tick \(t\), the learning state is set to last until tick \(t + 3\) in the implementation, which corresponds to two subsequent ticks of active work after the current tick, because the learning expiration is checked at the start of each tick. The model sets a timer:
| \[L_{i} = t + 3 \] | \[(18)\] |
| \[p_{i}\left( t^{\text{+}} \right) = f\left( p_{i}^{\text{base}} \right) \] | \[(19)\] |
| \[f(p) = \left\{ \begin{matrix} 0.5 & \text{if }0.8 \leq p \leq 1.0 \\ 0.2 & \text{if }0.5 \leq p < 0.8 \\ 0.0 & \text{if }0 \leq p < 0.5 \end{matrix} \right.\ \] |
| \[\text{if }t \geq L_{i}\text{ then }p_{i}(t) \leftarrow p_{i}^{\text{base}},\quad L_{i} \leftarrow 0 \] | \[(20)\] |
If a new learning event occurs before expiration, the timer resets, so learning duration extends forward from the most recent trigger.
The “currently learning” state used in outputs is therefore:
| \[\text{LearningNow}(t) = \sum_{i}^{}\mathbb{I}\left( q_{i}(t) = 0 \land L_{i} > t \right) \] | \[(21)\] |
Resentment accumulation and resignation threshold
Each worker has a resentment stock \(x_{i}(t)\) initialized at 0. Resentment events increment by 1:
| \[x_{i}\left( t^{\text{+}} \right) = x_{i}(t) + 1\quad\text{if a resentment event occurs} \] | \[(22)\] |
Resignation occurs when resentment reaches resilience:
| \[q_{i}\left( t^{\text{+}} \right) = 1\quad\text{if }x_{i}\left( t^{\text{+}} \right) \geq R_{i} \] | \[(23)\] |
When resigned, the worker’s capacity becomes zero and the worker stops participating in work loops.
The model level resignation count per tick is:
| \[\text{ResignedThisTick}(t) = \sum_{i}^{}\mathbb{I}\left( q_{i}(t) = 1 \land \text{resigned tick} = t \right) \] | \[(24)\] |
| \[\text{ResignedTotal}(t) = \sum_{i}^{}q_{i}(t) \] | \[(25)\] |
The resignation proportion used in analysis is:
| \[\text{ResignProp}(t) = \frac{\text{ResignedTotal}(t)}{N} \] | \[(26)\] |
Survival and collapse event times
Two event times are tracked for survival style outcomes. The first resignation time is the first tick at which at least one resignation has occurred:
| \[T_{\text{first resign}} = \text{min}\{ t:\text{ResignedTotal}(t) > 0\} \] | \[(27)\] |
Collapse is defined as the tick when at least half the workforce has resigned:
| \[T_{\text{collapse50}} = \text{min}\{ t:\text{ResignedTotal}(t) \geq N/2\} \] | \[(28)\] |
Aggregate climate metrics
The active workforce count is:
| \[\text{ActiveWorkers}(t) = \sum_{i}^{}\left( 1 - q_{i}(t) \right) \] | \[(29)\] |
Average resentment among active workers is:
| \[ \overline{x}(t) = \begin{cases} \displaystyle \frac{1}{\mathrm{ActiveWorkers}(t)} \sum_{i:q_i(t)=0} x_i(t), & \text{if } \mathrm{ActiveWorkers}(t) > 0, \\[6pt] 0, & \text{otherwise}. \end{cases} \] | \[(30)\] | |||||
| \[\text{BaselineTeamCapacity} = \sum_{i = 1}^{N}u_{i} \] | \[(31)\] |
Stopping conditions
A run stops if all tasks are completed, if no active workers remain, or if there is no possible work because all remaining active workers have \(u_{i} = 0\). Formally, with \(U(t) = \{I : q_{i} (t) = 0\}\),
| \[\text{stop if }c(t) > K\quad\text{or}\quad\left| U(t) \right| = 0\quad\text{or}\quad\sum_{i \in U(t)}^{}u_{i} = 0. \] | \[(32)\] |
Results
A note on the analysis is required before the results are presented. The number of independent simulation runs in an agent-based study is a design decision rather than a property of observed data, and it must be determined deliberately, since the number of replications governs both the precision of the resulting estimates and the power of any comparison drawn from them (Lee et al. 2015; Secchi & Seri 2017). The design adopted here is a full factorial sweep in which every parameter configuration is replicated across thirty independent random seeds, and the adequacy of that replication is assessed directly in the seed robustness analysis reported below, where the coefficient of variation across seeds is used to establish that the reported outcomes are stable properties of each configuration rather than artifacts of stochastic initialization. A consequence of this design is that the total number of observations entering any aggregate comparison is large. Because the p-value of a significance test depends on both the size of an effect and the size of the sample, at this scale even a negligible difference will register as statistically significant, and the very large F statistics reported below reflect the number of replications rather than the importance of the effects (Lin et al. 2013; White et al. 2014). Significance tests and their associated statistics are therefore reported in the tables for completeness and for comparability with conventional practice, but they are not treated as evidence for the substantive claims. Interpretation rests instead on the magnitude of effects, expressed through the partial \(\eta\)\(^2\) statistic as the proportion of variance attributable to each factor, and on the practical size of the descriptive differences between conditions, read against the mechanisms of the model.
Operational efficiency and error dynamics
The interaction between managerial style and monitoring intensity shapes systemic efficiency and error rates, although its influence on raw throughput is modest and its principal consequences appear elsewhere. Managerial style accounts for only a small share of the variance in total task completion (\(\eta\)\(^2\)p = 0.011), and monitoring intensity for a smaller share still (\(\eta\)\(^2\)p = 0.003), so that in terms of gross output the four style conditions are only weakly differentiated. As the following analyses show, the decisive effects of managerial policy emerge not in operational throughput but in the cultural and survival outcomes of the team. Table 1 reports the descriptive statistics for the core operational and cultural variables by managerial style.
| Managerial Style | Tasks Completed | Total Error Mean | Average Resentment Mean | Resignation Mean | Self-noticed Error Mean |
|---|---|---|---|---|---|
| Laissez-faire | 29.97 | 133.56 | 0.33 | 0.21 | 12.58 |
| Corrective | 29.95 | 112.04 | 0.40 | 0.31 | 7.41 |
| Punishing | 29.55 | 113.13 | 0.80 | 1.59 | 7.71 |
The laissez-faire and corrective styles yield similarly high means for tasks completed, while the punishing style shows a visible reduction in operational throughput. The more consequential divergence, however, concerns the quality of the output and the cultural cost of producing it. Table 2 reports the variance analyses for these operational metrics; consistent with the note above, the interpretation of these analyses rests on the magnitude of each effect rather than on statistical significance, which is expected here given the number of runs.
| Dependent Variable | Source | df | F Statistic | p Value | Partial Eta Squared |
|---|---|---|---|---|---|
| Tasks Completed | Manager Style | 2 | 1499.12 | \(p < 0.001\) | 0.011 |
| Tasks Completed | Manager Interference | 2 | 439.73 | \(p < 0.001\) | 0.003 |
| Total Errors | Manager Style | 2 | 5068.06 | \(p < 0.001\) | 0.038 |
| Total Errors | Manager Interference | 2 | 4900.62 | \(p < 0.001\) | 0.037 |
| Resigned Total | Manager Style | 2 | 39208.72 | \(p < 0.001\) | 0.238 |
| Resigned Total | Manager Interference | 2 | 12081.82 | \(p < 0.001\) | 0.088 |
| Self-Noticed | Manager Style | 2 | 24912.58 | \(p < 0.001\) | 0.166 |
| Self-Noticed | Manager Interference | 2 | 25348.98 | \(p < 0.001\) | 0.168 |
| Learn Total | Manager Style | 2 | 68760.12 | \(p < 0.001\) | 0.354 |
| Throughput | Manager Style | 2 | 534.20 | \(p < 0.001\) | 0.004 |
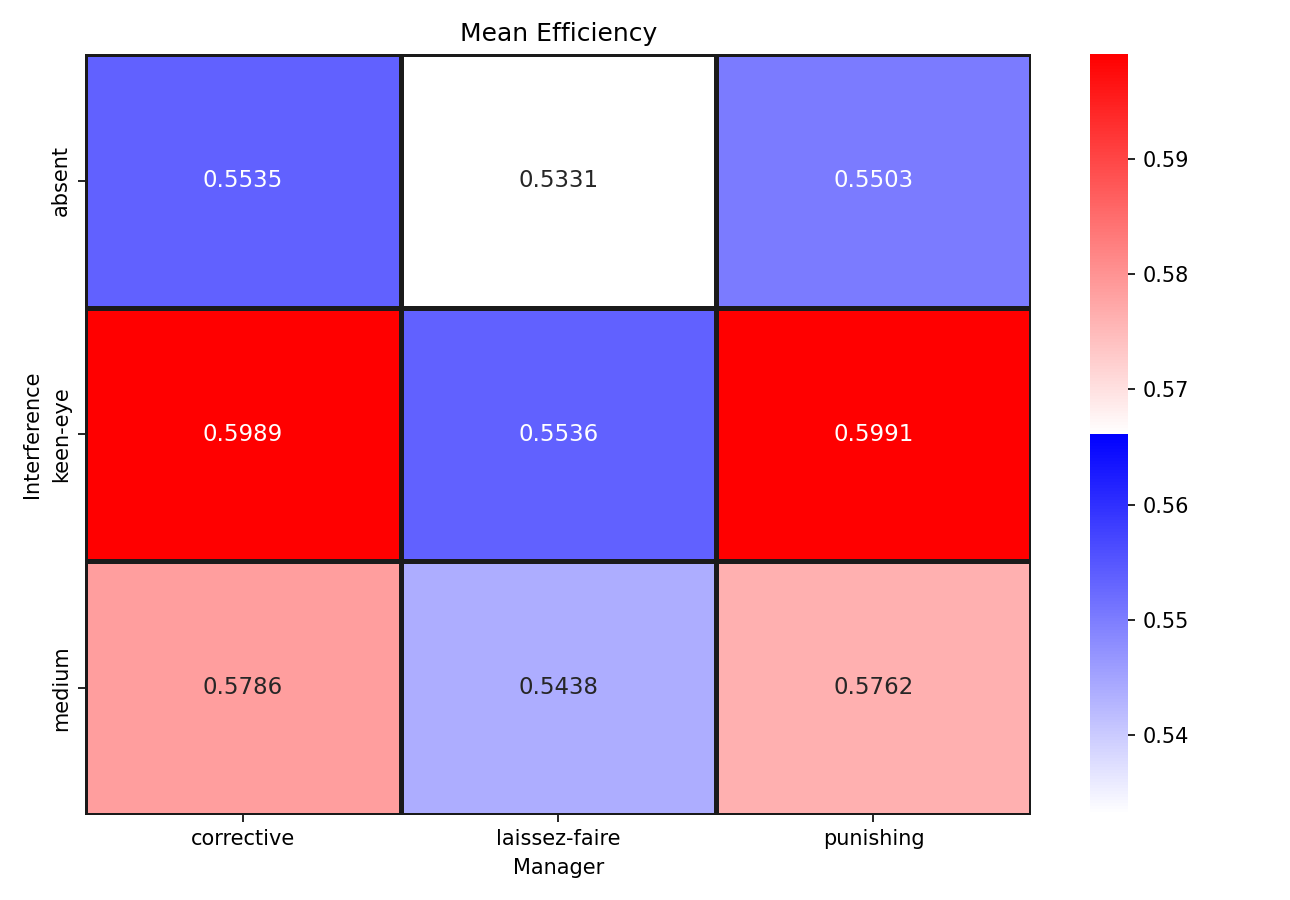
The heatmap of mean efficiency (Figure 1) shows that the highest gross output is achieved under keen-eye monitoring combined with either a punishing or a corrective policy, whereas laissez-faire management with absent monitoring yields the lowest systemic efficiency. To confirm that parametric assumptions did not drive these patterns, the comparisons were repeated using nonparametric Kruskal Wallis tests (Table 3). The rank based results reproduce the same ordering of managerial styles across the primary dependent variables, indicating that the observed pattern is not an artifact of distributional assumptions.
| Dependent Variable | Factor | N | Kruskal Wallis H | df | p Value | Epsilon Squared |
|---|---|---|---|---|---|---|
| Tasks Completed | Manager Style | 200000 | 72.20 | 2 | \(p < 0.001\) | 0.0003 |
| Total Errors | Manager Style | 200000 | 1676.52 | 2 | \(p < 0.001\) | 0.0083 |
| Resigned Total | Manager Style | 200000 | 32834.97 | 2 | \(p < 0.001\) | 0.1641 |
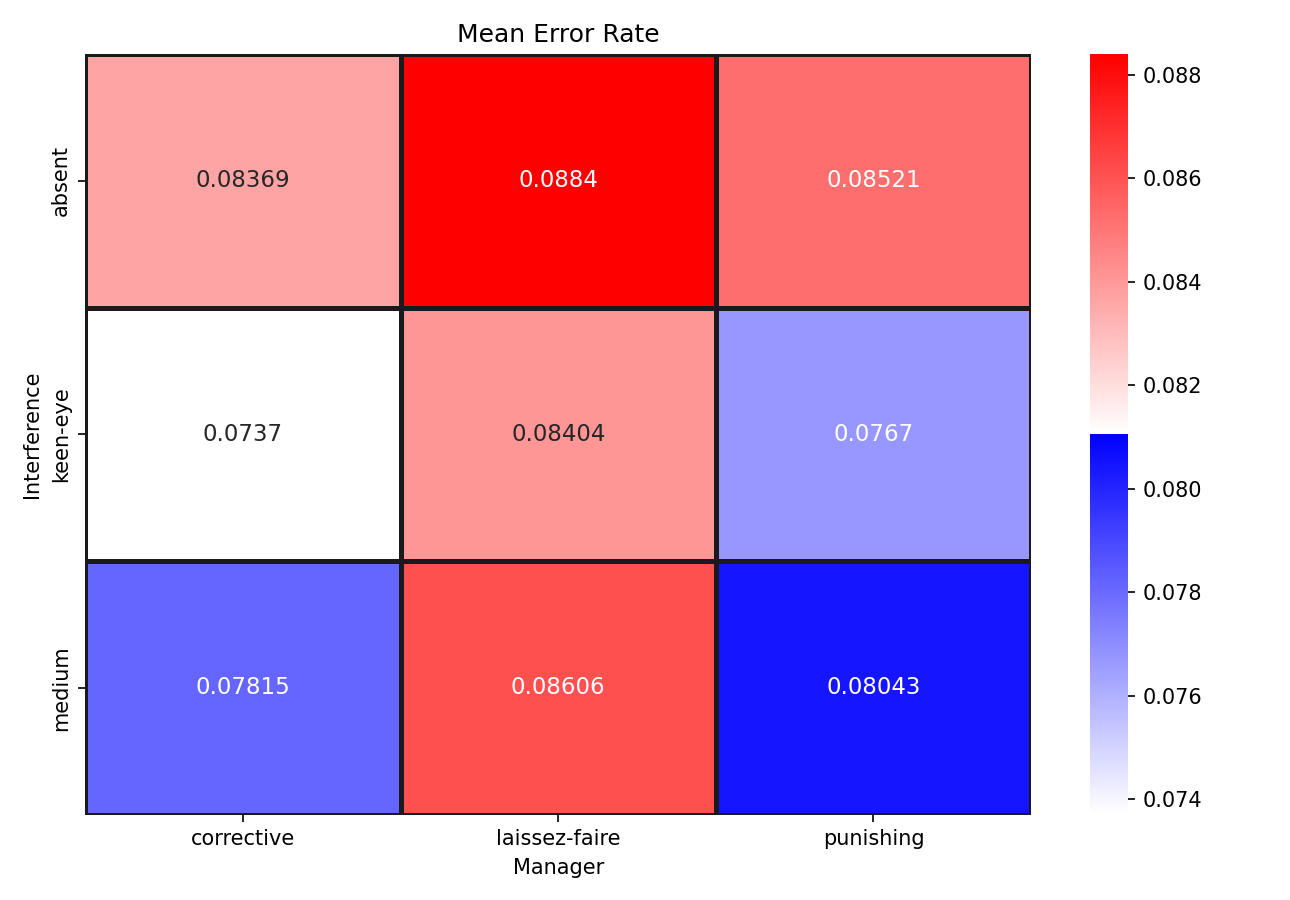
The error rate heatmap (Figure 2) shows that the corrective style under keen-eye monitoring suppresses the mean error rate to its lowest value within the parameter sweep, while the punishing style maintains a higher error rate under identical surveillance, and laissez-faire management with absent monitoring allows the error rate to rise as the workforce fails to adapt. Assessed on its own, managerial style accounts for only a small share of the variance in cumulative errors, a point developed in the full decomposition below; its operational advantage under correction is real but works largely through the learning mechanism rather than through a large direct effect on the error count.
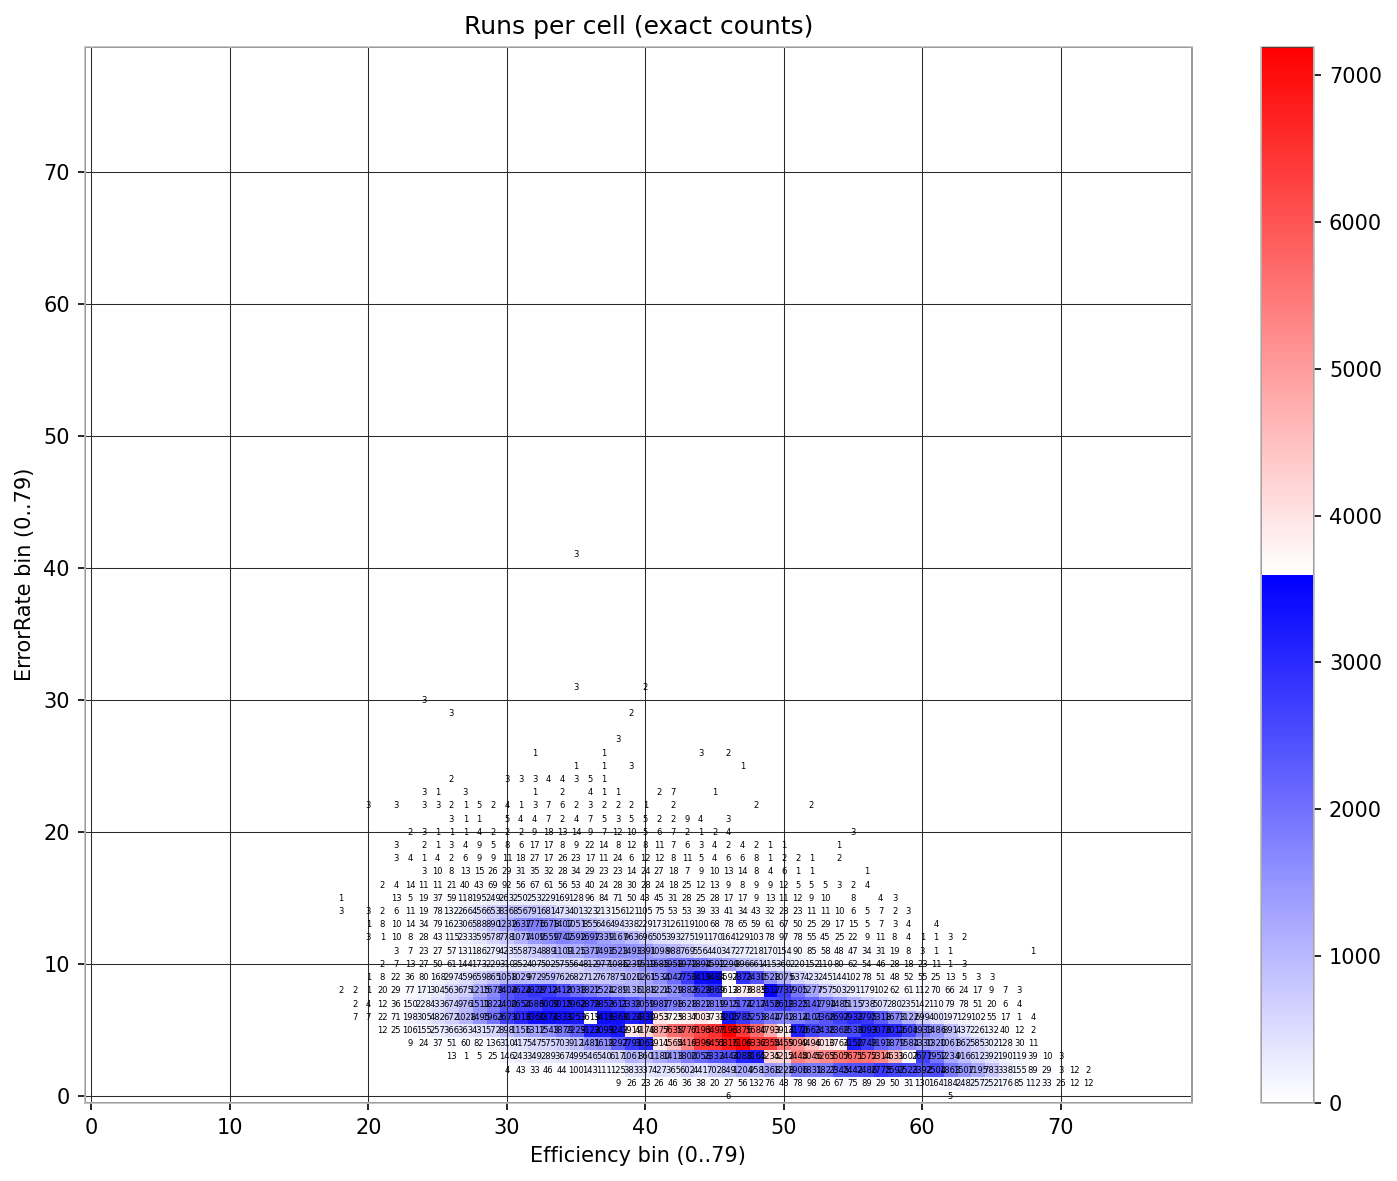
The exact counts of simulation runs across efficiency and error rate bins (Figure 3) show a dense clustering of outcomes. Most iterations gather at moderate efficiency with low error rates, while divergent trails appear at the extremes, reflecting the performance tradeoffs associated with the managerial framework.
The cultural cost and resentment accumulation
The operational advantage of the punishing style becomes questionable once the cultural variables governing resentment and adaptation are examined. As shown in Table 1, the punishing style produces an average resentment score of 0.80, twice the level observed under the corrective style.
The Spearman correlation matrix (Figure 4) provides a macro level overview of the associations among the simulated variables. It shows a strong positive association among punitive feedback, the accumulation of average resentment, and the eventual volume of resignations. Average resentment is in turn strongly negatively associated with the active worker count, the survival time of the team in ticks, and the total tasks completed.
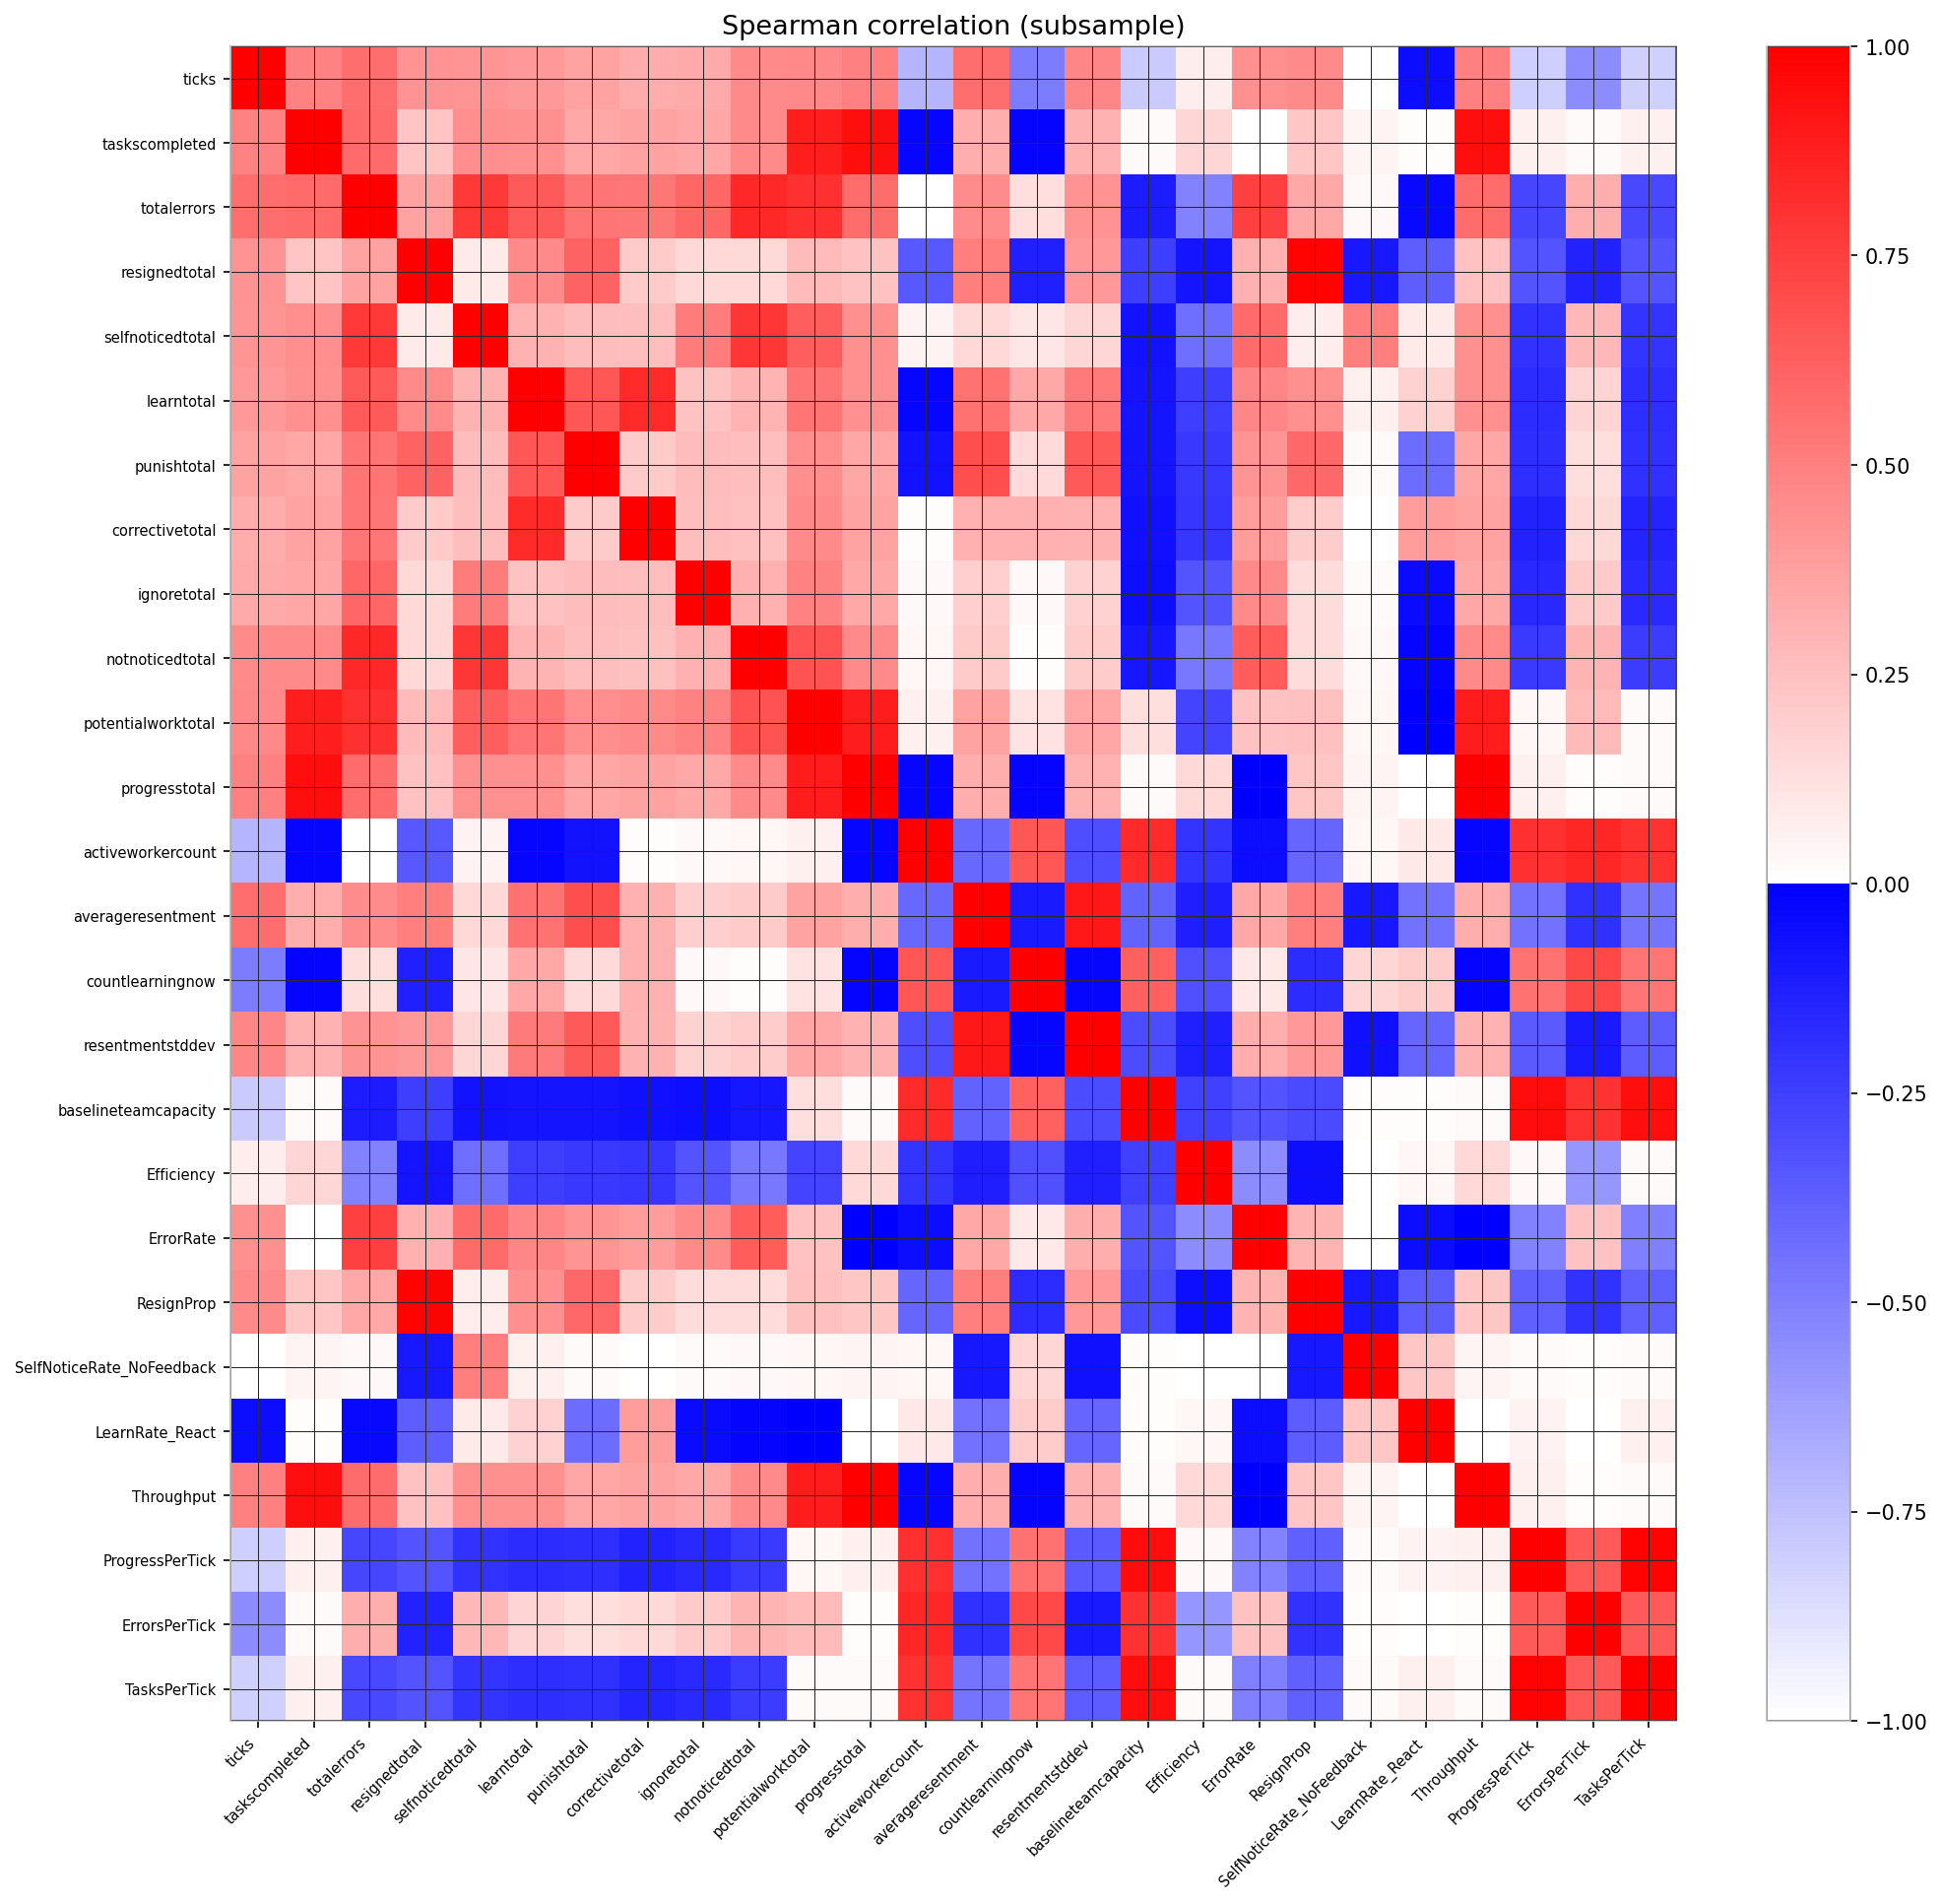
The matrix also shows a strong positive association between the use of corrective feedback and total learning events, which is consistent with the effect of managerial style on total learning reported in Table 2. Environments with absent monitoring instead required workers to rely on autonomous correction, so that lower monitoring is associated with a higher number of self-noticed errors, indicating that reduced oversight shifts the burden of quality control onto the workforce.
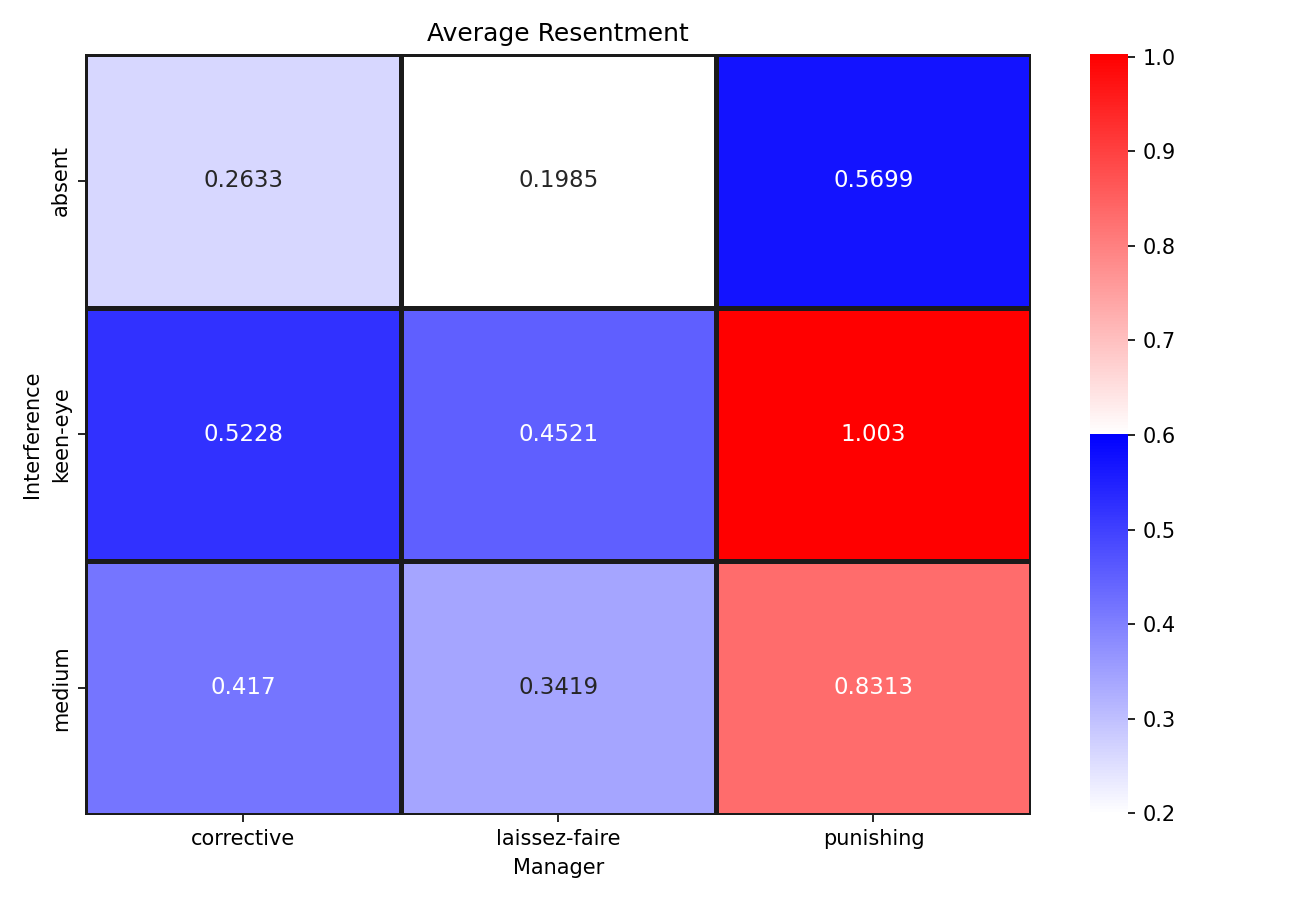
The average resentment heatmap (Figure 5) summarizes the cultural cost of oversight. A punishing style combined with keen-eye monitoring produces the highest average resentment across the workforce, whereas a laissez-faire approach with absent monitoring maintains the lowest, though earlier analyses show that this comes at the expense of operational efficiency. The corrective style occupies a sustainable middle position, suppressing errors through active learning without driving resentment to the levels reached under punishment.
Workforce sustainability and systemic collapse
The viability of each simulated organization is ultimately determined less by short-term efficiency than by long-term survival and the retention of labor capacity. As shown in Table 1, the punishing style yields an average of 1.59 resignations per run, well above both the corrective style at 0.31 and the laissez-faire style at 0.21. The ordering of the latter two is itself informative: corrective management, despite producing the lower error rate, generates somewhat more attrition than laissez-faire, because active correction still carries a residual risk of breeding resentment whereas a manager who ignores most errors imposes little interpersonal cost. The decisive separation is therefore not between engagement and disengagement but between punitive and non-punitive engagement, with only the punishing style raising resignations to a level that threatens the team.
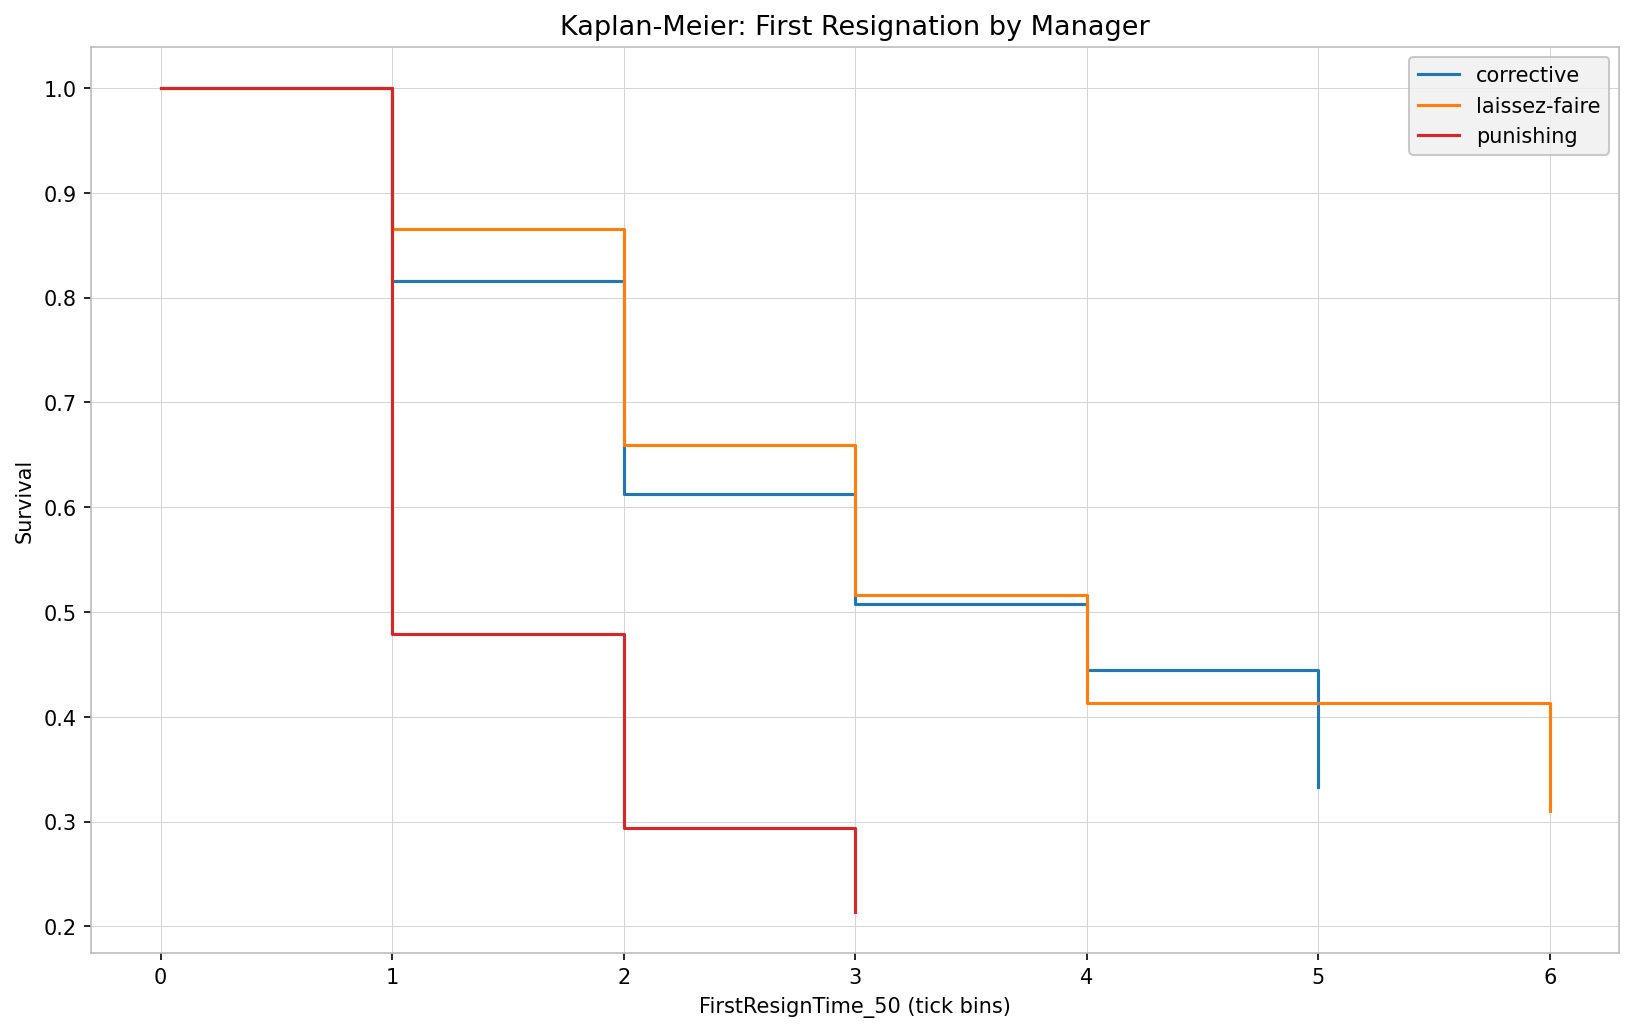
Survival analysis using Kaplan Meier estimates for the time to first resignation (Figure 6) shows that punitive environments experience their first departure earlier than environments using corrective or laissez-faire policies. The estimated survival probability for the first resignation falls steeply for the punishing style within the earliest time bins. This early capacity loss initiates a cascade that reshapes the team, shifting work onto the remaining members and exposing them to higher fatigue.
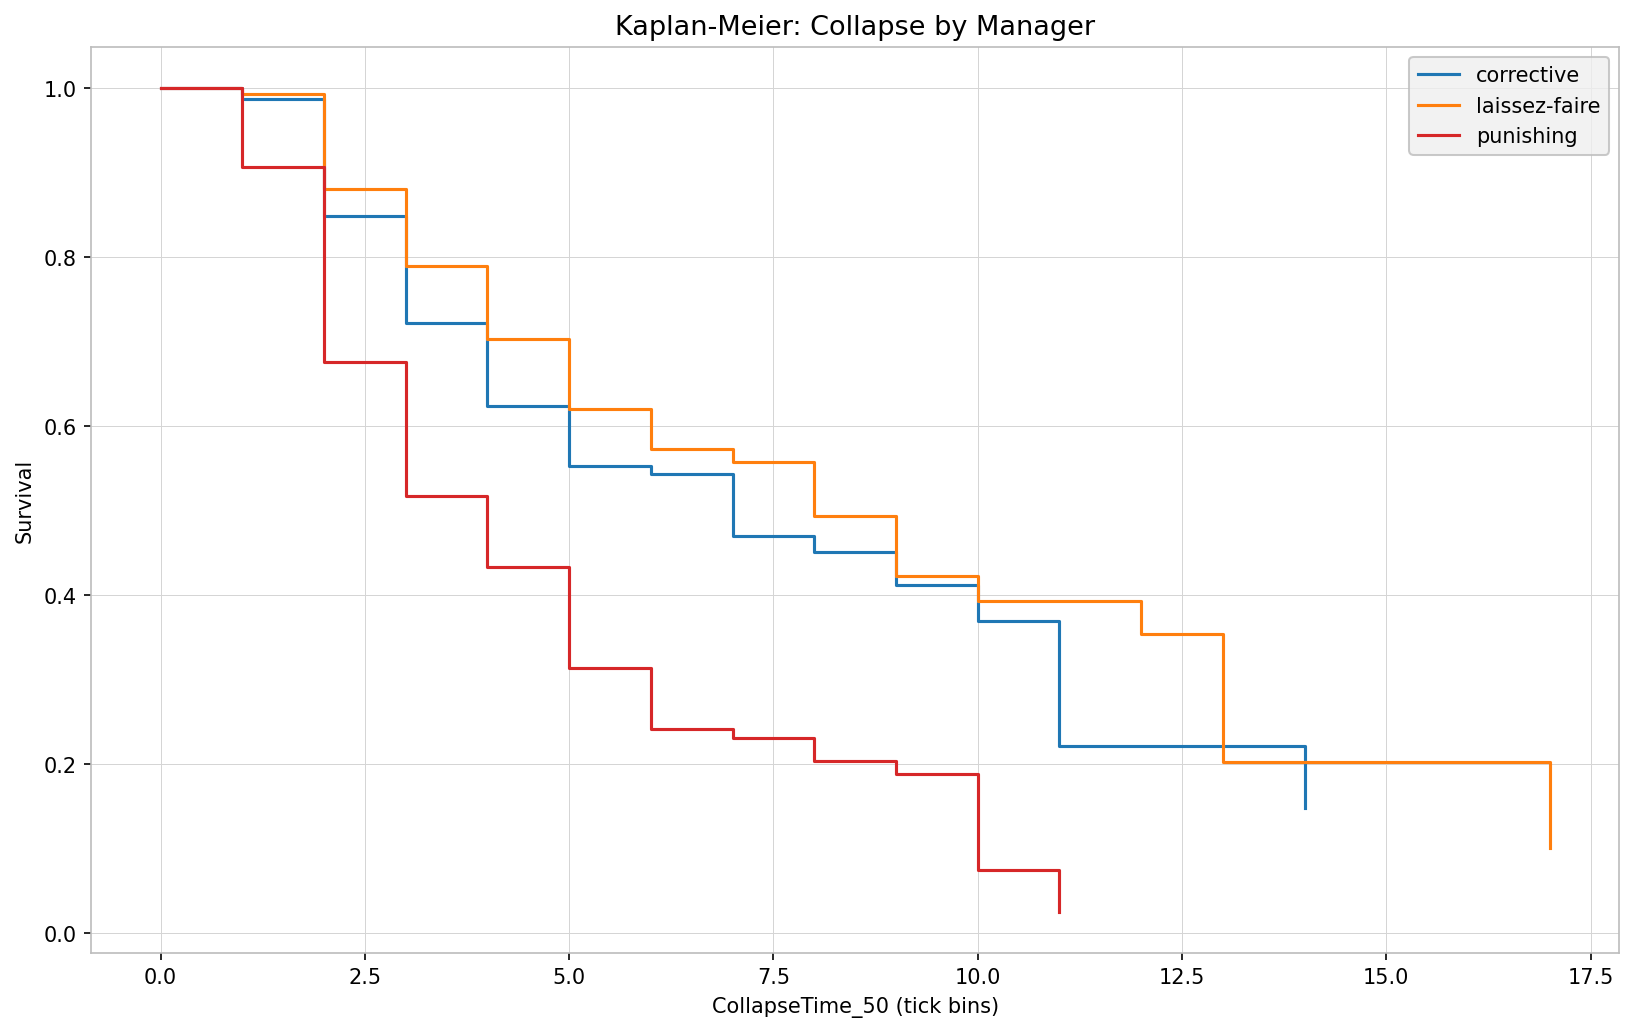
This early attrition feeds directly into systemic failure, as shown by the Kaplan Meier curves for total organizational collapse (Figure 7). The punishing style reaches collapse markedly sooner, with survival probability falling steeply, while the corrective and laissez-faire approaches sustain operational viability considerably longer into the task sequence.
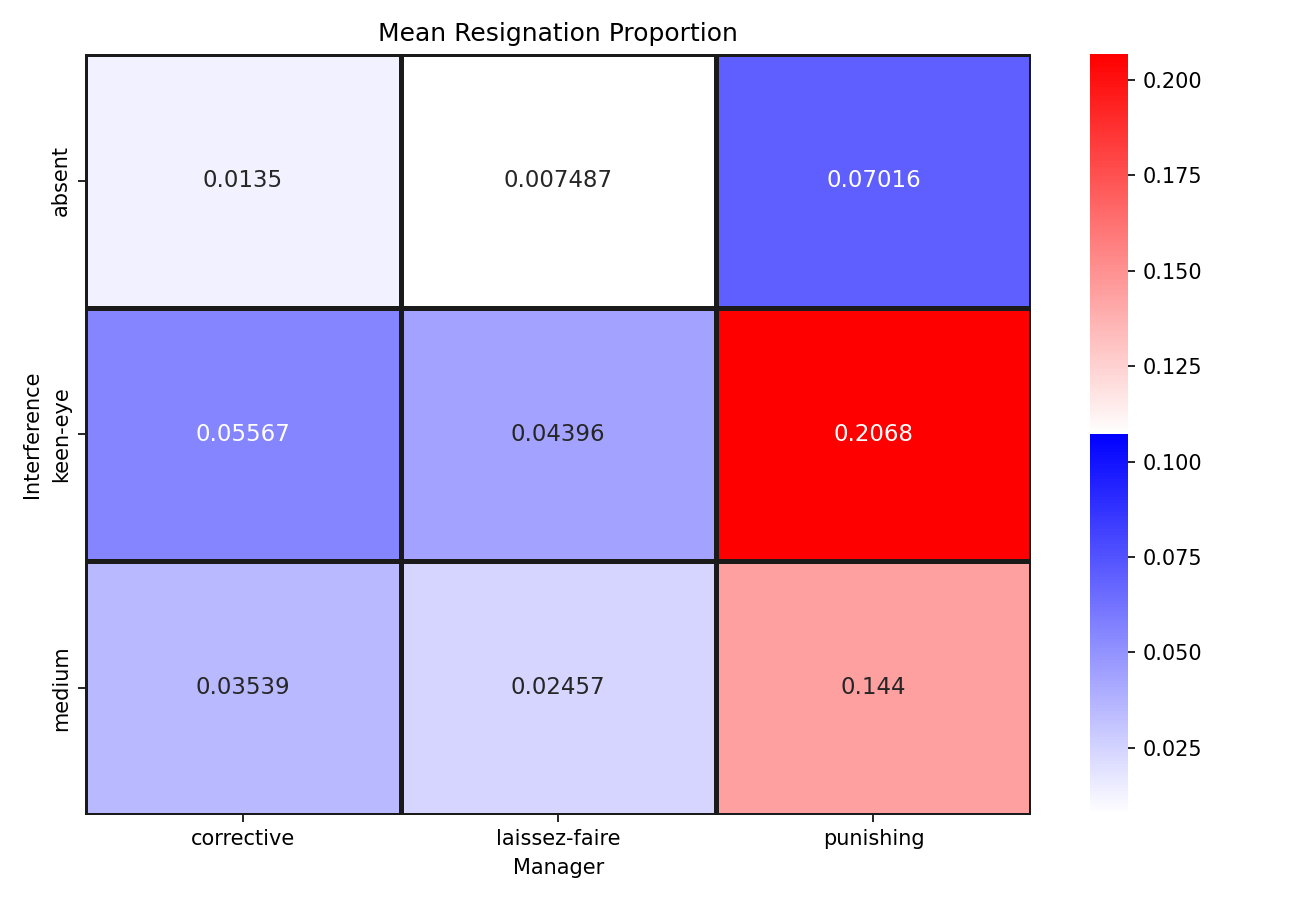
The mean resignation proportion heatmap (Figure 8) locates this attrition, showing that the punishing style under keen-eye monitoring produces the highest resignation proportion in the sweep.
Consequently, the collapse probability heatmap (Figure 9) shows that this parameter configuration yields the highest failure rate of any modeled configuration, with a collapse probability of 0.15. The risk rises monotonically with surveillance under the punishing style, climbing from 0.04 under absent monitoring to 0.10 under medium and 0.15 under keen-eye. The contrast with the other styles is pronounced: corrective and laissez-faire management under keen-eye monitoring yield collapse probabilities of only 0.03 and 0.02 respectively, and both sit near zero under absent monitoring. The most intensive monitoring therefore produces the highest collapse risk under punishment and a negligible one under correction.
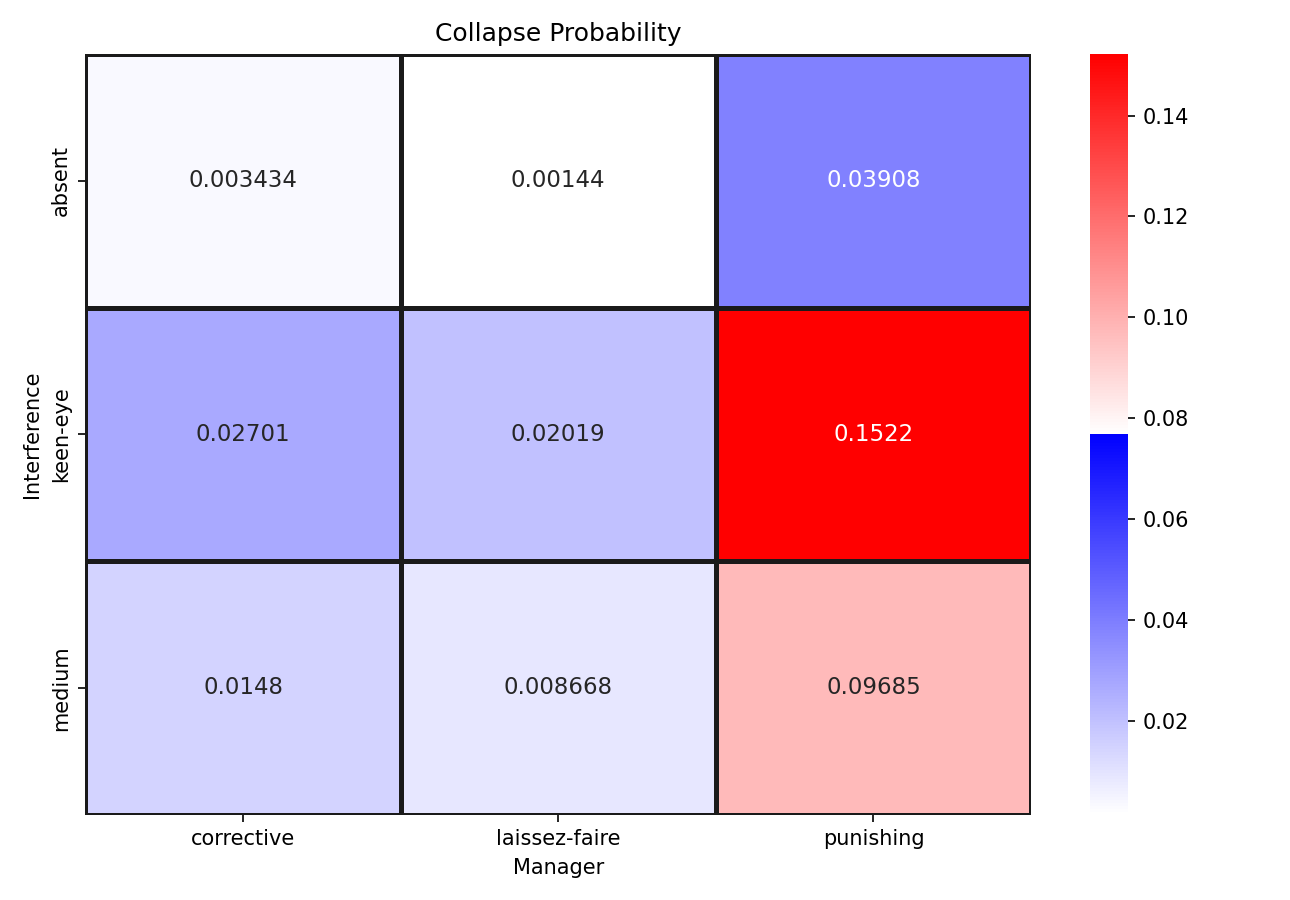
These patterns are consistent with the theoretical proposition that short-term operational extraction through punitive monitoring contributes to long-term structural collapse (Rudolph & Repenning 2002). The nonparametric chi square test of independence in Table 4 indicates an association among managerial action, workforce resilience profile, and terminal collapse; as with the other significance tests, this is reported for completeness, and the substantive weight of the relationship is carried by the effect sizes and collapse probabilities reported above.
| Binary Outcome | Factor | Chi Square | df | p Value | Cramer’s V |
|---|---|---|---|---|---|
| Collapse | Manager Style | 28013.67 | 2 | \(p < 0.001\) | 0.200 |
| Collapse | Manager Interference | 8079.68 | 2 | \(p < 0.001\) | 0.107 |
| Collapse | Resilience Profile | 18658.54 | 2 | \(p < 0.001\) | 0.163 |
Sensitivity to workload and workforce heterogeneity
The final phase of the analysis evaluates the sensitivity of the organizational system to exogenous pressures, specifically varying task difficulty and the resilience profile of the workforce. Table 5 presents the descriptive statistics for these specific conditions.
| Category | Level | Tasks Completed Mean | Total Errors Mean | Resignations Mean |
|---|---|---|---|---|
| Task Difficulty | Easy | 14.98 | 63.02 | 0.23 |
| Task Difficulty | Medium | 29.87 | 121.68 | 0.69 |
| Task Difficulty | Hard | 44.61 | 174.04 | 1.19 |
| Resilience Profile | Low | 29.53 | 121.03 | 1.36 |
| Resilience Profile | Medium | 29.85 | 121.31 | 0.56 |
| Resilience Profile | High | 29.99 | 116.31 | 0.24 |
| Resilience Profile | Uniform | 29.92 | 119.66 | 0.66 |
As task difficulty scales from easy to hard, mean total errors rise from 63.02 to 174.04 and mean resignations from 0.23 to 1.19. In the factorial analysis of variance (Table 6), task difficulty is the dominant influence on total errors, accounting for close to half of the variance (\(\eta\)\(^2\)p = 0.462), and has a smaller but appreciable effect on total resignations (\(\eta\)\(^2\)p = 0.110); the corresponding F statistics are extremely large, but, as noted above, this reflects the number of runs rather than the importance of the effect.
| Dependent Variable | Source | df | F Statistic | p Value | Partial Eta Squared |
|---|---|---|---|---|---|
| Tasks Completed | Task Difficulty | 2 | 5411503.36 | \(p < 0.001\) | 0.977 |
| Total Errors | Task Difficulty | 2 | 107330.41 | \(p < 0.001\) | 0.462 |
| Resigned Total | Task Difficulty | 2 | 15600.08 | \(p < 0.001\) | 0.110 |
| Tasks Completed | Resilience Profile | 3 | 777.50 | \(p < 0.001\) | 0.009 |
| Total Errors | Resilience Profile | 3 | 129.09 | \(p < 0.001\) | 0.001 |
| Resigned Total | Resilience Profile | 3 | 11066.96 | \(p < 0.001\) | 0.117 |
Workforce heterogeneity matters for turnover through the resilience profile of the agents. A low resilience profile yields the highest mean resignations at 1.36, whereas a high resilience profile reduces mean resignations to 0.24, and the resilience profile accounts for a share of the variance in total resignations (\(\eta\)\(^2\)p = 0.117) comparable to that explained by task difficulty. Its effect on total errors, by contrast, is negligible (\(\eta\)\(^2\)p = 0.001), indicating that psychological tolerance governs withdrawal behavior rather than mechanical accuracy. Workload therefore dictates the raw frequency of operational failures, while the heterogeneous psychological capital of the workforce dictates whether those failures translate into systemic collapse.
Parameter importance across the full sweep
The sensitivity analysis extends the factorial design to all eight sweep parameters simultaneously, including workforce size, workload distribution, and agent error propensity, and yields a hierarchical account of parameter influence across each primary outcome. The partial \(\eta\)\(^2\) heatmap (Figure 10) consolidates these importance estimates into a single map, showing that the dominant sources of systemic variance lie as much in the structural properties of the task environment as in the managerial policies imposed upon it.
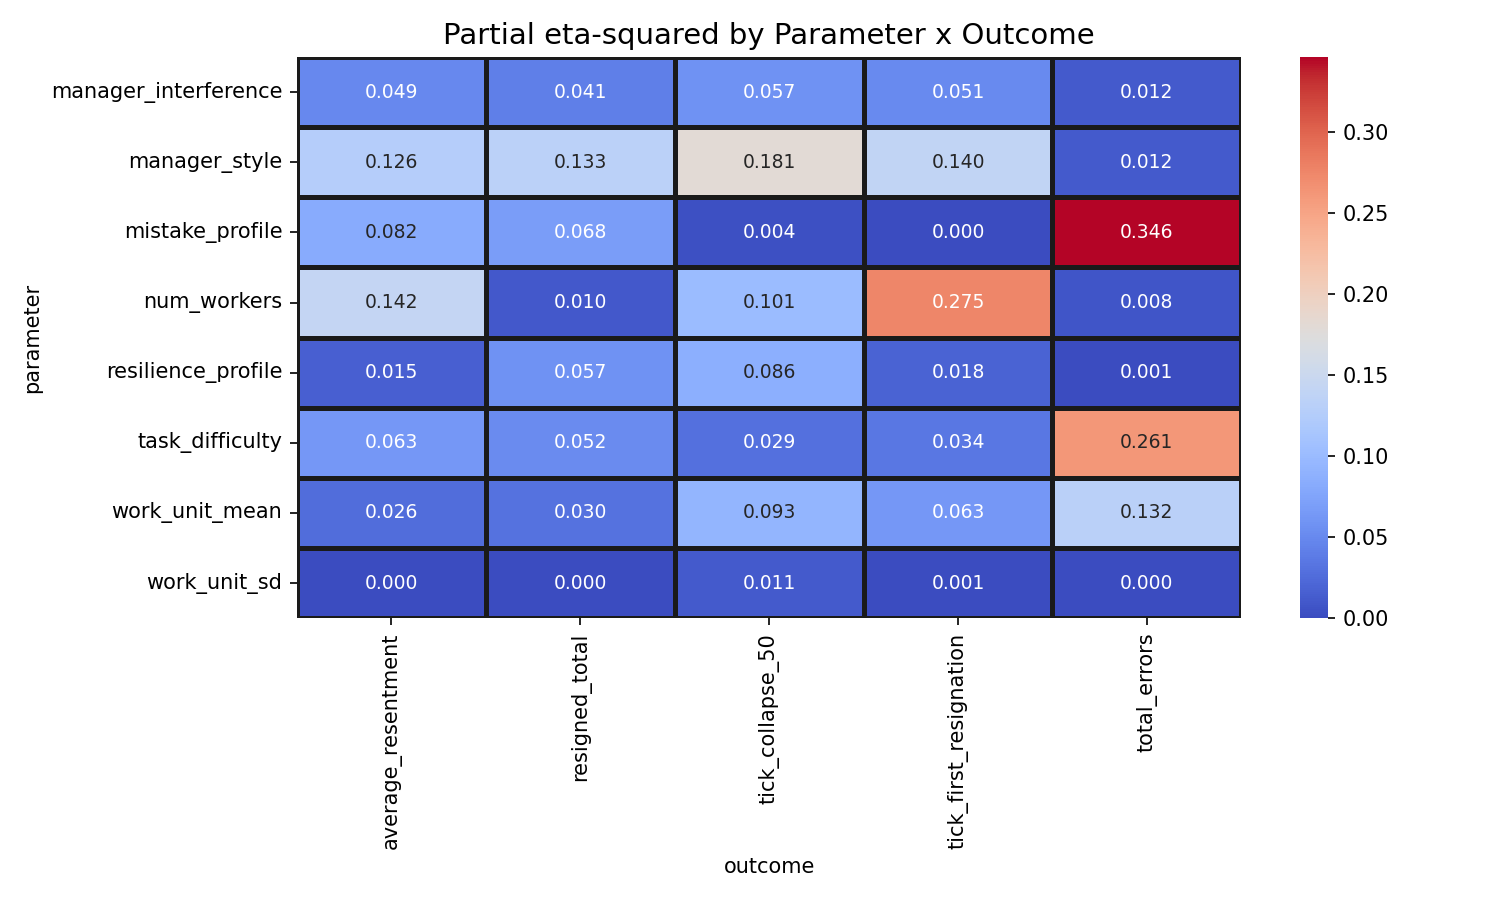
Read across the full set of outcomes, the same decomposition makes the outcome specificity of each parameter explicit. The mistake profile is the largest single contributor to total errors, with a partial \(\eta\)\(^2\) of 0.346 that exceeds every other parameter and outcome combination in the sweep, while the elevation of workforce size for the timing of first resignation indicates that team size governs the pace of attrition through a mechanism largely separate from the cultural and managerial forces that shape the other outcomes.
For total errors, the mistake profile of the workforce is the largest contributor across the full parameter sweep, registering a partial \(\eta\)\(^2\) of 0.346, a value that exceeds the combined managerial contributions and indicates that agent-level error propensity is the primary mechanical driver of operational failure. Task difficulty follows as the second largest contributor (\(\eta\)\(^2\)p = 0.261), consistent with the conclusion established earlier, that the structural complexity of the assignment environment governs the raw frequency of cumulative failures. The work unit mean exerts a meaningful independent effect on total errors (\(\eta\)\(^2\)p = 0.132), indicating that the baseline volume of work arriving per unit time functions as a secondary structural driver of error accumulation beyond agent and task characteristics. By contrast, managerial style and monitoring intensity each register modest one-way effects on total errors (\(\eta\)\(^2\)p = 0.012 and 0.012 respectively) when assessed independently against this full parametric landscape, an observation that does not diminish their importance but contextualizes it: the contribution of managerial policy to error accumulation is interactive rather than additive, operating through the mechanisms of resentment, attrition, and cognitive burden shift documented in the preceding analyses.
The parameter ranking shifts substantially when the outcome of interest moves to cultural and structural outcomes. For the resigned total and the binary resignation probability, managerial style is again the leading contributor (\(\eta\)\(^2\)p = 0.133 and 0.141 respectively), indicating that resignation dynamics are governed more by managerial policy than by the structural parameters of the task environment. For average resentment, workforce size emerges as the leading independent determinant (\(\eta\)\(^2\)p = 0.142), marginally exceeding the effect of managerial style (\(\eta\)\(^2\)p = 0.126), indicating that team density modulates the accumulation of resentment through mechanisms that extend beyond the managerial regime. For systemic collapse timing, managerial style is again the dominant contributor (\(\eta\)\(^2\)p = 0.181), indicating that it is the leading determinant of long-run organizational viability within the model. The time to first resignation is most strongly predicted by the number of workers (\(\eta\)\(^2\)p = 0.275), indicating that larger teams possess greater absorptive capacity against early attrition events, independent of the managerial policy applied.
Surrogate model validation of the parameter hierarchy
To examine the variance decomposition findings under weaker assumptions, and to capture nonlinear contributions that linear \(\eta\)\(^2\) statistics may obscure, a Random Forest surrogate model was fitted to each outcome variable separately, and permutation importance estimates were extracted to quantify the relative explanatory contribution of each input parameter under a model-free nonparametric framework (Figure 11). The surrogate models achieved cross-validated R\(^2\) values of 0.912 for total errors, 0.801 for resigned total, 0.645 for average resentment, 0.633 for time to first resignation, and 0.558 for collapse timing, indicating that the parameter set accounts for most of the variance in these outcomes. The convergence of the nonlinear surrogate rankings with the partial \(\eta\)\(^2\) hierarchy suggests that the leading relationships observed in the simulation are not artifacts of the functional form assumed by the variance decomposition.
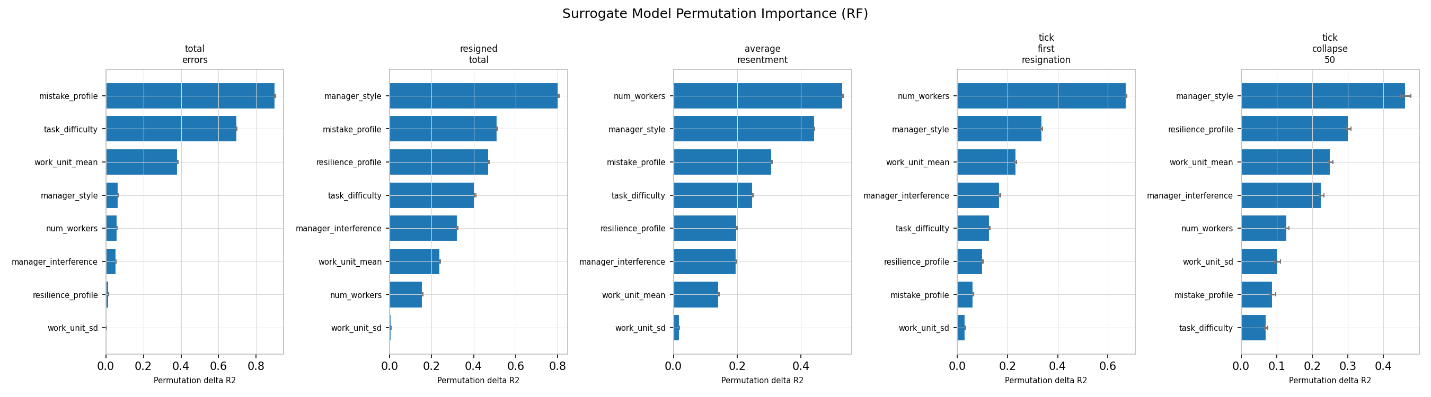
For total errors, the mistake profile emerges once again as the leading nonlinear driver with a permutation importance of 0.900, followed by task difficulty at 0.696 and work unit mean at 0.383. The high R\(^2\) of the surrogate model for this outcome indicates that cumulative error counts are close to deterministic functions of the structural parameters, leaving little residual variance attributable to seed-level randomness. For resigned total, managerial style is the leading contributor to nonlinear feature importance at 0.805, a value more than 57% larger than the next contributor, mistake profile, at 0.512. This gap indicates that resignation dynamics in the model are governed more by managerial policy than by the structural parameters, which is consistent with the theoretical claim that punitive organizational policies are a principal mechanism of workforce destabilization. For average resentment, the number of workers generates the highest permutation importance at 0.530, followed by manager style at 0.442, indicating that team density amplifies the accumulation of resentment. For collapse timing, managerial style registers the highest permutation importance at 0.463, with resilience profile at 0.302 as the most influential workforce characteristic, indicating that while team size and workload parameters influence the trajectory, the governing managerial policy and the psychological capital of the workforce are the principal determinants of the terminal survival window within the model.
Seed robustness and simulation stability
An important prerequisite for drawing substantive organizational inferences from agent-based simulation data is the demonstration that observed outcomes represent stable properties of the parameter configuration rather than artifacts of stochastic initialization. The coefficient of variation distributions, computed across the thirty independent seeds per unique parameter configuration, quantify the degree to which simulation outcomes are reproducible under parametric control (Figure 12).
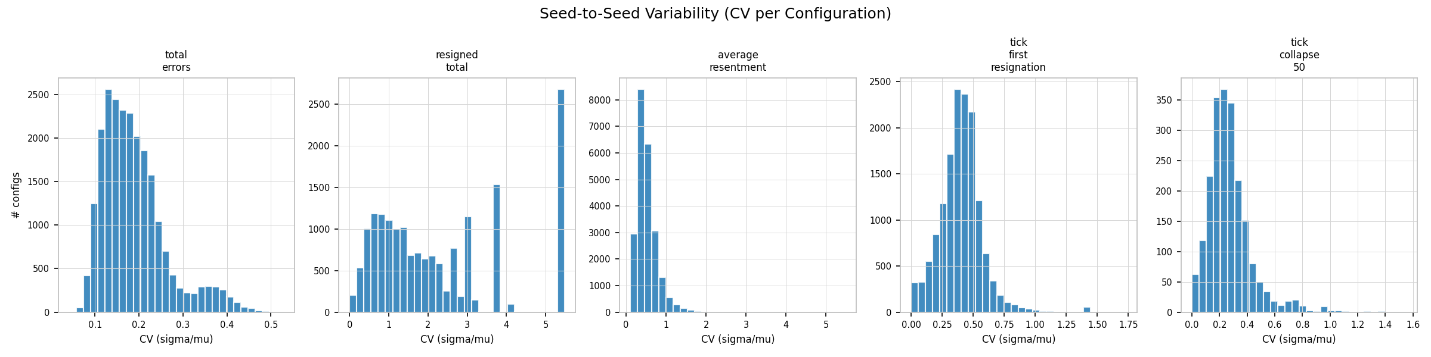
The total error count shows high reproducibility, with the modal coefficient of variation clustering tightly between 0.10 and 0.20, indicating that the cumulative error count is a stable behavioral signature of any given parameter configuration. Average resentment exhibits the tightest seed-to-seed variability of all outcomes, with the great majority of configurations yielding near-zero CV values, indicating that the resentment equilibrium of the team is close to a deterministic function of the parameter inputs. By contrast, the resigned total displays the broadest seed-level dispersion, with a substantial proportion of configurations yielding CV values exceeding 0.50, reflecting the stochastic and cascade-prone character of the attrition process, in which a single early departure triggers a chain of events whose precise unfolding is sensitive to stochastic variation while the eventual outcome remains parametrically governed. The time-to-event outcomes for first resignation and organizational collapse exhibit moderate seed-to-seed variability concentrated between 0.20 and 0.60, indicating that while the eventual occurrence of these events is governed by the parameter configuration, the precise timing retains a meaningful stochastic component attributable to emergent cascade dynamics. Taken together, these robustness characteristics indicate that the primary inferences drawn from the managerial analysis are not sensitive to the specific random seed employed, and that the thirty-seed design provides adequate coverage of the stochastic outcome space for all primary dependent variables.
Interaction sensitivity and combinatorial risk
The formal quantification of pairwise interaction strengths, measured as the standard deviation of the additive interaction residual across all cell combinations, establishes a hierarchy of combinatorial risk. The most pronounced interactions on systemic collapse timing are generated by the manager style \(\times\) resilience profile combination (interaction SD = 64.36) and the manager style \(\times\) manager interference combination (interaction SD = 13.10), indicating that the consequences of punishing management are amplified when workforce resilience is low and monitoring is intense. For total errors, the mistake profile \(\times\) manager interference interaction produces the highest interaction strength (SD = 6.42), followed by the manager style \(\times\) task difficulty combination (SD = 5.03), indicating that raw error accumulation is most sensitive to the joint escalation of agent error propensity and task complexity rather than to any single parameter in isolation.
The cell-mean heatmap for total errors under the manager style \(\times\) task difficulty interaction (Figure 13) shows that the laissez-faire approach combined with hard task difficulty generates the highest absolute mean error count across all modeled configurations at 196.2, a value that exceeds the hard-difficulty means of both the corrective (163.6) and punishing (162.4) styles by a substantial margin. Notably, the corrective and punishing styles both suppress raw error accumulation relative to laissez-faire under maximal task load, indicating that active managerial engagement of either character attenuates error generation when the work environment is most demanding. The interaction on resigned total under the same parameter combination (Figure 14) shows the inverse pattern: the punishing style under hard task conditions drives mean resignations to 2.6, a value more than four times that produced by either corrective or laissez-faire management under identical environmental stress. This interaction is consistent with the theoretical proposition that punishing regimes are most damaging precisely when the workforce requires the greatest support, with task-induced pressure functioning as a multiplier for the attrition consequences of punitive management.
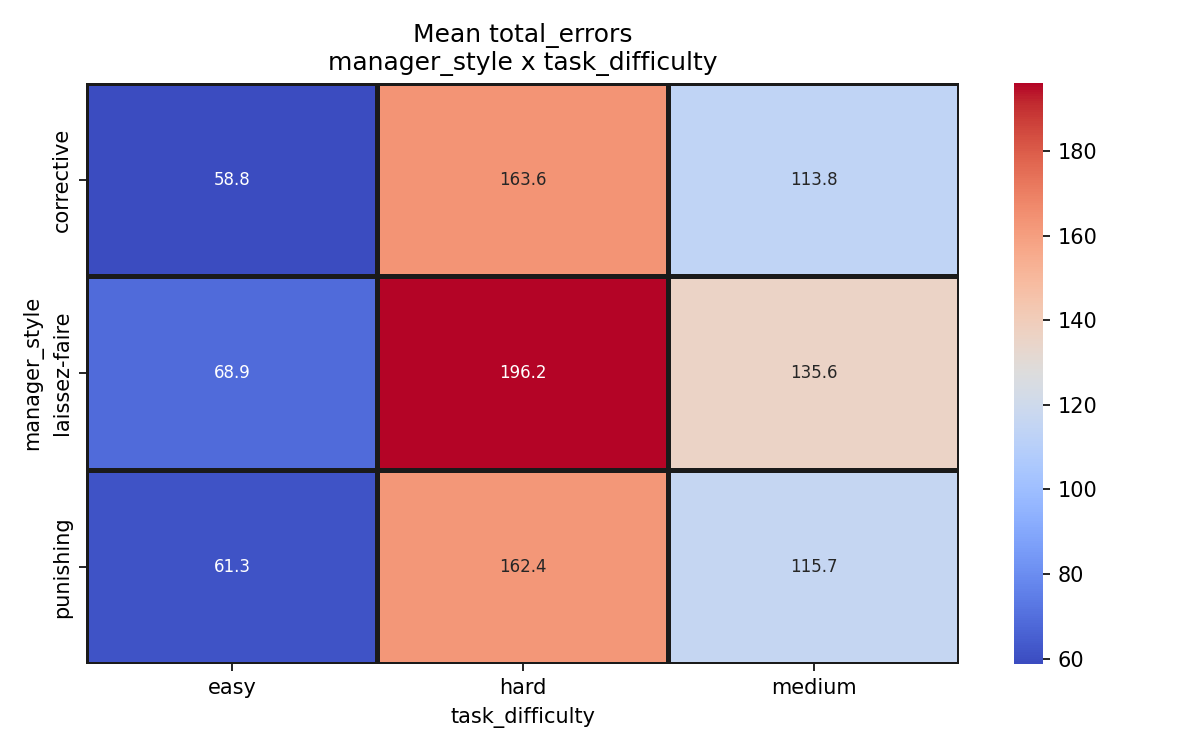
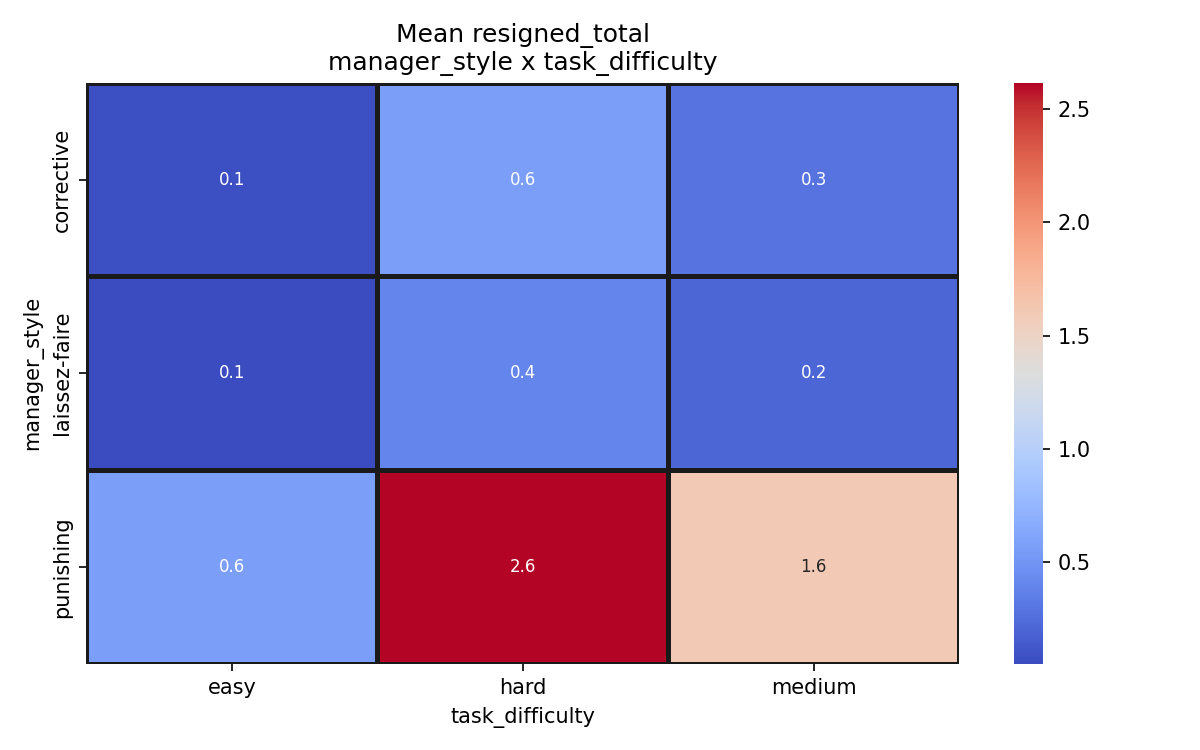
The mean resigned total under the manager style \(\times\) manager interference interaction (Figure 15) further isolates the combinatorial configuration that generates maximal workforce attrition: a punishing style combined with keen-eye monitoring produces a mean resigned total of 2.5, the highest value observed across every parameter combination in the full sweep. Even within the punishing regime, absent monitoring attenuates this effect, reducing the mean to 0.7, indicating that the greatest attrition observed in the sweep requires the simultaneous activation of punitive policy and intensive surveillance. The corresponding heatmap for total errors under the same interaction (Figure 16) shows that keen-eye monitoring combined with either corrective or punishing management suppresses errors to their minimum across all configurations, with the two styles achieving mean error counts of 99.2 and 99.5 respectively under keen-eye conditions, against 126.2 under laissez-faire management, a finding that illustrates the central tension of organizational control: the monitoring intensity required to minimize errors is precisely the configuration that maximizes resignations when it is combined with punitive policy.
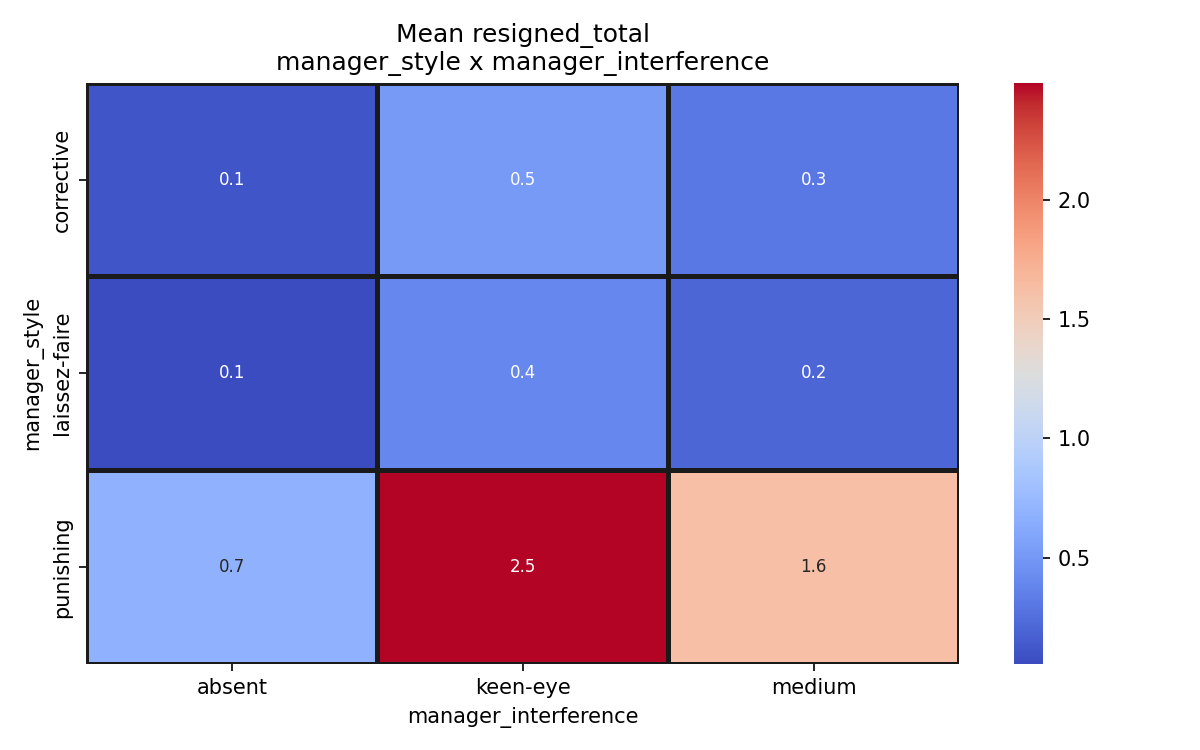
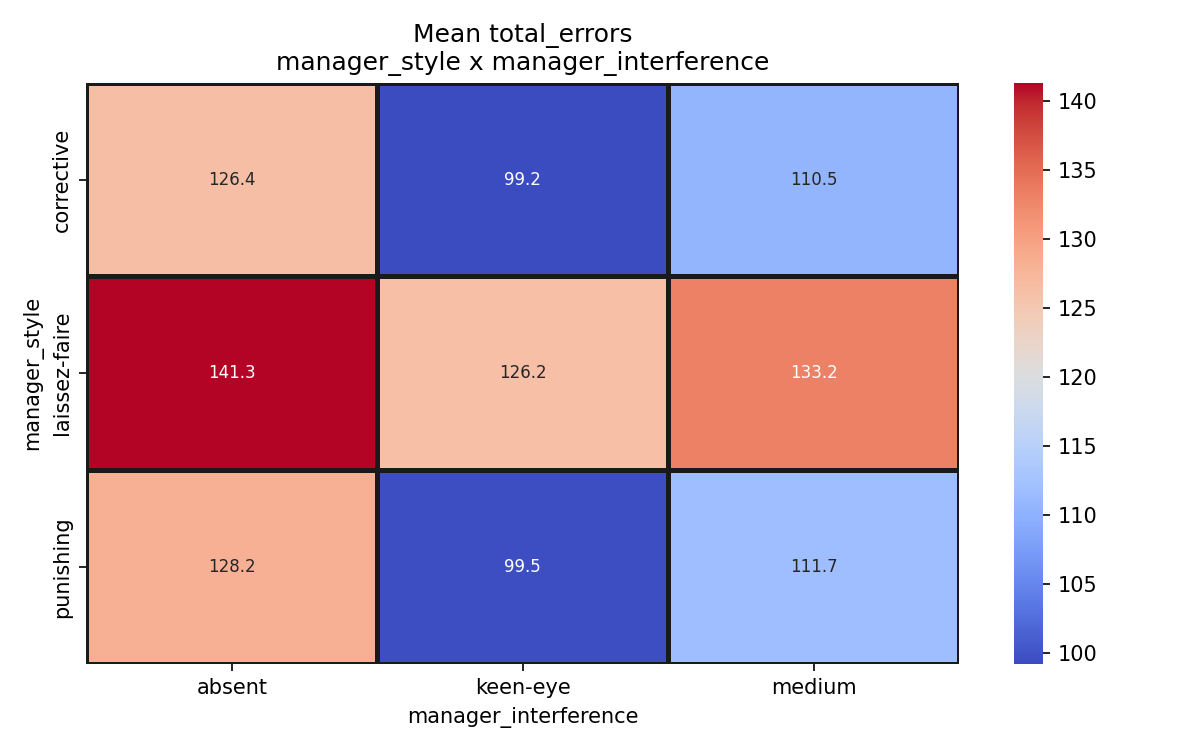
The top-decile error risk analysis (Figure 17) quantifies the probability of entering the worst 10% of the error distribution, stratified by individual parameter level. The hard task difficulty level generates a risk approximately double the 10% baseline threshold, indicating that it is the strongest single-parameter pathway to severe operational degradation. Among workforce characteristics, a high mistake profile produces a risk exceeding 0.30, indicating that it is the strongest agent-level driver of worst-case operational outcomes. Among managerial parameters, the laissez-faire style marginally exceeds the baseline threshold, while the corrective and punishing styles display nearly identical and modestly lower top-decile risks, reinforcing the finding that raw error outcomes are more sensitive to structural than to managerial parameters when assessed at the tails of the distribution.
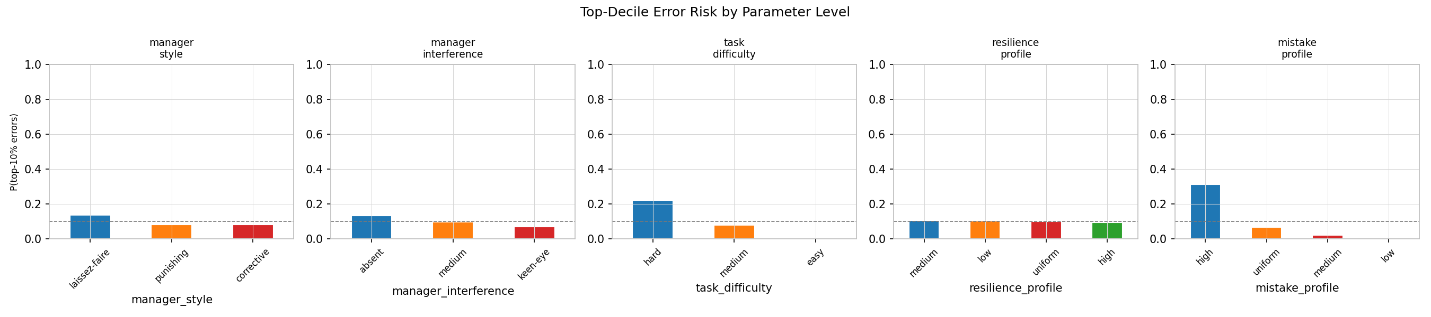
Composite objective stability across stakeholder scenarios
The final sensitivity analysis evaluates whether the organizational rankings produced by the simulation are robust to the value assumptions of the stakeholder performing the assessment. Three weighting scenarios were applied to a composite harm index aggregating total errors, resignations, average resentment, and organizational collapse probability: an error-focused scenario assigning 60% weight to operational accuracy, a retention-focused scenario assigning 60% weight to workforce continuity, and a balanced scenario distributing equal 25% weight across all four outcomes.
As shown in Figure 18, the punishing management style ranks as the most harmful configuration under all three stakeholder scenarios, registering composite harm scores of 0.097, 0.094, and 0.079 under the error-focused, balanced, and retention-focused weightings respectively. The corrective style ranks first under both the balanced (0.048) and error-focused (0.073) scenarios, indicating that it is the preferred policy when either accuracy or overall organizational welfare is the primary evaluative criterion. The laissez-faire style claims the lowest composite harm exclusively under the retention-focused scenario (0.028), reflecting its documented advantage in minimizing resignations at the direct cost of error accumulation. The ranking of punishing management as third across all three scenarios, without a single configuration in which it approaches competitive performance, indicates that the punishing policy is the most harmful option across the full space of stakeholder value functions considered here, and not merely under assumptions favorable to its alternatives.
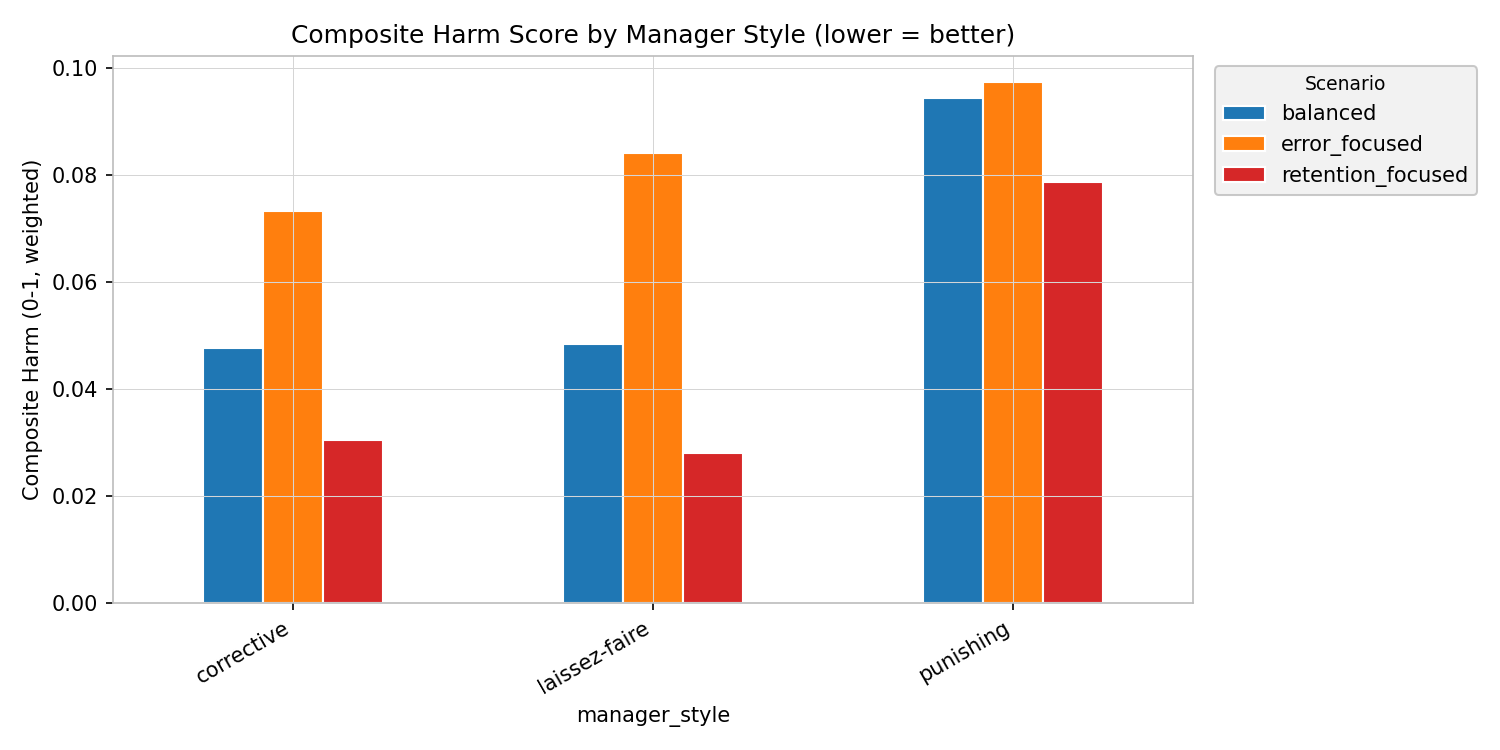
Conclusion
The present simulation indicates that the organizational consequences of managerial feedback policy are not merely attitudinal but structural, and that within the model they are difficult to reverse once underway. By operationalizing the moment of error as the trigger for managerial interaction, the agent-based framework renders the causal chain from a local interpersonal response to macro level systemic collapse fully observable, capturing the emergent regime shifts and cascades of withdrawal that aggregate averages cannot recover (Harrison et al. 2007; Macy & Willer 2002). The central proposition animating the research, that short-term operational extraction through punitive monitoring contributes to long-term structural collapse, is supported across the analyses. The punishing style does not merely perform slightly worse than its alternatives; it produces a categorically different organizational regime, marked by the earliest first resignations and a collapse probability of 0.15, at least 1.5 times that of any other configuration. This early capacity loss is self-reinforcing rather than recoverable, since once attrition removes workers the heightened load on those who remain accelerates the next departure, a path-dependent lock-in consistent with the disaster and capability trap dynamics of Rudolph & Repenning (2002) and the irreversibility logic of Sydow et al. (2009) and Levinthal (1997).
The most consequential finding is the paradox of monitoring intensity. The very surveillance configuration that drives errors to their minimum, keen-eye monitoring, simultaneously produces the maximum workforce attrition and the highest collapse risk once it is paired with a punishing policy. Intensive oversight is therefore neither protective nor corrosive in itself; its effect is entirely contingent on the feedback regime it activates, functioning as an organizational resource under correction and as an accelerant of deterioration under punishment (Demerouti et al. 2001; Schaufeli & Taris 2014). This is the mechanism through which an organization can undermine itself while believing it is operating optimally, watching its error metrics improve even as the conditions for cascading turnover accumulate unseen, and it gives computational form to the incivility and withdrawal dynamics documented by Cortina et al. (2001) and Foulk et al. (2016).
The full sensitivity analysis sharpens this into a practical distinction that holds across the entire parameter space. The raw frequency of errors is governed overwhelmingly by structural factors, the mistake propensity of the workforce and the difficulty of the task, while the translation of those errors into resentment, resignation and collapse is governed by managerial policy. The two findings are robust rather than incidental: a model-free surrogate analysis reproduces the same hierarchy that the variance decomposition identifies, the rankings are stable across thirty independent seeds, and a composite harm index ranks the punishing style as the most damaging configuration under every stakeholder weighting without exception, whether an organization values accuracy, retention or a balance of the two. The superiority of corrective management is therefore not an artifact of how organizational success is defined.
These results give quantitative expression to the theoretical architecture the paper set out to integrate, demonstrating that interactional injustice accumulates as a genuine threshold process (Granovetter 1978; Skarlicki & Folger 1997), that the informational value of active correction is operationally real since corrective environments achieve lower error rates than laissez-faire ones (Van Dyck et al. 2005), and that monitoring behaves as a job demand whose consequences depend on the resources accompanying it (Schaufeli & Taris 2014). In unifying the operational mechanics of task completion with the social dynamics of workplace mistreatment, the model turns a set of previously separate literatures into a single, observable causal system.
The practical lesson is therefore a dual one, and it is the paper’s central contribution. Error reduction and organizational survival are not the same problem and do not share a solution: errors are reduced through workforce composition and task design, whereas survival is secured through managerial policy. An organization that pursues the first through punitive surveillance purchases a visible improvement in its error metrics at the hidden cost of the workforce itself, optimizing precisely the indicator that masks its own collapse. Recognizing that the lever which suppresses the symptom is the very lever that produces the failure is the first step toward managing organizations for endurance rather than for the appearance of control.
Limitations
The present study operates within the inherent constraints of the agent-based methodology. The behavioral rules governing agent responses to managerial feedback, although grounded in established psychological theory, are deliberate simplifications of the continuous and context dependent dynamics of real organizational life. The model assigns fixed error probabilities that are modified by learning and resentment states but does not represent the full cognitive complexity of human performance under threat, and the resentment accumulation process is specified as a linear increment, whereas the relationship between negative experience and behavioral outcome may be nonlinear, with accelerating returns and individual specific functional forms that a uniform threshold model does not capture (Schaufeli & Taris 2014). These choices purchase tractability and transparency at the cost of psychological realism.
A more specific limitation concerns the exclusively vertical structure of interaction in the model. Incivility and resentment flow only from manager to worker, there is no channel for worker to worker influence, and the manager is the sole source of interpersonal mistreatment. Three empirically documented horizontal mechanisms are therefore absent. The first is the incivility spiral, in which exposure to rudeness prompts reciprocation and can spread to observers and third parties, so that a localized episode establishes a more hostile baseline across the team (Andersson & Pearson 1999; Foulk et al. 2016). The second is peer social support, which buffers the effect of stressors and could slow the accumulation of resentment or delay withdrawal, and which the present design cannot express (Beattie & Griffin 2014). The third is turnover contagion, in which each departure raises the likelihood of further departures through the morale and embeddedness of those who remain (Cui et al. 2026), a mechanism the model reproduces only indirectly, through the additional workload that resignations impose on the surviving workers. Because these omitted channels can both amplify the dynamics, through contagion, and dampen them, through support, the direction of the resulting bias is not obvious, and the present results are best read as isolating the vertical manager to worker mechanism rather than as a complete account of how mistreatment propagates. Incorporating an explicit peer network is the primary structural extension the model invites.
A related simplification concerns the construct the paper refers to as culture. In the model, the cultural state of the workforce is operationalized as a single scalar quantity, the resentment accumulated by each agent, which functions as the internal counter that governs withdrawal. This narrow operationalization captures the affective, grievance related dimension of culture that is most proximate to turnover, but it does not represent the wider construct, since shared values and norms, tacit assumptions and artifacts, the climate of psychological safety, and the sense of identity and belonging are not modeled, nor is the socially constructed and transmitted quality that distinguishes a culture from an aggregate of individual attitudes. What the paper describes as cultural erosion is therefore, more precisely, the accumulation of individual resentment in the absence of peer transmission, and the term should be read in that restricted sense. Representing culture as an emergent property shared across agents, rather than as the sum of private states, is a natural companion to the peer network extension.
Finally, the generalizability of the specific parameter values used in the sweep to particular organizational sectors remains an empirical question that the simulation cannot resolve on its own. The sweep is best understood as establishing qualitative regime boundaries and the relative ordering of managerial policies rather than calibrated point predictions for any single setting, and the empirical validation program described below is intended to anchor these parameters to observed distributions.
Future directions
The theoretical and computational findings generated by this study establish the foundation for a direct empirical validation program. A systematic data collection initiative targeting real organizational populations is planned, designed to measure the primary constructs operationalized in the simulation, managerial feedback style, monitoring intensity, error frequency, resentment accumulation, and turnover intention, through validated psychometric instruments administered longitudinally across multiple organizations and sector types. In parallel, the simulation framework will be extended toward an Early Warning System design, translating the threshold-breach logic of the model into a practical organizational monitoring tool capable of identifying configurations at elevated risk of cascade failure before the tipping point is reached. The longitudinal design is methodologically essential for capturing the temporal dynamics of resentment accumulation and the threshold-breach processes that cross-sectional survey research cannot detect. The empirical data will serve a dual purpose: to evaluate the extent to which the quantitative relationships produced by the simulation correspond to observable behavioral phenomena in human organizational populations, and to calibrate the agent-level parameters governing error probability, resentment increment rates, and resignation thresholds against empirically derived distributions. Beyond validation, the empirical dataset will permit an examination of moderating variables absent from the present model, including team size dynamics, sector-specific norms of oversight legitimacy, and the buffering role of peer social support networks whose incorporation into the next generation of the simulation represents the primary theoretical extension anticipated for subsequent research (Beattie & Griffin 2014; Demsky et al. 2019). The ultimate objective of this program is the construction of a calibrated organizational decision tool capable of translating proposed changes in managerial policy into probabilistic predictions of operational and cultural outcomes with a precision and temporal resolution that no existing analytical framework currently provides.
References
ANDERSON, P. (1999). Perspective: Complexity theory and organization science. Organization Science, 10(3), 216–232. [doi:10.1287/orsc.10.3.216]
ANDERSSON, L. M., & Pearson, C. M. (1999). Tit for tat? The spiraling effect of incivility in the workplace. Academy of Management Review, 24(3), 452–471. [doi:10.2307/259136]
BAKKER, A. B., Demerouti, E., & Sanz-Vergel, A. (2023). Job demands-resources theory: Ten years later. Annual Review of Organizational Psychology and Organizational Behavior, 10, 25–53. [doi:10.1146/annurev-orgpsych-120920-053933]
BEATTIE, L., & Griffin, B. (2014). Day-level fluctuations in stress and engagement in response to workplace incivility: A diary study. Work and Stress, 28(2), 124–142. [doi:10.1080/02678373.2014.898712]
BONABEAU, E. (2002). Agent-based modeling: Methods and techniques for simulating human systems. Proceedings of the National Academy of Sciences, 99(Suppl 3), 7280–7287. [doi:10.1073/pnas.082080899]
CARSON, K. P., Cardy, R. L., & Dobbins, G. H. (1991). Performance appraisal as effective management or deadly management disease. Group and Organization Management, 16(2), 143–159. [doi:10.1177/105960119101600203]
COLQUITT, J. A., Conlon, D. E., Wesson, M. J., Porter, C. O. L. H., & Ng, K. Y. (2001). Justice at the millennium: A meta-analytic review of 25 years of organizational justice research. Journal of Applied Psychology, 86(3), 425–445. [doi:10.1037/0021-9010.86.3.425]
CORTINA, L. M., Magley, V. J., Williams, J. H., & Langhout, R. D. (2001). Incivility in the workplace: Incidence and impact. Journal of Occupational Health Psychology, 6(1), 64–80. [doi:10.1037/1076-8998.6.1.64]
CUI, Z., Li, C., & Chen, M. (2026). An empirical study of the dynamics of collective employee turnover and its implications for dismissal policy: Evidence from a distribution center. Human Resource Management Journal, 36(2), 345–365. [doi:10.1111/1748-8583.70030]
DEMEROUTI, E., Bakker, A. B., Nachreiner, F., & Schaufeli, W. B. (2001). The job demands-resources model of burnout. Journal of Applied Psychology, 86(3), 499–512. [doi:10.1037/0021-9010.86.3.499]
DEMSKY, C. A., Fritz, C., Hammer, L. B., & Black, A. E. (2019). Workplace incivility and employee sleep: The role of rumination and recovery experiences. Journal of Occupational Health Psychology, 24(2), 228–240. [doi:10.1037/ocp0000116]
EDMONDSON, A. C., & Bransby, D. P. (2023). Psychological safety comes of age: Observed themes in an established literature. Annual Review of Organizational Psychology and Organizational Behavior, 10, 55–78. [doi:10.1146/annurev-orgpsych-120920-055217]
FIORETTI, G. (2013). Agent-based simulation models in organization science. Organizational Research Methods, 16(2), 227–242. [doi:10.1177/1094428112470006]
FOULK, T., Woolum, A., & Erez, A. (2016). Catching rudeness is like catching a cold: The contagion effects of low-intensity negative behaviors. Journal of Applied Psychology, 101(1), 50–67. [doi:10.1037/apl0000037]
GÓMEZ-CRUZ, N. A., Loaiza Saa, I., & Ortega Hurtado, F. F. (2017). Agent-based simulation in management and organizational studies: A survey. European Journal of Management and Business Economics, 26(3), 313–328.
GRANOVETTER, M. (1978). Threshold models of collective behavior. American Journal of Sociology, 83(6), 1420–1443. [doi:10.1086/226707]
GRIMM, V., Railsback, S. F., Vincenot, C. E., Berger, U., Gallagher, C., DeAngelis, D. L., Edmonds, B., Ge, J., Giske, J., Groeneveld, J., Johnston, A. S. A., Milles, A., Nabe-Nielsen, J., Polhill, J. G., Radchuk, V., Rohwäder, M.-S., Stillman, R. A., Thiele, J. C., & Ayllón, D. (2020). The ODD protocol for describing agent-based and other simulation models A second update to improve clarity replication and structural realism. Journal of Artificial Societies and Social Simulation, 23(2), 7. [doi:10.18564/jasss.4259]
HAN, S., Harold, C. M., Oh, I.-S., Kim, J. K., & Agolli, A. (2022). A meta-analysis integrating 20 years of workplace incivility research: Antecedents, consequences, and boundary conditions. Journal of Organizational Behavior, 43(3), 497–523. [doi:10.1002/job.2568]
HARRISON, J. R., Lin, Z., Carroll, G. R., & Carley, K. M. (2007). Simulation modeling in organizational and management research. Academy of Management Review, 32(4), 1229–1245. [doi:10.5465/amr.2007.26586485]
HINKIN, T. R., & Schriesheim, C. A. (2008). An examination of “nonleadership”: From laissez-faire leadership to leader reward omission and punishment omission. Journal of Applied Psychology, 93(6), 1234–1248. [doi:10.1037/a0012875]
LEE, J.-S., Filatova, T., Ligmann-Zielinska, A., Hassani-Mahmooei, B., Stonedahl, F., Lorscheid, I., Voinov, A., Polhill, J. G., Sun, Z., & Parker, D. C. (2015). The complexities of agent-based modeling output analysis. Journal of Artificial Societies and Social Simulation, 18(4), 4. [doi:10.18564/jasss.2897]
LEVINTHAL, D. A. (1997). Adaptation on rugged landscapes. Management Science, 43(7), 934–950. [doi:10.1287/mnsc.43.7.934]
LIN, M., Lucas, H. C., & Shmueli, G. (2013). Too big to fail: Large samples and the p-value problem. Information Systems Research, 24(4), 906–917. [doi:10.1287/isre.2013.0480]
MACY, M. W., & Willer, R. (2002). From factors to actors: Computational sociology and agent-based modeling. Annual Review of Sociology, 28, 143–166. [doi:10.1146/annurev.soc.28.110601.141117]
MAGLEY, V. J., Kabat-Farr, D., Malcore, M. A., & Walsh, B. M. (2026). Workplace incivility. Annual Review of Organizational Psychology and Organizational Behavior, 13, 337–361. [doi:10.1146/annurev-orgpsych-020924-072249]
NAMIN, B. H., Øgaard, T., & Røislien, J. (2022). Workplace incivility and turnover intention in organizations: A meta-analytic review. International Journal of Environmental Research and Public Health, 19(1), 25. [doi:10.3390/ijerph19010025]
REPENNING, N. P. (2001). Understanding fire fighting in new product development. Journal of Product Innovation Management, 18(5), 285–300. [doi:10.1111/1540-5885.1850285]
REPENNING, N. P., & Sterman, J. D. (2002). Capability traps and self-confirming attribution errors in the dynamics of process improvement. Administrative Science Quarterly, 47(2), 265–295. [doi:10.2307/3094806]
RUDOLPH, J. W., & Repenning, N. P. (2002). Disaster dynamics Understanding the role of quantity in organizational collapse. Administrative Science Quarterly, 47(1), 1–30. [doi:10.2307/3094889]
SCHAUFELI, W. B., & Taris, T. W. (2014). A critical review of the job demands resources model implications for improving work and health. In G. F. Bauer & O. Hämmig (Eds.), Bridging Occupational Organizational and Public Health (pp. 43–68). Berlin Heidelberg: Springer. [doi:10.1007/978-94-007-5640-3_4]
SCHELLING, T. C. (1971). Dynamic models of segregation. Journal of Mathematical Sociology, 1(2), 143–186.
SECCHI, D., & Seri, R. (2017). Controlling for false negatives in agent-based models: A review of power analysis in organizational research. Computational and Mathematical Organization Theory, 23(1), 94–121. [doi:10.1007/s10588-016-9218-0]
SKARLICKI, D. P., & Folger, R. (1997). Retaliation in the workplace The roles of distributive procedural and interactional justice. Journal of Applied Psychology, 82(3), 434–443. [doi:10.1037/0021-9010.82.3.434]
STERMAN, J. D. (1989). Modeling managerial behavior: Misperceptions of feedback in a dynamic decision making experiment. Management Science, 35(3), 321–339. [doi:10.1287/mnsc.35.3.321]
SYDOW, J., Schreyögg, G., & Koch, J. (2009). Organizational path dependence: Opening the black box. Academy of Management Review, 34(4), 689–709. [doi:10.5465/amr.2009.44885978]
VAN Dyck, C., Frese, M., Baer, M., & Sonnentag, S. (2005). Organizational error management culture and its impact on performance a two study replication. Journal of Applied Psychology, 90(6), 1228–1240. [doi:10.1037/0021-9010.90.6.1228]
WALL, F. (2016). Agent-based modeling in managerial science: An illustrative survey and study. Review of Managerial Science, 10(1), 135–193. [doi:10.1007/s11846-014-0139-3]
WATTS, D. J. (2002). A simple model of global cascades on random networks. Proceedings of the National Academy of Sciences, 99(9), 5766–5771. [doi:10.1073/pnas.082090499]
WHITE, J. W., Rassweiler, A., Samhouri, J. F., Stier, A. C., & WHITE, C. (2014). Ecologists should not use statistical significance tests to interpret simulation model results. Oikos, 123(4), 385–388. [doi:10.1111/j.1600-0706.2013.01073.x]
WU, J., Ohya, T., & Sekiguchi, T. (2024). Applications of agent-based modeling and simulation in organization management: A quarter-century review through bibliometric mapping (1998-2022). Computational and Mathematical Organization Theory, 30(1), 1–31. [doi:10.1007/s10588-023-09381-8]
YAQOOB, S., Shahzad, K., Faisal, M., Kitchlew, N., & Abualigah, A. (2026). Why, how, and when incivility unfolds in the workplace: A 24-year systematic literature review. Management Review Quarterly, 76, 2121–2177. [doi:10.1007/s11301-025-00525-5]