© Copyright JASSS

JASSS logo ----

Oswaldo Terán, Johanna Alvarez, Magdiel Ablan and Manuel Jaimes (2007)

Characterising Emergence of Landowners in a Forest Reserve

Journal of Artificial Societies and Social Simulation vol. 10, no. 3 6
<https://www.jasss.org/10/3/6.html>

For information about citing this article, click here

Received: 15-Nov-2006    Accepted: 29-Mar-2007    Published: 30-Jun-2007

PDF version


* Abstract

This paper intends to characterise the land holding distributions in a Multi-Agent Based Simulation (MABS) model inspired by the Caparo Forest Reserve, in Venezuela. This forest has been highly intervened with and seriously altered by opportunistic, nomadic, land-seeking colonists. The distribution of land holding results from a process of land encroachment, allowed by a weak state showing ambiguous behaviour and regulations, permitting the rise of a land market in the forest area. A thorough understanding of this process is achieved by, first, modelling and simulating individual landowner's decision-making regarding land occupation, and secondly, characterising the collective land occupation process in the simulation model. The size distribution of land holding appears to be exponential rather than power law, as was initially expected. The paper not only explores whether leptokurtic distributions emerge in this complex social environment but also tries to identify the specific mechanisms and model assumptions that lead to these sorts of distributions, instead of alternative ones. Additionally, this paper relates these mechanisms to market structures and interactions, in order to give the results a richer real-world interpretation.

Keywords:
Land-Use Modelling, Leptokurtic Distributions, Forest Reserves, MABS Applications

* Introduction

1.1
This paper explores the distribution of land holding resulting from a process of land encroachment, land market and government regulation in a simulation model. The model is inspired by an empirical system: the land occupation process at the Caparo Forest Reserve (CFR), in western Venezuela. Such a process represents a serious problem in Latin American countries as the forest reserves are becoming seriously reduced and some have even disappeared. In Forest Reserves, individual land holding is a relatively recent phenomenon. In fact, the notion of property rights is a concept introduced recently by western culture — indigenous people traditionally occupying these areas, now displaced by land-seekers, manage a concept of temporary and collective land holding.

1.2
Many factors have contributed to deforestation in the CFR. Most studies point out that the intervention and modification by opportunistic, mainly nomadic, land-seeking colonists[1] is the primary cause of this decrease. It has been through this colonisation process that the forest, which is supposed to be preserved because of its exceptional ecological value, has become a territory of landowners. The presence of a weak state in the area has allowed this process, which has turned into a land market.

1.3
The forests of the CFR are in the transition between dry tropical forest and humid tropical forest. Declared as a forest reserve in 1961, the original purpose of the CFR was to support the development of the logging industry in the area, while preserving one of the most important Venezuelan forests (Cesimo 1998). It is located to the southeast of the State of Barinas, in the Western Plains of Venezuela. From its early extension of 176,434 hectares, only 7,000 hectares of forest remain. Though the CFR has been strongly reduced, this study is pertinent as similar occupation processes are happening in other forest reserves in Venezuela.

The Problems: land holding distributions and the land occupation process

1.4
This paper addresses two problems: first, how to characterise land holding distributions; and, second, how to better explain the occupation process in Venezuelan forest reserves. Below, the issues around both problems are described.

1.5
The size distribution of land holding has been studied by Gotts and Parker (2004a, 2004b), amongst others. They examine the size distribution of land holding in systems where the process has been occurring for thousands of years. They have found the size distribution of Scottish land holdings to be intermediate between exponential and power law. The main goal of this paper is to contribute to this line of research. In contrast to the long time period of the process studied by Gotts and Parker, this paper investigates a more recent process, which has occurred in the last 50-60 years. Moss et al. have found similar processes in markets. Their models have shown that the size of market shares in free markets has a power law distribution — similar to their finding in data from real markets in the UK and US. Land markets and land holding size have also been studied in the context of models of land use change (Polhill et al. 2005 ) and agent based models applied to agriculture (Happe et al. 2006; Berger 2001)

1.6
For the second problem, there is a need for understanding better the problem of land occupation in Venezuelan forests. The agrarian settlement process of the Venezuelan forest reserves has been described by Rojas (1993). It consists of three stages. During the first stage, also called the primary cycle, a colonist takes possession of a parcel of land in the reserve and practices subsistence agriculture (i.e., he slashes and burns). This surface can be uncultivated land (previously deforested but currently unoccupied) or forested land (deforested by the colonists). Typically, the soils are exhausted within five years, and the harvests are no longer sufficient to sustain the colonist and his family. Some colonists try to expand their farms causing new deforestation. However, sooner or later, they end up facing the same situation.

1.7
The ''Second Stage'' or ''Land Market Cycle'' consists of pasture seeding to avoid soil exhaustion. Later these improvements are sold to landlords or to other colonists. After selling these "improved" lands, colonists may have some options: buy new lands from other more recent colonists, return to initiate a new primary cycle of invasions, or work for the landowner that has acquired the land. This second stage has three processes: (1) pasture retailers and landowners acquire the improvements of primary colonists; (2) cattle ranching dominates the land use; (3) the property of the parcels is transferred to the colonists, by the application of the Agrarian Reform Act, and then parcels are sold at very low prices to the landowners, politicians, military officers and cattle dealers who urge and support the original settlements (Centeno 1997) [2].

1.8
Finally, as non-occupied land in the forest become exhausted, some colonists move to other Venezuelan reserves, where this process is repeated.

Previous Work and Orientation of the Model

1.9
Though the main goal of the paper is to characterize the land holding distribution of forest reserves, it is important to give some background about the previous work addressing the dynamics at the CFR.

1.10
Conceptual models of the land occupation process have been proposed by Rojas (1993) and Sánchez (1989). Sánchez elaborated a sociological oriented work characterising the social and natural dynamics of the reserve. This work identifies the main actors, as well as their activities, decisions, and the factors driving these decisions. It also explains the dynamics of land change once this has been altered by the activity of colonists. Two computational models have been derived based on these. The first one is a system dynamics model used as a tool for environmental education (Cesimo 1998). The second one links the primary stage of the land occupation with a cellular automata model describing the dynamics of the vegetation (Moreno et al. 2007).

1.11
The model presented in this paper shows a more social and policy-making perspective, as an alternative to the previous efforts. It follows the social simulation viewpoint initiated by Simon (1946, 1984), Newell (1990), Cyert and March (1992) and, most recently, the works of Moss and Edmonds (Moss et al. 2000; Moss 1995), and Cohen (1985). Preliminary results have already been presented (Jaimes 2004; Alvarez 2005; Terán et al. 2005).

1.12
In the model, the dynamics are simulated around the colonists' decision-making process, by using a Multi-Agent System. Colonists interact in a landscape, represented as cellular automata, which resembles a forest reserve. A cell representing a piece of land can be in any of the following states: forest (if it has not been occupied yet), agriculture (if it has been occupied and still is good enough for agriculture), cattle (in case, the land is occupied and has lost part of its fertility, been unable for agriculture, but been still good for pasture). Apart from colonists, two other important actors in the reserve are simulated: a government representative, who suggests to the colonists not to occupy the forest, and a sort of colonists' union supported by political parties, which promotes invasions. In the present model, these two actors are represented in a simplified manner. Although they are called actors or agents, in fact they are not: they do not have a decision-making mechanism. They will be represented more realistically in future models. A colonist can imitate a neighbour colonist, follow self-reasoning and experience, hear the union's suggestion, or follow the government's recommendation.

1.13
The paper is organised as follows. In section 2, the notions of social behaviour, social learning and decision making, as understood in this paper, are presented. Then, section 3 offers an overall description of the simulation model, including a meta-algorithm. In section 4, the experiments and results are presented. In section 5, results are discussed. Finally, section 6 draws some conclusions and suggests directions for further work.

* Social Behaviour, Social Learning and Decision Making

2.1
The object of this section is to discuss how the assumptions in the modelling of social behaviour, social learning and decision-making at the forest reserve are made in this paper, following the social simulation perspective. The decision-making process is implemented around two key concepts: imitation and negotiation.

Imitation

2.2
Imitation and social learning are the main elements of social behaviour driving the occupation process at the CFR: an individual may go to the CFR if he/she perceives that people already settled into the reserve are successful in accumulating land and in getting a "better way of life". Clearly, imitation is a driving factor for this predisposition. Imitation is represented in the MABS model following the social simulation perspective, especially Moss et al.'s (1998, 2000, 2001) and Conte et al's ideas (2001).

2.3
Behaviour related with the occupation process at the CFR is strongly based upon imitation and social learning. The driving force of this process comes from the individual's perception that other individuals have succeeded in obtaining a better way of life through occupying land at the CFR. Such a perception motivates the occupation process: firstly, individuals move to the reserve from foreign areas (here is a first goal: moving to the reserve); secondly, individuals already settled in the CFR continuously occupy land (this is a second goal: to occupy land); and thirdly, individuals sell or cultivate land (this is a third goal, associated to the second one). Notice that these goals are relative to that perception. A more detailed description of how to model this process is shown in Terán et al. (2005).

Negotiation

2.4
Negotiation is the other important social activity observed at the CFR and modelled in this paper to represent social behaviour, social learning, and decision-making. Below, the notion and mechanisms of negotiation are described.

2.5
In this paper, the negotiation process is mainly based on empirically-observed interaction at CFR (Sánchez 1989), and structured on Edmonds and Hales (2004) conceptual framework.

2.6
Edmonds and Hales (2004) suggest understanding negotiation as something more than pure haggling about numerical attributes. They define negotiation as "a problem-solving enterprise in which negotiators use mental models to guide them towards a solution". Mental models are considered as the means of representing causal representations from their environment in order to understand the environment and solve problems. Negotiation is understood as the search for a solution mutually accepted by the involved agents, based on communication, and involving the agent's satisfaction, which in turn results from the agent's beliefs. Such a communication not only entails an exchange of actions but also an exchange of beliefs and goals.

2.7
Moss's, Edmond's and Hales' suggestions are followed in this paper. Negotiation occurs as colonists sell and buy land. As stated above, the negotiation mechanism is elaborated following the empirical system. It is limited to the exchange of actions, though this does not mean it contradicts Edmonds and Hales' conceptual framework. For illustrative purposes, we describe a bid for land: a colonist C1 would make a bid to a colonist C2 if: a) C1 thinks occupying land will bring benefits, b) C1's size of land holding is larger than C2's size of land holding. Part a) is modelled by using endorsements and represents a goal already present when a colonist imitates, and, part b) is introduced as part of the verification a colonist must carry out before buying or selling land (these facts are brought into the model from observing the empirical system). One of the conditions is that a colonist will always prefers to sell land to the buyer with the largest size of land holding.

* The MABS Model

Overall Description of the Model

3.1
The model consists of a Multi-Agent system built in SDML (a Strictly Declarative Modelling Language,Moss et al. 1998). The most external agent is universe, an instance of the type universalAgent, which is a built-in type of agent. The structure of the model is shown in Figure 1. The instance universe creates (and contains) the agent Model, which in turn contains the agents Motivator, Controller, the grid and the colonists. The grid keeps a record of the occupied cell vs. occupying colonist relation.

3.2
The simulation dynamics are generated around the colonists' decision-making process, by using a Multi-Agent System. Colonists interact in a landscape, represented as a cellular automata (a grid), which resembles the forest reserve (see Figure 1). Apart from colonists, two other important actors in the reserve are simulated: a government representative (Controller), which suggests to the colonists not to occupy the forest; and, a sort of colonist's union (Motivator) supported by political parties, which promotes land occupation. In the present model, these two actors are represented in a simplified manner. Neither the controller nor the motivator possess a cognitive mechanism, they only give suggestions, which remain unchanged over time: toOccupy land or notToOccupy land, respectively. The colonists' union represents the actions of the colonists as a group to the official and political parties' representatives, in order to decrease conflict with and, if possible, to find some support from these actors. It is not always clearly identifiable in reality. Another important event occurring at the CFR and included in the model is the removal of colonists from the forest reserve. This action is carried out in reality by the government, and in the simulation is implemented by the agent model (see Figure 1). Removing colonists from the CFR is biased, as the government usually removes colonists with low "power" (those with a small size of land holding).

3.3
Next, we describe how imitation and the main colonists' choice, i.e., to occupy the land or not, are implemented. For this choice, a colonist may imitate a neighbour colonist (in the landscape), follow self-reasoning and experience, comply with the union's suggestion, or follow the recommendation of the government. The decision is endorsed with a label, allowing the colonist to learn from his experience. By using endorsements, a colonist gives an order of preference (a different weight) to these sources. For instance, some "imitating"-colonists would prefer those actions whose source was coming from a neighbour. Three types of colonists are defined, according to their preferences: imitating colonists, controller-follower colonists, and motivator-follower colonists.

Figure
Figure 1. Scheme of the Model (Agents and Landscape (grid))

3.4
A colonist decides whether or not to occupy land, which is a two-step process. We see below and example for an imitating agent, which has the following weight scheme:
[[imitateNeighbour 4] [selfReasoning 3] [followController 2] [followMotivator 1]],

3.5
First step: the agent chooses randomly a procedure to be followed in the second step. The alternatives are a) imitating a neighbour, b) self-reasoning, c) listening to the controller, or d) listening to the motivator. The likelihood of imitating a neighbour is:
(weight for imitating a neighbour)/(total sum of the weights) = 4/(4+3+2+1).
The probabilities for the other alternatives are calculated in the same manner.

3.6
Second step: Depending on the result of this first selection, the colonist follows a different procedure for his second choice, whether or not to occupy land. For each case, we have:
  1. If the choice in the first step resulted in: a) imitating a neighbour, the colonist randomly selects a neighbour (in a region of the landscape defined by the user) and chooses as his action the action of the chosen colonist during the previous time step.
  2. If the choice in the first step resulted in either: c) listening to the controller or d) listening to the motivator, the colonist makes the choice according to the controller's or motivator's suggestion, respectively.
  3. If the choice in the first step resulted in: b) self-reasoning, the colonist uses the endorsement mechanism. This is a more elaborate procedure, implemented as follows:
    An agent classifies his actions depending on his preferences, as given by the endorsement scheme (see above). This classification is a numerical value (a weight) which is used to know how good that choice of action has been in the past. The endorsement concept is explained by Moss (1995) and Cohen (1985). This concept defines the following formula to calculate the weight:
    E(b, VectorLabels) = ∑val(labeli) ≥ 0 bval(labeli) - ∑ val(labeli) < 0 b|val(labeli)| (1)
    where:
    b
    is the chosen basis,
    vectorLabels
    is the vector of accumulated (endorsed) attributes for the action, i.e., vectorLabels might be in a certain simulation time step: (imitateNeighbour, followMotivator), and
    val
    is a function giving the value of that accumulated attribute.
    For instance, if an imitating agent has taken the decision toOccupy land twice in the past, once by imitating a neighbour, and another time by self-reasoning, then the vector of labels for this action would be:
    vectorLabels = (imitateNeighbour, selfReasoning);
    and, the values of these labels are:
    val(imitateNeighbour) = 4, val(selfReasoning) = 3.

    Thus, choosing 1.2 as the base, the endorsement for this action would be:
    E(1.2, (imitateNeighbour, selfReasoning)) = 1.24 + 1.23 = 3.8016
    Similarly, the other option: notToOccupy land would be evaluated. Then the choice is made, in accordance with the resulting endorsement values. In the present model, the option with the highest endorsement value is chosen by the agent. After each choice, the colonist adds a new label to the option taken; i.e., if the agent chooses toOccupy land through self-reasoning, then it adds the label selfReasoning to the option toOcuppy land.

First Set of Experiments

3.7
The main question driving our research is to investigate the distribution of the land holding size in the forest reserve. For this purpose, several scenario analyses were designed for a first set of experiments. Further scenarios would be devised later as the results brought in by the initial set of scenarios set up new questions, and are described later in the paper. Rather than doing a full sensitivity analysis, we have chosen to concentrate in few parameters that represent key guesses and assumptions about the true nature of the system that the model tries to capture.

3.8
In the first set of experiments, two key factors are varied: the proportion of colonists of each type, and the percentage of colonists removed from each iteration cycle. This allows an investigation into the effect of colonists' preferences in the dynamics of the simulation, and particularly the variation of the total size of occupied land and the distribution size of land holding.

3.9
The other choices a colonist has are associated to land negotiation. Negotiation appears as a necessity when free or non-occupied land becomes scarce. In the model, a colonist can only occupy land accessible directly from the land he already holds. First, acting as a buyer, a colonist chooses whether to make a bid for land or not. A colonist C1 will make a bid for a piece of land (here represented as a cell), to a colonist C2 if: 1) C1 decides to occupy land when no free land is available, 2) C1 selects C2 randomly from amongst those neighbour colonists holding land that is directly accessible from one of the cells occupied by C1 and whose size of land holding is smaller than C1's. Second, a colonist acting as a seller will accept the bid, from amongst all the bidding colonists, of the colonist who has the largest size of land holding. When buying, a colonist prefers land that has not been occupied for more than five years, since land cultivated for more than five years can be used only for growing cattle, as it loses fertility while cultivated.

Meta-Algorithm

3.10
This sub-section aims to better explain the simulation mechanism by using a pseudo-algorithm (the original SDML code is available from the authors):

1. Set up the simulation parameters (e.g., variables and instances of agents)

1.1 Model initialises the overall simulation model, the parameters and variables, e.g., initial number of colonists of each type; agent grid; agent colons; agent motivator; and agent controller. It also asks the user for parameters such as: size of a colonist's neighbourhood, percentage of colonists removed from the reserve each iteration time (year), total number of colonists at the beginning of the simulation, percentage of colonists of each type to set up initially, number of "new" colonists coming into the reserve each iteration time, number of simulation time steps (n) (years), etc. Colonists are located randomly in the grid (several runs were carried out for each parameter settings, showing consistent outputs). 1.2 Colonist sets up his endorsement scheme, according to his type. 1.3 Controller defines its policy (it always suggests not to occupy land).

1.4 Motivator defines its policy (it always suggests to occupy land). 1.5 Grid defines parameters for graphical output (e.g., size of each cell at the graphical output).

2. For year i (i = 1,2...n)

2.1 Model

2.1.1 It changes the status of land (after five years of occupation a piece of land (a cell) changes its status from "Agriculture" to "Cattle rising", indicating the loss of fertility over time).

2.1.2 If several colonists intend to occupy the same cell, Model selects randomly the colonist that finally will occupy such a cell.

2.1.3 New colonists are introduced into the reserve (according to the parameter given by the user).

2.1.4 A percentage of colonists are removed from the reserve. Colonists to be removed are chosen from those with low size of land holding — this resembles a bias observed in real life.

2.2 Colonist i (i = 1,2, ... , k)

2.2.1 Creates: a) a list of neighbour colonists, who are candidate to be imitated; and b) a list of non-occupied cells that are candidate to be taken over.

2.2.2 Selects a way for deciding about occupying land in accordance to his preferences (e.g., either imitating a neighbour, self-reasoning, listening to the controller, or listening to the motivator). In case of choosing self-reasoning, the colonist will make a choice in 2.2.3 using the endorsements scheme. In the other case, he will make a choice (in 2.2.3) following the suggestion of either a neighbour, the controller, or the motivator.

2.2.3. Using the selected way for deciding in 2.2.2., it chooses between the actions of "to occupy" or "not to occupy" land. If it chooses "to occupy" land, then it randomly selects one cell available from the region of land it holds, if there is a non-occupied available cell. If a cell has been chosen, the colonist sets a clause in Model indicating it intends to occupy such a cell — this is so because, in where case of more than one colonist intends to occupy the same cell, Model will randomly settle whoever takes over the cell. After choosing, the selected action (either toOccupy or notToOccupy) is endorsed with a label following the selected way for deciding (imitating a neighbour, self-reasoning, etc.) in 2.2.2. This label will determine a weight for the decision following the colonist's preference.

2.2.4 In the case the colonist decides to occupy land without available free land, it makes a bid to a neighbour directly accessible from the continuous region of land it holds, with a size of land holding smaller than its own, if any. The colonist prefers cells occupied for less than five years (or in the state "Agriculture").

2.2.5 If the colonist has land biddings, then it chooses to sell to that buyer with the largest size of land holding[3]. 2.2.6 If the colonist's size of land holding is zero, the colonist leaves the reserve in the case in which he has decided not to occupy land (see 2.2.3); otherwise, he will continue in the forest reserve trying to occupy the land next iteration time (year).

2.3 Controller

2.3.1 No action is performed (he keeps his suggestion continuously: notToOccupy land). One of his actions, to remove colonists, has been efficiently implemented in agent Model

2.4 Motivator

2.4.1 No action is performed (he keeps his suggestion continuously: toOccupy land)

2.5. Grid

2.5.1 Updates occupied points (i.e., relation: (cell point, occupying colonist))

2.5.2 Pictures the grid on the monitor (by sending a graphical output).

* Simulation Results

4.1
Two sets of experiments were performed. In the first, the dynamics of the model as described above were explored. The idea was to characterise the emergence of landowners. The simulation resulted in an exponential distribution of the size of land holding.

4.2
The second experiment was aimed at exploring the dynamics of the simulation model beyond the configuration resembling the real system, in order to understand better the key factors from which the exponential tendency appears. This second set of experiments allowed a better understanding of what was observed in the first set of experiments, and a comparison of the simulation results with other studies (see section 5).

First Set of Experiments

4.3
The first set of experiments (see Table 1) consisted in analysing the evolution of the observed tendency over time for years 15, 30 and 50 (the simulation time steps) and for various configurations of the following two factors:
  1. Percentage of colonists removed by controller each year from the reserve. This factor takes three levels: 0.01, 0.02, and 0.03.
  2. Percentage of individuals biased towards following other colonists, the controller or the motivator. Three levels are considered for this factor, see Table 1.

Table 1: Simulation scenarios. Scenario 1 has two sub-scenarios: scenario 1(15) and scenario 1(30) representing scenario 1 observed at years 15 and 30, respectively.

Variable

Scenario

% colonists type 1% colonists type 2% colonists type 3% colonists removed / yearYear
1(15)0.50.50.30.0215
1(30)0.50.20.30.0230
10.50.50.30.0250
20.50.20.30.0150
10.50.20.30.0250
30.50.20.30.0250
40.80.10.10.0250
50.10.80.10.0250
60.10.10.80.0250

4.4
Fixed parameters during the experiments include: size of the landscape: 40×40, initial number of colonists: 20, number of new colonists coming into the landscape each year: 2, colonist's visibility (cells around any occupied cell): 4, maximum simulation time (years): 50.

4.5
For all scenarios, the rank distribution of the size of land holding (SHL) was analysed. These kinds of variables (i.e., size of land holding, size of market shares) have shown leptokurtic distribution, and, particularly, exponential and power law distributions have been observed in similar studies. For instance, Gotts and Parker (2004a, 2004b) have found the size distribution of Scottish land holdings to be intermediate between exponential and power law. They have also modelled this process in the FEARLUS agent based modelling system, where the process has given distributions "intermediate between power-law and exponential" (idem, pp. 11). On the other hand, Moss et al. (2000) have been able to reproduce in the simulation model that the size of markets shares in free markets has a power law distribution, based on findings from real markets in the UK and US.

4.6
Because of all this, this paper deals with examining the exponential and the power law distributions for the rank of the size of land holding (SHL) in the simulation model. That is to say, if one of the following relations follows from the simulation output:

(exponential:) Rank(SHL) = (Constant1) e-SHL (2)

(power-law:) Rank(SHL)= (Constant2) * SHL (3)

Taking the natural logarithm (Ln) at both sides of 1) and 2), we have the following linear relations:

(exponential:) Ln(Rank(SHL)) = - SHL + Constant3 (4)

(power-law:) Ln(Rank(SHL)) = -τ* Ln(SHL) + Constant4 (5)

These relations are analysed, for all simulation scenarios, by using regression analysis discussed in the following subsections. Although for each scenario several runs were performed, with consistent results, only one of them is shown below.

Scenarios 1, 1(15) and 1(30): Evolution of the tendency (contrasted by (3) and (4)) over time.

4.7
Figure 2 and Figure 3 show results for scenario 1, at simulation time instants (years) 15, 30 and 50. The former illustrates the statistics resulting from the regression analysis, and the latter shows the graphs contrasting the regression line against the simulated data (coming from the simulation model output). Both cases, given by equations (4) and (5), are analysed; i.e., regression of Ln(size rank) against holding land size on the one hand (this will be called the exponential-analysis), and regression of Ln(size rank) against Ln(holding land size) on the other hand (this will be called the power-law-analysis). Each pair of figures in the next sub-sections (Figures 5 and Figure 6, and so on) will show similar results for the corresponding scenario analysis.

Scenario 1(15), exponential-analysis
Multiple R-Squared: 0.9237,
p-value: < 2.2e-16
Slope: -0.12647
Scenario 1(15), power-law-analysis
Multiple R-Squared: 0.6913
p-value: 1.018e-10
Slope: -0.68672
Scenario 1(30), exponential-analysis
Multiple R-Squared: 0.937
p-value: < 2.2e-16
Slope: -0.055878
Scenario 1(30), power-law-analysis
Multiple R-Squared: 0.7191
p-value: 2.154e-15
Slope: -0.57752
Scenario 1(50), exponential-analysis
Multiple R-Squared: 0.9473
p-value: < 2.2e-16
Slope: -0.03386
Scenario 1(50), power-law-analysis
Multiple R-Squared: 0.683
p-value: 4.261e-16
Slope: -0.50766

Figure 2. Statistics from the regression analysis for scenario 1 at different simulation times

Figure
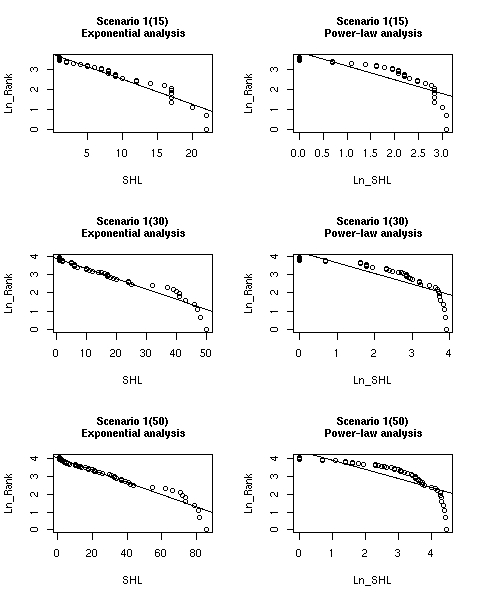
Figure 3. Regression lines vs. simulated data for scenario 1 at different times

4.8
According to the graphs, for the two estimated relations ((4) and (5)) the slope is smaller, in absolute value, as the simulation time advances. This happens because: 1) at the beginning of the simulation a high percentage of colonists own a small amount of land — there are many colonists whose size of land holding is the minimal one allowed: one piece of land; and 2) as time advances, the size of land holdings increases.

4.9
This is helped by the fact that first, colonists with a large size of land holding usually buy land from colonists with a small size of land holding; and, secondly, colonists with a small size of land holding are preferred (by the controller) to be removed from the reserve. As the simulation goes on, and non-occupied land becomes scarce, land negotiation becomes important for a colonist to increase the size of his land holding.

4.10
For the exponential analysis, the curves show a good adjustment, both R2, and adjusted R2 are above 0.92; and both values increase as the simulation time advances. This is not the case for the power-law-analysis, where values for these parameters are below 0.72, and decrease over time. Figure 3 shows graphically how the regression curve adjusts the data for the two analysed cases. Consequently, from the results, the size of land holding follows an exponential rather than a power law distribution at different stages (time steps 15, 30 and 50) of the simulation.

4.11
Finally, Figure 4 presents the landscape at simulation time 50. The blue colour indicates the original cell occupied by a colonist, just when he arrived in the reserve. The red colour represents additional cells occupied by a colonist. The yellow colour indicates free cells from which a colonist has been removed, and the grey colour is used to represent cells not taken by any colonist (i.e., forest). In the case where the simulation ran for a longer time, only those spaces from where colonists were removed would be unoccupied.

Figure
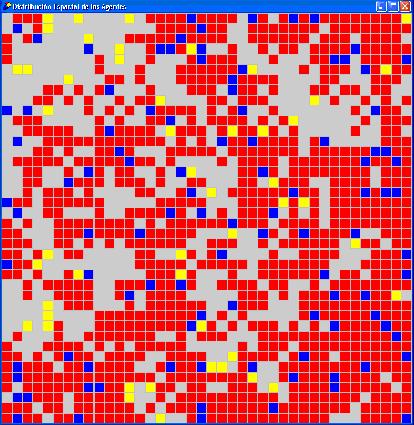
Figure 4. Example of the Landscape at time t = 50 years

Scenarios 1, 2 and 3: varying the percentage of colonists taken out from the reserve.

4.12
Here the exponential- and the power-law-analyses are carried out by varying the percentage of colonists taken out of the reserve. Three cases are analysed at simulation time step 50, setting said percentage at 1%, 2% and 3%. Simulation outputs are shown in figures 5 and 6.

Scenario 1, exponential-analysis
Multiple R-Squared: 0.9473
p-value: < 2.2e-16
Slope: -0.03386
Scenario 1, power-law-analysis
Multiple R-Squared: 0.683
p-value: 4.261e-16
Slope: -0.50766
Scenario 2, exponential-analysis
Multiple R-Squared: 0.9419
p-value: < 2.2e-16
Slope: -0.052885
Scenario 2, power-law-analysis
Multiple R-Squared: 0.7061
p-value: < 2.2e-16
Slope: -0.6191
Scenario 3, exponential-analysis
Multiple R-Squared: 0.9535
p-value: < 2.2e-16
Slope: -0.033557
Scenario 3, power-law-analysis
Multiple R-Squared: 0.6549
p-value: 3.862e-13
Slope: -0.48432

Figure 5. Statistics from the regression analysis for scenarios 1, 2, 3

Figure
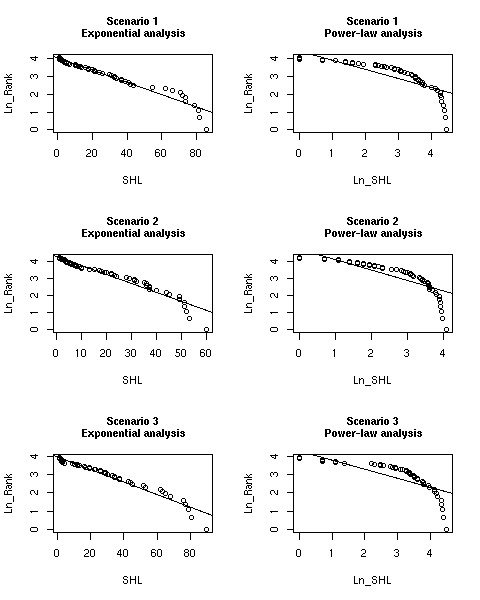
Figure 6. Regression lines vs. simulated data for scenarios 1, 2, 3

4.13
Figure 5 shows good adjustments for the exponential-analysis, with R-squared and adjusted R-squared above 0.94. This is not the case for the power-law-analysis. These results are confirmed by how well the simulation output adjusts to the line in the pictures shown on the left side of Figure 6. Although it is not a relevant result here, it seems that the quality of the adjustment slightly improves as the percentage of colonists removed from the reserve is increased. It also seems that increasing the percentage of colonists removed from the reserve favours colonists with a large size of land holding, who will obtain a larger size of land holding (this can be verified by looking at the horizontal edge at the pictures of Figure 6). A reason for this is the bias of the government in removing low power colonists (i.e., those with a small size of land holding).

4.14
The results from these regression experiments show again, that the size of land holding presents an exponential distribution.

Scenarios 4, 5 and 6: varying the imitation bias

4.15
The third experiment consists in varying the imitation bias. There was doubt about the implications of this factor. For instance, it was suspected that if a high proportion of agents preferred to listen to the motivator, then the tendency might change. Thus, the percentages of colonists tending to imitate neighbours, to listen to the controller or to listen to the motivator are varied as shown in Table 1.

4.16
As figures 7 and 8 show, results are consistent with the findings in the previous paragraphs: the size of land holding presents an exponential distribution — a result different to the initial suspicion. Notice that the quality of the adjustment improves when the percentage of agents biased towards imitating neighbours is increased to 80% (see top-left side in figures 7 and 8).

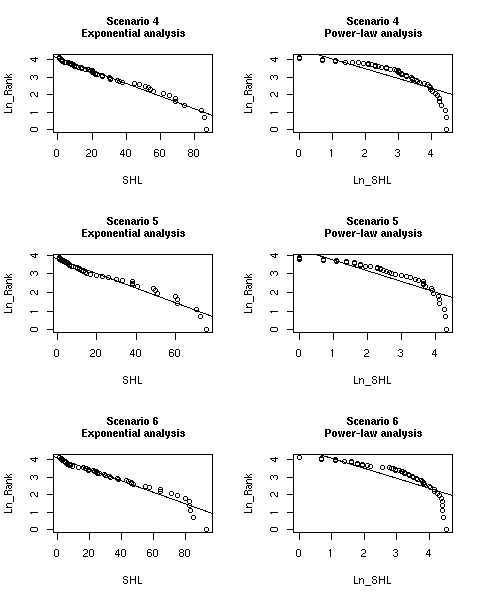
Scenario 4, exponential-analysis
Multiple R-Squared: 0.9709
p-value: < 2.2e-16
Slope: -0.0363740
Scenario 4, power-law-analysis
Multiple R-Squared: 0.72
p-value: < 2.2e-16
Slope: -0.55924
Scenario 5, exponential-analysis
Multiple R-Squared: 0.9578
p-value: < 2.2e-16
Slope: -0.038644
Scenario 5, power-law-analysis
Multiple R-Squared: 0.7604
p-value: 3.465e-16
Slope: -0.56933
Scenario 6, exponential-analysis
Multiple R-Squared: 0.9515
p-value: < 2.2e-16
Slope: -0.0324927
Scenario 6, power-law-analysis
Multiple R-Squared: 0.733
p-value: < 2.2e-16
Slope: -0.57004

Figure 7. Statistics from the regression analysis for scenarios 4, 5, and 6.

Figure
Figure 8. Regression lines vs. simulated data for scenarios 4, 5 and 6

Second Set of Experiments

4.17
The second set of experiments aim at investigating the source of the observed leptokurtic behaviour. It is important to make clear that these experiments do not resemble what happens in the real system. Rather, the motivation is academic and the results will bring light about what the key factors are in producing the tendency observed in the previous experiments: emergence of landowners whose size of land holding follows an exponential distribution.

4.18
It is suspected that this tendency is rooted in one or in several of the following factors:

4.19
In the first exploration, a trimmed down analysis of three situations was examined:

Table 2: Scenarios are based on scenario 1 as defined above. Factors f1-f3 are incrementally removed.

Variable

Scenario
Factors removed from the model% colonists
type 1
% colonists
type 2
% colonists
type 3
Year
1-NoF1f10,50,20,350
1-NoF1-2f1, f20,50,20,350
1-NoF1-2-3f1, f2, f30,50,20,350

4.20
In addition to the exponential- and the power-law-analysis, the existence of a linear relation between the rank and the size of land holding was analysed. This new analysis is called linear-analysis. Results are presented in Figure 9 and Figure 10. Columns 1 to 3 give the exponential-, power-law, and linear-analyses, respectively.

4.21
Results show that after eliminating f1 (first row in figures 9 and 10), or eliminating f1 and f2 (second row in figures 9 and 10), the distribution of the size of land holding remains exponential (note that only in the first case, after eliminating factor f1, the power law distribution is clearly better than the linear relation). Once factor 3 is removed, i.e., as soon as any colonist can bid for land, the leptokurtic behaviour disappears and a nearly linear relation appears between the rank and the size of land holding.

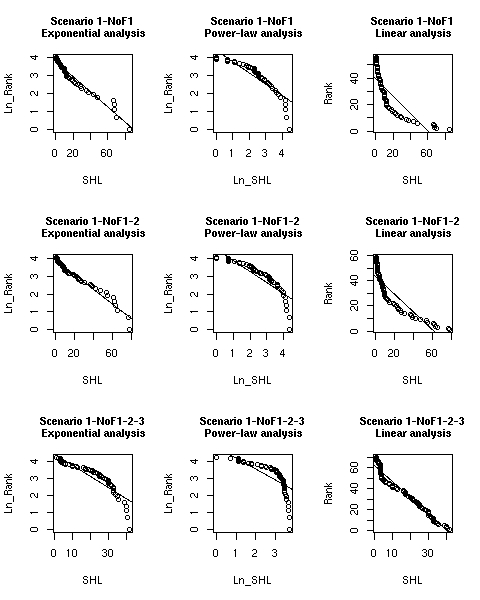
Scenario 1-NoF1, exponential-analysis
Multiple R-Squared: 0.9527 p-value: < 2.2e-16
Slope: -0.042346
Scenario 1-NoF1, power-law-analysis
Multiple R-Squared: 0.8239 p-value: < 2.2e-16
Slope: -0.63037
Scenario 1-NoF1, linear-analysis
Multiple R-Squared: 0.6862
p-value: 3.328e-15
Slope: -0.65379
Scenario 1-NoF1-2, exponential-analysis
Multiple R-Squared: 0.9649
p-value: < 2.2e-16
Slope: -0.040941
Scenario 1-NoF1-2, power-law-analysis
Multiple R-Squared: 0.7985
p-value: < 2.2e-16
Slope: -0.61396
Scenario 1-NoF1-2, linear-analysis
Multiple R-Squared: 0.7849
p-value: < 2.2e-16
Slope: -0.70489
Scenario 1-NoF1-2-3, exponential-analysis
Multiple R-Squared: 0.8466
p-value: < 2.2e-16
Slope: -0.063773
Scenario 1-NoF1-2-3, power-law-analysis
Multiple R-Squared: 0.6193
p-value: 6.659e-16
Slope: -0.63247
Scenario 1-NoF1-2-3, linear-analysis
Multiple R-Squared: 0.9676
p-value: < 2.2e-16
Slope: -1.52501

Figure 9. Statistics from the regression analysis for scenarios 1-NoF1-2-3, 1-NoF1-2, 1-NoF1

Figure
Figure 10. Regression lines vs. simulated data for scenarios 1-NoF, 1-NoF1-2, 11-NoF1-2-3

4.22
From these results, it was inferred that the leptokurtic behaviour was sourced in a single factor. Thus, a second exploration was carried out, where this time the factors were added, one at a time, to the model NoF1-2-3 above. Three scenarios were analysed: a) 1-NoF1-2 (that is, scenario 1 keeping the unique factor f3), b) 1-NoF1-3 (scenario 1 keeping the single factor f2), c) 1-NoF2-3 (scenario 1 keeping the unique factor f1). The first case (1-NoF1-2) was already examined above in Figure 10, and the exponential tendency appeared. Results for the other two scenarios ((b) and c)) are presented in Figure 11.

Scenario 1-NoF1-3, exponential-analysis
Multiple R-Squared: 0.9477
p-value: < 2.2e-16
Scenario 1-NoF1-3, power-law-analysis
Multiple R-Squared: 0.7048
p-value: < 2.2e-16
Scenario 1-NoF1-3, linear-analysis
Multiple R-Squared: 0.9092
p-value: < 2.2e-16
Scenario 1-NoF2-3, exponential-analysis
Multiple R-Squared: 0.7145
p-value: < 2.2e-16
Scenario 1-NoF2-3, power-law-analysis
Multiple R-Squared: 0.4383
p-value: 3.239e-10
Scenario 1-NoF2-3, linear-analysis
Multiple R-Squared: 0.973
p-value: < 2.2e-16

Figure 11. Statistics from the regression analysis for scenarios 1-NoF1-3, 1-NoF2-3.

4.23
Figure 11 shows that, like factor f3, factor f2 (see scenario 1-No1-3) brings in the exponential tendency. Looking at the Multiple R-Squared values, for the particular analysed runs, f3 creates a higher bias than f2. However, factor f1 (see scenario 1-No2-3) does not cause such tendency. From all this, leptokutic behaviour is sourced in either factor f2 or factor f3 but not in factor f1 in the simulation model presented in this paper.

On model validation

4.24
Data on size of land holding for the target system is available only for a given year and for a sector in the reserve and in a highly (and no uniform) aggregated form, see Table 3. This severely limits the type of model validation that can be done. With these constrains, the question posed was: Is it possible for the target system, as described in these tables, to generate a distribution of size of land holding that has the same pattern than those observed in the simulation? To answer this question, it is necessary to make some assumptions and fill in the values between categories in the table. In this case, a uniform distribution was assumed, following a common recommendation in simulation in case that only the minimum and maximum value of a set of values is known. On the data thus generated, an exponential and power law analysis was performed as before. Table 4 shows summary metrics for R-squared and p values obtained by repeating this procedure 5 times based on the available data. The results show that, in effect, the pattern observed does not contradict simulation results.

Table 3: Number of colonists within a given category of size of land holding. Source: Rojas, 1993

Land holding size (Ha)Number of colonists
< 5010
51 — 50062
501 — 9507
951 — 14002
1401 -18501
> 18501


Table 4: Summary of results of 5 runs of the validation procedure applied of real data. All the values are statistically highly significant (p < 0.001)

ExponentialPower law
minmaxminmax
R20.82060.95390.56150.7836
slope-2.66 x 10⁻³-2.06 x 10⁻³-0.56-0.77

* Discussion

5.1
The simulation model has given interesting hints to help better understand emergence of landowners in Venezuelan forest reserves, and in particular at the CFR. In some sense, the model represents markets, although they are land markets rather than traditional markets. Though the model has not been validated due to the lack of data about the real process, it has been inspired by the real system and the individuals' behaviour follows what has been observed in the real process (Sanchez, 1989). In addition, the model presents the following characteristics that implement some of the key suggestions from important lines of thought in the social simulation community, which correspond to a more realistic perspective than other models described in the literature:

5.2
The analysis performed showed that landowners emerge following a leptokutic (exponential) distribution. The model discussed in this paper complements and gives results consistent with those from Gotts and Parker (2004a, 2004b). This model presents a more recent process (from the last 50-60 years) as compared with that studied by Gotts and Parker's paper. However, the simulation findings are somewhat similar and consistent with the real processes they examine. In both cases, a distribution close to exponential appears.

5.3
Additionally, the present paper suggests a similar source of leptokurtic behaviour to that pointed out by Moss (2000). Self Organised Criticality properties are found by Moss (2000) in the market shares, for large-scale markets. Moss argues that this property seems to be particularly present in free markets. He suggests that small deviations from leptokurtic distributions seem to be due to certain biases, which prevent free competence between distributors. Free competence predisposes the dynamics in favour of those previously more favoured distributors.

5.4
The initial rules presented in the first set of experiments, which lead to leptokurtic distributions, result in an advantage to colonists who have a large amount of holding land size, both in acquiring land and in persisting in the simulation. In the real world, land is likely to go to the agent who has the highest bid for the land, and agents with the highest resources (land and other capital) are very likely to be able to offer a higher bid for land than agents with lower resources. In the initial rules, land holding size is correlated with agent resources. Thus, the initial rules likely represent a more accurate "free market" perspective, and the results are consistent with Moss'.

5.5
We have found that leptokurtic behaviour is sourced in any of these two factors: f2: a colonist sells a piece of land to that bidding colonist having the largest size of land holding; f3: a colonist can buy land only from colonists having a size of land holding smaller than he does. At the same time, it was found that a third factor f1 (colonists with small size of land holding are preferred to be removed from the reserve) does not introduce this bias (at least, in the proportion it was set at in the analysed scenarios). When the biases are removed, and free competence among colonists decreases, a greater equality in the distribution of the size of land holding arises. In this situation, the decrease of free competence cancels leptokurtic behaviour, a finding consistent to Moss' suggestion for free markets.

5.6
A more detailed scenario analysis would help in defining policies towards the reserve. For instance: a) the effect of removing colonists from the reserve, and penalising them; b) the effect of neutralising the motivator agent; c) the effect of penalising landowners whose size of land holding is larger than a certain threshold; d) the effect of penalising land negotiation.

* Conclusions and Further Work

6.1
This paper shows important results in respect to the distribution of land holding size, and to the rise of landowners in a forest reserve where a land market has been permitted by the regulations of a weak state. It also illustrates how these issues can be simulated and better understood using MABS and the modelling perspective of the social simulation community.

6.2
The model reveals that the size of land holding follows an exponential distribution. This helps in understanding better a critical social process in Latin America: occupation, alteration and even extinction of the forest reserves. This is a recent process, since indigenous people do not even have the cultural notion of individual property of land. The phenomenon appears as people of a western-culture (at least in the way that western culture has been implanted in Latin America[4]) come to the forest reserves pursuing better living conditions by exploiting the reserve, dealing and "marketing" with land. The model is inspired by the real system, and the results do not contradict the available real data.

6.3
The paper also illustrates how social behaviour, and especially social learning, can be modelled by using cognitive models to represent imitation and negotiation. This offers a different approach to those traditionally found in the literature. Other types of social influence will be examined in further work. In the future, we are aiming at adding to the social orientation of this paper a broader consideration of physical and ecological factors. In particular, other actors (e.g., companies and dealers arranging contracts for forest exploitation with the Venezuelan Government), and a more explicit and concrete representation of the landscape, will be included. It would also be interesting to see how, or if, the results change when factors more associated with land occupation and/or land conversion, for instance, biophysical suitability and proximity to communication networks, are added.

6.4
The model shows results consistent with those from Gotts and Parker (2004a, 2004b). In particular, they find out the size distribution of land holdings to be intermediate between exponential and power-law in a simulation model, and in a real system.

6.5
Additionally, the paper finds out that the key factor underlying leptokurtic behaviour is the bias introduced in the model by either of factors; a) a colonist sells a piece of land to that bidding colonist having the largest size of land holding; b): a colonist can buy land only from colonists having a smaller size of land holding than him. If the biases are removed, and free competence among colonists decreases, then more equality appears in the distribution of the size of land holding.

6.6
This finding is consistent with Moss' suggestion in a model of markets. Moss finds that deviations from leptokurtic behaviour in the size of market shares are sourced in certain biases preventing free competence. As stated in this paper, market free competence deviates the tendency away from leptokurtic behaviour, towards a linear relation between the rank and the size of land holding. Another result coherent with our results is that the Gini index, which measures the wealth (or poverty) distribution in a region, exhibits a power law distribution of the wealth (at least for the cases we know).

* Acknowledgements

We would like to thank the anonymous JASSS referees (especially referee 2) for useful advice in reviewing a previous version of this paper. We also are grateful to Melva Marquez and Christopher West in helping us review the English of this work.


* Notes

1 A colonist is a land-seeker individual, usually coming from the countryside, sometimes from cities, and scarcely, if any, from indigenous communities.

2 At the CFR this process is somewhat different at present, as the forest has been almost totally removed. However, this process is taking place in other Venezuelan forest reserves.

3 Prospective sellers only have a choice: to sell land. In the future, in more detailed experiments, a seller will be able to choose whether or not to sell land. In the present model there is not price manipulation - we might say that the buyer with the highest amount of land, among the buyers, makes the highest bidding.

4 Latin-American culture is obviously different from European (Western) culture, being a sort of "marginal-western" culture. This is a consequence, in part, of the fact that "modern progress" has been more a "tale" and an excuse for exploiting natural resources (and people), while the conditions for a real Modern Progress have historically been neglected.


* References

ALVAREZ J., 2005, Modelo Multiagente del Proceso de ocupación de la Reserva Forestal de Caparo, Undergraduate Thesis, Universidad de los Andes. Venezuela.

BERGER, T. 2001. Agent-based spatial models applied to agriculture: A simulation tool for technology diffusion, resource use changes, and policy analysis. Agricultural Economics 25 (2-3): 245-260

CENTENO J., C., 1997. Deforestation Out of Control in Venezuela. http://www.ciens.ula.ve/~jcenteno/DEFOR-EN.html (Spanish version available at:http://www.ciens.ula.ve/~jcenteno/DEFOR-ES.html)

CESIMO, Gaia, 1998, Caso Venezuela: Deforestación y Políticas de la Propiedad de la Tierra en la Reserva Forestal de Caparo (A Multi-Media Tool for Natural Resources Management and Environment Education). Centro de Simulación y Modelos de la Universidad de los Andes, Mérida, Venezuela. http://cesimo.ing.ula.ve/GAIA/CASES/VEN

COHEN P., 1985, Heuristic Reasoning: An Artificial Intelligence Approach, Pitman Advanced Publishing Program, Boston.

CONTE Rosaria, and Paolucci Mario (2001), Intelligent Social Learning, Journal of Artificial Societies and Social Simulation, 4(1)3, https://www.jasss.org/4/1/3.html (Spanish version available at: http://www.universidad-de-la-calle.com/Aprendizaje_social.html)

CYERT R., and March J., 1992 [1963], A behavioral Theory of the Firm, 2nd edition. Blackwell Publishers, Cambridge, MA.

EDMONDS B. and Hales D., 2004, When and Why Does Haggling Occur? -Some suggestions from a qualitative but computational simulation of negotiation, Journal of Artificial Societies and Social Simulation vol. 7, no. 2, https://www.jasss.org/7/2/9.html.

GOTTS Nicholas, and Dawn Parker, 2004a, Modelling Size Distributions of Rural Land Holding in Scotland, Proceeding of the Second International Conference of the European Social Simulation Association ESSA' 04 and Model to Model Workshop, September 16-19, Valladolid, Spain.

GOTTS Nicholas, and Dawn Parker, 2004b, Size Distributions of Land Holding in an Agent-Based Model of Rural Land Use, Proceedings of The Agent 2004 Conference on Social Dynamics, Reflexivity and Emergence, Oct. 7-9, Chicago, IL.,USA. http://agent2004.anl.gov/agenda2004.html.

HAPPE, K., K. Kellermann, and A. Balmann. 2006. Agent-based Analysis of Agricultural Policies: an Illustration of the Agricultural Policy Simulator AgriPoliS, its Adaptation and Behavior. Ecology and Society 11(1): 49. http://www.ecologyandsociety.org/vol11/iss1/art49

JAIMES M., 2004, Una representación del proceso de ocupación y uso de la tierra de la Reserva Forestal de Caparo, Undergraduate Thesis, Universidad de los Andes. Venezuela.

NEWELL A., 1990, Unified Theories of Cognition, Harvard University Press, Cambridge, MA, USA.

MORENO N., Quintero R., Ablan M., Barros R., Dávila J., Ramírez H., Tonella G. and Acevedo M. 2007. Biocomplexity of deforestation in the Caparo tropical forest reserve in Venezuela: An integrated multi-agent and cellular automata model. Environmental Modelling and Software, 22(5) pp. 664-673

MOSS S., 1995, Control Metaphors in the Modelling of Decision-Making Behaviour, Computational Economics, v.8, pp. 283-301

MOSS S, Gaylard H, Wallis S, and Edmonds B, 1998, SDML: A Multi-Agent Language for Organizational Modelling, Computational Mathematical Organization Theory, 4(1), pp. 43-69.

MOSS, S, Edmonds B, and Wallis S, 1997, Validation and Verification of Computational Models with Multiple Cognitive Agents, CPM-97-25 http://www.cpm.mmu.ac.uk/cpmrep25.html.

MOSS S., Edmonds B. and Wallis S., 2000, The Power Law and Critical Density in Large Multi-Agent Systems, CPM Report Number 00-71, Manchester Metropolitan University, UK http://www.cpm.mmu.ac.uk/cpmrep71.html.

MOSS S., 2001, Game Theory: Limitations and an Alternative, Centre for Policy Modelling Report No. 01-80 http://cfpm.org/cpmrep80.html.

POLHILL, J. G., D. C. Parker, and N. M. Gotts. 2005. Introducing Land Markets to an Agent Based Model of Land Use Change: A Design. Third ESSA Conference, Koblenz, Germany, September 5-9, 2005

ROJAS López, J., 1993. La colonización agraria de las Reservas Forestales: ¿un proceso sin solución? Universidad de los Andes, Instituto de Geografía, Mérida, Venezuela. Cuadernos Geográficos No. 10, Junio de 1993.

SÁNCHEZ M., 1989, Situación Actual del Proceso de Ocupación de la Reserva Forestal en Caparo, Universidad de los Andes, Instituto de Geografía y Conservación de Recursos Naturales, Mérida, Venezuela.

SIMON H., 1946, The Proverbs of Administration, Reproduced in Shafritz et al., 1997.

SIMON H., 1984, The Sciences of the Artificial, MIT Press, Cambridge, Mass., USA.

TERÁN O, Alvarez J., Jaimes M. and Ablan M., 2005, "Land Occupation and Land Use Change in a Forest Reserve: A MABS Approach", Proceeding of the CABM-HEMA-SMAGET Joint International Conference on Multi-Agent Modelling for Environment Management, Bourg Saint Maurice-Les Arcs, France, March 21-25.

----

ButtonReturn to Contents of this issue

© Copyright Journal of Artificial Societies and Social Simulation, [2007]