
Forecasting a Language Shift Based on Cellular Automata
Journal of Artificial Societies and Social Simulation
12 (3) 5
<https://www.jasss.org/12/3/5.html>
For information about citing this article, click here
Received: 04-Nov-2008 Accepted: 08-May-2009 Published: 30-Jun-2009

 Abstract
|
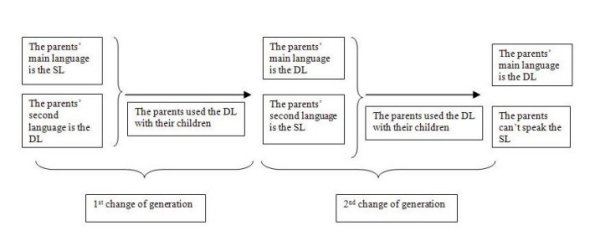
| Figure 1. The interruption of language transmission according to the Gaelic-Arvanitika model of language shifts. Given a dominant language (DL) and a subordinate language (SL) in a community, the non-transmitted language (SL) become extinct after two generations. |
| Table 1: The transition rule of the cellular automaton that simulates the language shift. The state of the cell at t changes at t +1 if the sum value of its neighbors surpasses the value of a threshold (Sa, Sb or Sc). Note that the transition from state 0 to state 2 is difficult to observe empirically, because it involves a non-subordinate-language speaker becoming a strong subordinate-language speaker. | ||||
| To state: | ||||
From state: | 0 | 1 | 2 | |
| 0 | ∑ ≤ Sb | ∑ > Sb | ---- | |
| 1 | ∑ < Sb | Sb ≤ ∑ ≤ Sc | ∑ > Sc | |
| 2 | ∑ ≤ Sa | Sa < ∑ < Sb | ∑ ≥ Sb | |
|
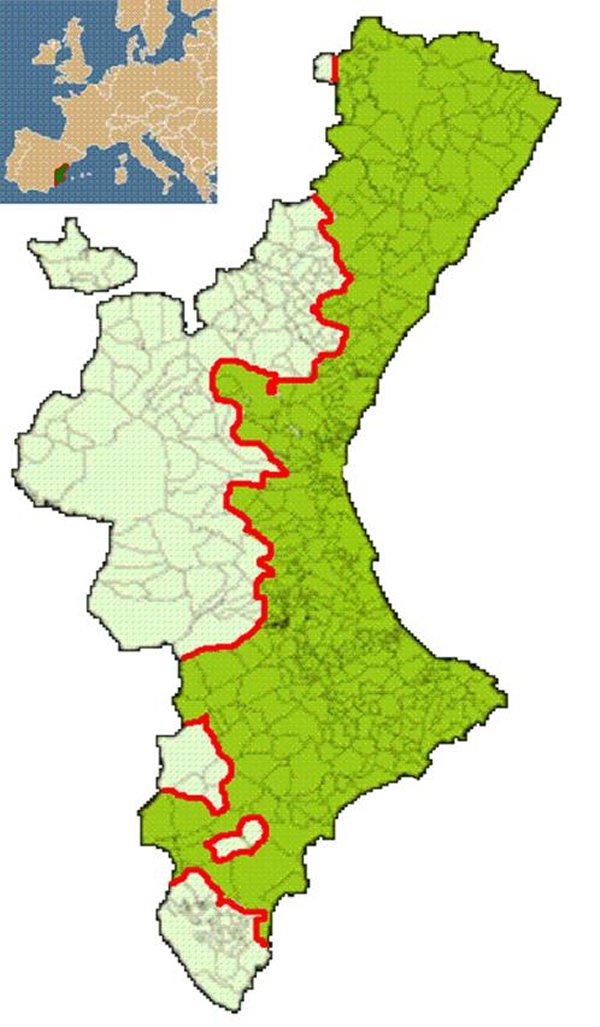
| Figure 2. Language map of Valencia introducing the two language areas: the Catalan area (dark green) and the Spanish area (light green). The map in the top-left corner shows the location of Valencia in Europe. |
|
|
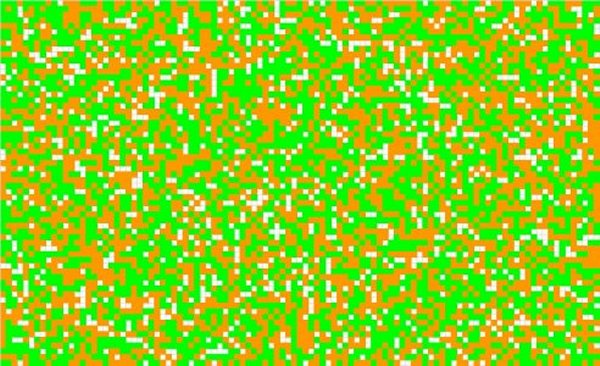
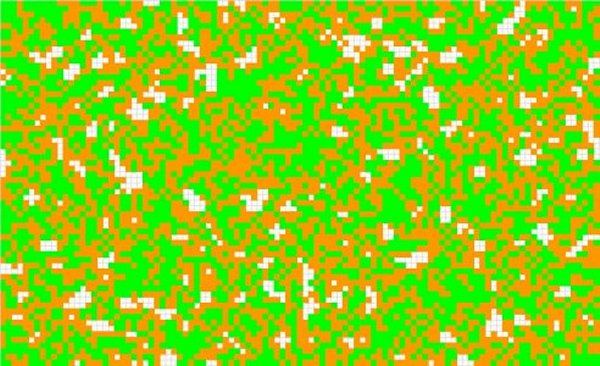
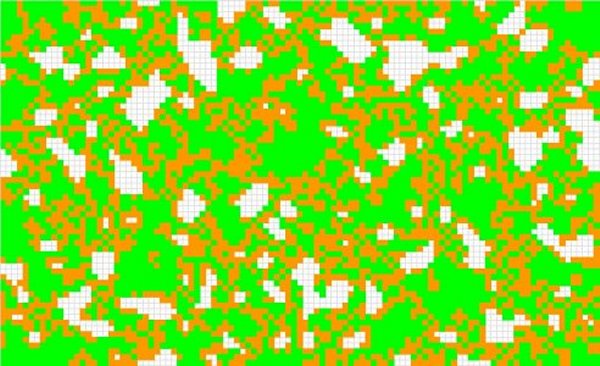
| Figure 3a ( t = 0) | Figure 3b ( t = 1) |
|
|
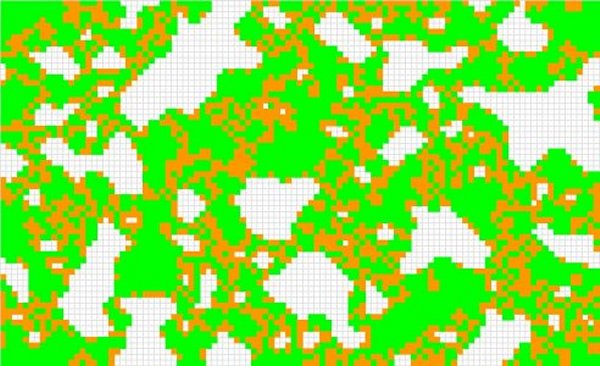
| Figure 3c ( t = 4) | Figure 3d ( t = 56, the automaton stabilizes) |
| Figure 3. An example of the dynamics of the cellular automaton (a to d) that simulate a language shift. The graphics were obtained from the first sheet of the spreadsheet in which the cellular automaton was implemented. The white cells indicate state 0, the orange cells indicate state 1 and the green cells indicate state 2. At t = 0 the state-0 cells accounted for 15%, the state-1 cells represented 40%, and the state-2 cells accounted for 45%. The threshold values were set at Sa= 3, Sb= 9 and Sc= 14. | |
|
|
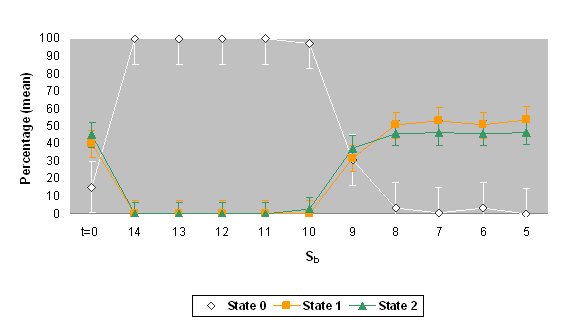
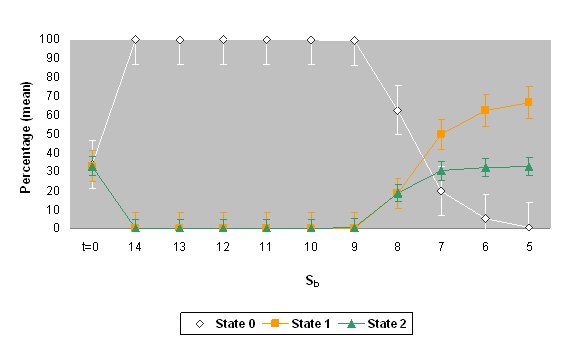
| Figure 4. The mean percentages and standard deviations of states 0, 1 and 2 for the values of threshold Sb when the automaton stabilized (values of Sb= 5 to 14). The top graph shows the results for different percentages of the states (simulation 1) and the bottom graph shows the results for the same percentage of the states (simulation 2). The percentage of initial values ( t = 0) is also shown. |
| Table 2: Percentage of oral comprehension of Catalan in the two language areas of Valencia. The data were obtained in 2005 from a sample of 6,600 people aged 15 and over (Ninyoles 2005). The table also includes the states of the cellular automaton assigned to each oral comprehension category. | |||
| Catalan area | Spanish area | State of the automaton | |
| Do Not Understand Catalan | 4.5 | 18.7 | 0 |
| Understand Some Catalan | 17.3 | 41.8 | 1 |
| Understand Catalan Well | 21.8 | 21.0 | 2 |
| Understand Catalan Very Well | 56.3 | 18.3 | 2 |
| Did Not Answer | |||
|
|
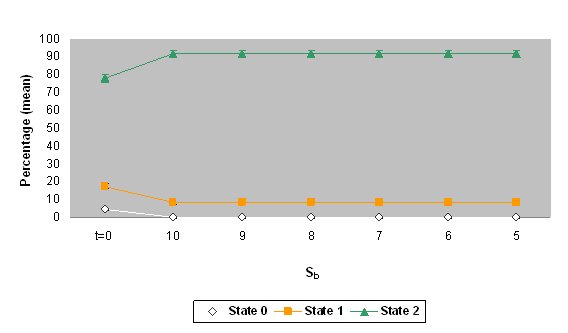
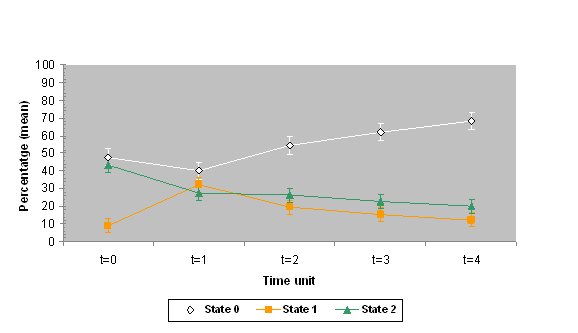
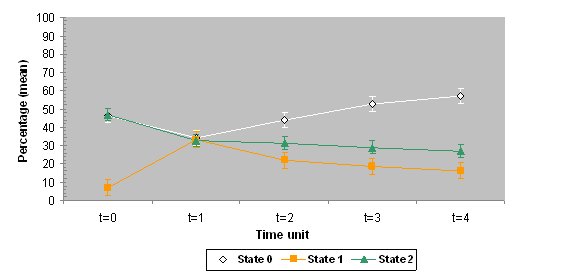
| Figure 5. The mean percentages and standard deviation of states 0, 1 and 2 for the values of threshold Sb when the automaton stabilized (values of Sb= 5 to 10). The top graph shows the data on oral comprehension of Catalan in the Catalan area of Valencia (simulation 3) and the bottom graph shows the data on oral comprehension of Catalan in the Spanish area of Valencia (simulation 4). The percentage of initial values ( t = 0) is also shown. If the standard deviations are very small, error bars are not displayed. |
| Table 3: Percentage of Catalan use in the Catalan area of Valencia in two social contexts. The data were obtained in 2005 from a sample of 6,600 people aged 15 years and over (Ninyoles 2005). The table also includes the states of the automaton assigned to each usage category. | |||
| Language spoken and frequency | Home | Friends | State of the automaton |
| Always Catalan | 32.6 | 26.5 | 2 |
| Frequently Catalan | 2.5 | 4.0 | 2 |
| More Catalan than Spanish | 1.3 | 2.3 | 2 |
| Equal Catalan and Spanish | 6.2 | 13.8 | 2 |
| More Spanish than Catalan | 2.0 | 2.1 | 1 |
| Frequently Spanish | 4.4 | 4.9 | 1 |
| Always Spanish | 48.1 | 45.5 | 0 |
| Other Language | 1.4 | --- | --- |
| Did Not Answer | 1.1 | 0.9 | --- |
|
|
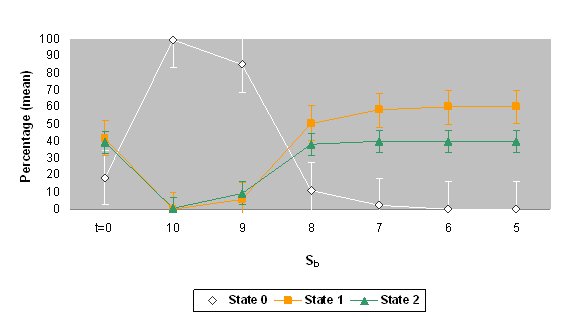
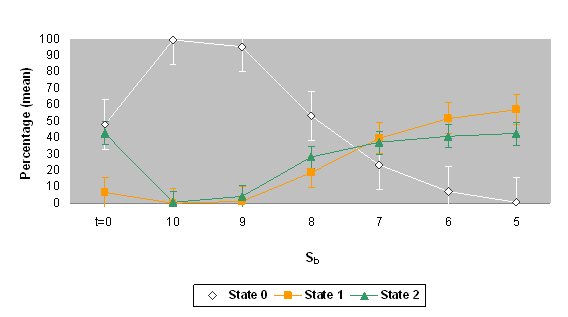
| Figure 6. The mean percentages and standard deviations of states 0, 1 and 2 for the values of threshold Sb when the automaton stabilized (values of Sb= 5 to 10). The top graph shows the data on the use of Catalan at home in the Catalan area (simulation 5) and the bottom graph shows the data on the use of Catalan with friends in the same area (simulation 6). The percentage of initial values ( t = 0) is also shown. |
|
|
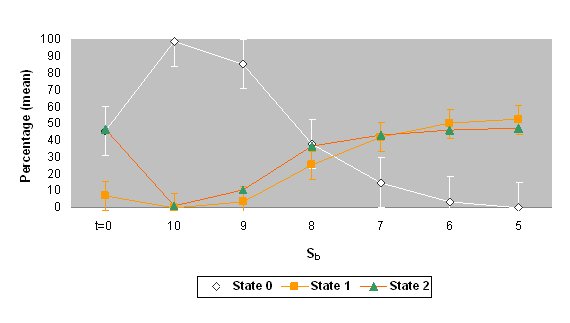
| Figure 7. The mean percentages and standard deviations of states 0, 1 and 2 for the values of Sa=3, Sb=9 and Sc=15 after four time units. The top graph shows the data for the use of Catalan at home in the Catalan area of Valencia (simulation 7) and the bottom graph shows the data for the use of Catalan with friends in the same area (simulation 8). The percentage of initial values ( t = 0) is also shown. |
GILBERT, G N (1996) Simulation as a research strategy. In Troitzsch K G, Mueller U, Gilbert G N and Doran J E (Eds.) Social science microsimulation (pp. 448-454), Berlin: Springer.
GILBERT, G N (2007) Agent-based models. Beverly Hills, CA: Sage.
GOLDSPINK, C (2002) Methodological implications of complex systems approaches to sociality: Simulation as a foundation for knowledge. Journal of Artificial Societies and Social Simulation 5 (1) 3 https://www.jasss.org/5/1/3.html.
HEGSELMANN, R (1996) Understanding social dynamics: The cellular automata approach. In Troitzsch K G , Mueller U, Gilbert G N and Doran J E (Eds.) Social science simulation (pp. 282-306), Berlin: Springer.
HEGSELMANN, R and Flache, A (1998) Understanding complex social dynamics: A plea for cellular automata based modelling. Journal of Artificial Societies and Social Simulation 1 (3) 1 https://www.jasss.org/JASSS/1/3/1.html.
LATANÉ, B (1981) The psychology of social impact. American Psychologist, 36, pp. 343-365.
MELIÀ, J L (2004) Com es destrueix la llengua dels valencians: Un model binomial pels efectes de la regla de submissió lingüística [How the language of the Valencians is destroyed: A binomial model of the effects of the linguistic submission rule]. Anuari de Psicologia de la Societat Valenciana de Psicologia, 9 (1), pp. 55-68.
MÜHLHÄUSLER, P (1996) Linguistic ecology. Language change and linguistic imperialism in the Pacific region, London: Routledge.
NINYOLES, R L (2005) Coneixement i ús social del valencià (síntesi de resultats) [Knowledge and usage of Valencian (Summary of Results)], Servici d'Investigació i Estudis Sociolingüístics, Direcció General de Política Lingüística, Generalitat Valenciana, Valencia.
NOWAK, A and Lewenstein, M (1996) Modeling social change with cellular automata. In Hegselman R, Troizsch K and Muller U (Eds.) Computer simulation from the philosophy of science point of view (pp. 249-285), Dodrecht: Kluwer.
NOWAK, A, Szamrez, J and Latané, B (1990) From private attitude to public opinion: A dynamic theory of social impact. Psychological Review, 97 (3), pp. 362-376.
SASSE, H-J (1992) Theory of language death. In Brezinger M (Ed.) Language death. Factual and theoretical explorations with special reference to East Africa (pp. 7-30), New York: Mouton de Gruyter.
UNESCO (2003) Language vitality and endangerment, Document by UNESCO Ad Hoc Expert Group on Endangered Languages, Paris.
 Return to Contents of this issue
© Copyright Journal of Artificial Societies and Social Simulation, [2009]