
 Abstract
- Social networks generally display a positively skewed degree distribution and higher values for clustering coefficient and degree assortativity than would be expected from the degree sequence. For some types of simulation studies, these properties need to be varied in the artificial networks over which simulations are to be conducted. Various algorithms to generate networks have been described in the literature but their ability to control all three of these network properties is limited. We introduce a spatially constructed algorithm that generates networks with constrained but arbitrary degree distribution, clustering coefficient and assortativity. Both a general approach and specific implementation are presented. The specific implementation is validated and used to generate networks with a constrained but broad range of property values.
- Keywords:
- Social Networks, Network Generation, Clustering Coefficient, Assortativity
Introduction
- 1.1
- Social networks are an abstraction used to describe relationships between people. The network comprises a set of nodes and a set of edges between those nodes. The nodes represent individuals (or sometimes groups of individuals, such as households or workgroups). The edges denote the existence and, in some cases, direction of the relationship of interest between the pair of nodes that it connects, such as friendship or contact sufficient to transmit infection. Social networks have been shown to have common characteristics that include positively skewed degree distribution, and higher assortativity and clustering coefficient than would be expected for a random network with the given degree sequence (Newman and Park 2003). These terms are defined below, at Social network properties.
- 1.2
- There has been substantial recent interest using simulation to examine epidemic spread and other dynamic processes on networks. Studies have found a direct (positive) relationship between assortativity and clustering coefficient for networks with some specific degree sequences (Holme and Zhao 2007; Jing et al. 2007) and there is further indirect evidence (Serrano and Boguñá 2005; Soffer and Vázquez 2005; Smith, Lee, Onnela and Johnson 2008) that this relationship applies generally. Thus, simulation studies of dynamic processes on social networks must consider the values of both properties so that any effect can be attributed to the correct property.
- 1.3
- Such simulation studies require synthetic networks with a range of clustering coefficient values in combination with a specific value of assortativity and vice versa, subject to relevant degree sequences. This enables the effect of each property to be investigated. In addition, the algorithm must be able to generate networks with extreme values of each property simultaneously, so as to cover the full range of real world property values.
- 1.4
- This paper presents a spatial approach to generating networks with arbitrary target degree sequence, clustering coefficient and assortativity, separately controlling each property. Further, the relationships between the values of the input parameters and the properties they control are direct, simplifying the tuning process. A specific implementation of the approach is presented and validated, and multiple networks are generated with a range of property values.
 Social
network properties
Social
network properties
- 2.1
- For many relationships modelled with a network, the relationship is only meaningful when it is between two different nodes. That is, an edge should not connect a node to itself. Similarly, the relationship exists or it does not and, therefore, any two nodes connected with an edge should have only a single edge between them. Networks without self edges or multiple edges are referred to as simple networks. This study only considers simple networks.
- 2.2
- The degree of a node is the number of edges that it shares with other nodes. The degree distribution is then the frequency distribution of different degrees across the nodes in the network. As with any distribution, key measures include mean and variance of degree. A specific instance of the degree distribution is referred to as the degree sequence.
- 2.3
- Clustering is a measure of network transitivity, the extent
to which neighbours of a node are neighbours of each other. This study
uses the definition given by Watts and Strogatz (1998):
Suppose that a vertex [node] v has kv neighbours [that is, nodes with which it shares an edge]; then at most kv(kv _ 1)/2 edges can exist between them… Let Cv denote the fraction of these allowable edges that actually exist. Define C (the clustering coefficient) as the average of Cv over all v.
That is, each node contributes equally to the mean, regardless of its degree. By convention, a node with degree of 0 or 1 is assigned clustering of 0. The theoretical range for C is the interval [0,1]. - 2.4
- Degree assortativity of a network (denoted r) is defined in Newman (2002) as simply the Pearson correlation coefficient of the degrees at either ends of an edge. The theoretical range is the interval [-1,1].
- 2.5
- The shortest path (or geodesic) between a pair of nodes is the smallest number of edges required to get from one node in the pair to the other, assuming such a path exists. Two properties used to measure networks are the mean and maximum (diameter) of the shortest paths across all pairs of nodes.
Network
generation in the literature
- 3.1
- There are two broad methods to generate synthetic networks with properties of interest. The first is used in simulation studies concerning a specific real world population where the actual network is not available, such as comparing the impact of different quarantine and vaccination options. It uses detailed data to synthesise a population and their activities so as to derive contact information (for example, the EpiSims project, Eubank et al. 2006).
- 3.2
- If general relationships are to be investigated, however, several synthetic networks are required with the property(s) of interest varied systematically. This requires the second broad approach, using an algorithm to generate the networks. Algorithms to generate networks have been developed for diverse purposes and have varying levels of control over different network properties.
- 3.3
- Many algorithms focus on the degree distribution. The simplest (Erdös and Rényi 1960; Barabási and Albert 1999; Dorogovtsev, Mendes and Samukhin 2001) are able to control the mean degree and general shape of the degree distribution. Several different algorithms have been published that are able to generate a random instance of a network with an arbitrary degree sequence. One approach (Békéssy, Békéssy and Komlós 1972; Molloy and Reed 1995) lists the nodes with each node appearing in the list multiple times to reflect its degree. Random pairs of nodes are then selected from that list and an edge is created between the selected nodes. Another approach (Rao, Jana and Bandyopadhyay 1996; Roberts Jr 2000; Snijders 2001) uses a Markov chain process of edge swaps to generate a random network from a starting network with the required degree sequence. Related algorithms have been developed for specific purposes such as generating a network that is connected (Gkantsidis, Mihail and Zegura 2003; Viger and Latapy 2005; Stauffer and Barbosa 2005).
- 3.4
- For each of these algorithms, the generated network is a uniformly random instance of the ensemble of networks with the specific degree sequence and edges connect randomly selected nodes. Consequently, the degrees of neighbour nodes are uncorrelated and, assuming self edges and multiple edges are not rejected, expected assortativity of the network is 0. Also, clustering coefficient is a small positive value related to the mean probability of an edge.
- 3.5
- The basic principles developed to generate networks with specific degree distributions have been extended to also control other properties. Clustering coefficient can be tuned with preferential attachment networks (Krapivsky and Redner 2001; Holme and Kim 2002) and with arbitrary degree distributions (Serrano and Boguñá 2005; Newman 2009). The joint degree distribution of pairs of nodes enables networks to be generated with arbitrary degree and assortativity (Newman 2002).
- 3.6
- Other researchers have approached the problem from a different perspective and developed algorithms that specifically focus on community structure, by allocating individuals to community groups of different sizes (Newman and Park 2003; Guillaume and Latapy 2004; Ramasco, Dorogovtsev and Pastor-Satorras 2004) or otherwise introducing local effects (Wasserman and Pattison 1996; Keeling 2005). These algorithms are able to control pairs of properties or aspects of the properties of interest, though the relationship between input parameters and output properties is not straightforward. The small world network generator (Watts and Strogatz 1998) would also fall into this category but is tuned for shortest path lengths rather than the properties under consideration for this study.
- 3.7
- There are two algorithms with substantial potential to control the three properties of interest. As yet, however, the relevant feasible property space has not been explored for either algorithm nor have studies been conducted that confirm the properties can be controlled.
- 3.8
- The first of these is the exponential random graph (or p*) model (Frank and Strauss 1986; Wasserman and Pattison 1996; Snijders, Pattison, Robins and Handcock 2006). This model has a high number of input parameters and hence degrees of freedom. In practice, however, there is no available mapping between input parameters and network level properties as this method is generally used to fit a model to a specific example network and then the fitted model is applied to generate a sample of comparison networks. One exception is the study to assess whether the algorithm could generate small world networks, which examined clustering coefficient and the distribution of path lengths (Robins, Pattison and Woolcock 2005).
- 3.9
- The p* model parameters describe relative frequencies of network components that do not specifically relate to global network properties. Hence, combinations of parameters may need to be altered to control one network property while maintaining the other properties of interest. This problem is exacerbated by the interdependence of the network properties of interest. Thus, a parameterisation study for this algorithm is warranted, but may conclude that parts of the property space are relatively inaccessible in the absence of an example network to use as calibration.
- 3.10
- A more promising algorithm is described but not used in Mahadevan, Krioukov, Fall and Vahdat (2006). This paper suggests an approach where a network is constructed with the required degree sequence and assortativity (by any means available). From that network, rewiring is used to generate a network with the required clustering coefficient. Potential rewiring is restricted to swapping edge connections where the two nodes affected have the same degree, as this preserves both degree sequence and assortativity. Metropolis dynamics techniques (Metropolis, Rosenbluth, Rosenbluth, Teller and Teller 1953) are used to target clustering coefficient.
- 3.11
- A related algorithm is also described in the paper and is used to successfully generate synthetic networks that match the properties of three internet technology networks. While the rewiring algorithm is promising, it has not yet been tested, the related algorithm has only been used to generate networks with quite different properties than social networks, and the feasible range of properties has not been explored. A detailed and specific study would be valuable.
Proposed
algorithm description
- 4.1
- The proposed algorithm uses a spatial approach to generate networks. With this approach, nodes are located in some notional space and connected using a function that depends on distance so that nodes that are close in the space are more likely to have an edge created between them (Waxman 1988; Boguña, Pastor-Satorras, Díaz-Guilera and Arenas 2004; Keeling 2005). This will induce clustering as groups of nodes that are close will tend to have edges between multiple pairs of the nodes. Once the network is generated, the notional space is discarded as the physical location has no ongoing interpretation.
- 4.2
- The algorithm extends this approach by using the notional space for an additional purpose. The nodes are positioned in the space to reflect the desired assortativity (before creating the edges). This is implemented through a layout modification stage so that nodes with similar target degree are closer together and therefore more likely to be connected when applying the edge creation function.
- 4.3
- The general approach therefore has three phases that each
focuses on a single property:
- Initialisation (degree distribution): randomly locating the nodes in space and assigning a target degree to each.
- Layout modification (assortativity): moving nodes so that those with similar target degree are relatively close.
- Edge creation (clustering coefficient): For each pair of nodes, create an edge with some probability that depends on the degree of each and the distance between them, favouring node pairs that are close together.
Implementation
example
- 5.1
- This general approach can be implemented in different ways.
The method presented here uses a one dimensional wrapped space (ring)
as the notional space. Layout modification is implemented with
stochastic conditional node swaps. For edge creation, edges for each
node are created with fixed probability until the desired target degree
is achieved, tested from nearest to furthest nodes.
Initialisation
- 5.2
- Required information for the initialisation is the degree sequence, which also provides the number of nodes N. This can be fully specified with a count of the number of nodes with each degree or drawn from a probability distribution.
- 5.3
- Each node is assigned an identifier and a target degree
from the degree distribution or degree sequence. Each node is randomly
assigned a position between 1 and N (inclusive).
Position N is next to position N-1
and position 1, so the position space is wrapped or periodic (the
locations can be conceptualised on a ring). The position is used to
identify which nodes are in each neighbourhood in the later phases.
Layout modification
- 5.4
- The principle for the layout modification stage is that, because edge creation is more probable for closer node pairs, nodes are moved so that the nodes that should be connected to attain the desired assortativity are closer together.
- 5.5
- For each iteration in the layout update phase, two nodes are uniformly randomly selected. Neighbourhoods of each node are identified, centred on each node. These neighbourhoods are of size k/p, where k is the higher degree of the two nodes and p is the probability to be used in the edge creation phase. That is, nodes are in the neighbourhood of the node at position i if they are in position i-k/2p through to position i-k/2p (excluding position i and with position N next to position 1). This size is to be consistent with the set of nodes with which edges are created in the edge creation phase.
- 5.6
- The mean degree of each node's neighbourhood is calculated. The two nodes are swapped if such a swap would place the higher degree node in the higher mean degree neighbourhood.
- 5.7
- By design, assortativity of generated networks is expected
to be higher as the number of layout modification iterations increases.
In the case where the test network has assortativity higher than the
upper tolerance value, random node swaps are conducted to decrease
assortativity. Note that such random swaps cannot reduce assortativity
below the level that would be achieved without the layout update phase.
Edge creation
- 5.8
- The edge creation stage considers each node individually in random order. All edges needed to reach the node's target degree are created before moving to the next node.
- 5.9
- Nodes are assessed for an edge with the selected node in a specific order that favours close nodes: position of selected node+1, then position of selected node-1, then position of selected node+2 and so on. An edge is formed with a set probability and only if the node is eligible for an edge. To be eligible, the node cannot already have its required number of edges and cannot already have an edge with the selected node. If all nodes have been considered before the target degree is reached for the selected node, the nodes are considered again in the same order.
- 5.10
- If there are insufficient eligible nodes, the algorithm fails. For example, late in the edge creation phase, there may be too few available nodes for a relatively high degree node to create the target number of edges. In the pure form, this would be regarded as an algorithm fail and it would be restarted. However, these networks are retained in this study. Thus, target degree and realised degree may not match.
- 5.11
- By design, clustering coefficient is expected to be higher with large values for the edge creation probability.
- 5.12
- From information obtained during the testing phase, the
edge creation probability p is initially set to
twice the target clustering coefficient and is increased (decreased) if
achieved clustering coefficient is too low (high).
Combining phases
- 5.13
- The edge creation phase naturally stops when the target degree is achieved (or is no longer feasible without introducing self edges or multiple edges). However, there are no natural criteria to set the edge creation probability (to match target clustering coefficient) or stop iterations in the layout update phase (to match target assortativity). The algorithm does not know when it has reached the target values except by generating a network and measuring its clustering coefficient and assortativity.
- 5.14
- Thus, there are various arbitrary evaluation points: how
often to generate a test network, tolerances to accept the network, and
after how many iterations to abandon the algorithm as unable to achieve
the target property values. The 1 000 node networks in this
study generate a test network every 500 iterations and accepts that
network if actual assortativity and clustering coefficient are both
within tolerance of 0.05 of target value. The network is accepted
regardless of its properties at 50 000 iterations, with an
error message.
Implementation algorithm
- 5.15
- Thus, the algorithm used is as follows and also depicted in
Figures 1 to 3. Note that the brackets [] indicate arbitrary values
unrelated to network properties.
Initialisation step
	Obtain inputs: number of nodes, target degree for each node, target
	assortativity and target clustering coefficient
	Set edge creation probability p = 2 * target clustering coefficient
	Note: if p > 1, reduce it to 1
	Randomly locate each node with an assigned target degree on a
	one dimensional ring
Edge creation step (generates network)
	FOR EACH node in random order
	Let position of selected node = i
	Let G=0
	WHILE number of edges for node < target degree
	IF not existing edge between node at position i and node
	at position i+G
	THEN create such an edge with probability p
	IF target degree not yet met for node at position i AND
	not existing edge between node at position i and node
	at position i-G
	THEN create such an edge with probability p
	Increment G
	END WHILE
Testing for completion and repeated network generation
	Calculate clustering coefficient of generated network
	Calculate assortativity of generated network

	WHILE abs(clustering coefficient - target clustering coefficient) >
	[0.05] OR abs(assortativity - target assortativity) > [0.05]
	IF abs(assortativity - target assortativity) ≤ [0.05]
	IF clustering coefficient < target clustering coefficient - [0.05]
	THEN increase p (to maximum of 1)
	IF clustering coefficient > target clustering coefficient + [0.05]
	THEN decrease p (to minimum of [0.02])
	ELSE IF assortativity < target assortativity - [0.05]
	FOR EACH of [500] pairs of nodes
	Calculate mean target degree of nodes within k/2p positions of
	each node in pair, where k is higher target degree
	IF node with higher target degree is in the lower degree
	neighbourhood
	THEN swap the positions of the nodes in the pair
	NEXT pair of nodes
	END FOR
	ELSE IF assortativity > target assortativity + [0.05]
	FOR EACH of [250] pairs of nodes
	Swap the positions of the nodes in the pair
	NEXT pair of nodes
	END FOR
	DO edge creation step and return (generate new network)
	Calculate clustering coefficient of generated network
	Calculate assortativity of generated network
	END WHILE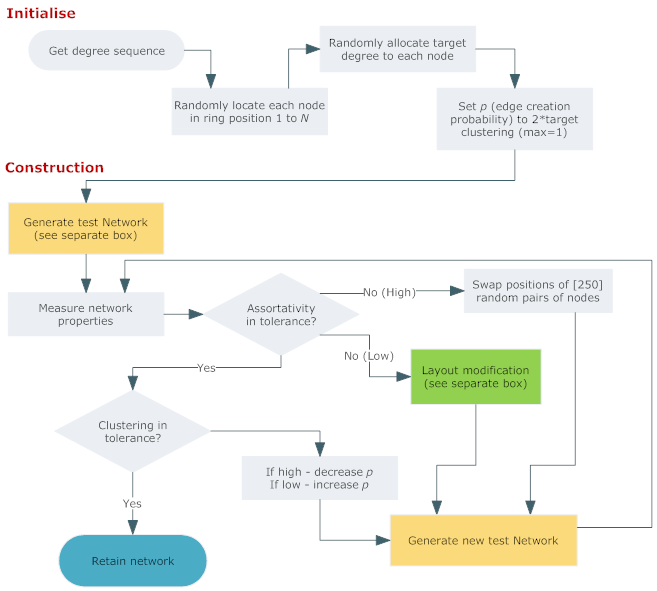
Figure 1. General structure of algorithm 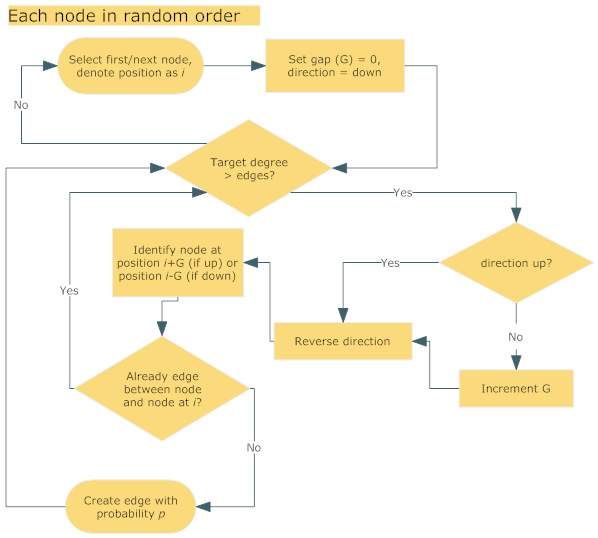
Figure 2. Edge creation step. At this point a network is generated which is then tested to assess compliance with target property values 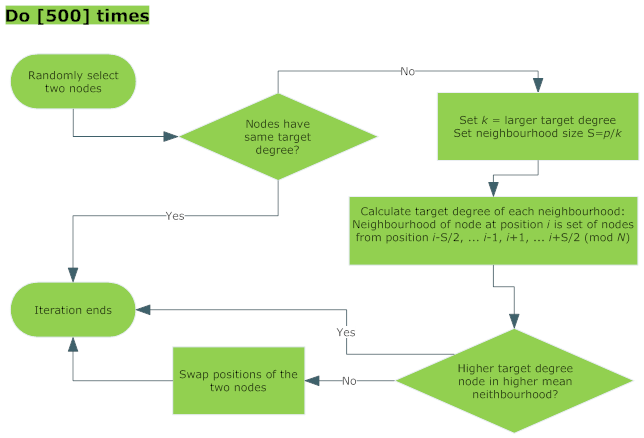
Figure 3. Layout modification to increase expected assortativity of generated network
Assessment
of algorithm
- 6.1
- To be useful for simulation based studies of the effect of network properties, the algorithm must generate networks with degree sequences from varied distribution families, a range of clustering coefficients and a range of assortativity values. Furthermore, these properties must be able to be controlled independently.
- 6.2
- In this context, the algorithm is valid if the
implementation is able to control each of the target properties
independently of the other two properties. In addition, to be useful,
the properties of the generated network must be predictable from, or at
least related to, the algorithm's input parameters and a network with
the desired properties must be generated for a reasonable proportion of
attempts.
Validation: Separate control of target properties
- 6.3
- The algorithm assumes that the node swaps in the layout update phase will result in higher assortativity, while clustering coefficient is unaffected. Instead, clustering is assumed to be related solely to the edge creation probability. This pair of assumptions underlies the algorithm's separate control over these two properties. Thus, both these properties must be measured throughout over a layout update phase to validate these assumptions.
- 6.4
- Two degree sequences were extracted from networks with 1 000 nodes and mean degree of approximately 8. While these values are arbitrary, they are broadly consistent with network sizes examining, for example, potential transmission of sexually transmitted diseases. One (denoted ER) was generated using the fixed number of edges Erdös-Rényi algorithm (Erdös and Rényi 1960) and has binomial degree distribution. The other (BA) was generated using the power law Barabási-Albert algorithm (Barabási and Albert 1999) with an initial network of 4 nodes and edges between all node pairs. These distributions were selected as extremes, with real world degree sequences likely to have intermediate cumulative distributions.
- 6.5
- For each of these sequences, the proposed network generation algorithm was run with a target assortativity of 1 and various fixed values of edge probability (p of 0.25, 0.5 and 1). The unreachable target assortativity of 1 ensures there are continued layout update steps so that the maximum achievable value can be identified. This setup provides six series of networks.
- 6.6
- For each series, 20 000 layout iterations were performed with 10 networks generated each 100 iterations and the assortativity and clustering coefficient measured. The 95% confidence intervals for these measurements are at Figures 4 (assortativity) and 5 (clustering coefficient). For both the ER and BA algorithms, the higher edge creation probability leads to higher values of both r and C.
- 6.7
- From Figure 4, assortativity increases but slows as the
number of layout iterations increases. The same number of node pairs
(100) is being compared later in the layout update but fewer swaps
occur as nodes are already partially ordered, so further increases in
assortativity cannot be achieved.
The algorithm is able to achieve much higher values of r
for the ER networks than the BA networks. However, this is because the
feasible values for r are different, not a failure of the algorithm.
The maximum assortativity values for networks with the specific ER and
BA degree sequences used are 0.94 and 0.47 respectively (Boguña, Pastor-Satorras and Vespignani
2004; Li, Alderson, Doyle and
Willinger 2006).
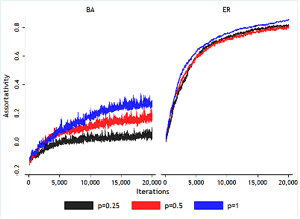
Figure 4. Achieved r throughout layout update phase (95% CI on 10 networks generated every 100 node pair swap tests) - 6.8
- From Figure 5, clustering coefficient is stable throughout
the layout iterations. Further, C is slightly less
than half the edge creation probability (p) for both
distribution types and all probability values. This highlights a
weakness of the algorithm as implemented: an upper limit to the
achievable clustering coefficient, which is achieved with p
= 1.
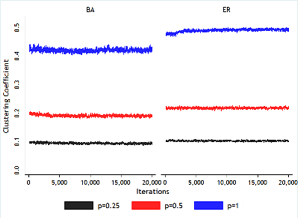
Figure 5. Achieved C throughout layout update phase (95% CI on 10 networks generated every 100 node pair swap tests) - 6.9
- Figures 4 and 5 provide proof of concept that the algorithm
is able to independently control assortativity and clustering
coefficient for different degree distribution shapes. In particular,
the node pair swaps increase assortativity, and clustering coefficient
is fixed by the edge creation probability as intended. While there is
some interaction (with higher edge creation probability also leading to
higher assortativity), there appears sufficient control to use the
algorithm to generate networks with a range of values for each
property.
Efficiency: Targeting of desired properties
- 6.10
- To provide support for this optimistic assessment of the
algorithm, a systematic attempt was made to generate networks with
specific property values. Twenty instances of the ER and BA algorithms
already described were generated and the degree sequences extracted.
For each of the degree sequences, the proposed algorithm was used to
attempt to generate a network with each combination of:
- Target r: 0.1, 0.2, 0.3, 0.4
- Target C: 0.1, 0.2, 0.3, 0.4
Assortativity and clustering targeting
- 6.11
- All 640 generated networks were able to match the target clustering coefficient within the 0.05 tolerance. This was achieved in no more than 5 attempts, starting with an edge creation probability p of twice the target clustering coefficient and increasing (decreasing) p if the achieved clustering coefficient was too low (high).
- 6.12
- The algorithm was less successful in achieving values of
assortativity within 0.05 of target. For those networks using the ER
degree sequences, matching was successful. The networks generated with
the BA degree sequences show very different results (see Table 1). For
target r of 0.1, the algorithm is relatively
successful, only failing once from 80 attempts. However, at target r
of 0.2, the algorithm consistently fails when target C
is 0.1, but succeeds for higher C values. Further,
the failures all have low achieved values of r.
That is, the algorithm cannot 'reach' higher values of r
unless the edge creation probability is relatively high. Similar
patterns occur for higher target values of r, but
are more exaggerated as success rates are lower and the algorithm is
only successful for higher target C.
Table 1: Matches between target and achieved assortativity from 20 possible, by target properties (BA only) Target r Target C=0.1 Target C=0.2 Target C=0.3 Target C=0.4 0.1 19 20 20 20 0.2 0 20 20 20 0.3 0 10 20 19 0.4 0 1 7 13 - 6.13
- This pattern suggests an explanation for the behaviour. As
noted in the validation section, the potential r
for networks with BA derived degree sequences is much lower than for ER
derived sequences. Further, a lower edge creation probability dilutes
the effect of moving similar degree nodes together in the layout update
phase. Also, for more skewed degree sequences, the difference in degree
between nodes can be very high. These factors combine so that, for
target r near the theoretical maximum, higher
values of p are required to achieve values of r
near the theoretical maximum. Thus, these are only possible when target
C is also high.
Degree sequence targeting
- 6.14
- Networks were retained even if the algorithm failed to resolve. That is, if a node had insufficient edges to meet its target degree, but the only nodes available for connection would lead to a self edge or a multiple edge, edge creation was abandoned and the network was retained with the reduced number of edges. With up to 10 attempts for each generated network, the algorithm was only able to resolve for 46 of the 320 ER networks, and for none of the BA networks. Apart from the general failure of the more skewed BA sequences, there was no apparent relationship between failure and input parameters.
- 6.15
- For generated networks, two measures were used to assess the effect of failing to match degree sequence: mean degree and the proportion of the total degree represented by the highest degree 5% of nodes. These were assessed only on those networks where actual r and C were within 0.05 of target. By construction, the target degree sequence provides an upper bound for the actual degree sequence so the number of edges unable to connect appears in the mean degree. The other two measures are indicators of whether the shape of the degree sequence is affected.
- 6.16
- For ER degree sequences, mean degree was 8.00 for all target sequences and the proportion of degree in the top 5% of nodes was 9.0%. Of the 320 generated networks, 316 had at least 3 990 edges (from a possible 4 000). For each of the comparison measures, the mean of the 20 generated networks for each property value pair was within 0.2% of the mean for the target sequences. Thus, even where the algorithm was not able to resolve, the achieved degree sequence was almost identical to the target degree sequence.
- 6.17
- In contrast, the generated networks for the skewed BA
degree sequences have lower degree (Table 2) and reduced impact of the
highest degree nodes (Table 3) than the target sequences. These effects
are more pronounced for those property combinations where fewer
networks were able to be generated.
Table 2: Mean of mean degree over generated networks with matched assortativity and clustering coefficient, by target properties (BA only - target value is 7.98) Target r Target C=0.1 Target C=0.2 Target C=0.3 Target C=0.4 0.1 7.55 7.65 7.75 7.65 0.2 na 7.68 7.71 7.81 0.3 na 7.62 7.82 7.75 0.4 na 7.32 7.70 7.77 Table 3: Mean of proportion of degree in top 5% of nodes over generated networks with matched assortativity and clustering coefficient, by target properties (BA only - target value is 24%) Target r Target C=0.1 Target C=0.2 Target C=0.3 Target C=0.4 0.1 20% 22% 22% 22% 0.2 na 22% 22% 22% 0.3 na 21% 22% 22% 0.4 na 21% 21% 21% - 6.18
- While the effect of degree variation has been blunted by the network generation algorithm, there remains a substantial skewing and the characteristic fat tail of high degree nodes in the BA degree sequence is replicated. This reflects the greater difficulty of high degree nodes finding potential edge partners without multiple edges or self edges. The difficulty is exacerbated if a high degree node is selected relatively late in the random order for edge creation.
Discussion
- 7.1
- Previously published algorithms have been unable to generate networks that control degree sequence, assortativity and clustering coefficient. The presented network generation algorithm has a three phase approach. Each of these phases influences one of the target social network properties. The key is that the layout modification phase moves nodes with similar degree close together in a notional space. Then, the edge creation phase searches for potential edge partners amongst the closest nodes, so the prior node movements lead to increased assortativity of the generated network. A lower probability for edge creation causes a larger search space and smaller clustering coefficient.
- 7.2
- This general approach is demonstrated with a specific implementation, which is able to generate networks with a broad range of degree sequences, assortativity and clustering coefficient values. It uses a one dimensional ring as the notional space and stochastic node pair swaps for layout update.
- 7.3
- There are several limitations with this algorithm. The first group concerns the properties of the algorithms able to be generated. Specifically, the maximum possible clustering coefficient is approximately 0.5. Further, for more skewed degree sequences, generating a network with the full degree sequence is more difficult, and partial networks have less extreme degree sequences. One potential method to reduce this problem is to manually increase the target degree for high degree nodes so that the 'blunting' effect reduces degree to the true target. Another potential approach would be to introduce a rewiring mechanism to break existing edges to free up suitable nodes for connection with later selected high degree nodes.
- 7.4
- A further substantial limitation is that the algorithm does not generate a uniformly random network instance from an ensemble of networks with the target properties and a bias in property values may exist. For example, consider the case where the test network is generated frequently so only a small number of node swaps occurs between each test. As the assortativity (generally) increases with the edge node swapping and the test network is accepted once the assortativity is within tolerance of the target value, frequent testing would result in sets of networks with assortativity values near the lower tolerance point rather than spread over the entire range. As a consequence of this non uniform sampling of networks, there is no guarantee of validity for statistical analysis over sets of networks generated with this algorithm. Further work is needed to estimate the bias in property values, for both target and other properties (such as geodesic distribution). However, such work requires an algorithm that is able to select a random sampling of networks in the property space for comparison.
- 7.5
- The flexibility of the three phase network generation approach described here makes the algorithm a useful tool to generate large numbers of networks that are difficult to access with other algorithms. Future work will examine alternative implementations that may improve reliability in generating specific properties or extend the algorithm for other network properties. For example, using a higher dimensional space is likely to weaken the control over clustering coefficient, but may allow the algorithm to control mean geodesic for the generated networks through the edge creation phase. Other types of assortativity could also be targeted, such as age or gender association with relatively simple modifications to the implementation presented here.
- 7.6
- Processes other than edge swapping are also available for the layout update phase. For example, a combination of attractive and repulsive forces could be used, with attractive forces based on the properties of the nodes (such as target degree) and the network property of interest. Repulsive forces, based on distance between nodes, would be required to maintain separation.
Acknowledgements
- The authors gratefully acknowledge the anonymous referees and Hussein Abbass, whose comments and questions improved the paper substantially and identified some interesting paths for future research. This research is primarily funded by a University College Postgraduate Research Scholarship and supported by the ARC Centre for Complex Systems grant number CEO0348249.
References
- BARABSI, A-L and Albert, R
(1999). Emergence of scaling in random networks. Science
286 (15 Oct 1999) pp. 509-512. [doi:10.1126/science.286.5439.509]
BÉKÉSSY, A, Békéssy, P and Komlós, J (1972). Asymptotic enumeration of regular matrices. Studia Scientiarum Mathematicarum Hungarica 7 pp. 343-353.
BOGUÑA, M, Pastor-Satorras, R, Díaz-Guilera, A and Arenas, A (2004). Models of social networks based on social distance attachment. Physical Review E 70 (056122) [doi:10.1103/physreve.70.056122]
BOGUÑA, M, Pastor-Satorras, R and Vespignani, A (2004). Cut-offs and finite size effects in scale-free networks. The European Physcial Journal B 38 pp. 205-209. [doi:10.1140/epjb/e2004-00038-8]
DOROGOVTSEV, SN, Mendes, JFF and Samukhin, AN (2001). Size-dependent degree distribution of a scale-free growing network. Physical Review E 63 (062101). [doi:10.1103/PhysRevE.63.062101]
ERDÖS, P and Rényi, A (1960). On the evolution of random graphs. Publications of the Institute of Mathematics, Hungarian Academy of Science 5 pp. 17-60.
EUBANK, S, Kumar, VSA, Marathe, MV, Srinivasan, A and Wang, N. (2006). Structure of Social Contact Networks and Their Impact on Epidemics, DIMACS Series in Discrete Mathematics and Theoretical Computer Science.
FRANK, O and Strauss, D (1986). Markov graphs. Journal of the American Statistical Association 81 (395) pp. 832-842. [doi:10.1080/01621459.1986.10478342]
GKANTSIDIS, C, Mihail, M and Zegura, E (2003). The Markov Chain simulation method for generating connected power law random graphs. Paper presented at the SIAM Alenex 03.
GUILLAUME, J-L and Latapy, M (2004). Bipartite structure of all complex networks. Information Processing Letters 90 (5) pp. 215-221. [doi:10.1016/j.ipl.2004.03.007]
HOLME, P and Kim, BJ (2002). Growing scale-free networks with tunable clustering. Physical Review E 65 (026107). [doi:10.1103/PhysRevE.65.026107]
HOLME, P and Zhao, J (2007). Exploring the assortativity-clustering space of a network's degree sequence. Physical Review E 75 (046111). [doi:10.1103/PhysRevE.75.046111]
JING, Z, Lin, T, Hong, Y, Jian-Hua, L, Zhi-Wei, C and Yi-Xue, L (2007). The effects of degree correlations on network topologies and robustness. Chinese Physics 16 (12) pp. 3571-3580. [doi:10.1088/1009-1963/16/12/004]
KEELING, MJ (2005). The implications of network structure for epidemic dynamics. Theoretical Population Biology 67 (1) pp. 1-8. [doi:10.1016/j.tpb.2004.08.002]
KRAPIVSKY, PL and Redner, S (2001). Organization of growing random networks. Physical Review E 63 (066123). [doi:10.1103/PhysRevE.63.066123]
LI, L, Alderson, D, Doyle, J and Willinger, W (2006). Toward a theory of scale-free graphs: Definition, properties and implications. Internet Mathematics 2 (4) pp. 431-523. [doi:10.1080/15427951.2005.10129111]
MAHADEVAN, P, Krioukov, D, Fall, K and Vahdat, A (2006) 'Systematic topology analysis and generation using degree correlations', Proceedings of the ACM SIGCOMM Conference, Pisa, Italy, September 2006. http://conferences.sigcomm.org/sigcomm/2006/discussion/showpaper.php?paper_id=15
METROPOLIS, N, Rosenbluth, AW, Rosenbluth, MN, Teller, AH and Teller, E (1953). Equation of State Calculations by Fast Computing Machines. Journal of Chemical Physics 21 (6) pp. 1087-1092. [doi:10.1063/1.1699114]
MOLLOY, M and Reed, B (1995). A critical point for random graphs with a given degree sequence. Random Structures and Algorithms 6 pp. 161-179. [doi:10.1002/rsa.3240060204]
NEWMAN, MEJ (2002). Assortative mixing in networks. Physical Review Letters 89 (208701). [doi:10.1103/PhysRevLett.89.208701]
NEWMAN, MEJ (2009). Random graphs with clustering. ArXiv 0903 (4009). [doi:10.1103/physrevlett.103.058701]
NEWMAN, MEJ and Park, J (2003). Why social networks are different from other types of networks. Physical Review E 68 (036122). [doi:10.1103/PhysRevE.68.036122]
RAO, AR, Jana, R and Bandyopadhyay, S. (1996). A Markov chain Monte Carlo method for generating random (0,1) matrices with given marginals. Sankhya: Indian Journal of Statistics 58 pp. 225-242.
RAMASCO, JJ, Dorogovtsev, SN and Pastor-Satorras, R (2004). Self-organization of collaboration networks. Physical Review E 70 (036106). [doi:10.1103/PhysRevE.70.036106]
ROBERTS JR, JM (2000). Simple methods for simulating sociomatrices with given marginal totals. Social Networks 22 (3) pp. 273-283. [doi:10.1016/S0378-8733(00)00026-5]
ROBINS, G, Pattison, P and Woolcock, J (2005). Small and other worlds: Global network structures from local processes. American Journal of Sociology 110 (4) pp. 894-936. [doi:10.1086/427322]
SERRANO, M and Boguñá, M (2005). Tuning clustering in random networks with arbitrary degree distributions. Physical Review E 72 (036133).
SMITH, DMD, Lee, CF, Onnela, J-P and Johnson, NF (2008). Link-space formalism for network analysis. Physical Review E 77 (036112). [doi:10.1103/PhysRevE.77.036112]
SNIJDERS, TAB (2001). The statistical evaluation of social network dynamics. Sociological Methodology 31 pp. 361-395. [doi:10.1111/0081-1750.00099]
SNIJDERS, TAB, Pattison, P, Robins, G and Handcock, MS (2006). New specifications for exponential random graph models. Sociological Methodology 36 pp. 99-153. [doi:10.1111/j.1467-9531.2006.00176.x]
SOFFER, SN and Vázquez, A (2005). Network clustering coefficient without degree-correlation biases. Physical Review E 71 (057101). [doi:10.1103/PhysRevE.71.057101]
STAUFFER, AO and Barbosa, VC (2005). A study of the edge switching Markov-Chain method for the generation of random graphs. ArXiv 0512015.
VIGER, F and Latapy, M (2005). Fast generation of random graphs with prescribed degrees. Paper presented at the COCOON 2005, Kunming, China.
WASSERMAN, S and Pattison, P (1996). Logit models and logistic regressions for social networks: I. An introduction to Markov random graphs and p*. Psychometrika 61 (3) pp. 401-426. [doi:10.1007/BF02294547]
WATTS, DJ and Strogatz, SH (1998). Collective dynamics of 'small-world' networks. Nature 393 pp. 440-442. [doi:10.1038/30918]
WAXMAN, BM (1988). Routing of multipoint connections. IEEE Journal on Selected Areas in Communications 6 (9) pp. 1617-1622. [doi:10.1109/49.12889]