
 Abstract
- Medical innovations, in the form of new medication or other clinical practices, evolve and spread through health care systems, impacting on the quality and standards of health care provision, which is demonstrably heterogeneous by geography. Our aim is to investigate the potential for the diffusion of innovation to influence health inequality and overall levels of recommended care. We extend existing diffusion of innovation models to produce agent-based simulations that mimic population-wide adoption of new practices by doctors within a network of influence. Using a computational model of network construction in lieu of empirical data about a network, we simulate the diffusion of competing innovations as they enter and proliferate through a state system comprising 24 geo-political regions, 216 facilities and over 77,000 individuals. Results show that stronger clustering within hospitals or geo-political regions is associated with slower adoption amongst smaller and rural facilities. Results of repeated simulation show how the nature of uptake and competition can contribute to low average levels of recommended care within a system that relies on diffusive adoption. We conclude that an increased disparity in adoption rates is associated with high levels of clustering in the network, and the social phenomena of competitive diffusion of innovation potentially contributes to low levels of recommended care.
- Keywords:
- Innovation Diffusion, Scale-Free Networks, Health Policy, Agent-Based Modelling
 Background
- 1.1
- Studies of healthcare practice suggest that recommended care is rarely provided ubiquitously. In a US-based study it was found that between 10.5% and 78.7% of patients received recommended care, depending on the disease or condition (McGlynn et al. 2003). Given that these levels are deemed unacceptable (Braithwaite et al. 2009;Moszynski 2010;Runciman et al. 2007), there is value in better understanding how new recommended practices diffuse through populations of clinicians, especially at state and national scales.
- 1.2
- Geographically-based disparities of health for populations are measured empirically at scales ranging from within cities (Lovett et al. 2002), across states (Subramanian et al. 2001), to between rural and urban regions within a nation (Liu et al. 1999; Verheij 1996; Verheij et al. 1998). The results of these studies show that inequalities in healthcare provision are apparent within and across cities, and between rural and urban regions. Other factors influencing healthcare inequality include socioeconomic status and ethnicity (Haynes et al. 2008; Wilkinson and Pickett 2006). The range and scope of these studies suggests that healthcare inequality is an issue of global concern.
- 1.3
- Clinicians take up new practices at different rates (Coleman et al. 1957, 1966;Menzel 1960). Studies in both primary (general practice) and acute care (inside hospitals) provide detailed samples of how doctors decide to adopt new medication practices and the ways in which they receive information (Groves et al. 2002; Peay and Peay 1984, 1988, 1990; Prosser et al. 2003; Prosser and Walley 2006). Sources of information reported in these studies include clinicians' colleagues, pharmaceutical company representatives, imposed constraints by administrators via formularies, published clinical trials, reviews and guidelines.
Diffusion of innovation
- 1.4
- Diffusion of innovation (Rogers 2003) has been examined in the context of healthcare (Achilladelis and Antonakis 2001; Atun et al. 2007; Fitzgerald et al. 2002; Greenhalgh et al. 2008) and medication practices (Cohen 2006; Coleman et al. 1957). One of the purposes for studying diffusion of innovation is to identify characteristics of individuals, organisations or the innovations that are correlated with faster or slower adoption times. In the seminal study on the diffusion of a new medication practice (Coleman et al. 1957, 1966), the proximity of doctors in regards to office space and hospital affiliation were tested amongst a set of possible ways to account for the differences in adoption times.
- 1.5
- Models using empirical information (Bass 1969;Bulte and Stremersch 2004) have shown that there is a consistent pattern to the adoption of individual innovations over time. From these examples, time series representing the cumulative number of individuals adopting an innovation typically follow a sigmoid shape. The Gompertz function (see Winsor 1932) and variants have been used to model observed adoptions (Bemmaor and Lee 2002; Bulte and Stremersch 2004), as have other functions that produce similar shapes (Bass 1969,Bass 2004).
- 1.6
- Some studies have been conducted to extend diffusion of innovation models to include more than one innovation. Norton and Bass (1987) developed a model of sequential technological innovations and validated their model using empirical sales data of memory and logic circuits. Others have investigated the effects of timing and competition amongst innovators and followers using a variety of methods (Bohlmann et al. 2002; Cohen 2006; Corrocher and Fontana 2006; Fitzgerald et al. 2002; Jensen 1983).
- 1.7
- Network-based models are of interest to diffusion of innovations research because they consider diffusion of innovations as a process of social contagion, which accounts for the heterogeneity of networks of observed social interaction. Amongst the examples of network-based investigations into diffusion of innovations or standards we encountered (Abrahamson and Rosenkopf 1997; Beck et al. 2008; Choi et al. 2010; Coleman et al. 1966; Ratna et al. 2008; Strang and Nancy Brandon 1993; Valente 2005; Weitzel et al. 2006), the network sizes range from 21 to 1000 and include discussions of random, small-world and clustered structures. To our knowledge, there have not been any studies done on the behaviour of competing innovations on large (at least an order of magnitude larger than the existing examples), scale-free networks that span many locations, organisations or groups.
Network structures of information diffusion and influence amongst people
- 1.8
- Networks of advice-giving and information exchange in healthcare settings are observed using a variety of methods within the social network paradigm (Creswick et al. 2009; Creswick and Westbrook 2010; Fattore et al. 2009; Harris et al. 2008; Keating et al. 2007; Lewis et al. 2008; Lurie et al. 2009). However, the size of each of the networks studied is relatively small - most within a single geographical location, department or hospital. The networks observed in each of these examples have non-uniform degree distributions.
Outside of the healthcare domain, there are limited numbers of empirical studies concerned with the structure of large networks of individuals exchanging information or exerting influence, with sizes in the order of tens of thousands to millions (Kosmidis and Bunde 2007; Leskovec and Horvitz 2008; Leskovec et al. 2008). Characteristics that are consistently reported in empirical studies of larger networks include scale-free degree distributions, shrinking diameters and various levels of clustering.
Aims and contributions
- 1.9
- Our aim is to identify how social processes related to the diffusion of innovation may lead to inequality of care in real healthcare systems. We hypothesise that increases in network clustering can significantly increase the disparity of healthcare provision. Given the lack of data needed to test this hypothesis empirically, we construct a computational model using information about hospital locations and sizes, and a range of network constructions whose properties are established in existing models of influence in large social networks.
Methods
-
Network construction
- 2.1
- Networks were constructed using publicly available information on the staff numbers associated with healthcare facilities in New South Wales (NSW), Australia. NSW has nine Area Health Services (AHS) and indexes facilities within each AHS using one of five remoteness codes (from 0 to 4, representing major metropolitan facilities to very remote facilities, respectively). Using data acquired the NSW Health Services Comparison Data Book (2009), we compiled a list of 216 facilities in which the number of staff varied between 4 and 5020, for a total of 77,473. The 216 facilities are classified into 24 geo-political regions according to AHS and remoteness. Amongst the 24 regions, we have included the Justice Health AHS, for which facilities are not distributed within a contiguous geographical area and we model it in the same way. In Fig. 1, the size and remoteness classification for each of the hospitals are illustrated, indicating the distribution of acute care services across NSW.
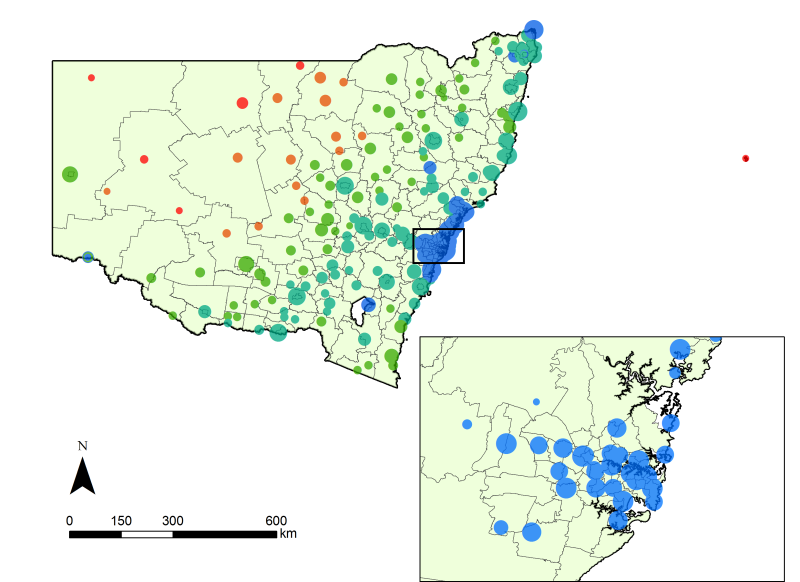
Figure 1. Healthcare facilities in New South Wales (NSW) Australia, differentiated by categories of size (radius, class-transformed) and remoteness code (colour). Colours blue, aqua, green, orange and red represent metropolitan, inner regional, outer regional, remote and very remote facilities, respectively. The local statistical areas are shown for context. - 2.2
- Each network used in the simulations comprises the individuals associated with each facility and region, and the connections representing influence amongst the individuals. Connections are defined according to models for random (Erdös and Rényi 1959) or scale-free networks, the latter of which we implement using preferential attachment (Barabási and Albert 1999; Newman 2001), which is modified to incorporate constraints based on locality. The preferential attachment algorithm is extended to constrain a proportion of connections within a facility or geo-political region whilst maintaining the scale-free distribution. The construction algorithm is specified in the Appendix.
- 2.3
- Clustering is measured using a mean clustering coefficient (Wasserman and Faust 1994). The core of the network is defined by the largest strongly-connected component (Cormen et al. 1990). A breadth-first search from any one node within the core to all other nodes within reach defines the range of influence from the core. The scale-free degree distribution is confirmed by measuring the goodness of fit for the function P(k) = k-γ (where P(k) is the probability that an individual in the network will influence k other individuals), as well as the value of the fitted exponent.
Diffusion mechanism
- 2.4
- The diffusion mechanism is a model of the individual decision-making process enacted by individuals during an interaction with a neighbour. Clinicians decide on the adoption of a new practice using one or more sources of information (discussed in the introduction) and based on perceived benefits versus risks, the ability to try without commitment or cost, and the capacity to observe and measure results (Cain and Mittman 2002). The diffusion mechanism used here condenses most of these factors into two, namely relative advantage Δnew, which includes all relative benefits of using the new practice over the old practice, and a cost coefficient, c new, representing the initial cost (resistance) of the implementation of a new practice. Given the lack of an empirical basis from which to base the micro-scale decision-making process, we make a series of assumptions about the decision-making process and the impact of benefits versus costs. We assume that the cost has a larger (exponential) effect on the decision-making process compared to the (linear) effect of the relative advantage.
- 2.5
- Each time an individual is given the opportunity to interact with a neighbour that has a different practice from his or her own, the probability of switching to the new practice is given as follows:
P( p new) = e-cnew (1 + Δ new)/2 - 2.6
- The relative advantage is given by the difference between the values of the old and new practice, both of which are on the interval zero to one. The resulting relative advantage modifies the probability of adopting a new practice linearly. The cost of implementation can take any value greater than or equal to zero and decreases the probability of adoption exponentially such that any combination of values and costs produces a probability between zero and one. In the absence of relative advantage between two competing practices and when resistances are equal, the probability of changing from either practice to the alternative is equal. The expectation is that practices with equal costs and values will tend towards equal use in the system over time (more slowly with higher resistance to change), assuming both are given initial opportunities to disperse.
- 2.7
- The important simplifying assumptions made in the model of decision-making are as follows:
- All individuals in the network have the same perception of relative advantage and resistance for each practice and these values are constant in time. In the real system, new evidence about old practices can influence perceptions.
- Each new practice is in direct competition with all existing practices. In real healthcare systems new practices are not always direct substitutions. For example, new medication practices might be prescribed for a subset, superset or in addition to existing medications.
- Individuals in the network hold only one practice at a time. In practice, a doctor has the ability to decide on a case-by-case basis and may therefore not perform an immediate and sustained switch to a higher-valued practice.
- A change in practice takes place only through influence from a peer or an exogenous event. This implies that active dissemination such as visits from pharmaceutical company representatives are implicit to exogenous events and other information sources such as changes in guidelines and formularies are modelled by individuals in the network with high levels of influence (very high out-degree). Recall that high-degree nodes are equally as fickle as other nodes (equal number of incoming connections), drawing their advice from peers and exogenous events in the same manner. The choice is a consequence of choosing simplicity in the absence of an empirical basis.
Simulations
- 2.8
- A simulation is represented by a sequential series of time steps that are internally synchronous (see the Appendix). In each time step, each individual in the simulation is given an opportunity to change practices if any of the neighbours that influence them hold a different practice. If there is more than one alternative practice, an individual will choose one of those practices with a probability directly related to the proportions of each alternative practice in their neighbourhood. The individual will then apply a probability test as described in the previous section. The time steps in the simulations are arbitrarily defined to be weekly.
- 2.9
- Every simulation is instantiated with all individuals practicing a single initial practice. New practices enter the system via exogenous events, which are defined as an input to the simulation. Exogenous events defined for this model are analogous to the way in which Norton and Bass (1987) implement successive generations of innovations in their analytical model. In the case of these simulations, exogenous events are defined by a practice and a time, in weeks, relative to the start of the simulation. Each time an exogenous event is triggered, an individual is chosen at random and the practice the individual holds is changed to the practice specified in the exogenous event. For example, a series of events distributed over a long period of time might describe a marketing scenario, whereas a single large shock in which a large number of individuals change practice might describe the withdrawal of a drug or a high-impact media shock.
- 2.10
- To test for disparity in adoption times as a consequence of greater clustering, we use repeated simulations with the same cost schedule, value schedule and set of exogenous events, and vary the configuration of the network each time. The output is a time series of practices for each individual. This is abstracted to produce the average time taken within each facility and then the facility-based timings are evaluated for disparity by size or remoteness.
- 2.11
- To look for behavioural patterns in recommended care, we run repeated random simulations in which the configuration of the network has equal constraints but the cost schedule, value schedule and set of exogenous events are modified. The output is used to capture the trajectory of each practice, as the proportion of the population practicing each practice at each point in time. The trajectories are used to classify individual practices in terms of failure or success, slow or fast adoption.
Results
- 3.1
- We firstly describe the networks used in the simulations in regards to their clustering, average separation and scale-free nature. Secondly, we provide the results of experiments designed to find disparity in adoption times that are a consequence of clustering by region or facility. Finally, we demonstrate the range of behaviours that result from changes in the properties of the competing innovations and examine its effect on levels of recommended care.
Network structures
- 3.2
- The networks produced by the constrained preferential attachment algorithm are observed to have scale-free degree distributions, clustering coefficients that increase in concordance with increasingly constrained inter-region and inter-facility connectivity, and reach of influence from the network core that exceeds 95% in all scenarios (Table 1). For networks we constructed with an average degree of 4, the degree distributions follow a power law (with exponent around 1.80), which is within the range of other large information-exchange networks such as scientific collaboration, email-based communication and other social networks (Ebel et al. 2002).
Table 1: Network structure summary statistics offer a comparison between different network constructions in regards to clustering, scale-free degree distribution and reach of influence. Network clustering coefficient γ from P(k) = k-γ (R2 for fit) reach from core (percentage) median distance (steps) Random 2.24 × 10⁻⁵ N/A 100.0 8 Barabási-Albert 1.72 × 10⁻⁵ 1.80 (0.995) 100.0 3 -with 90% internal to region 2.31 × 10⁻⁴ 1.81 (0.994) 99.99 6 -with 90% internal to facility 2.93 × 10⁻³ 1.80 (0.994) 99.99 9 -with 99% internal to region 3.51 × 10⁻⁴ 1.81 (0.995) 99.85 12 -with 99% internal to facility 3.95 × 10⁻³ 1.79 (0.994) 96.00 18 Network effects on healthcare inequalities
- 3.3
- The effect of clustering on healthcare inequality is tested by running repeated simulations over networks that vary in clustering - networks where connections between individuals are increasingly constrained within geo-political regions or facilities. Using a consistent set of costs and values, the simulations demonstrate how the time taken to adopt a new practice varies with size of facility and remoteness code. The hypothesis is that an increase in clustering is associated with an increase in the time taken to adopt a new practice by smaller facilities in comparison to larger facilities.
- 3.4
- The adoption time for a facility is taken to be the mean adoption time for each of the individuals in the facility (those unreachable from the core are not included). Results of these simulations show that there is a significant increase in the disparity of adoption times as clustering is increased by region or facility. Note that because size and remoteness are highly correlated, it is not appropriate to perform a multiple linear regression using both variables. The coefficient of determination produced would be artificially high as a consequence of the co-linearity.
- 3.5
- Facility size (log-transformed) and remoteness are used as explanatory variables in two separate linear regressions for the response, which is the adoption time in each facility. For random and preferential attachment constructions that are not constrained by region or facility, the variance in size or remoteness do not explain the variance in adoption. When clustering is introduced and increases, both remoteness and size exhibit significant disparity in adoption times (Fig. 2). Longer adoption times are correlated with smaller sizes and greater remoteness. Fig. 2 is interpreted to mean that, for example, a network that is constrained such that 90% of connections are internal to facilities results in a 7 to 8 week difference in mean adoption times for each step increase in remoteness.
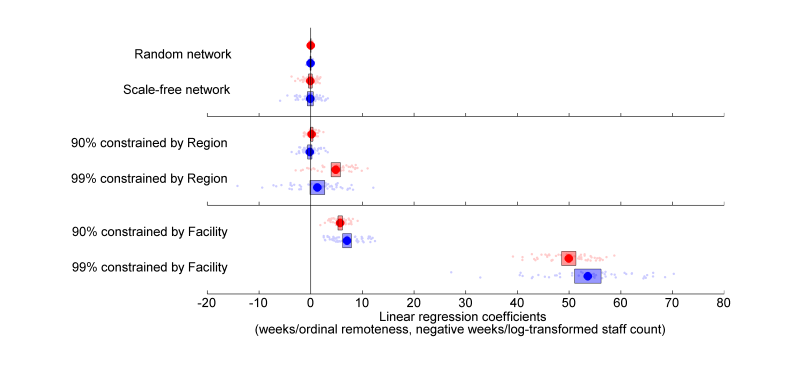
Figure 2. The coefficients of linear regressions for fifty simulations of the six scenarios, with means (circles) and confidence intervals for the mean (bars). Coefficients for log-transformed size and ordinal remoteness are given in red and blue respectively. - 3.6
- More specifically, clustering by region produces a disparity that increases with increasing clustering and is significant for both explanatory variables beyond a 99% level of clustering. Similarly, increasing clustering by facility increases the disparity in adoption times - however the effect is more dramatic, reaching significant levels at lower levels of clustering and producing greater disparity. It is therefore evident that clustering influences disparity in a manner that depends on the severity of the clustering as well as the dimensions along which the connections are constrained.
Diffusion and competition effects on levels of recommended care
- 3.7
- By repeated simulations, we describe the average level of recommended care for a highly-clustered network. Recommended care is defined as a time series - the proportion of individuals that practice the most valuable practice available at the given time in the simulation. The 500 simulations are instantiated with a number of new practices, which is drawn from a uniform distribution (1 to 10). The number and timing of exogenous events is taken from a Poisson distribution (λ=0.05), uniformly distributed amongst the set of new practices. Practice values are taken from a uniform random distribution (0.00 to 1.00) and costs values are taken from a lognormal distribution (the associated normal distribution has μ=0, σ=1). All networks used in the simulations feature 90% of links internal to facilities and 99% of links internal to geo-political regions. The time period represented by each of the simulations is 10 years, with every individual in the network given the opportunity to change practice once a week.
- 3.8
- The level of recommended care is taken to be the proportion of doctors practicing the highest-valued practice available in the system at any time. Using this definition, a trajectory representing recommended care in the system is defined, as illustrated in Fig. 4 for randomly-generated systems. Of the 500 randomly-generated simulations, the highest-valued practice failed to propagate beyond 1% in 148 of the simulations as a result of the vagaries of network interactions or prohibitively high costs in comparison to the competing practices. Of the 293 simulations in which recommended care practices reached at least 50% of the individuals in the network, the median time taken to reach that level was 80 weeks (with an inter-quartile range of 35.8 to 212 weeks) and the mean level of recommended care during the ten years for this subset is 61.8% (with an inter-quartile range of 43.0% to 93.2%). Our interpretation is that patterns of recommended care are sensitive to the values and costs of competing practices as well as the timing and location of exogenous events. This is in line with empirical research showing that entry order does not predict majority share of sales for medications (Cohen 2006).
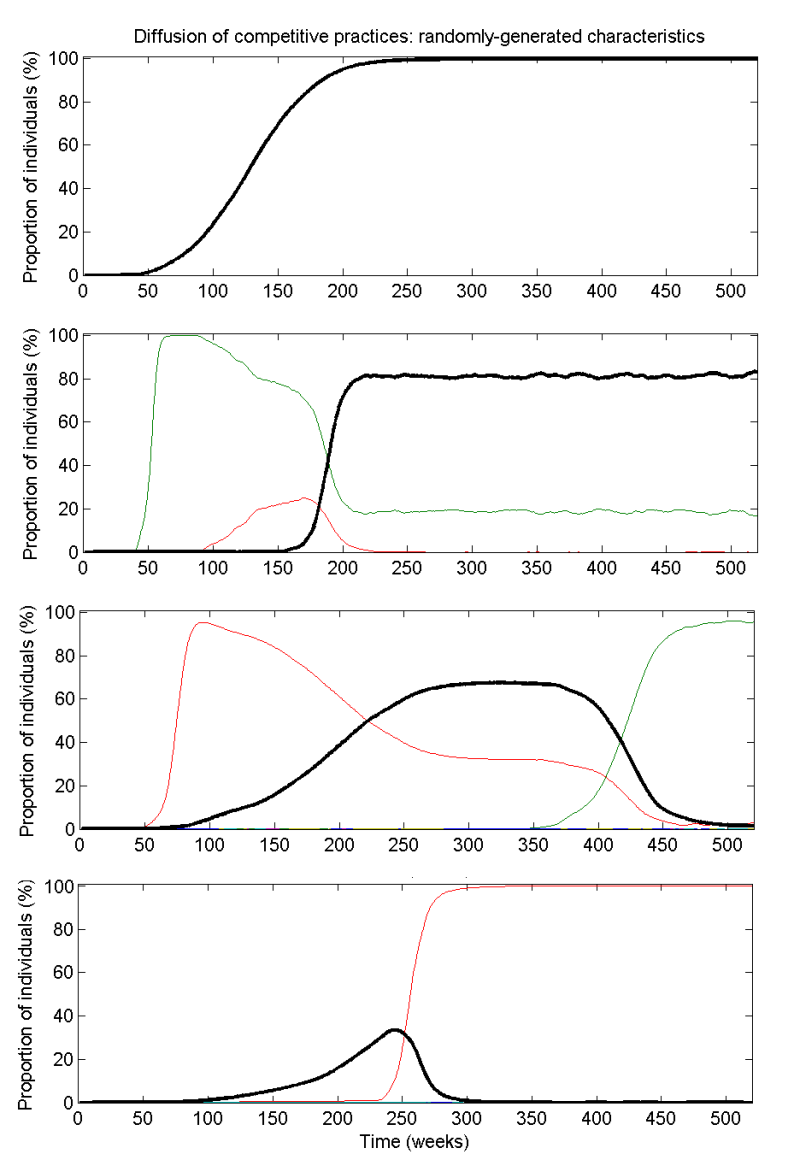
Figure 4. Example simulations of randomly-generated systems of competing practices over ten years. The highest-valued practice is indicated by a black curve and the individual competing practices are given by the other coloured curves. The four scenarios represent different values, costs and number of practices, but always for networks where 90% of links are intra-facility and 99% are intra-region.
Discussion and Conclusions
-
The dynamics of competing innovations
- 4.1
- In networks where a large proportion of individuals influence very few and a small proportion influence a very large proportion, the dynamics of influence and information-exchange are significantly different to the dynamics produced under the assumption of homogeneous mixing (as in a random network). Under the assumption that the networks produced here are adequate models of influence about medical practices in the real world, it is shown that the different dynamics lead to different adoption dynamics.
- 4.2
- By introducing a bias towards connecting co-located individuals in the network, while maintaining the overall number of connections, it is possible to show that stronger clustering leads to slower adoption in smaller and less well-connected facilities and regions. The effect of clustering is significant, producing an average of two weeks difference per ordinal remoteness category under moderate clustering by facility, and eleven weeks difference under high levels of clustering by facility. The nature of interactions amongst the network of clinicians and the administrators that support their work is rarely discussed in research on healthcare inequality - the results from the simulations presented here demonstrate the possibility of network-mediated inequalities, which we believe warrant further investigation.
- 4.3
- Levels of recommended care depend on each of the factors relating to the introduction and uptake of new practices, namely the number of competing practices, differences in values and costs, and the vagaries of the network structure. For the vast majority of network structures we tested, as well as the different scenarios of cost, value and exogenous events, we found that levels of recommended care were well below one hundred percent and the results are highly variable. The conclusion that may be drawn from these experiments is that the nature of adoption in a large network of influence can contribute to low levels of recommended care. This has implications for the study of research translation in medicine and the sporadic measurement of recommended care, namely that it is important to consider the unexpected consequences of social phenomena associated with the adoption of new standards of recommended care amongst clinicians.
Limitations
- 4.4
- The results are not calibrated to real-world examples of healthcare practices because we lack spatially-explicit data describing changing practices at a state or national level. Further investigation into the perceived costs and values of individual practices may also be required to empirically validate the model. Population-wide sales data (which is available for the subset of practices relating to medications and some diagnostic procedures) has been shown to be affected in ways that make it difficult to determine the level of imitation versus innovation in analytical models of diffusion (Bemmaor and Lee 2002; Bulte and Stremersch 2004) and thus may not be appropriate for validating the analogous network-based computational model.
- 4.5
- The manner in which we have chosen to construct the network on a large scale introduces a bias towards the disconnection of small facilities at very high levels of clustering (at 99% by facility, 4% of individuals are unreachable from the main core) - meaning that only exogenous events occurring within the smaller facility can begin a facility-wide change in practice within a disconnected facility. In the model, we assume a uniform in-degree for each individual (under the basic assumption that individuals have a consistent capacity for absorbing information from others within the system). However, we do not know of any empirical studies that compare rural facilities and major metropolitan facilities in regards to how well they are connected to exogenous sources of information such as geographically-distant colleagues, pharmaceutical company representatives, and administrative and journal publications.
- 4.6
- While the categories of influence are known, the magnitude of the influence from the various sources of influence on doctors is not known and variability in influence may change the shape of the network. Anecdotally, medication practices are understood to be influenced heavily by marketing practices employed by pharmaceutical companies (Angell 2008;Prosser and Walley 2006), in addition to published research and the regulatory systems that define formularies. For example, a strong regulatory system might result in a highly centralised or hierarchical network where information spreads from a central point via dedicated communication channels. Alternatively, a system regulated by price and competition might result in a highly-clustered network that depends critically on exogenous events for the equitable adoption of new practices. Since the exact configuration of the network is not known, we have tested models of the network, using a range of clustering and other properties exhibited by other networks of influence and information exchange.
Summary of contributions
- 4.7
- Our contribution here is threefold. Firstly, we describe the construction and simulation of a computational model of competing innovations in which the characteristics of the innovations and the topology of the network through which the innovations diffuse may be modified. Secondly, we demonstrate that changes in network clustering results in significant disparity in adoption times within a population, implying a possible causal link between communication patterns and inequality of healthcare provision in large populations. Thirdly, we show that there are an abundance of scenarios in which average levels of recommended care are maintained at levels well below one hundred percent as a consequence of competition and diffusion modifying adoption rates in concert, suggesting that the mechanisms associated with competition and diffusion may partially explain the low levels of recommended care observed in real-world healthcare systems.
Appendix
-
Specification for the modified preferential attachment routine
GET Facility, an index of length n representing the facilities
GET Region, an index of length n representing the regions
GET k, the expected in-degree for each node
GET f, the proportion of connections allowed to be external to facilities
GET r, the proportion of connections allowed to be external to regions
SET Pool to [1..n], a pool of nodes in the network
SET Degree, an all-zero vector of length n
SET A, the adjacency matrix to an all-zero matrix of size n by n
SET K, k elements removed at random from Pool
FOR each element ki in K
	SET A(ki,kj) to 1, for all j not equal to i
	INCREMENT Degree(ki) by k-1
ENDFOR
REPEAT remove target, an element from Pool
	FOR each new connection from 1 to k
		SET neighbours, the pre-existing connections in A, directed at target
		IF the next random value is less than r, THEN
			SET Source, the set [1..n]
		ELSEIF random is less than f, THEN
			SET Source, the indices of Region equal to the target's region
		ELSE
			SET Source, the indices of Facility equal to the target's facility
		ENDIF
		SET Source, remove any instances of target or neighbours
		IF Source is empty, THEN
			SET Source, the set [1..n]
			SET Source, remove any instances of target or neighbours
		ELSE
			IF the sum of the elements in Degree indexed in Source is zero, THEN
				SET index, one element of Source chosen at random
			ELSE
				SET index, the index of the first element surpassed by the next
				random value in a vector comprised of the normalised cumulative sum of
				Degree for only elements in Source
			ENDIF
		ENDIF
		SET A(index,target) equal to one
		INCREMENT Degree(index)
		INCREMENT Degree(target)
	ENDFOR
UNTIL there are no more elements left in Pool
- 5.1
- Note that the facility and region constraints take precedence over the preferential attachment and there is no strict chronology of nodes. For example, if a connection is constrained within a facility and no node can be found with an existing connection (in or out), then another node is selected from within the facility at random to be the source, rather than selecting preferentially by degree outside of the facility. If the two variables associated with the constraints ( f and r) are set to zero, then the algorithm becomes the typical form of preferential attachment (see main text). Note also that it is necessary to count connections in both directions as increases in degree for a node in a directed network as an extension to preferential attachment algorithms that are designed for undirected networks.
Specification for a simulation of diffusing and competing practices
GET A the n by n adjacency matrix representing the network
GET T the vector containing exogenous events as indices of practices
GET V the value schedule of length x, the number of practices
GET C the cost schedule of length x, the number of practices
SET R an all zero matrix of size n by the length of T
FOR each time step t in a finite simulation
	IF T(t) is not empty THEN
		FOR each element Tk in T(t)
			SELECT i, an individual
			SET R(i,t) as the practice specified by Tk
		ENDFOR
	ENDIF
	FOR each individual, i
		SET N to be the non-zero elements of row i in A
		SELECT Ns the subset of N such that R(Ns,t)≠R(i,t)
		IF Ns is not empty THEN
			SELECT Nk, one element of Ns
			IF a random value is greater than P(R(Nk,t),R(i,t))* THEN
				SET R(i,t+1) to R(Nk,t)
			ELSE
				SET R(i,t+1) to R(i,t)
			ENDIF
		ENDIF
	ENDFOR
ENDFOR
- 5.2
- The simulation of diffusion for competing practices uses the probability function specified in the main text (at the location specified by the asterisk) that takes the value difference between the current and replacement practices and the cost of implementation of the replacement practice from the cost schedule and the value schedule to determine the likelihood of changing practice. As discussed in the main text, positive value differences and lower costs are both associated with a higher probability of change. While it is a simple model of the decision-making process of an individual, it produces the sigmoid shape of diffusion in the base case and additionally represents more complicated behaviours expected of competing practices.
References
-
ABRAHAMSON, E and Rosenkopf, L (1997) Social Network Effects on the Extent of Innovation Diffusion: A Computer Simulation, Organization Science, 8 (3), 289-309. [doi:10.1287/orsc.8.3.289]
ACHILLADELIS, B and Antonakis, N (2001) The dynamics of technological innovation: the case of the pharmaceutical industry, Research Policy, 30 (4), 535-88. [doi:10.1016/S0048-7333(00)00093-7]
ANGELL, M (2008) Industry-Sponsored Clinical Research: A Broken System, Journal of the American Medical Association, 300 (9), 1069-71. [doi:10.1001/jama.300.9.1069]
ATUN, R A et al. (2007) Diffusion of complex health innovations--implementation of primary health care reforms in Bosnia and Herzegovina, Health Policy and Planning, 22 (1), 28-39. [doi:10.1093/heapol/czl031]
BARABÁSI, A-L and Albert, R. (1999) Emergence of Scaling in Random Networks, Science, 286 (5439), 509-12. [doi:10.1126/science.286.5439.509]
BASS, F M (1969) A New Product Growth for Model Consumer Durables, Management Science, 15 (5), 215-27. [doi:10.1287/mnsc.15.5.215]
BASS, F M (2004) Comments on "A New Product Growth for Model Consumer Durables": The Bass Model, Management Science, 50 (12), 1833-40. [doi:10.1287/mnsc.1040.0300]
BECK, R et al. (2008) Network effects as drivers of individual technology adoption: Analyzing adoption and diffusion of mobile communication services, Information Systems Frontiers, 10 (4), 415-29. [doi:10.1007/s10796-008-9100-9]
BEMMAOR, A C and Lee, J (2002) The Impact of Heterogeneity and Ill-Conditioning on Diffusion Model Parameter Estimates, Marketing Science, 21 (2), 209-20. [doi:10.1287/mksc.21.2.209.151]
BOHLMANN, J D, Golder, P N, and Mitra, D (2002) Deconstructing the Pioneer's Advantage: Examining Vintage Effects and Consumer Valuations of Quality and Variety, Management Science, 48 (9), 1175-95. [doi:10.1287/mnsc.48.9.1175.175]
BRAITHWAITE, J, Runciman, W B, and Merry, A F (2009) Towards safer, better healthcare: harnessing the natural properties of complex sociotechnical systems, Quality and Safety in Health Care, 18 (1), 37-41. [doi:10.1136/qshc.2007.023317]
BULTE, C, and Stremersch, S (2004) Social Contagion and Income Heterogeneity in New Product Diffusion: A Meta-Analytic Test, Marketing Science, 23 (4), 530-44. [doi:10.1287/mksc.1040.0054]
CAIN, M and Mittman, R (2002), Diffusion of Innovation in Health Care, iHealth Reports (Oakland, California: California Healthcare Foundation).
CHOI, H, Kim, S-H, and Lee, J (2010) Role of network structure and network effects in diffusion of innovations, Industrial Marketing Management, 39 (1), 170-77. [doi:10.1016/j.indmarman.2008.08.006]
COHEN, F J. (2006) 'Entry order as a consideration for innovation strategies', Nature Reviews Drug Discovery, 5 (4), 285-94. [doi:10.1038/nrd2009]
COLEMAN, J, Katz, E, and Menzel, H (1957) The Diffusion of an Innovation Among Physicians, Sociometry, 20 (4), 253-70. [doi:10.2307/2785979]
COLEMAN, J, Katz, E, and Menzel, H (1966) Medical Innovation: A Diffusion Study (Indianapolis: The Bobbs-Merrill Company).
CORMEN, T, Leiserson, C, and Rivest, R (1990) Introduction to Algorithms (The MIT Press).
CORROCHER, N and Fontana, R (2006) Expectations, Network Effects and Timing of Technology Adoption: Some Empirical Evidence from a Sample of SMEs in Italy, SPRU Electronic Working Paper Series (University of Sussex, SPRU - Science and Technology Policy Research).
CRESWICK, N and Westbrook, J (2010) Social network analysis of medication advice-seeking interactions among staff in an Australian hospital, International Journal of Medical Informatics, 79 (6), e116-e25. [doi:10.1016/j.ijmedinf.2008.08.005]
CRESWICK, N, Westbrook, J, and Braithwaite, J (2009) Understanding communication networks in the emergency department, BMC Health Services Research, 9 (1), 247. [doi:10.1186/1472-6963-9-247]
EBEL, H, Mielsch, L-I, and Bornholdt, S (2002) Scale-free topology of e-mail networks, Physical Review E, 66 (3), 035103. [doi:10.1103/PhysRevE.66.035103]
ERDÖS, P and Rényi, A (1959) On random graphs, Publicationes Mathematicae, 6, 290-97.
FATTORE, Giovanni, et al. (2009) Social network analysis in primary care: The impact of interactions on prescribing behaviour, Health Policy, 92 (2-3), 141-48. [doi:10.1016/j.healthpol.2009.03.005]
FITZGERALD, L, et al. (2002) Interlocking Interactions, the Diffusion of Innovations in Health Care, Human Relations, 55 (12), 1429-49. [doi:10.1177/001872602128782213]
GREENHALGH, T, et al. (2008) Introduction of shared electronic records: multi-site case study using diffusion of innovation theory, BMJ, 337, a1786.
GROVES, K E M, Flanagan, P S, and MacKinnon, N J (2002) Why physicians start or stop prescribing a drug: Literature review and formulary implications, Formulary, 37 (4), 186.
HARRIS, J K, et al. (2008) Seeing the forest and the trees: Using network analysis to develop an organizational blueprint of state tobacco control systems, Social Science & Medicine, 67 (11), 1669-78. [doi:10.1016/j.socscimed.2008.07.013]
HAYNES, R, Pearce, J, and Barnett, R (2008) Cancer survival in New Zealand: Ethnic, social and geographical inequalities, Social Science & Medicine, 67 (6), 928-37. [doi:10.1016/j.socscimed.2008.05.005]
JENSEN, Richard (1983) Innovation adoption and diffusion when there are competing innovations, Journal of Economic Theory, 29 (1), 161-71. [doi:10.1016/0022-0531(83)90127-8]
KEATING, N, et al. (2007) Factors Affecting Influential Discussions Among Physicians: A Social Network Analysis of a Primary Care Practice, Journal of General Internal Medicine, 22 (6), 794-98. [doi:10.1007/s11606-007-0190-8]
KOSMIDIS, K and Bunde, A (2007) On the spreading and localization of risky information in social networks, Physica A: Statistical Mechanics and its Applications, 386 (1), 439-45.
LESKOVEC, J and Horvitz, E (2008) Planetary-scale views on a large instant-messaging network, Proceedings of the 17th international conference on World Wide Web (Beijing, China). [doi:10.1145/1367497.1367620]
LESKOVEC, J, et al. (2008) Statistical properties of community structure in large social and information networks, Proceedings of the 17th international conference on World Wide Web (Beijing, China). [doi:10.1145/1367497.1367591]
LEWIS, J M, Baeza, J I, and Alexander, D (2008) Partnerships in primary care in Australia: Network structure, dynamics and sustainability, Social Science & Medicine, 67 (2), 280-91. [doi:10.1016/j.socscimed.2008.03.046]
LIU, Y, Hsiao, W C, and Eggleston, K (1999) Equity in health and health care: the Chinese experience, Social Science & Medicine, 49 (10), 1349-56. [doi:10.1016/S0277-9536(99)00207-5]
LOVETT, Andrew, et al. (2002) Car travel time and accessibility by bus to general practitioner services: a study using patient registers and GIS, Social Science & Medicine, 55 (1), 97-111. [doi:10.1016/S0277-9536(01)00212-X]
LURIE, S J, Fogg, T, and Dozier, Ann, M (2009) Social Network Analysis as a Method of Assessing Institutional Culture: Three Case Studies, Academic Medicine, 84 (8), 1029-35. [doi:10.1097/ACM.0b013e3181ad16d3]
MCGLYNN, E A, et al. (2003) The Quality of Health Care Delivered to Adults in the United States, New England Journal of Medicine, 348 (26), 2635-45. [doi:10.1056/NEJMsa022615]
MENZEL, H (1960) Innovation, Integration, and Marginality: A Survey of Physicians, American Sociological Review, 25 (5), 704-13. [doi:10.2307/2090143]
MOSZYNSKI, P (2010) Situation on health targets "is hardly any better" than it was 10 years ago, BMJ, 341, c3521. [doi:10.1136/bmj.c3521]
NEWMAN, M E J (2001) Clustering and preferential attachment in growing networks, Physical Review E, 64 (2), 025102. [doi:10.1103/PhysRevE.64.025102]
NORTON, J A and Bass, F M (1987) A Diffusion Theory Model of Adoption and Substitution for Successive Generations of High-Technology Products, Management Science, 33 (9), 1069-86. [doi:10.1287/mnsc.33.9.1069]
NSW HEALTH (2009) NSW Health Services Comparison Data Book, 2007/2008, (NSW Health, available at: http://www.health.nsw.gov.au/pubs/2009/yellowbook_08.html).
PEAY, M Y and Peay, E R (1984) Differences among practitioners in patterns of preference for information sources in the adoption of new drugs, Social Science & Medicine, 18 (12), 1019-25. [doi:10.1016/0277-9536(84)90160-6]
PEAY, M Y and Peay, E R (1988) The role of commercial sources in the adoption of a new drug, Social Science & Medicine, 26 (12), 1183-89. [doi:10.1016/0277-9536(88)90149-9]
PEAY, M Y and Peay, E R (1990), Patterns of preference for information sources in the adoption of new drugs by specialists, Social Science & Medicine, 31 (4), 467-76. [doi:10.1016/0277-9536(90)90042-Q]
PROSSER, H and Walley, T (2006) New drug prescribing by hospital doctors: The nature and meaning of knowledge, Social Science & Medicine, 62 (7), 1565-78. [doi:10.1016/j.socscimed.2005.08.035]
PROSSER, H, Almond, S and Walley, T (2003) Influences on GPs' decision to prescribe new drugs--the importance of who says what, Family Practice, 20 (1), 61-68. [doi:10.1093/fampra/20.1.61]
RATNA, N, et al. (2008) Diffusion and Social Networks: Revisiting Medical Innovation with Agents, Complex Decision Making, 247-65.
ROGERS, E M (2003) Diffusion of Innovations (5 edn.; New York: Free Press).
RUNCIMAN, B, Merry, A, and Walton, M (2007), Safety and Ethics in Healthcare: A Guide to Getting it Right (Hampshire: Ashgate).
STRANG, D and Tuma, N B (1993) Spatial and Temporal Heterogeneity in Diffusion', The American Journal of Sociology, 99 (3), 614-39. [doi:10.1086/230318]
SUBRAMANIAN, S V, Kawachi, I, and Kennedy, B P (2001) Does the state you live in make a difference? Multilevel analysis of self-rated health in the US, Social Science & Medicine, 53 (1), 9-19. [doi:10.1016/S0277-9536(00)00309-9]
VALENTE, T W (2005) Network models and methods for studying the diffusion of innovations, in Peter J Carrington, John Scott, and Stanley Wasserman (eds.), Models and methods in social network analysis (27; New York: Cambridge University Press), 98-116. [doi:10.1017/CBO9780511811395.006]
VERHEIJ, R A, et al. (1998) Urban-rural variations in health in The Netherlands: does selective migration play a part? Journal of Epidemiology and Community Health, 52 (8), 487-93. [doi:10.1136/jech.52.8.487]
VERHEIJ, R A (1996) Explaining urban-rural variations in health: A review of interactions between individual and environment, Social Science & Medicine, 42 (6), 923-35. [doi:10.1016/0277-9536(95)00190-5]
WASSERMAN, S and Faust, K (1994) Social Network Analysis: Methods and Applications (Cambridge University Press). [doi:10.1017/CBO9780511815478]
WEITZEL, T, Beimborn, D, and König, W (2006) A unified economic model of standard diffusion: the impact of standadization cost, network effect, and network topology, MIS Quarterly, 30, 489-514.
WILKINSON, R G and Pickett, K E (2006) Income inequality and population health: A review and explanation of the evidence, Social Science & Medicine, 62 (7), 1768-84. [doi:10.1016/j.socscimed.2005.08.036]
WINSOR, C P (1932) The Gompertz Curve as a Growth Curve, Proceedings of the National Academy of Sciences of the United States of America 18 (1), 1-8. [doi:10.1073/pnas.18.1.1]