
 Abstract
- Recently, the area of study of spatial game continuously has extended, and researchers have especially presented a lot of works of coevolutionary mechanism. We have recognized coevolutionary mechanism as one of the factors for the promotion of cooperation like five rules by Nowak. However, those studies still deal with the optimal response (best decision). The best decision is persuasive in most cases, but does not apply to all situations in the real world. Contemplating that question, researchers have presented some works discussing not only the best decision but also the second-best decision. Those studies compare the results between the best and the second-best, and also state the applicability of the second-best decision. This study, considering that trend, has extended the match between two groups to spatial game with the second-best decision. This extended model expresses relationships of groups as a spatial network, and every group matches other groups of relationships. Then, we examine how mutual cooperation changes in each case where either we add probabilistic perturbation to relationships or ties form various types of the structure. As a result, unlike most results utilizing the best decision, probabilistic perturbation does not induce any change. On the other hand, when ties are the scale-free structure, mutual cooperation is enhanced like the case of the best decision. When we probe the evolution of strategies in that case, groups with many ties play a role for leading the direction of decision as a whole. This role appears without explicit assignment. In the discussion, we also state that the presented model has an analogy to the real situation, collusive tendering.
- Keywords:
- Cooperation, Second-Best Decision, Multi-Agent Simulation, Spatial Game, Collusive Tendering
Introduction
- 1.1
- The topic of research how cooperation emerges under the situation of conflicts of interest has been a quite challenging theme. Many researchers have managed to approach this question. Until now, we have regarded that five rules by Nowak (direct / indirect / network reciprocity and kin / multilevel selection) (Nowak 2006) are effective for the emergence of cooperation in pairwise interactions like the prisoner's dilemma game (abbreviated as PDG). On the other hand, in group interactions (i.e. public goods game), punishment has been thought to have its effect on maintenance of cooperation (Fehr 2002; Fowler 2005; Herrmann 2008; O'Gorman 2009; Rankin 2009). The effect of punishment on the promotion of cooperation is still disputable (Fowler 2005; Dreber 2008; O'Gorman 2009; Rankin 2009).
- 1.2
- In above factors facilitating cooperation, especially regarding network reciprocity, there are some cases for the development of cooperation when relationships of players are the small world structure (Watts 1999; Masuda 2003). Also, some papers have presented that ties of the scale-free effectively facilitate cooperation (Santos 2005; Santos 2006; Perc 2008; Santos 2008). Recently, coevolutionary mechanism where both strategies and relationships of players evolve has proved to be a promotive factor for cooperation (Ebel 2002; Zimmermann 2004; Pacheco 2006;Poncela 2009; Szolnoki 2009; Van Segbroeck 2009; Perc 2010). In the coevolutionary mechanism, the difference of rates of evolution between strategy and structure is crucial for the development of cooperation.
- 1.3
- The practical problem for those many studies is that they all deal with the optimal response (best decision). Those researchers at first think about the theory of the survival of the fittest by Darwin that individuals manage to maximize their fitness. Then, researchers are inclined to discuss why cooperation emerges and develops in that circumstance. On the other hand, considering practical situations, there are many cases like negotiation that everyone intends to reach an agreement with compromise. If he/she mutually employed the best decision, he/she would not achieve it. Naturally, researchers have already recognized that problem. Therefore, they have studied and discussed not only the best decision but also the second-best decision (Rietveld 2007; Boergers 2009; Ohdaira 2009). Those studies based on the second-best decision describe the comparison between the best and the second-best and also its applicability to real problems.
- 1.4
- Considering that trend, we extend the model of the match between two groups with the second-best decision proposed by Ohdaira et al. (Ohdaira 2009) to spatial game. In that case, groups play matches between the groups of relationships. Then, while interactions are ordinarily pairwise in the PDG, we introduce the mechanism of two stages that matches are pairwise but decision is the group level. It is similar to the system of multilevel selection, where matches are pairwise but selection is the group level (Traulsen 2006). The reason why we employ that mechanism is because we aim at making stages of evolution multiple and inducing its diversity.
- 1.5
- Employing this constructed model, we examine how changes in the structure of network (topology) expressing relationships of groups affect mutual cooperation. As a result, we cannot find any difference between the cases of network with probabilistic perturbation. On the contrary, when the network has the scale-free structure, mutual cooperation can be enhanced as well as the results of the best decision (Santos 2005; Santos 2006; Perc 2008; Santos 2008). Investigating the case of the scale-free structure in more detailed, the increase in the number of groups and the variation in the density of relationships do not produce any changes. On the other hand, when the length of strategy of each group gets large, mutual cooperation cannot be easily settled in comparison with the results of other parameters. This trend is similar to the one of the two groups model (Ohdaira 2009). In addition, when we examine how every group evolves his/her strategy, it is proved that groups with quite many relationships (hub groups) determine the direction of decision as a whole and also promote the decision of groups after the settlement of the direction. This role emerges without explicit assignment.
- 1.6
- We will note descriptions in the following order. First, we briefly explain the PDG with sequential strategy of the Ohdaira's model. Next, the detail of the constructed model and the obtained results are exhibited. Then, we discuss both the results and the applicability of the presented model. We explain how the presented model is analogous to the real situation by illustrating the problem of collusive tendering. Finally, we will state concluding remarks.
The Model
-
Brief description of the PDG with sequential strategy
- 2.1
- The studies of the PDG generally adopt the framework that strategies do not transform themselves, i.e., each player mutually refers to some pre-prepared strategies, and selects one strategy that is considered to be the most successful. Especially, the studies of the iterated PDG designate strategy as response to past actions of others. Therefore, many researches focus the point, what strategy within those prepared is the most increased and utilized by players, i.e., what the most successful strategy is.
- 2.2
- In this research, contrarily we adopt policy of not introducing the framework with explicit reference to other information. Each player can only recognize strategies of opponents as the form of resulting average payoff, i.e., he/she cannot obtain the perfect information of other strategies. Furthermore, we adopt the PDG with sequential strategy of Ohdaira et al. (Ohdaira 2006; Ohdaira 2007; Ohdaira 2009; Ohdaira 2011) where strategy describes multiple choices (ex. CCDDD, also see equation (1)) rather than the typical PDG. Note that Ohdaira's studies except (Ohdaira 2009) utilize other types of decision, however the framework of the game is all the same. We refer to “strategy” as not the patterns of reaction (ex. TFT, AllD, AllC) but the sequential array itself for the PDG with sequential strategy as noted below.
- 2.3
- We describe the basic feature of the PDG with sequential strategy of two groups (Ohdaira 2007; Ohdaira 2009; Ohdaira 2011) as follows (also see Figure 1). There are two different groups which have n strategies respectively. Strategies of each group have an ID u (from 1 to n). The strategy regulates behavior of group in each bout of PDG. All strategies are initialized as random sequences. We can express every strategy of the group i, i.e., Si (u)as a sequential array whose length is L as the equation (1). Each character represents strategy of one bout ( D: Defection, C: Cooperation). Where D or C means the component vector, we express it as (0, 1) or (1, 0).
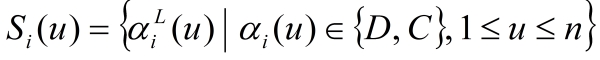
(1) - 2.4
- Each group plays the match of n rounds with the other group utilizing his/her strategy. At this time, he/she mutually presents his/her holding strategy in turn. This order shall be loyal to each number of strategies ( u) as Figure 1. However, strategies with the same ID are not similar because they independently change according to the decision of every group. After each round, every group first recognizes payoff of his/her presented strategy.
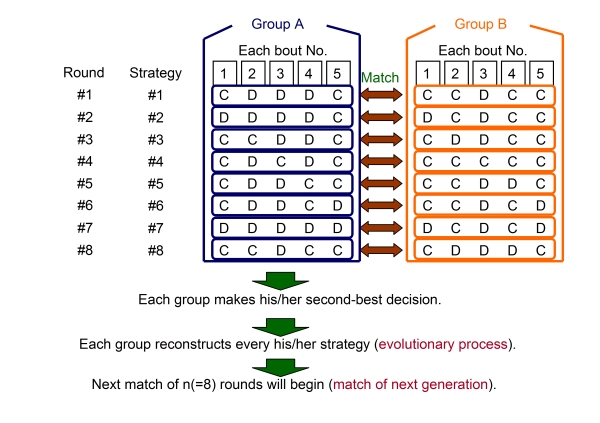
Figure 1. Outline of the PDG with sequential strategy - 2.5
- We can numerically express each payoff of strategy of the group i at the generation g with the equation (2). The u -th strategy of the group i has its payoff pij (u)against the group j. In that equation, A designates the payoff matrix of the standard iterated PDG (Axelrod 1984), and where αik(u) and αjk(u) each show the element of strategy of the equation (1). The reason why we employ this payoff matrix is because the PDG with sequential strategy makes u times of rounds in a match, and is similar to the mechanism of the iterated PDG as well. He/She can determine the trend of proposed strategies of others from each resulting payoff. This information is reflected in the match of next generation.
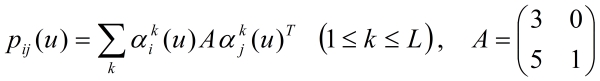
(2) - 2.6
- After the match composed of n rounds, each group makes his/her decision. In the decision-making process, he/she decides his/her one representative strategy at first. He/She partially transfers the selected representative strategy to other strategies in turn, and produces strategies of next generation. The representative strategy itself does not change except the mutation, where every character of strategies is reversed with uniform probability (1/1000). This process is referred to as the evolutionary process (also illustrated in Figure 2). Through the decision-making and the evolutionary process, each group newly generates n strategies, and goes into the match of n rounds for next generation. We repeat above procedure from the match to the evolutionary process over several generations. The basic PDG with sequential strategy particularly discusses the frequency of mutual cooperation at the last generation.
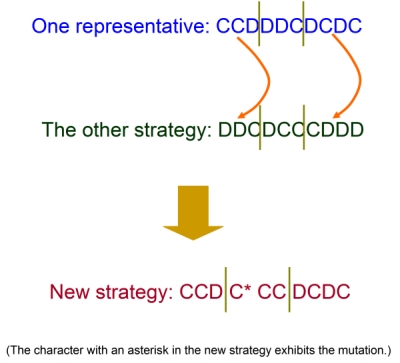
Figure 2. Illustration of the evolutionary process - 2.7
- The reason for the modification of mutation probability from the Ohdaira's model is as follows. Previous study (Ohdaira 2009) shows that the frequency of mutual cooperation decreases when the number of strategies ( n) or the length of strategy ( L) increases. This phenomenon is derived from the fact that the evolutionary process becomes less effective in such situations. Those values ( n and L) are basically not so large in this study, while the number of opponent groups increases a lot (2 to 8 groups). It is a common notion that mutual cooperation is not easily settled when the number of opponents enlarging (Duran 2005, Chen 2007). Therefore, we determine that it is necessary for more effective evolution of cooperation to raise the value of mutation probability.
The second-best decision
- 2.8
- Next, we describe the detail of the second-best decision. We think that the second-best decision is most appropriate for reproducing the decision with compromise. In this section, first we show that previous studies have proposed some approaches to avoid undesirable situation (Nash equilibrium) in the PDG with the best decision. Second, we denote that there are some cases where former researches with the best decision cannot explain well. Finally, we propose the second-best decision as more practical one for the expression of compromise.
- 2.9
- As noted in the introduction, while there are some differences of whether rationality is perfect or bounded, the study of economics or optimization problems generally assumes reactions of humans as the best decision. This is because most researchers intend to examine why cooperation emerges and develops under the best decision. Naturally, when all players make their best decision, they reach the state where all players defect one another in the PDG. This situation is referred to as “Nash equilibrium”, and is undesirable because they have a chance to get higher payoff. Therefore, with the best decision, mutual cooperation would not develop without additional factor which controls either the range of interaction or the decision of player.
- 2.10
- The factors to escape from Nash equilibrium are tag method (Riolo 1997; Hales 2000; Riolo 2001), network reciprocity (spatial structure) (Nowak 1992; Cao 1999; Abramson 2001; Ahmed 2002; Kim 2002; Holme 2003; Duran 2005; Vukov 2005; Cassar 2007), indirect reciprocity (Nowak 1998a; Nowak 1998b; Panchanathan 2003; Panchanathan 2004; Nowak 2005; Ohtsuki 2009) for pairwise interactions and costly punishment (Fehr 2002; Fowler 2005; Herrmann 2008; O'Gorman 2009; Rankin 2009) for group interactions. Tag method means that every player can distinguish each other by utilizing his/her identifier. A player can refer to the tag of another player and know whether he/she is cooperative or not. Network reciprocity defines neighborhood connection around players. In that configuration, players interact only with those who are directly connected. The idea of indirect reciprocity presupposes that every player wants to raise his/her reputation. Free riders (players who receive social property without any costs) cannot prevail because they have no chance to raise their status. The costly punishment means that players pay certain cost to punish free riders, which enables players to build mutual trust. This is suitable to describe advanced modern society with the establishment of law government.
- 2.11
- Among those factors, indirect reciprocity seems to be successful at the present moment. However, even the system of indirect reciprocity cannot achieve cooperation without the following conditions. First, when every player is randomly paired, players to contribute to society (altruist) increase only when their initial frequency is above the threshold. Second, altruists should be designed to interact with cooperators rather than defectors. Therefore, altruists are necessary to identify whether others are altruistic or not by evaluating opponent reputation. Thus, as indirect reciprocity really requires various conditions for establishing cooperation, it is not appropriate for all practical situations.
- 2.12
- For example, humans occasionally throw away the best choice, and adopt the second-best one to keep good relationships. In actual negotiations, settlement in purely rational solution is rare. Agreement is more likely to involve compromise. In addition, it is obvious that not reasonable decision of tendering companies causes the collusive tendering. This is because if they are fully rational, the ideal situation of mutually presenting higher values should appear and then the collusive tendering will not occur. Thus, the necessity for the research of non-optimal response has been gradually recognized. Here, we should note that the model with above each factor is not appropriate for the expression of decision with compromise. Considering those backgrounds, the recent theoretical researches are likely to adopt except the best decision, i.e., the altruistic decision (Ohdaira 2006; Ohdaira 2007) or the second-best decision (Rietveld 2007; Boergers 2009; Ohdaira 2009). They compare those non-optimal responses with the optimal one and also investigate each property. It has emerged as a new trend for the study regarding social conflicts.
- 2.13
- In our research, considering that trend, we introduce the second-best decision (Ohdaira 2009) (see Figure 3). The actual procedure of the second-best decision is as follows. If one group adopts the second-best decision, it always selects the strategy of the second grade as its representative strategy for the evolutionary process. If all strategies have the same grade, one strategy is arbitrarily chosen as the representative. Note that the altruistic decision (Ohdaira 2006; Ohdaira 2007) is also the decision with compromise, and has the concept that every group makes his/her decision without bias excluding the highest payoff strategy. That is, he/she arbitrarily selects his/her representative strategy from the second to the bottom grade (see Figure 4). This is suitable for the expression of very strong collusion, but is not the decision to attempt to make some profit. On the other hand, the second-best decision is aimed at earning profits with certain amount of compromise. Therefore, we can denote that the second-best decision is more practical than the altruistic decision in the point of the extent of compromise.
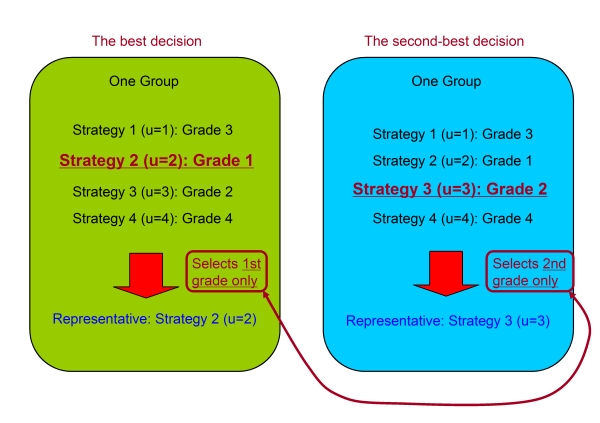
Figure 3. Comparison between the best (optimal) decision and the second-best decision 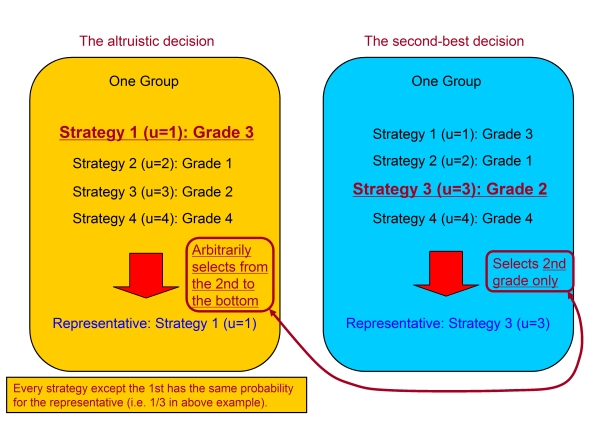
Figure 4. Comparison between the altruistic decision and the second-best decision Detail of the model
- 2.14
- Above description is mainly the explanation for the PDG with sequential strategy between two groups. We extend the match of two groups to spatial game in this research. Each group located in every node of network plays matches against opponent groups in turn. Because every group does not play against all other groups, he/she cannot recognize how the decision is collectively made. However, through matches with directly related opponents, it is possible to grasp the population trends indirectly with time difference.
- 2.15
- In the first place, we detail the spatial extension of the PDG with sequential strategy as follows (also see Figure 5). First, we build two-dimensional network with N nodes that is referred to as β graph or locally connected ring (Watts 1998; Watts 1999), and assign one group to each node. The number of strategies of each group equals n, and the length of strategy is L corresponding to the number of bouts. We denote the average connectivity as C_avg, which is usually referred to as the average degree in the research of spatial network. The structure of the group is the same as the two-group model.
- 2.16
- We describe the framework of the spatial PDG with sequential strategy in the following. Taking Figure 5 as the example, at first the group 1 plays the PDG with sequential strategy against the group 2, 3, 9 and 10. In all matches, they mutually utilize each no.1 ( u =1) strategy. Then, the group 2 plays the game against the group 3, 4, 10 and 1 utilizing each strategy of u =1. Other groups play the game as well. In the following rounds, every group utilizes the no.2, 3, … ,n strategy in turn.
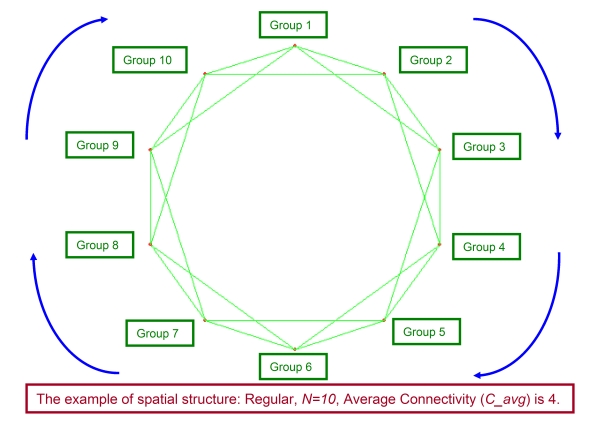
Figure 5. Demonstration of the spatial PDG with sequential strategy for regular, N=10, Average Connectivity ( C_avg) is 4 - 2.17
- The types of topology of network showing relationships of groups are as follows; the regular, the random and the scale-free. The idea regarding the randomness of network is based on the Watts' study (Watts 1998; Watts 1999). That is, the randomness is given by the probability P. If P equals 0, we can classify the network as the regular. As P increases, the disorder of network gets larger. When P reaches to 1.0, the structure of network becomes completely random (the random network). Therefore, the probability P means how the network rewires every edge in comparison with the regular, i.e., all groups change their connections to others with the probability P from the state of order (see Figure 6 above, P=1.0, N=50, C_avg=8).
- 2.18
- The construction of the scale-free network follows to the procedure of the BA model (Barabasi 1999). We can generate a theoretical model of the scale-free network employing following two processes, i.e., growth and preferential attachment. For the growth, initially we prepare m0number of nodes, and then continuously add one node with m (≤ m0) number of edges to the network. Note that this process of new connections does not duplicate existing edges. The preferential attachment means that this new connection is based on the probability corresponding to each connectivity of existing nodes. We can express this probability Π(ki) that newly added node connects to the node i with connectivity ki as the following equation (3). Thus, this method aims at modelling continuously growing network. However, in our study, for the comparison with the regular and the random, the growth halts when the number of all nodes reaches N (in the case of N =50 and C_avg=8, m0=9 and m=4, also see Figure 6 below).
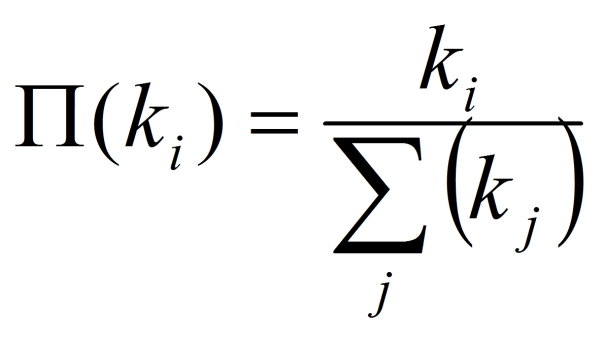
(3) 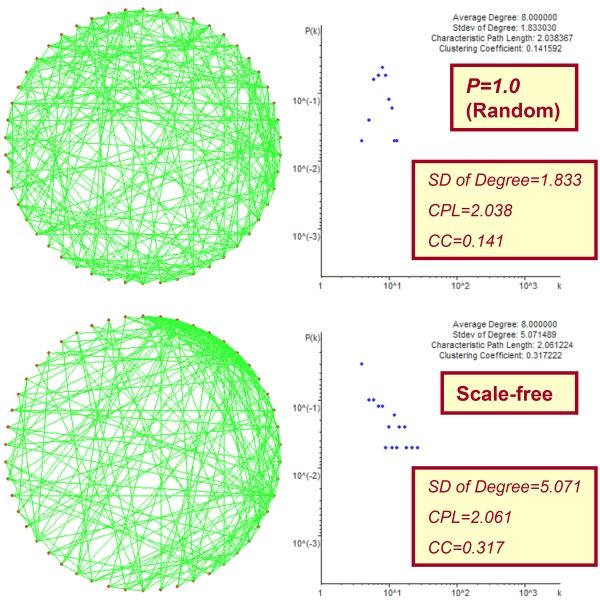
Figure 6. Demonstration of constructed networks of N=50, C_avg=8. The above figure shows the case of the random, and the below exhibits the scale-free structure. We also designate each property of networks in the right graph, i.e., degree distribution, average degree ( C_avg), SD of degree, characteristic path length ( CPL) and clustering coefficient ( CC) - 2.19
- As noted before, groups who have direct connections with edges mutually play games. When specifically expressed, in the u -th round all groups face others with relationships utilizing their u -th strategies. The rounds are the first, second, third... and then the n -th is the last round. Every group plays against all neighborhoods and at the end actualizes utilizing all resulting values of payoff. We can numerically express the averaged payoff of each strategy of the group i, i.e., Pij (u) at the generation g with the equation (4) utilizing the equations (1) and (2). The number of edges of the group i is Ei and the collection of his/her opponent groups is Oi. This averaged payoff of the strategy is first brought to the group in the end of round against all neighborhoods. Until then, each group cannot know the payoff of his/her strategy. Note that the Pij (u) is rounded off to the first decimal place and then saved as an integer value in the program code.
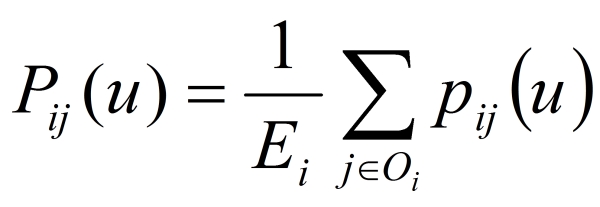
(4) - 2.20
- After whole groups finish their all matches of the PDG with sequential strategy, they separately make the decision, i.e., select their representative strategies. As described before, in the PDG with sequential strategy, different from the iterated PDG, every group does not explicitly refer to past strategies of others. However, each group can recognize the direction of others as the informed payoff, and it is certainly reflected in the decision. All groups somewhat restrain their desire to get higher payoff and decide their representative strategies with the second-best decision. Then, each group generates new n strategies of next generation. We refer to both the decision and the evolution of strategy as the evolutionary process again. Through the evolutionary process, all groups update their strategies and are ready for matches of next generation. We define a set of procedures followed by the match, the decision and the evolutionary process as one generation. Then, to grasp general characteristics of system, one simulation lasts until the number of generations reaches to 1,000. All results exhibited later are the average from 30 runs of simulation.
Results
- 3.1
- We first determine whether the second-best decision actually establishes cooperation between groups. In addition, it is examined how changes in the structure of network (topology) affect every average frequency of mutual defection and cooperation between groups. As noted in the detail of the model, our study adopts three different types of topology, which are the regular, the random and the scale-free. For the following descriptions, firstly we define the original parameters as ( C_avg=8, n=8, L=10, N=50), and will compare results of other parameters with this original case. Every average frequency of all figures shows the average times of mutual defection or cooperation regarding all groups. We can also find each average rate of mutual defection or cooperation by dividing those frequencies with the length of the strategy L.
- 3.2
- Figure 7 shows the results of simulation up to 1,000 generations with original parameters. We can see from the results that the average frequency of mutual defection is roughly low (a) and every system reaches to highly cooperative state at the last generation in all types of topology (b). Contemplating the results, there seems no apparent difference among the regular, the random and the scale-free. However, in the scale-free, the average frequency of mutual cooperation in intermediate generations is a little larger than other cases. For example, investigating each average frequency of mutual cooperation from 300 to 400 generations, that value for the regular is 6.68±0.098 and that for the random is 6.69±0.094, while that of the scale-free exhibits 6.78±0.085. Therefore, we cannot state that there is a significant difference in each value; however, certainly the value of the scale-free is slightly higher than others. Interestingly, in all cases, the average frequency of mutual defection becomes beyond the average frequency of mutual cooperation at initial (until 50) generations. However, the average frequency of mutual cooperation increases shortly and then exceeds the average frequency of mutual defection.
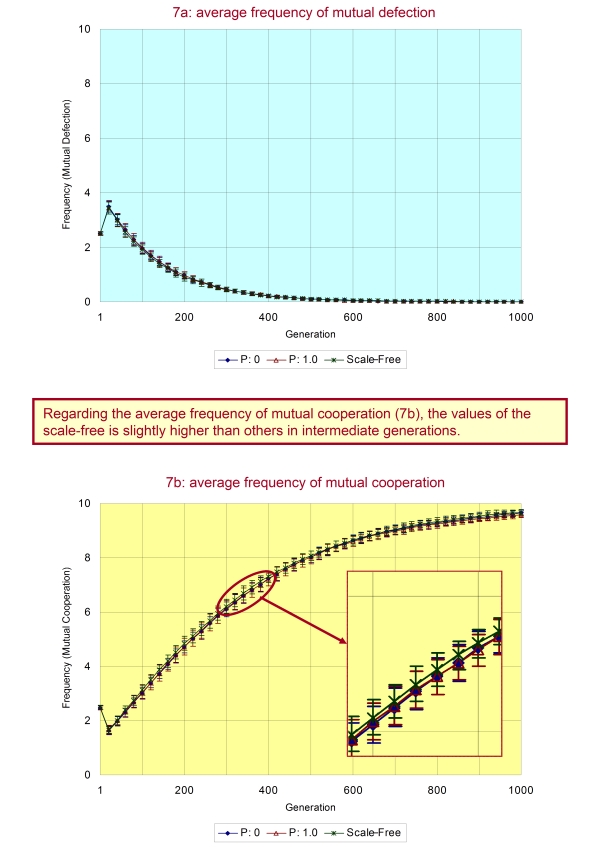
Figure 7. This figure shows the dependence of the average frequency of mutual defection (a) and cooperation (b) on three types of topology - 3.3
- Why that phenomenon happens can be explained as follows. First, in initial generations, strategies of each group are not so uniform. And because the second-best decision includes the pursuit of some profit, the average frequency of mutual defection temporarily increases. As the generation proceeds, similarity between strategies of groups progresses through the evolutionary process. By this mechanism, the second-best decision gradually works well, and the average frequency of mutual cooperation starts to increase because all groups do not pursue their immediate interests.
- 3.4
- To indicate that this explanation is correct, we proceed to further examination. We employ both the regular and the scale-free for this theme. We perform the experiment introducing following five types of parameters:
- The original parameters shown above ( C_avg=8, n=8, L=10, N=50),
- only the average connectivity is half ( C_avg=4),
- only the number of strategy is half ( n=4),
- only the length of strategy is enlarged three times ( L=30) and
- only the number of groups is enlarged four times ( N=200).
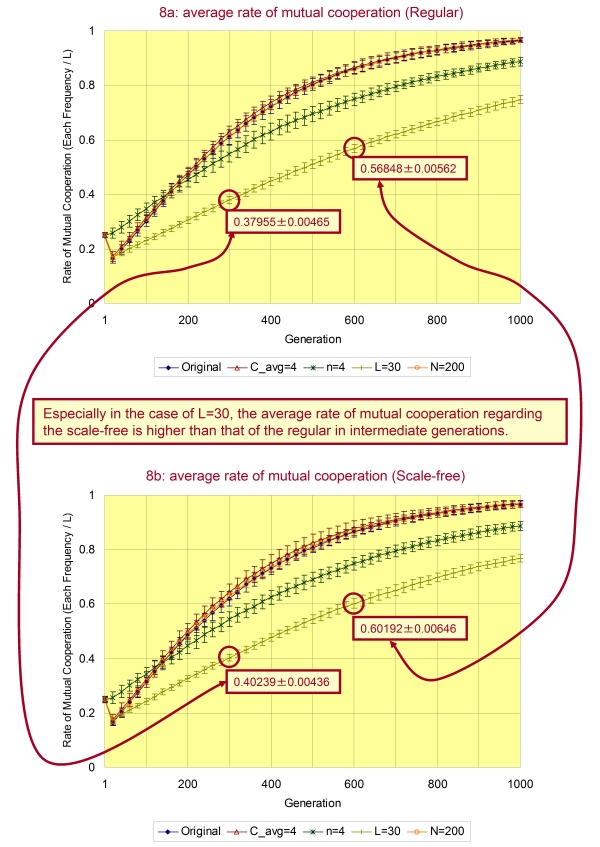
Figure 8. Every average frequency of mutual cooperation regarding five different parameters in the regular (a) and the scale-free (b) - 3.5
- On the other hand, in the case of L=30, the evolution of cooperation is slower than all cases (Original, C_avg=4, n=4 and N=200) in both the regular and the scale-free. This trend is the same as the former study (Ohdaira 2009), which shows that the decline of mutual cooperation occurs when the strategy lengthens. Here, we should note that the average rate of mutual cooperation regarding the scale-free is higher than that of the regular in intermediate generations. The difference is significant with the level of 0.05 as shown in Figure 8. Therefore, we can state that the facilitative effect of the scale-free structure on mutual cooperation works better in long length of strategy.
- 3.6
- In addition, when halving the number of strategies ( n=4), we seldom see both the decline of mutual cooperation and the increase of mutual defection in early generations for each topology. Because the fewer number of strategies reduces variations of strategies and increases similarity, suppressive effect of the second-best decision for near future profit works well from initial generations. That is, the increase in similarity between strategies effectively facilitates cooperation. This result shows the validity of the former explanation.
- 3.7
- However, looking carefully at Figure 8 again, we can see that the average frequency of mutual cooperation of the case of n=4 in the last generation is lower in comparison with the original value. Moreover, that difference is significant. This is because similarity between strategies works in reverse. When the system reaches around the last generation, strategies of each group are nearly identical. The evolutionary process effectively rewrites strategies at this stage when groups have many strategies since they are not completely the same. While in case with small number of strategies, similarity between strategies of groups increases and also strategies change little through the evolutionary process. Then, in the case of small n, the evolution of strategies around the last generation generally depends on the mutation of very low probability. Therefore, the system having small n leads to the slow evolution of cooperation. Note that even in above two cases ( L=30 and n=4) whole groups eventually converge into the state of almost complete cooperation when the number of generations is tripled (i.e. from 1,000 to 3,000).
Discussion
-
Time series fluctuation of each frequency (with the original structure of scale-free)
- 4.1
- From above results, we have thought that it is necessary to determine how each group varies every average frequency of mutual defection and cooperation in time series especially in the case of the scale-free. By investigating this, we can find whether all groups accordantly vary every frequency or there are some groups which behave differently from the whole. This investigation employs the following parameters ( C_avg=8, n=8, L=30, N=50), which the difference between the regular and the scale-free in facilitation of cooperation emerges as shown in Figure 8. In the actual experiment, we first extract some groups according to their connectivity, and construct two parties. Then, we probe each average frequency of mutual defection (D) and cooperation (C) between every party. The classification of parties is as follows; 1: groups with the smallest number of edges (D_Min, C_Min), 2: groups with the largest number of edges (D_Max, C_Max). Certainly, in addition to those, we also exhibit the behavior of every average frequency of all groups (D_All, C_All).
- 4.2
- We show the result of this investigation in Figure 9. This figure is extracted four simulation runs of all 30 times within initial (up to 100) generations. The reason why not finding the average of all simulation runs is because it causes the difficulty in determining the difference of every frequency between parties. That is derived from the fact that the evolution of strategy is quite different between each simulation run because strategies of the first generation are always randomly initialized. Contemplating the result, as the overall trend, groups with the minimum connectivity gradually reduce the average frequency of mutual defection. On the other hand, those groups steadily increase the average frequency of mutual cooperation. Also, D_Min and C_Min are nearly equal to D_All and C_All respectively due to the property of the scale-free structure (i.e. the number of groups with the minimum connectivity is quite large). As the evolutionary process increases similarity between strategies of groups, D_Min and D_All decrease after initial generations, while C_Min and C_All increase as noted in the description of Figure 8.
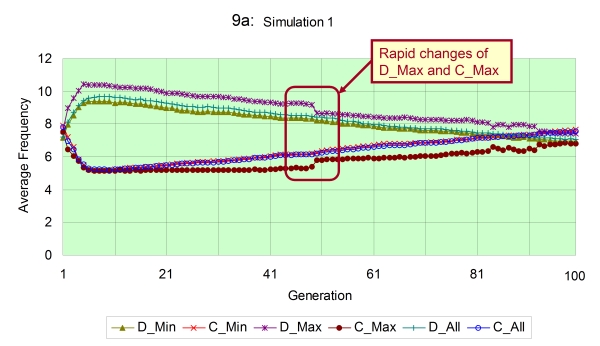
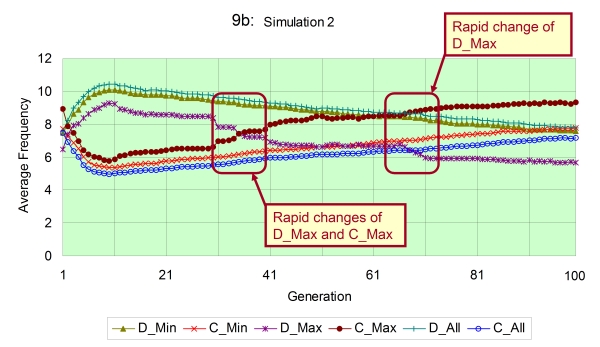
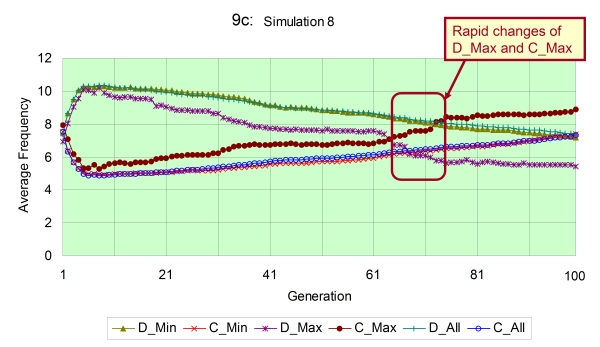
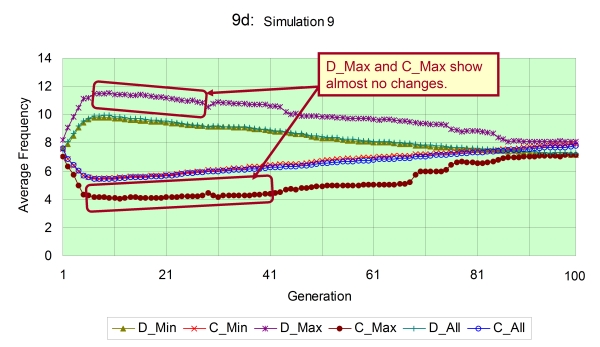
Figure 9a - d. Each average frequency regarding 3 categorized parties of groups in the scale-free network with following parameters ( C_avg=8, n=8, L=30, N=50) - 4.3
- However, interestingly, groups with the maximum connectivity indicate the different behaviour from all other groups. Those groups of maximum connectivity basically do not move in conjunction with all population, and show no change until they experience some generations, which is especially observed in the simulation no.9 (9d). As remarkably seen in no.1 (9a) and 8 (9c) simulations, groups with the maximum connectivity rapidly increase C_Max and contrarily reduce D_Max when the difference between values of C_All and D_All becomes near 2. Looking at those trends, groups with the maximum connectivity are likely to play a role figuring out which direction the entire population evolves to (either defection or cooperation). Groups of the maximum connectivity do not change their frequency any more until the system decides the direction of evolution. However, considering that they rapidly change their frequency once the system determines the direction, we can state that they supervise the settlement of decision among most groups.
Discussion on the analogy between the presented model and the actual tendering
- 4.4
- In this section, we discuss the issue that the presented model is analogous to what phenomenon in the real world. Our research proposes that humans actually do not make the best decision in all cases and there are some situations of employing the second-best decision. Then, we utilize the PDG with sequential strategy rather than the iterated PDG and extend it from the match limited in two groups to multiple matches with many groups. In the following descriptions, we state that this extended spatial PDG with sequential strategy is analogous to the tendering recently dispensed in Japan. We explain our notice regarding that issue.
- 4.5
- We think that the bid-rigging problem is derived from the situation that tendering companies try to secure their profit, rather than radically compete with each other. The decision of tendering companies generally has some compromise than the best decision. Therefore, we can interpret collusive tendering as mutual cooperation with those companies with the second-best decision. As you may know, researchers have already attempted theoretically to approach the mechanism resulting in collusive tendering utilizing auction theory (Graham 1987; McAfee 1992), game theory (Tanimoto 2003) and experimental economics (Saijo 1996). However, there have been no former studies taking the sentiment of tendering companies with compromise into account.
- 4.6
- Here, firstly we create the abstracted tendering game based on the actual tendering in Japan when the government dispenses the tendering to sell its asset. In the basic configuration of that tendering, bidders individually present their propositions for multiple tendering properties in single bid. Considering the estimated market price for each subject (Price of assumption: a), bidders can present similar amount which seems to be profitable and their opponents probably submit as well (Price of safety: s). They can also strategically present higher amount (Price of challenge: c) than others. When we regard to present higher amount as “strategically outwitting opponent (Defection)” and also to present expected similar amount to others as “proposing the same amount as opponent (Cooperation)”, we can simplify the tendering strategies and treat the tendering as a game for the 2×2 payoff matrix (see Figure 10 and Table 1).
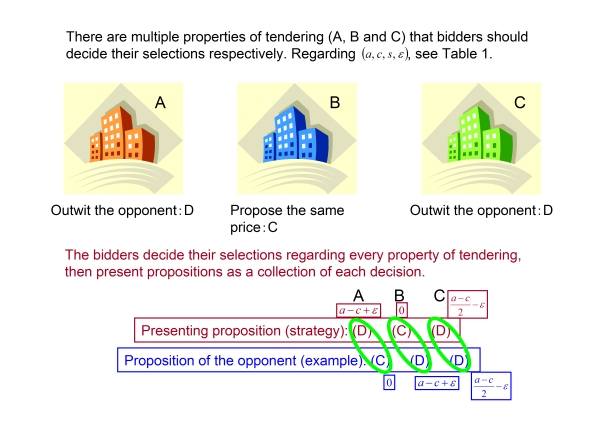
Figure 10. Illustration regarding the practice of the tendering game - 4.7
- Payoff of this game is given in the following way (also see Table 1). When a bidder can outwit his/her opponent unilaterally, he/she gains the highest payoff because of the expected acquisition of the property. In this case, he/she has additional points ε for the successful challenge, and then his/her payoff will be a-c+ ε. In the case of the same choice of each other, either he/she or the other has the property with equal probability. In this situation, by presenting strategic price, ε is imposed as a penalty when it failed. Thus, presenting similar amount of the other is preferable because of low loss. When he/she is completely outwitted, his/her payoff is zero and he/she cannot get anything. As there are several properties for tendering, his/her actual payoff is finally for the sum of the individual payoff of each property. Taking Figure 10 as the example, the payoff of the proposition (=strategy) for the opponent can be found as follows:(a-c+ε)+0+{(a-c)/2-ε}=(a-c)/2. When we set those parameters(a, c, s, ε)=(10, 6, 4, 1), the payoff matrix is completely the same as A in the equation (2) and we can employ the knowledge of this study for the analogy to the real tendering. Note that it is essential for reproducing this specific situation that bidders set values to various properties of tendering at once. Therefore, it is impossible to employ the framework of general iterated PDG because it cannot treat multiple times of decisions at one match.
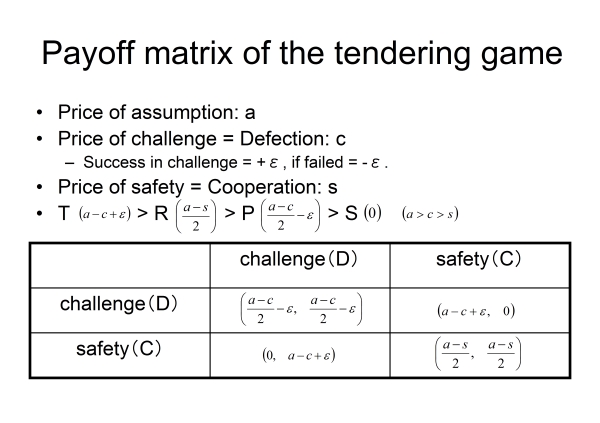
Table 1. Payoff matrix of the tendering game - 4.8
- Secondly, utilizing the presented model, we represent groups as bidders (business companies) on each node of two-dimensional network of relationships. Bidders play matches between bidders who are directly related only. Each bidder presents different strategies for n rounds (corresponding to the number of strategies n), and knows every average payoff in the end of round against all neighborhoods. Matches between groups of relationships can be recognized as channeling intent of groups because they can acquire some information from matches as resulting averaged payoff of each strategy. We can assume the above scenario as the framework that bidders can repeatedly submit their tendering propositions in fixed terms like the internet auctions. His/Her strategy contains values for each property (the L number of tendering properties, corresponding to multiple choices of D or C regarding each bout). They make the second-best decision after finishing all matches. In this framework of tendering, as the government conducting the tendering intends to sell its asset with making much more profit, it wishes for the situation where bidders mutually propose higher amounts for all L number of tendering properties (which corresponds to the situation of mutual defection in L times for the PDG with sequential strategy).
- 4.9
- However, in the reverse of what the government expects, bidders eventually reach the state of collusion, i.e., high level mutual cooperation as shown in the previous result (see Figure 7). Construction of this state is hardly affected by the topology of network. On the other hand, relationships of the scale-free structure effectively enhance collusion when the number of tendering properties (= the length of strategy, L) is large. The increase of similarity between strategies (decrease in the number of strategies n) also has an effect on the promotion of collusion in early generations (see Figure 8). However, it induces slow evolution of collusion because of that similarity as well.
Comparison to existing studies of spatial game and collusion
- 4.10
- In this section, we describe the position of our work in comparison with previous studies based on physics and theoretical works of collusion. We first compare the findings obtained in past researches on spatial game with the results of our study. Generally in the case of multiple opponent groups, relationships of groups are usually defined by two-dimensional network (Nowak 1992; Cao 1999; Abramson 2001; Ahmed 2002; Kim 2002; Holme 2003; Duran 2005; Santos 2005; Vukov 2005; Santos 2006; Ohdaira 2006; Cassar 2007; Perc 2008; Santos 2008) like our study. It has been previously revealed that the difference in the density and topology regarding the network affects the existence ratio of non-cooperative player (Abramson 2001), and the small-world relationships of groups achieve cooperation most rapid (Masuda 2003). However, in those researches, types of strategy are quite limited (simply two strategies, All-C and All-D) in order to focus only on the structure of network. Moreover, the decision is basically the optimal response (best decision). Then, it has recently become common notion that the heterogeneity of network, especially the scale-free structure, facilitates cooperation (Santos 2005; Santos 2006; Perc 2008; Santos 2008) as noted in the introduction. Those studies also have some simplification as seen in the payoff matrix, where temptation to defect takes the value between 1 and 2 (1≤T≤2), R=1 and P=S=0. They introduce the optimal response as well. Of course, as noted in the introduction, coevolution between strategy and structure has also proved to be effective for the promotion of cooperation (Ebel 2002; Zimmermann 2004; Pacheco 2006; Poncela 2009; Szolnoki 2009; Van Segbroeck 2009; Perc 2010).
- 4.11
- Unlike those studies, our research has more complex form of strategy. However, as previous studies, we also obtain the result that the relationships of the scale-free structure effectively promote mutual cooperation in the case of large L. This effect is almost unaffected by changes in the density of relationships or the number of total groups. On the other hand, the extent of facilitation of cooperation is smaller than previous studies with optimal response, and also little changes occur by the stochastic perturbation to relationships. We can assume that this is because there is no direct reference to other representative strategies between groups. The effect of inter-group reference is our future work.
- 4.12
- Second, regarding the research which deals with the corruption in the tendering, there have already been some theoretical studies as we described in the previous section. However, we can find no former studies introducing the second-best decision for the expression of the sentiment of collusive bidders. When talking on the structure of typical business relationships, it has proved to be the small world (Kogut 2001;Davis 2003). However, because our study shows that the small world has little effect for mutual cooperation (collusion), we consider that the actual relationships between bid-rigging companies are rather close to the scale-free. In other words, we can assume that the relationships between collusive firms have few groups conducting collusion like hub nodes. Actually, previous studies (Saijo 1996; Tanimoto 2003) indicate that the existence of some companies organizing collusive tendering is necessary for efficient construction of collusion. We also observe the process that the hub groups ascertain the trend of population and then those groups lead the all after the whole direction of decision determines. It is quite interesting that it becomes clear that those hubs play that function while we do not give them an explicit role of the leader of collusion.
Comparing knowledge of social science studies with that of physics based researches
- 4.13
- As our study is basically founded on the physical point of view, we have not addressed the knowledge of social science studies. Then, in the following we exhibit some formal modelling papers in the literature that draw heavily on social science theory and empirical examples from specific application areas. We also describe the correlation of obtained knowledge between those studies and researches of physics.
- 4.14
- Raub and Weesie (Raub and Weesie 1990) compare the systems between “atomized interactions” (without receiving information on their partners' behaviour) and “perfectly embedded” (immediately receiving information) excluding effects of reputation. It shows that efficiency is more easily attained as a result of individually rational behaviour in perfectly embedded systems. We think this discussion is similar to the system with costly punishment in group interactions (Fehr 2002; Fowler 2005; Herrmann 2008; O'Gorman 2009; Rankin 2009) because in such system whether punishing others or not is based on information of their past acts. Our model can be classified as the atomized interactions at present because of no inter-group reference to other representative strategies. The study (Macy 1993) is also the same discussion as costly punishment, and experiments the ability of various sanctioning regimes to generate cooperation as well as resist stampedes that risk over cooperation and needless sacrifice. It shows that external moral sanctions produce too little cooperation, while internalized sanctions produce too much.
- 4.15
- The research (Oliver and Marwell 1988) shows that the positive effects of group size increase with group heterogeneity and non-random social ties. Buskens' study (Buskens 1998) derives hypotheses on the effects of density, outdegree centrality, and centralization on the level of trust. It concludes that higher density and outdegree induce more trust, and that centralization increases trust if it is “well organized”, i.e., actors who can place more trust are central in the network. Chwe's study (Chwe 1999) employs the scenario that each person in a group is completely rational and wants to participate only if the total number of participants is at least his/her threshold. It shows that position of network is much more crucial in affecting the revolt of people with low thresholds than those with high ones. Gould's research (Gould 1993) constructs a mathematical model describing the relationship between individual contributions to a collective good and the network of social relations making these contributions interdependent. It shows that network density and size differently influence collective action outcomes, depending on the structural position of those who make unconditional contributions.
- 4.16
- We can state from the aspect of physics study that the research (Oliver and Marwell 1988) and Buskens' research (Buskens 1998) correspond to the fact that hub nodes in the scale-free relationships facilitate cooperation (Santos 2005; Santos 2006; Perc 2008; Santos 2008) because those are also centralized and that structure is “well organized”. As our study has no direct reference to strategies of others, facilitative effect of the scale-free is relatively smaller than those previous researches as shown in the results. The research (Gould 1993) and Chwe's study (Chwe 1999) are similar to the knowledge of Kim et al. (Kim 2002) that introduces an influential node (defector) for dynamic instability.
- 4.17
- Macy (Macy 1991a) introduces a learning-theoretic specification for a structural analysis, and shows that threshold effects may be the key to solving the coordination problem. When individual choices are contingent on participation by others, this interdependence facilitates the coordination of contributions needed to shift the bistable system from a noncooperative equilibrium to a cooperative one. These chain reactions require bridges that link socially distant actors in networks with low-density. We can assume that this study offers the same knowledge as the facilitative effect of the small world (Watts 1999; Masuda 2003) because we can address “bridges” as short-cuts by rewiring for the small world network. Also, Macy's research (Macy 1991b) reformulates the Prisoner's Dilemma as a stochastic learning model in which the behaviour of interdependent actors is continually shaped by sanctions and cues generated by their interaction. It shows that how the effects of network size, density, mobility, and anonymity derive from a fundamental principle of collective action, that is, the need to reduce the number of choices that must be fortuitously coordinated in order to escape noncooperative equilibrium. We have demonstrated in the results that the small length of strategy ( L=10, i.e. a few choices) enhances cooperation than the case of large L ( L=30, i.e. many choices). This outcome is similar to above description of the necessity for cooperation that the number of choices accidentally coordinated to escape defection should be reduced.
Conclusion
- 5.1
- In this research, utilizing the model of spatial agent based simulation, we have studied the property of cooperation based on the second-best decision (i.e. some compromise). This model is also the motif of the actual bid recently dispensed in Japan and represents the sentiment of bidders when collusion occurs. Our model utilizes the spatial PDG with sequential strategy, and its features are summarized as follows. First, groups corresponding to bidders have partial relationships which are denoted as two-dimensional network. Second, all groups play the spatial PDG with sequential strategy to each opponent group of relationships.
- 5.2
- The main characteristic of the spatial PDG with sequential strategy is that the strategy has no restriction in its variety, and evolves as the generation proceeds. Each group can know opponents' direction of decision implicitly by payoff informed at the end of every round. We express relationships of groups as various types of network (with the same average connectivity). When every group with some strategies plays the spatial PDG with sequential strategy and makes his/her second-best decision over some generations, we observe mutual cooperation (i.e. collusive tendering).
- 5.3
- It turns out by further inspection that in the scale-free network the average frequency of mutual cooperation increases faster than the regular case when the length of strategy L is large. The trend that the evolution of mutual cooperation becomes slower when strategy lengthens is the same as the one observed in the model of two groups (Ohdaira 2009). It is also implied that the scale-free structure universally has an effect on the promotion of cooperation, because changes in the density of relationships and the total number of groups almost do not affect that facilitative effect. This result corresponds with the obtained knowledge of some researches utilizing simpler game mechanism (Santos 2005; Santos 2006; Perc 2008; Santos 2008). On the other hand, similarity between strategies increases when we reduce the number of strategies of groups. In this case, the settlement of the collective direction becomes premature, while the rate of evolution of mutual cooperation gets slower.
- 5.4
- In addition, the major difference is as follows when addressing our work from the point of view of studies dealing with collusion. While the applied research of game theory (Tanimoto 2003) has added the profit obtained by collusion to the payoff matrix, we think the cause of collusion comes from the decision of bidders. As stated in the discussion, we believe that collusion occurs because bidders do not gain excessive profit and they focus on relationships with other companies. Benefits of maintaining relationships with someone are more natural to express as decision in our study rather than prescribed payoff matrix. With regard to the prevention of collusion, we think it to be effective that the government agency supervises companies of tendering not to construct the hub (leader of collusion), or makes bidders present their propositions over and over again. The latter corresponds to the increase in the number of strategies ( n), and we can expect that this generates the reverse effect from the case of decreasing n (see Figure 8). From the results of previous research (Ohdaira 2009), we think that the effective value of n for suppressing cooperation (collusion) is 32 or larger. In the future, we especially proceed to further examination regarding the issue of whether stochastic perturbation produces differences in results when the mechanism of inter-group reference to other representative strategies is available.
Acknowledgement
- We thank anonymous referees and also all laboratory members for their constructive comments and suggestions.
Note
- Further information and model code are available from the first author and Windows® executable version can be downloaded.
Appendix: pseudo code regarding main routine
-
Function Main:
Start:
  // Starting simulation.
  for number_of_generations (<= 1,000):
    // Executing all matches.
    for rounds (<= number_of_strategies, n):
      for group_id (<= number_of_groups, N):
        Play_Match (rounds, group_id):
      end for:
    end for:
    // Executing evolutionary process.
    for group_id (<= number_of_groups, N):
      Update_Strategy (group_id):
    end for:
  end for:
End:

Function Play_Match (Rounds, Group_ID):
Start:
  // Every group plays the PDG with sequential strategy against his/her opponent groups
  // mutually utilizing each strategy of the same id.
  // The number of total game is equal to the number of opponent groups.
  // The number of opponent groups is all the same (regular) or
  // varies following the structure of relationships (random, scale free).
  // Initializing the number of opponent groups
  number_of_opponent_groups = 0;
  // This group matches the group(s) of direct relationship(s).
  for group_id (<= number_of_groups, N)
    if (the group of group_id has direct relationship with this group) then:
      number_of_opponent_group = number_of_opponent_group + 1;
      opponent_group_id = group_id;
      // Starting the match of the PDG with sequential strategy
      for bouts (<= length_of_strategy, L):
        if Strategy[Group_ID][Rounds][bouts] == D and
         Strategy[opponent_group_id][Rounds][bouts] == C then:
          Score[Group_ID][Rounds]
           = Score[Group_ID][Rounds] + 5:
        end if:
        else if Strategy[Group_ID][Rounds][bouts] == C and
         Strategy[opponent_group_id][Rounds][bouts] == C then:
          Score[Group_ID][Rounds]
           = Score[Group_ID][Rounds] + 3:
        end else if:
        else if Strategy[Group_ID][Rounds][bouts] == D and
         Strategy[opponent_group_id][Rounds][bouts] == D then:
          Score[Group_ID][Rounds]
           = Score[Group_ID][Rounds] + 1:
        end else if:
        else:
          Score[Group_ID][Rounds]
           = Score[Group_ID][Rounds] + 0:
        end else:
      end for:
    end if:
  end for:
  // Final score regarding the strategy of this group is the average of all matches.
  // Note that each score is rounded off to the first decimal place and then
  // saved as an integer value.
  Score[Group_ID][Rounds]
   = Score[Group_ID][Rounds] / number_of_opponent_groups:
End:

Function Update_Strategy (Group_ID):
Start:
  // This group grades all strategies by their score.
  Grade_Strategy:
  // He/She selects the strategy of the second grade as the representative strategy,
  // and also decides the representative strategy ID.
  representative_strategy_id = strategy_id (of the second grade strategy):
  // Note that both values of the length_of_fraction_1 (Lf1) and
  // the length_of_fraction_2 (Lf2) are randomly changes in every step.
  // The Lf1 and the Lf2 are less than L. The Lf1 is also smaller than the Lf2.
  // This group partly duplicates the representative strategy to every strategy.
  for number of strategies (<= n, except the representative strategy ID):
    for bouts_1 (<= Lf1):
      Strategy[Group_ID][number of strategies][bouts_1]
       = Strategy[Group_ID][representative_strategy_id][bouts_1]:
    end for:
    for bouts_2 (Lf2 <= bouts_2 <= L):
      Strategy[Group_ID][number_of_strategies][bouts_2]
       = Strategy[Group_ID][representative_strategy_id][bouts_2]:
    end for:
  end for:
  // This group executes the process of mutation for every strategy.
  for number_of_strategies (<= n):
    for bouts (<= L):
      if (a value randomly generated is over the threshold) then:
        if Strategy[Group_ID][number_of_strategies][bouts] == C then:
          Strategy[Group_ID][number_of_strategies][bouts] = D:
        end if:
        else:
          Strategy[Group_ID][number_of_strategies][bouts] = C:
        end else:
      end if:
    end for:
  end for:
End:
References
-
ABRAMSON, G and Kuperman, M (2001) Social games in a social network. Phys. Rev. E, 63, 030901. [doi:10.1103/PhysRevE.63.030901]
AHMED, E, Hegazi, A S and Elgazzar, A S (2002) On spatial asymmetric games. Advances in Complex Systems, 5, pp. 433-443. [doi:10.1142/S0219525902000614]
AXELROD, R (1984) The Evolution of Cooperation. Basic Books, New York.
BARABASI, A L and Albert, R (1999) Emergence of scaling in random networks. Science, 286, pp. 509-512. [doi:10.1126/science.286.5439.509]
BOERGERS, T and Postl, P (2009) Efficient compromising. Journal of Economic Theory, 144, pp. 2057-2076. [doi:10.1016/j.jet.2009.01.011]
BUSKENS, V (1998) The social structure of trust. Social Networks, 20, pp. 265-289. [doi:10.1016/S0378-8733(98)00005-7]
CAO, Z and Hwa, R C (1999) Phase transition in evolutionary games. Int. Jour. Mod. Phys. A, 14, pp. 1551-1560. [doi:10.1142/S0217751X99000786]
CASSAR, A (2007) Coordination and cooperation in local, random and small world networks: Experimental evidence. Games and Economic Behavior, 58, pp. 209-230. [doi:10.1016/j.geb.2006.03.008]
CHEN, X, Fu, F and Wang, L (2007) Prisoner's dilemma on community networks. Physica A, 378, pp. 512-518. [doi:10.1016/j.physa.2006.12.024]
CHWE, M S-Y (1999) Structure and strategy in collective action. American Journal of Sociology, 105, pp. 128-156. [doi:10.1086/210269]
DAVIS, G F, Yoo, M and Baker, W E (2003) The small world of the American corporate elite, 1982-2001. Strategic Organization, 1, pp. 301-326. [doi:10.1177/14761270030013002]
DREBER, A, Rand, D G, Fudenberg, D and Nowak, M A (2008) Winners don't punish. Nature, 452, pp. 348-351. [doi:10.1038/nature06723]
DURAN, O and Mulet, R (2005) Evolutionary prisoner's dilemma in random graphs. Physica D, 208, pp. 257-265. [doi:10.1016/j.physd.2005.07.005]
EBEL, H and Bornholdt, S (2002) Coevolutionary games on networks. Phys. Rev. E, 66, 056118. [doi:10.1103/PhysRevE.66.056118]
FEHR, E and Gaechter, S (2002) Altruistic punishment in humans. Nature, 415, pp. 137-140. [doi:10.1038/415137a]
FOWLER, J H (2005) Altruistic punishment and the origin of cooperation. Proc. Natl. Acad. Sci. U.S.A., 102, pp. 7047-7049. [doi:10.1073/pnas.0500938102]
GOULD, R V (1993) Collective action and network structure. American Journal of Sociology, 58, pp. 182-196. [doi:10.2307/2095965]
GRAHAM, D and Marshall, R (1987) Collusive bidder behavior at single-object second-price and English auctions. Journal of Political Economy, 95, pp. 1217-1239. [doi:10.1086/261512]
HALES, D (2000) Cooperation without space or memory: tags, groups and the prisoner's dilemma. In Multi-Agent-Based Simulation, Lecture Notes in Artificial Intelligence, 1979, Berlin, Springer-Verlag, pp. 157-166. [doi:10.1007/3-540-44561-7_12]
HERRMANN, B, Thoeni, C and Gaechter, S (2008) Antisocial punishment across societies. Science, 319, pp. 1362-1367. [doi:10.1126/science.1153808]
HOLME, P, Trusina, A, Kim, B J and Minnhagen, P (2003) Prisoners' dilemma in real-world acquaintance networks: Spikes and quasiequilibria induced by the interplay between structure and dynamics. Phys. Rev. E, 68, 030901(R). [doi:10.1103/PhysRevE.68.030901]
KIM, B J, Trusina, A, Holme, P, Minnhagen, P, Chung, J S and Choi, M Y (2002) Dynamic instabilities induced by asymmetric influence: prisoner's dilemma game on small-world networks. Phys. Rev. E, 66, 021907. [doi:10.1103/physreve.66.021907]
KOGUT, B and Walker, G (2001) The small world of Germany and the durability of national networks. American Sociological Review, 66, pp. 317-335. [doi:10.2307/3088882]
MACY, M W (1991a) Chains of cooperation: threshold effects in collective action. American Sociological Review, 56, pp. 730-747. [doi:10.2307/2096252]
MACY, M W (1991b) Learning to cooperate: stochastic and tacit collusion in social exchange. American Journal of Sociology, 97, pp. 808-843. [doi:10.1086/229821]
MACY, M W (1993) Backward-looking social control. American Sociological Review, 58, pp. 819-836. [doi:10.2307/2095953]
MASUDA, N and Aihara, K (2003) Spatial prisoner's dilemma optimally played in small-world networks. Phys. Ltrs. A, 313, pp. 55-61. [doi:10.1016/s0375-9601(03)00693-5]
MCAFEE, P and McMillan, J (1992) Bidding rings. American Economic Review, 82, pp. 579-599.
NOWAK, M A and May, R M (1992) Evolutionary games and spatial chaos. Nature, 359, pp. 826-829. [doi:10.1038/359826a0]
NOWAK, M A and Sigmund, K (1998) The dynamics of indirect reciprocity. J. Theor. Biol., 194, pp. 561-574. [doi:10.1006/jtbi.1998.0775]
NOWAK, M A and Sigmund, K (1998) Evolution of indirect reciprocity by image scoring. Nature, 393, pp. 573-577. [doi:10.1038/31225]
NOWAK, M A and Sigmund, K (2005) Evolution of indirect reciprocity. Nature, 437, pp. 1291-1298. [doi:10.1038/nature04131]
NOWAK, M A (2006) Five rules for the evolution of cooperation. Science, 314, pp. 1560-1563. [doi:10.1126/science.1133755]
O'GORMAN, R, Henrich, J and Van Vugt, M (2009) Constraining free riding in public goods games: designated solitary punishers can sustain human cooperation. Proc. R. Soc. B, 276, pp. 323-329. [doi:10.1098/rspb.2008.1082]
OHDAIRA, T, Ohashi, H, Chen, Y and Hashimoto, Y (2006) Partiality causes unhappiness: randomness of network induces difficulty in establishing cooperative relationship. Proc. The First World Congress on Social Simulation (WCSS06), Kyoto, Japan.
OHDAIRA, T and Ohashi, H (2007) The effect of occasional rational decision on the cooperative relationship between groups. Proc. The Twelfth International Symposium on Artificial Life and Robotics (AROB 12th '07), Beppu, Oita, Japan.
OHDAIRA, T and Terano, T (2009) Cooperation in the prisoner's dilemma game based on the second-best decision. Journal of Artificial Societies and Social Simulation, 12 (7).
OHDAIRA, T and Terano, T (2011) The diversity in the decision facilitates cooperation in the sequential prisoner's dilemma game. Advances in Complex Systems, 14 (to be published). [doi:10.1142/S0219525911002962]
OHTSUKI, H, Iwasa, Y and Nowak, M A (2009) Indirect reciprocity provides only a narrow margin of efficiency for costly punishment. Nature, 457, pp. 79-82. [doi:10.1038/nature07601]
OLIVER, P E and Marwell, G (1988) The paradox of group size in collective action. A theory of the critical mass. III. American Sociological Review, 53, pp. 1-8. [doi:10.2307/2095728]
PACHECO, J M, Traulsen, A and Nowak, M A (2006) Coevolution of strategy and structure in complex networks with dynamical linking. Phys. Rev. Lett., 97, 258103. [doi:10.1103/PhysRevLett.97.258103]
PANCHANATHAN, K and Boyd, R (2003) A tale of two defectors: the importance of standing for the evolution of reciprocity. J. Theor. Biol., 224, pp. 115-126. [doi:10.1016/S0022-5193(03)00154-1]
PANCHANATHAN, K and Boyd, R (2004) Indirect reciprocity can stabilize cooperation without the second-order free rider problem. Nature, 432, pp. 499-502. [doi:10.1038/nature02978]
PERC, M and Szolnoki, A (2008) Social diversity and promotion of cooperation in the spatial prisoner's dilemma game. Phys. Rev. E, 77, 011904. [doi:10.1103/PhysRevE.77.011904]
PERC, M and Szolnoki, A (2010) Coevolutionary games-A mini review. Biosystems, 99, pp. 109-125. [doi:10.1016/j.biosystems.2009.10.003]
PONCELA, J, Gómez-Gardeñes, J, Traulsen, A and Moreno, Y (2009) Evolutionary game dynamics in a growing structured population. New J. Phys., 11, 083031. [doi:10.1088/1367-2630/11/8/083031]
RANKIN, D J, Santos M D and Wedekind, C (2009) The evolutionary significance of costly punishment is still to be demonstrated. Proc. Natl. Acad. Sci. U.S.A., 106, E135. [doi:10.1073/pnas.0911990107]
RAUB, W and Weesie, J (1990) Reputation and efficiency in social interactions: an example of network effects. American Journal of Sociology, 96, pp. 626-654. [doi:10.1086/229574]
RIETVELD, P and van Woudenberg, S (2007) Second-best decision making of railway operators: How to fix fares, frequency and vehicle size. Journal of Transport Economics and Policy, 41, pp. 363-385 (23).
RIOLO, R L (1997) The effects and evolution of tag-mediated selection of partners in populations playing the iterated prisoner's dilemma. Proc. the 7th Int. Conf. Genetic Algorithms (ICGA97), San Francisco, Morgan Kaufmann, pp. 378-385.
RIOLO, R L, Cohen, M D and Axelrod, R (2001) Evolution of cooperation without reciprocity. Nature, 414, pp. 441-443. [doi:10.1038/35106555]
SAIJO, T, Une, M and Yamaguchi, T (1996) Dango experiments. Journal of Japanese and International Economics, 10, pp. 1-11. [doi:10.1006/jjie.1996.0001]
SANTOS, F C and Pacheco, J M (2005) Scale-free networks provide a unifying framework for the emergence of cooperation. Phys. Rev. Lett., 95, 098104. [doi:10.1103/PhysRevLett.95.098104]
SANTOS, F C and Pacheco, J M (2006) A new route to the evolution of cooperation. J. Evol. Biol., 19, pp. 726-733. [doi:10.1111/j.1420-9101.2005.01063.x]
SANTOS, F C, Santos, M D and Pacheco, J M (2008) Social diversity promotes the emergence of cooperation in public goods games. Nature, 454, pp. 213-216. [doi:10.1038/nature06940]
SZOLNOKI, A and Perc, M (2009) Emergence of multilevel selection in the prisoner's dilemma game on coevolving random networks. New J. Phys., 11, 093033. [doi:10.1088/1367-2630/11/9/093033]
TANIMOTO, J and Fujii, H (2003) A study on the collusive tendering from the viewpoint of game theory. IPSJ SIG Technical Report, 2002-ICS-131, pp. 59-61 (in Japanese).
TRAULSEN, A and Nowak, M A (2006) Evolution of cooperation by multilevel selection. Proc. Natl. Acad. Sci. U.S.A., 103, pp. 10952-10955. [doi:10.1073/pnas.0602530103]
VAN SEGBROECK, S, Santos, F C, Lenaerts, T and Pacheco, J M (2009) Reacting differently to adverse ties promotes cooperation in social networks. Phys. Rev. Lett., 102, 058105. [doi:10.1103/PhysRevLett.102.058105]
VUKOV, J and Szabó, G (2005) Evolutionary prisoner's dilemma game on hierarchical lattices. Phys. Rev. E, 71, 036133. [doi:10.1103/PhysRevE.71.036133]
WATTS, D J and Strogatz, S H (1998) Collective dynamics of 'small-world' networks. Nature, 393, pp. 440-442. [doi:10.1038/30918]
WATTS, D J (1999) Small Worlds. Princeton University Press, Princeton, New Jersey.
ZIMMERMANN, M G, Eguíluz, V M and Miguel, M S (2004) Coevolution of dynamical states and interactions in dynamic networks. Phys. Rev. E, 69, 065102(R). [doi:10.1103/PhysRevE.69.065102]