
 Abstract
- The Internet is a public environment where people increasingly share information and exchange opinions. Not everyone can afford the costs of using the Internet, causing online opinions to be distorted in favor of certain social groups. This study examines the effect of the digital divide on opinion formation using the agent-based modeling (ABM) method. It extends the bounded confidence model to incorporate an online context and introduces accessibility and connectivity as new parameters. The simulation results indicate that connected agents are quicker to converge on a certain opinion than disconnected agents. Connected agents form an opinion cluster while disconnected agents are scattered over a broad range of opinions. The results also show that social harmony is harder to achieve as an individual's ability to communicate their own opinion improves. Both connected and disconnected agents are more likely to become a minority with higher accessibility. Disconnected agents are 11 to 14 times more likely to become a minority than connected agents, which suggests that the digital divide may be associated with discrimination. This study provides additional insights for academia as well as practitioners on opinion formation in the digital divide. Research limitations are addressed along with suggested future research directions.
- Keywords:
- Digital Divide, Opinion Dynamics, Agent-Based Model, Bounded Confidence Model
Introduction
- 1.1
- The Internet is a public environment where people share information and exchange opinions. The participatory culture cultivated on the Internet promotes democratic values of involvement and openness (Kann et al. 2007). Online discussions are a popular means for facilitating public deliberations (Ho & McLeod 2008). Social networking sites are popular outlets on the Internet for politicians to convey their message and stimulate support (Gueorguieva 2008). Well over half of all American adults use social networking sites and a majority of those individuals engage in civic or political activities using social media (Rainie et al. 2012).
- 1.2
- The Internet presents opportunities for both consumers and producers. The Internet enhances the power of consumers by reducing information asymmetry and improving market transparency (Rezabakhsh et al. 2006). Popular goods and services can easily be found online and are often sold by numerous vendors, giving consumers' tremendous purchasing power. Producers also leverage the Internet in creative ways, such as involving consumers in the product development process (Sawhney et al. 2005). On-demand product customization and real-time consumer analytics are possible for online businesses (Cho & Fiorito 2009; Watson et al. 2006).
- 1.3
- Information technology and the Internet are restricted to those who have access to these tools, a phenomenon known as the digital divide. The demographics of an individual that is online is typically different than an individual that is offline. Online information and opinions can be distorted in favor of certain social groups which may propagate biased information online. The effect of the digital divide on opinion formation has yet to be examined despite its importance in the global transition towards an information society.
- 1.4
- Many digital divide studies focused on demographic patterns which distinguish the haves from the have-nots (Goldfarb & Prince 2008; Rogers 2001; Wilson et al. 2003), but few empirically examined the consequences of post-access disparities (Van Dijk 2006). Consequences are important to examine as these outcomes detail the impact that the digital divide has on the utilization of new technical opportunities. Most digital divide studies are static and focused on a specific moment in time. Technology diffuses rapidly through competition and support from government policies (Bohlin et al. 2010; Stoneman & Diederen 1994). The dynamic aspects of technology diffusion should be addressed to acquire a deeper understanding of the digital divide phenomenon. This study experiments with multiple contexts using the agent-based modeling (ABM) method to extend the work of previous digital divide studies.
Digital Divide
- 2.1
- New technologies typically follow an adoption pattern that starts with a few adopters, and as time passes, the penetration rate increases until reaching a point of saturation (Robertson 1967). The gap between individuals who have access to new technologies and those who do not is usually referred to as the digital divide (Compaine 2001; Van Dijk 2006).
- 2.2
- The digital divide is associated with negative outcomes. Van Dijk (2006) suggested that the digital divide may cause technological, immaterial, social, and educational types of inequality. Individuals who lack access to information technology are disadvantaged in knowledge-based societies and economies (Chen & Wellman 2004). For example, information technology can provide a wide range of online services for homebound older adults to manage their health at a time when the aging population reaches unprecedented growth (Choi & DiNitto 2013). Further, e-government is an important means to break barriers and bring government assistance to all citizens (Venkatesh et al. 2013). Digital media usage is a strong predictor of political participation (Dimitrova et al. 2011), which implies that a digital divide may result in political alienation of those who lack digital media access. A participation gap exists even among individuals who are online, so the voices of those who are well-trained to use information technology tend to dominate on the Internet (Schradie 2011).
- 2.3
- Early digital divide studies focused on physical access to computers and the Internet as a key metric (Cullen 2001; Hoffman & Novak 1998; Katz & Aspden 1997; Rogers 2001). Physical resources are not sufficient to gauge the true digital divide as computer literacy, and individual motivation also influence an individual's ability to participate online (Kvasny & Keil 2006; Van Dijk 2006). The term 'digital divide' implies a gap between the haves and have-nots, but a discrete classification may not be the best measure of this phenomenon (Gunkel 2003; Lenhart & Horrigan 2003; Potter 2006). Gadgetry ownership and amount of time online are both measures of the digital divide, but fail to capture the socioeconomic and demographic inequalities characteristic of this phenomenon (Jung 2008). Internet connectedness and the Internet Connectedness Index (ICI) are alternative measures to better represent the digital divide (Jung et al. 2001).
- 2.4
- This study introduces Internet connectedness in an opinion dynamics model as a means to simulate a society in which a pronounced digital divide exists. Prior studies suggest that connectedness is a multifaceted measure, consisting of both accessibility and connectivity. Accessibility is the proportion of individuals who have physical access to information technologies. Although individuals have different levels of access to technology (Warschauer 2003), it was assumed to be binary (e.g. connected or disconnected) in this study for ease of implementation. When an individual writes his or her opinion online, the opinion may be read by multiple agents. Connectivity is the proportion of individuals that read the same opinion among the entire online population. Prior studies suggested that Internet usage and Internet self-efficacy are positively associated with social outcomes (Eastin & LaRose 2000; LaRose et al. 2001). The number of friends that an individual has online depends on their ability and motivation to use the technology. As an individual is more competent at using technology and is more motivated to use digital media, the more likely that individual will be connected via digital media. Connectivity is assumed to capture an individual's ability and motivation to use information technology.
Bounded Confidence Model
- 3.1
- Social scientists perform experiments with various social theories virtually by employing the agent-based modeling (ABM) method (Davidsson 2002). This study examines opinion dynamics, one of the most studied issues with ABM, specifically the bounded confidence model of Deffuant et al. (2000). The bounded confidence model focuses on individuals that are willing to communicate with peers who have similar opinions and tend to ignore peers with sufficiently different opinions. If two agents have opinions x and x' and their opinions are close enough, the model is:
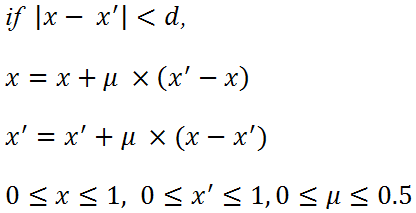
(1) where d is the uncertainty interval and μ is the convergence parameter. An individual with a broad uncertainty interval would listen to those who have a far different opinion from their own. The uncertainty interval captures the open-mindedness or tolerance of individuals (Weisbuch et al. 2005). The convergence parameter determines the extent to which individuals are influenced by others' opinions. The higher the convergence parameter, the more likely an individual will adjust their opinion to resemble others' opinions.
- 3.2
- The Deffuant et al. (2000) bounded confidence model has been employed by several researchers. Some researchers have tested the bounded confidence model with different network structures (Amblard & Deffuant 2004; Deffuant 2006; Gargiulo & Mazzoni 2008; Kozma & Barrat 2008; Weisbuch 2004; Weisbuch et al. 2005) while others introduced additional rules of agent interaction (Afshar & Asadpour 2010; Deffuant et al. 2002; Jager & Amblard 2005; Mckeown & Sheehy 2006; Urbig 2003; Urbig et al. 2008). Deffuant et al. (2002) developed a relative agreement model where an agent's opinion and uncertainty are affected by interactions, which resulted in an opinion polarization not observed in the original model. Jager and Amblard (2005) extended the model to incorporate social judgment theory by splitting uncertainty interval into latitude of acceptance and latitude of rejection. Mckeown and Sheehy (2006) added mass media communication to the model and demonstrated that four dynamical regimes (constant change of opinion, polarization into two extreme groups, settlement at one extreme opinion, and two extreme and a few central groups) were observable depending on the parameterized environments. The extensions to the Deffuant et al. (2000) bounded confidence model expanded the understanding of opinion dynamics.
- 3.3
- Extensions to the Deffuant et al. (2000) bounded confidence model primarily consist of one-to-one synchronous communication between two agents although alternative forms of communication are more prevalent on the Internet. Online communication changed the way through which individuals communicate with each other (Zhao 2006). Morris and Ogan (1996) grouped online communication into four categories: (1) one-to-one asynchronous communication; (2) many-to-many asynchronous communication; (3) synchronous communication that can be one-to-one, one-to-few, or one-to-many; and (4) asynchronous communication in which a receiver seeks to access information.
- 3.4
- Asynchronous communication is commonly engaged in an online environment (Althaus 1997; Dahlberg 2001). Usenet, electronic bulletin boards, blogs, and social network sites are one-to-many or many-to-many asynchronous communication mediums that individuals utilize to disclose their opinions online. One-to-many communication was tested in a model incorporating mass media (Urbig et al. 2008), but the model still assumed that agents communicate in a one-to-one manner and only mass media was able to deliver their message to many individuals. Online media such as blogs and social network sites are progressively competing with traditional media (Johnson & Kaye 2004; Meraz 2009). The characteristics of asynchronous one-to-many communication must be modeled to understand opinion dynamics in a society where online communication is increasingly prevalent.
- 3.5
- This study extends the bounded confidence model of Deffuant et al. (2000). The original model is adapted to the context of online media examining asynchronous one-to-many communication. This study also investigates how different levels of accessibility and connectivity affect consensus formation.
Measures
- 4.1
- Multiple measures are examined to determine how different levels of the digital divide affect opinion formation, such as the number of clusters, maximum cluster size, the Herfindahl-Hirschman Index (HHI), and the exclusion of disconnected agents from a majority opinion. The number of clusters is essential to examine because it implies whether opinions are merged into a single consensus or fragmented into a few clusters. The number of clusters does not indicate whether agents are evenly distributed among several opinion clusters or heavily concentrated on a certain cluster. Additional measures like the maximum cluster size and the HHI are investigated together to compensate for the limitation of solely examining the number of clusters. This study used major clusters that exclude minor clusters. Following Urbig et al. (2008), clusters with a size over dN/2 are considered major clusters where d is the uncertainty interval and N is the population size. Clusters with a size under dN/2 are considered to have minor opinions.
- 4.2
- Agents are segregated into several opinion clusters over interactions, but a few agents may not find any cluster to join because the agents have opinions that are too different from others. Agents that do not find a cluster to join are called isolated agents. Social isolation is assumed to be harmful because it would weaken the social capital and hinder building social trust as well as reciprocal altruism (Putnam 1995).
- 4.3
- HHI is one of the most frequently used measures of market concentration and is the sum of squared market shares of all firms in a market (Hannan 1997). HHI indicates the degree to which opinions are integrated into a consensus or fragmented into several opinion groups. The maximum value of HHI is 1.0, which indicates that all opinions have converged on a single point. HHI is calculated as:
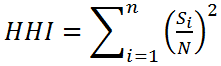
(2) where n is the total number of clusters, si is the number of agents who are contained in the i-th cluster, and N is the number of all agents. The number of connected agents in minor clusters and the number of disconnected agents in the minor clusters are compared to examine the way that the digital divide results in an inequality in opinion formation. The number of agents in the minor clusters refers to the number of agents who are not included in the major opinion clusters. The number of agents in the minor clusters reveals how various levels of the digital divide may result in different opinions.
Model and Simulation
- 5.1
- The original bounded confidence model assumes synchronous one-to-one communication. A mutual exchange of opinions is normal in face-to-face interactions, but online communication usually involves asynchronous one-to-many communication where opinions flow in one direction. An individual can express an opinion in a newsgroup, a blog, a social network site, or a web bulletin board that takes time to be read by others. The individual's opinion does not change as others read the opinion, but it may change theirs. Individuals sometimes send feedback to the writer via comments or replies. Although such a feedback process is not explicit in the model of this study, repeated opinion exchanges are assumed to capture instances in which feedback is sent to the writer. An individual's opinion may also influence multiple individuals on the Internet because a newsgroup, a blog, a social network site, or a web bulletin board usually has an audience of multiple individuals, not a single person. This study employs the opinion updating rule as:
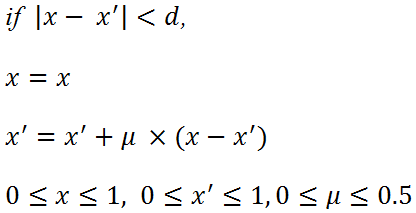
(3) where x is an opinion that is written on the Internet, and x' is an opinion of an agent who reads the opinion. An agent who can communicate with others in both the online and offline environment is a connected agent, while an agent who remains offline is a disconnected agent.
- 5.2
- Connected agents are assumed to have the physical resources, motivation, and skills to use the Internet. The type of media that an individual uses affects his or her level of openness. Every site on the Internet ideally is open to everyone. Usenet newsgroups are open to everyone on the Internet and are a destination for open conversation and discussion because newsgroups are not managed by a single authority (Himelboim et al. 2009). Blogs are another type of media commonly open to everyone because blog users are intrinsically motivated to share their thoughts and experiences with others (Hsu & Lin 2008). The network structure of a completely open environment can be modeled with a complete topology in which each pair of nodes is connected.
- 5.3
- Some websites have limited openness and are restricted to their subscribers. Individuals can communicate only with their online friends in a social network site. Individuals cannot read postings on Facebook that are not relevant to their friends. The network structure of a restricted environment is bounded by the connection of online friends, which may exhibit small-world and scale-free properties (Fu et al. 2007). This study considers the Internet as a virtual sphere where all citizens gather together for public deliberation. The simulations were run assuming that all agents were connected with each other.
- 5.4
- Table 1 presents the pseudo code of the simulation. Each agent is determined randomly to be connected or disconnected at the beginning of the simulation. The number of connected agents is proportional to accessibility. The simulation process begins with a random agent selected among all agents. An agent that is not connected will communicate offline and interact with another agent following equation (1). An agent that is connected may interact in either online or offline modes. An agent that communicates their opinion offline interacts with another agent following equation (1). An agent that communicates their opinion online interacts with a number of other connected agents, which impacts each of their opinions following equation (4).
- 5.5
- The number of individuals engaged in online communication is determined based on his or her connectivity. The simulation process was repeated for 100,000 iterations. Agents within the uncertainty interval of a larger opinion cluster were assumed to be in that cluster at the end of a simulation. This study employed NetLogo to conduct the simulations. The simulation file can be accessed at the OpenABM website (http://www.openabm.org/model/3361).
Table 1: Simulation pseudo code 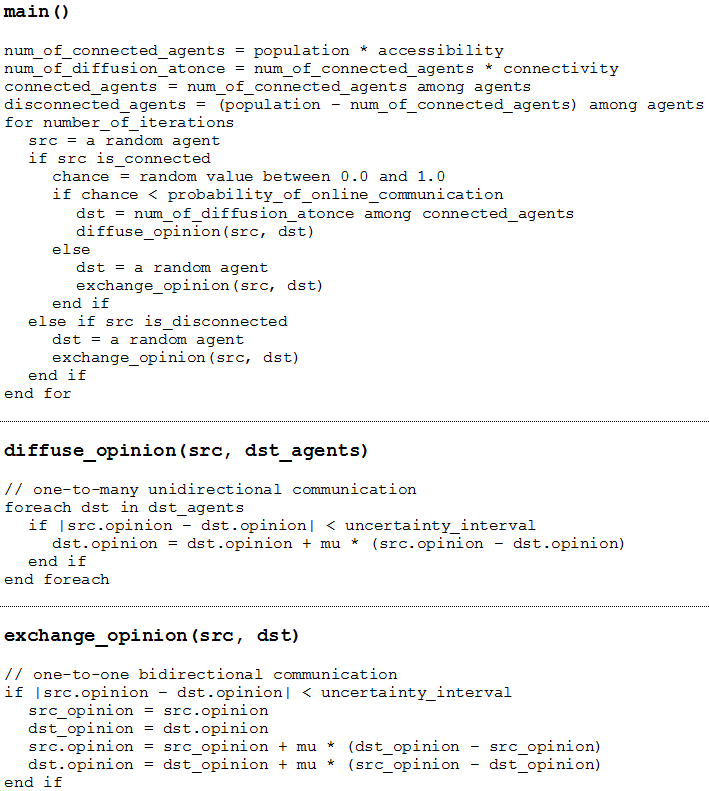
- 5.6
- Table 2 lists the parameters used in the simulation. One thousand agents were used in the simulation. The uncertainty interval (d) varied from 0.10 to 0.50 with an interval of 0.01 while the convergence parameter (μ) was fixed at 0.2. Accessibility ranged from 0.0 to 1.0 with an interval of 0.1 as connectivity ranged from 0.05 to 1.00 with an interval of 0.05. Accessibility determines the size of the online population. No agents have online access when accessibility is 0.0. Every agent has online access when accessibility is 1.0. Connectivity determines the number of individuals that a connected agent can deliver his or her message to online at once. A connected agent can reach half of the other connected agents with a connectivity of 0.5. A connected agent's opinion can be delivered to all of the other connected agents at once when connectivity is 1.0.
- 5.7
- This study investigated the effects that the digital divide has on inequality so sources of inequality were controlled. Accessibility rather than connectivity was examined in this study since physical resources are a prerequisite for an individual to have online access. Connectivity was controlled and assumed to be homogeneous among all connected agents. All simulation results were averaged over 100 runs. Previous studies employed a convergence parameter (μ) of either 0.2 or 0.3 (Weisbuch et al. 2002; Amblard & Deffuant 2004; Deffuant 2006; McKeown & Sheehy 2006). This study conducted simulations with a convergence parameter of 0.2 because the connected agents more efficiently converged in pilot simulations on a consensus with 0.2 than with 0.3.
Table 2: Model parameters
ParameterValue Level Remarks Simulation repetition 100 Population Population (N) 1,000 Population Accessibility 0.0 − 1.0 Population 0.1 interval Connectivity 0.05 − 1.00 Agent 0.05 interval Uncertainty interval (d) 0.10 − 0.50 Agent 0.01 interval Convergence parameter (μ) 0.2 Agent
Comparison with the Original Model
- 6.1
- Figure 1 illustrates the change in the expected number of opinion clusters with an increase in accessibility. Figure 1(a) models the original model, zero accessibility. Figure 1(a) has plateaus where all simulations result in the same number of opinion clusters (e.g., one opinion cluster or two opinion clusters). The plateaus disappear in Figures 1(b), (c) and (d) as accessibility increases. Only one cluster was observed in the original model for an uncertainty interval greater than 0.3. Figure 1(d) models accessibility at 1.0 and only one cluster is observed at an uncertainty interval greater than 0.49.
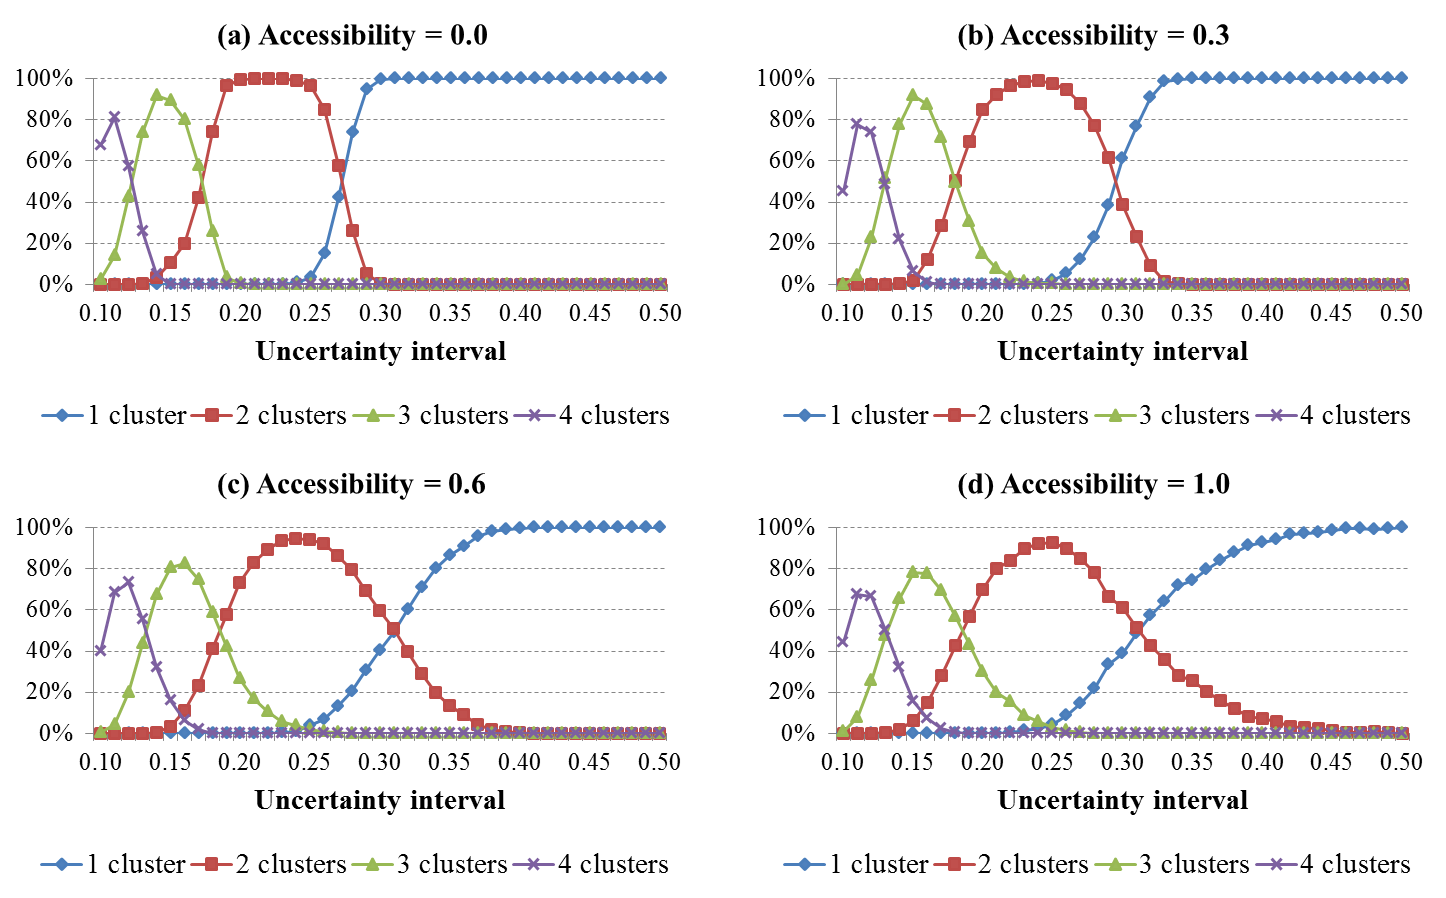
Figure 1. Probability of getting a certain number of opinion clusters as a function of uncertainty interval (μ = 0.2, N = 1000). Each curve represents a different number of opinion clusters. - 6.2
- Figure 2 also illustrates the change in the expected number of opinion clusters with an increase in accessibility, but in a different way so that the curves with different levels of accessibility can be directly compared. The simulation with an accessibility of 0.0 in Figure 2(a) can result in diversified outcomes (e.g., one, two, or three opinion clusters) when the uncertainty interval is between 0.24 and 0.30. The figure shows that the diversified outcome range gets wider as accessibility increases. In Figure 2(a), when the accessibility is 1.0, the simulations result in diversified outcomes in the uncertainty interval range of 0.22 to 0.48. A similar tendency is observed in Figure 2(b), (c), and (d). Opinions are more diversified in a society where information technology is widely adopted. Individuals that communicate online are quicker to unite into a group because they interact with other individuals in the online environment. An opinion will be sustained and will grow if the group is located far enough from other groups and the opinion attracts nearby individuals.
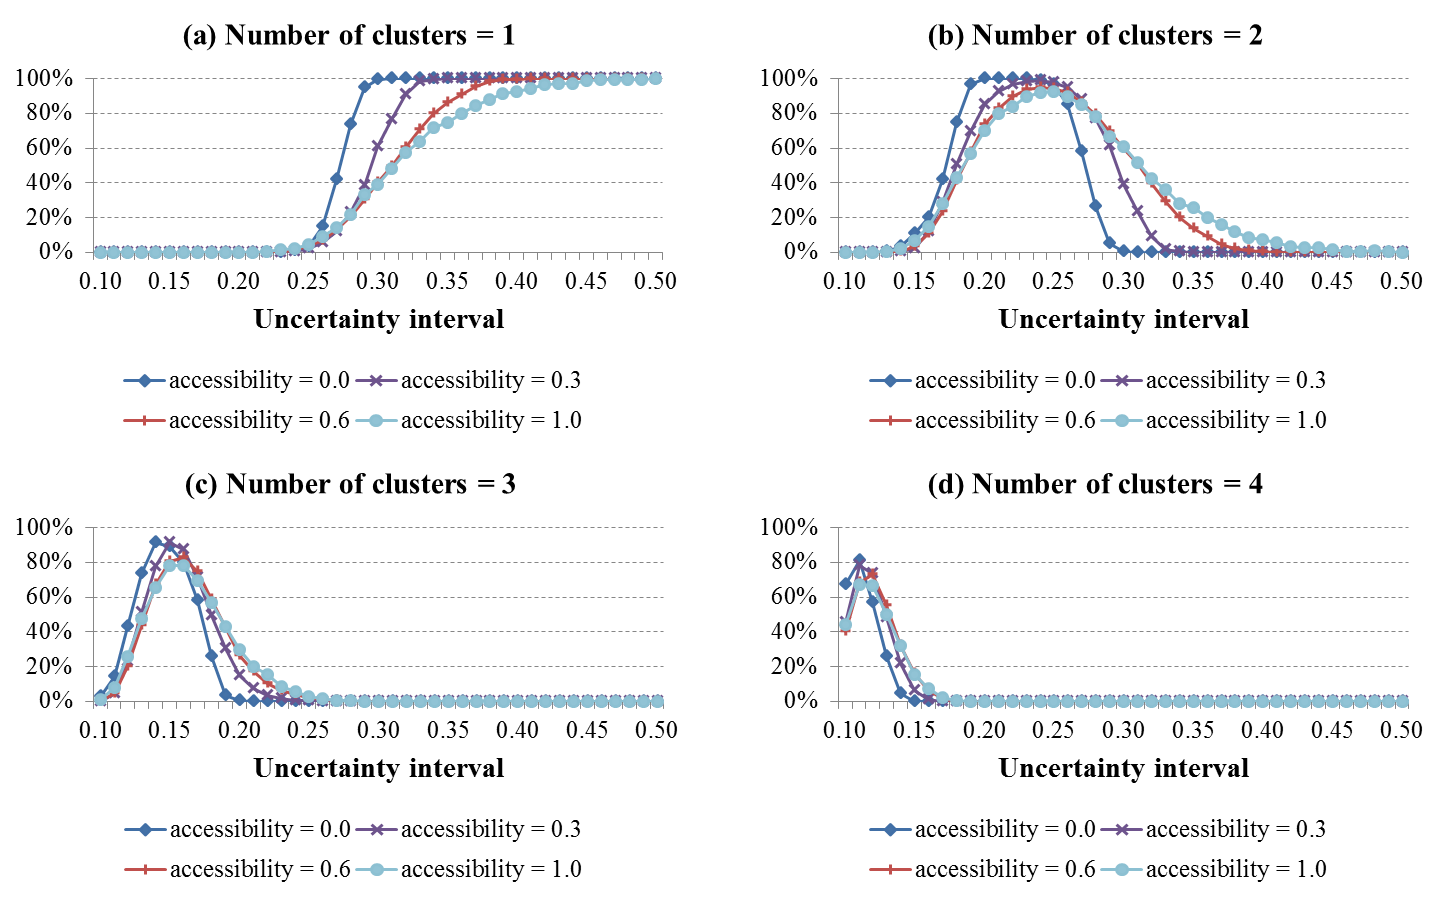
Figure 2. Probability of getting a certain number of opinion clusters as a function of uncertainty interval (μ = 0.2, N = 1000). Each curve represents a different level of accessibility. - 6.3
- Individuals encounter more diverse opinions on the Internet. Online anonymity facilitates an individual to express novel ideas (Suler 2004). Extremists who assert socially undesirable ideas like racism show their presence on the Internet (Burris et al. 2000; Gerstenfeld et al. 2003). Adrianson and Hjelmquist (1991) suggested that it is harder to reach consensus in computer-mediated communication (CMC) than in face-to-face communication, and it implies that there will be more diverse opinions online.
Social Consensus
-
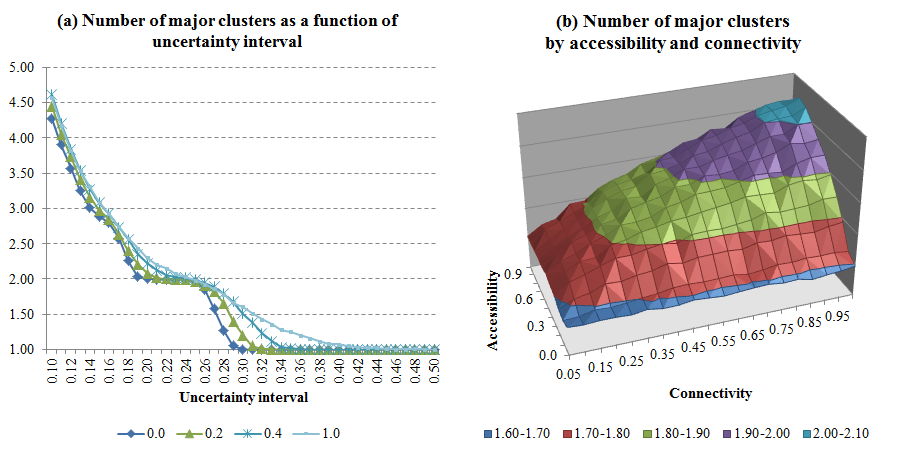
Figure 3. Expected number of major clusters (a) as a function of uncertainty interval - each curve represents a different level of accessibility, (b) as a function of accessibility and connectivity. - 7.1
- Social consensus is the degree to which society is able to reach an agreement on a certain social issue. Social consensus can be measured by the number of major clusters and the size of the largest cluster. Figure 3 illustrates the number of major clusters. The number of major clusters in Figure 3(a) increases as accessibility increases. When the accessibility was low, sudden decreases were observed at some points as the uncertainty interval increased. When the accessibility was in the range of 0.0 to 0.1, the number of major clusters dropped from 2 to 1 around the uncertainty interval of 0.28. When accessibility was greater than 0.7, sudden changes diminished and changes instead happened gradually. A phase transition occurs at a lower level of accessibility within a narrow range of uncertainty level (e.g., uncertainty interval range 0.26–0.30 at accessibility 0.0). The range gets wider as accessibility increases until phase transition can happen at every point of uncertainty interval. The point at which opinions are integrated into a consensus or divided into several clusters is harder to determine at higher accessibility. In terms of the number of opinion groups, public opinion becomes less predictable when accessibility is high.
- 7.2
- Figure 3(b) illustrates how the number of major clusters changes along with accessibility and connectivity. An increase in accessibility causes few changes to the number of major clusters when the connectivity level is less than 0.1. The effect of accessibility on the number of major clusters becomes greater as connectivity increases. Opinions are more likely to be fragmented as accessibility and connectivity increase. Advances in information technology can keep a society from reaching a consensus.
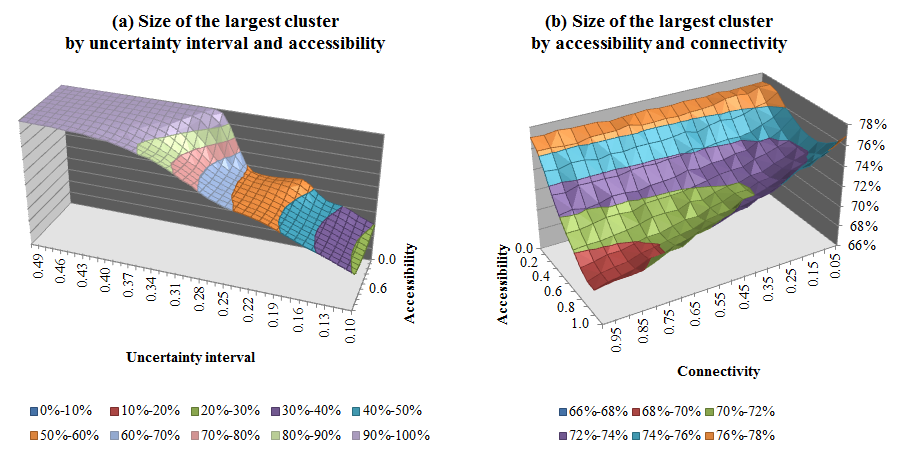
Figure 4. Number of agents in the largest cluster (a) as a function of uncertainty interval and accessibility, (b) as a function of accessibility and connectivity. - 7.3
- The size of the largest cluster decreases with uncertainty interval, which is consistent with the original model. Figure 4(a) depicts that surges in the size of the largest cluster diminish at a higher level of accessibility. The size of the largest cluster is associated with the number of clusters (correlation coefficient = -0.92, p < 0.001). The size of the largest cluster is maximized when only one cluster exists. Agents in the largest cluster get dispersed among several clusters as the number of clusters increases and the size of the largest cluster decreases.
- 7.4
- The number of agents in the largest clusters is illustrated in Figure 4(b) as a function of accessibility and connectivity. The size of the largest cluster becomes the smallest at an accessibility range of 0.6 to 0.9. The maximum cluster size decreases along with accessibility before each curve reaches its minimum value. The smaller the connectivity is, the smaller the size of the largest cluster becomes. When a society has an issue to solve and the only way to do so is by reaching a consensus through discussions, the number of individuals who agree with the majority opinion is the size of the largest cluster. Figure 4(b) implies that information technology can be a hindrance to social consensus. However, the relationship between accessibility and the size of the largest cluster is not linear. Each curve goes up again in the accessibility range of 0.6 to 0.9. Information technology can facilitate a consensus when it is widely diffused throughout society.
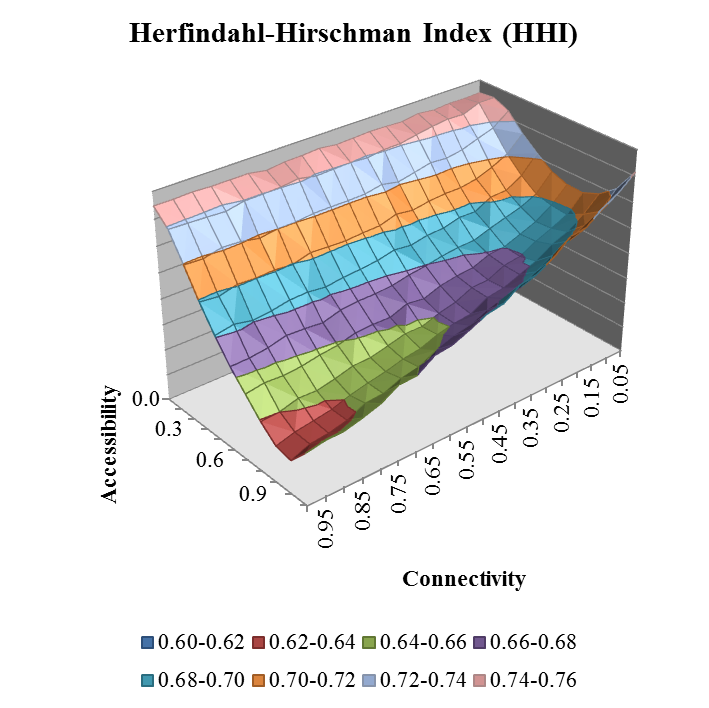
Figure 5. HHI as a function of accessibility and connectivity. HHI illustrates the degree to which opinions are concentrated. - 7.5
- Figure 5 illustrates HHI as a function of accessibility and connectivity. The greater the HHI, the more concentrated the opinions are. HHI decreases if opinions are fragmented. Figure 5 resembles Figure 4(b) as the largest cluster size accounts for 78% of HHI. A valley is observed in Figure 5 around accessibility of 0.6 to 0.8 because the number of minorities becomes maximized in that range. The number of minorities decreases in the accessibility range of 0.9 to 1.0, so HHI increases again.
- 7.6
- Gérard Weisbuch et al. (2002) described an agent with a small uncertainty interval as narrow minded and an agent with a great uncertainty interval as open-minded. Open-minded individuals can accept opinions that are very different from their own and help society reach a consensus. The simulation results show that individuals may not reach a consensus with a high level of open-mindedness when they can exploit information technology. Open-minded agents, whose uncertainty interval is greater than 0.3, always resulted in a single consensus in the original model. Open-minded agents conversely had polarized opinions in the model examined in this study. The results imply that information technology, which advances communicating capabilities, may hinder social agreement. Paradoxically, individuals are more likely to be polarized in opinions when their messages are more easily delivered online to large audiences.
- 7.7
- One of the mechanisms that can explain opinion polarization is homophily, which is defined as "the principle that a contact between similar people occurs at a higher rate than among dissimilar people" (McPherson et al. 2001, p. 416). Empirical evidence suggests that homophily can strengthen group polarization (Baron et al. 1996; Stroud 2010). Stroud (2010) showed that congenial media exposure brought about higher polarization. Baron et al. (1996) conducted experiments to show that social corroboration could make individuals move towards more extreme opinions. Homophily is inherent in the bounded confidence model since bounded confidence refers to individuals that are willing to communicate with peers who have similar opinions. Homophily is stronger in online communication in this study because a message is delivered to multiple agents simultaneously online and connected agents have more chances to get together with other similar agents. Opinions are likely to be more polarized with increased connectivity and accessibility.
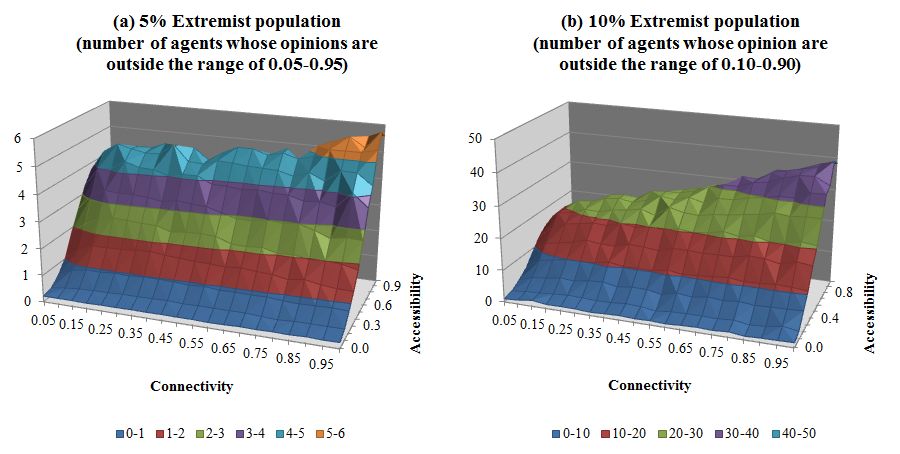
Figure 6. Extremist population as a function of accessibility and connectivity. (a) population of agents whose opinions are outside the range of 0.05–0.95. (b) population of agents whose opinions are outside the range of 0.1–0.9. - 7.8
- Salience of extremists on the Internet is another driver that brings about opinion polarization. Extreme opinions are more likely to survive and exert an influence upon others on the Internet (Burris et al. 2000; Gerstenfeld et al. 2003). People may express themselves openly and intensely online (Suler 2004), while people tend to express themselves in a socially desirable way in face-to-face communication (Schlenker & Leary 1982). Sia et al. (2002) suggested that removal of visual cues and the provision of anonymity in CMC may reduce social presence, which encourages individuals to disclose novel arguments without concern of social evaluation. CMC results in stronger group polarization than face-to-face communication (Adrianson & Hjelmquist 1991).
- 7.9
- The results are consistent with prior studies which indicate that extreme opinions better survive in an online environment (see Figure 6). In the offline context, extremists are likely to be left behind if they fail to repeatedly exchange opinions. Only one or two one-to-one interactions may leave an extremist still far from main opinion groups as the influential power of disconnected extremists is not stronger than that of other agents even if they disseminate their opinions earlier than others. Connected extremists can be more influential by uniting like-minded agents on the Internet. When connected extremists disclose their opinions early on, multiple connected agents with similar opinions will move towards the extreme position. A small cluster is established around the extremist who attracts more like-minded agents to the cluster. This iterative process reinforces the extreme opinion and makes it salient.
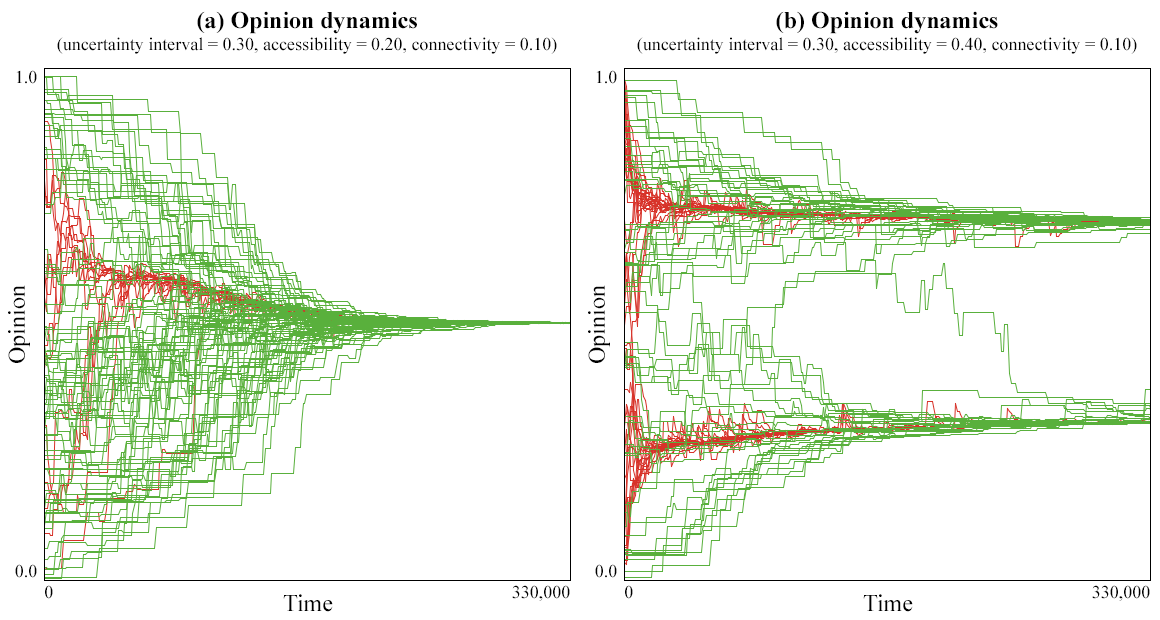
Figure 7. Results of opinion dynamics (μ = 0.3, N = 1000) (a) accessibility = 0.2 and connectivity = 0.1, and (b) accessibility = 0.4 and connectivity = 0.1. Only a subset of 100 agents out of 1000 is plotted. Green lines represent disconnected agents, and red lines represents connected agents. - 7.10
- Online opinion dynamics is largely driven by two processes; (1) early opinion group formation among connected agents, and (2) the cohesion of disconnected agents to the early opinion group. Connected agents converge on a certain opinion very quickly and form an opinion cluster early on. Disconnected agents are absorbed by the cluster if they are closely located. When they are far apart from the cluster, disconnected agents are likely to be left behind as a minority group. Figure 7 shows that connected agents who are represented by red lines form opinion groups in the early stage. It is also observed, in the figure, that disconnected agents whose opinions are dispersed along the y-axis adhere to the early opinion group.
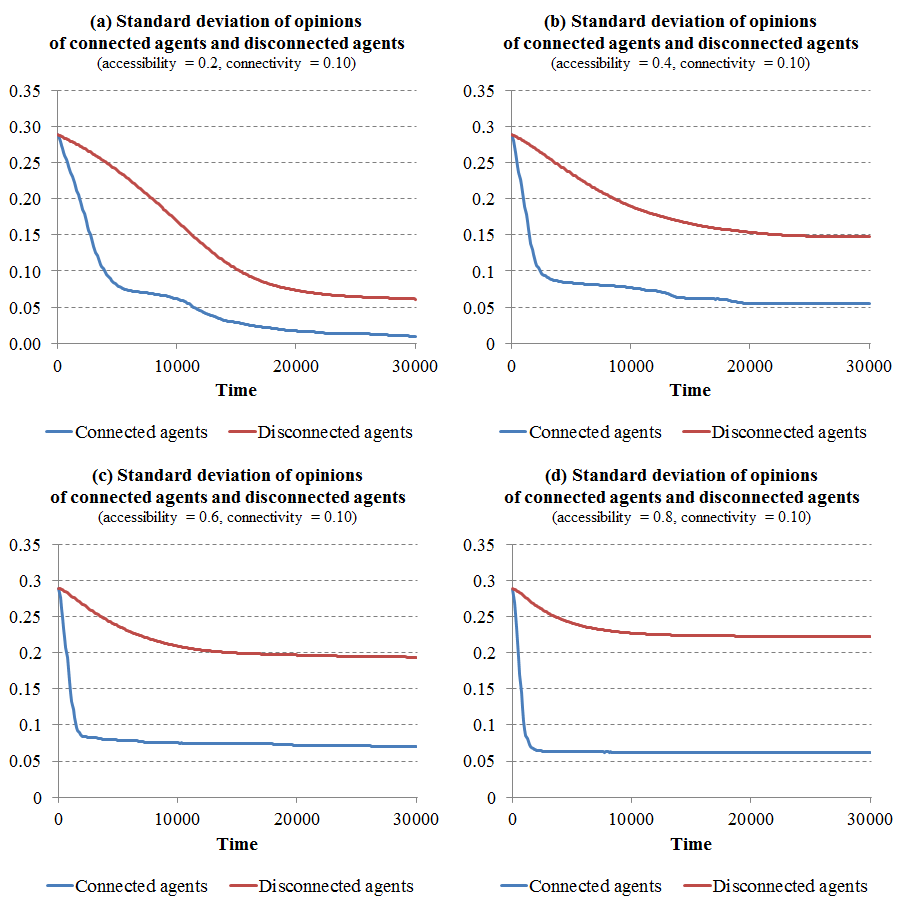
Figure 8. Standard deviation of opinions of connected agents and disconnected agents (μ = 0.3, N = 1000) with (a) accessibility = 0.2, (b) accessibility = 0.4, (c) accessibility = 0.6, and (d) accessibility = 0.8. Standard deviation of connected agents' opinions decreases faster than standard deviation of disconnected agents' opinions. - 7.11
- Figure 8 shows the standard deviation of opinions. If opinions are dispersed over a wide range, standard deviation will be great. Thus, the greatest standard deviation is observed at the beginning of each simulation. As opinions converge on a consensus or a few groups over interactions, standard deviation decreases. When equilibrium is reached, standard deviation does not change. In Figure 8, standard deviation of connected agents decreases faster than that of disconnected agents. It means that connected agents are quicker to form an opinion group. The figure also shows that difference of standard deviation between connected and disconnected agents tends to increase along with accessibility. It implies that disconnected agents are less likely to be included in the majority group.
- 7.12
- Influential power of the early opinion group changes depending on the proportion of connected to disconnected agents. If there are many connected agents in the population, size of the early opinion group will be huge. Accordingly, the influential power of the early opinion group will be strong when there are a great number of connected agents. After connected agents form an opinion group, it will be quick to unite disconnected agents who are closely located to the group, but miss those who are far apart from the group. Disconnected agents will rarely get a chance to disclose their opinion, so their future is mostly determined by the distance to the early opinion group. With a relatively small number of connected agents, the early opinion group will be weak in its power to absorb other agents. The influence of the early group will be marginal and disconnected agents will flock together slowly but surely.
Isolations
- 8.1
- Isolated agents are agents who have no other agents to communicate with. When an agent with an extreme opinion does not have a chance to interact with others for a long time, the agent is likely to be isolated while most of the other agents will form opinion groups together around their average opinion. An agent may be isolated if they are surrounded by narrow minded agents and have no interaction with others for a long time. Isolated agents are problematic because social isolation can weaken the social trust and social capital (Putnam 1995).
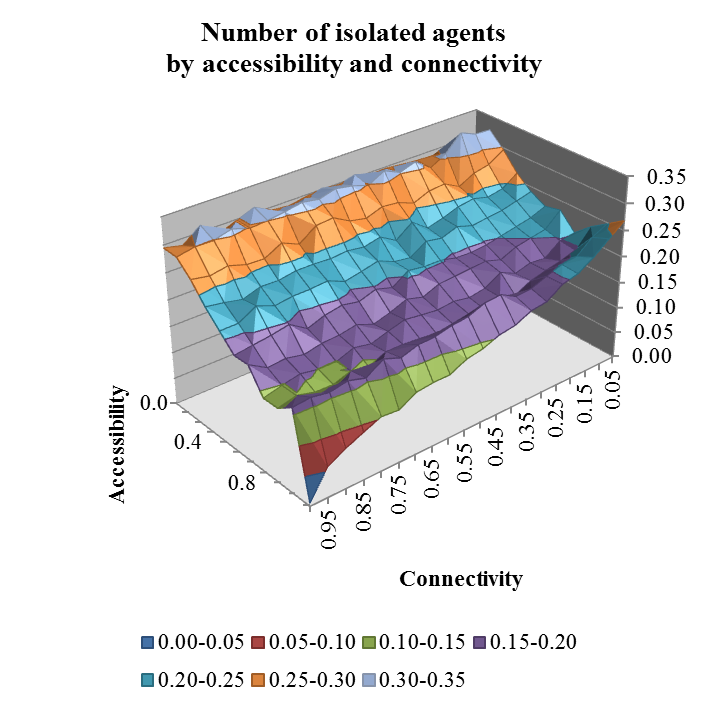
Figure 9. Number of isolations as a function of accessibility and connectivity. - 8.2
- Figure 9 illustrates the expected number of isolated agents. Higher accessibility results in fewer isolated agents in the accessibility range of 0.0 to 0.8. Isolation increased when the accessibility changed from 0.8 to 0.9. With connectivity less than 0.2, isolation continued to increase when accessibility increased from 0.9 to 1.0. With connectivity greater than 0.2, isolation decreased when accessibility increased from 0.9 to 1.0. The figure illustrates that isolations tend to decrease with higher accessibility and connectivity.
- 8.3
- Higher accessibility and connectivity yields less isolated agents because an isolated agent tends to have an extreme opinion, and an agent with an extreme opinion is more likely to find other like-minded agents in the online environment. Most of the isolated agents were extremists in this study's simulation. Agents whose opinions were within 5% of the most extreme opinion (e.g., agents whose opinions are in the range of 0.00–0.05 or 0.95–1.00) accounted for 63.1% of all the isolated agents. 75.0% of the isolated agents had opinions that were within 10% of the most extreme opinion. If an agent with an extreme opinion gets a chance to interact with others early on, he or she will move towards the moderate position. The agent can then communicate with much larger audiences. The agent may be included in a large opinion group after repeated interactions with others. Agents usually drift away from the extreme position over several interactions, so an extremist will not find any nearby agents if he or she fails to communicate with others early on. Connected extremists are more likely to communicate early on than disconnected extremists. The number of isolated agents tends to decrease with an increase in accessibility.
- 8.4
- With high accessibility, connected agents converge on a certain opinion very quickly. An agent can reach a small portion of the connected population if connectivity is low and the quick convergence process may miss some of the agents early on. On the other hand, communication involves increasing numbers of agents as connectivity increases. Isolated agents drastically decrease along with connectivity when accessibility is 1.0.
- 8.5
- A survey conducted by the International Telecommunication Union (ITU) indicated that the countries surveyed had a 30 percent Internet penetration rate while only 10 percent had penetration rates greater than 80 percent (Teltscher et al. 2011). Isolation is negatively associated with accessibility in most countries. Technology diffusion brings about higher accessibility and connectivity, so isolated agents may decrease as information technology is diffused. Reduced isolation does not necessarily mean that the social problem is alleviated because technology advances decreases the number of isolated agents but increases the number of minority group members.
Minorities
- 9.1
- Minority groups generally have less power than a majority group, and members feel less secure than majority group members (Kanter 1977). Minority groups can be discriminated against for economic or political reasons and such discrimination can be institutionalized in a society (Feagin & Eckberg 1980). A society with many minorities is likely to have social problems.
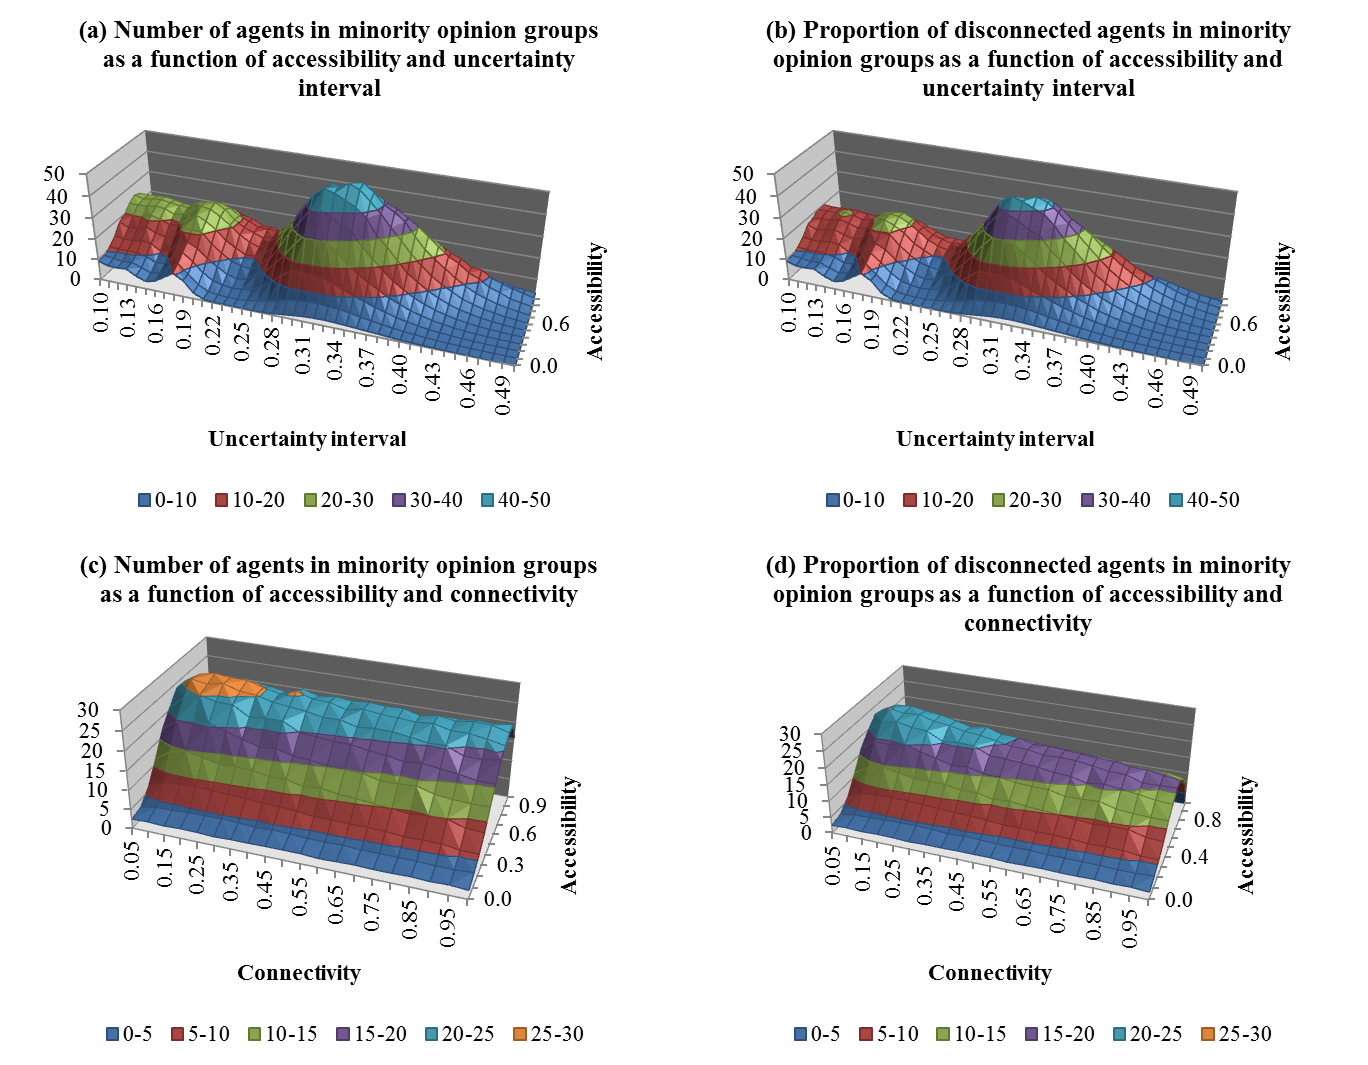
Figure 10. Number of agents in minority opinion groups. (a) number of agents in minority opinion groups as a function of accessibility and uncertainty interval, (b) number of disconnected agents in minority opinion groups as a function of accessibility and uncertainty interval, (c) number of agents in minority opinion groups as a function of accessibility and connectivity, (d) number of disconnected agents in minority opinion groups as a function of accessibility and connectivity. - 9.2
- Figure 10 illustrates the number of agents in minority opinion groups. Figures 9(a) and 9(b) depict the number of agents in minority opinion groups as a function of accessibility and uncertainty interval. Figures 9(c) and 9(d) depicts the number of agents in minority opinion groups as a function of accessibility and connectivity. Disconnected agents account for 79% of the minority agents. Figure 10(a) looks similar to Figure 10(b) while Figure 10(c) looks similar to Figure 10(d).
- 9.3
- Minorities are comprised of connected and disconnected minorities. The number of connected minorities grows as accessibility increases while the number of disconnected minorities forms a bell-shaped curve in Figure 10(b). In Figure 10(a), the number of minorities also exhibits a bell-shaped curve along with accessibility. The number of minorities is maximized at the accessibility range of 0.7 to 0.8.
- 9.4
- The number of connected minorities tends to increase along with accessibility. The number of connected minorities grows as accessibility increases because the population of connected agents is proportional to accessibility. On the other hand, the number of disconnected minorities forms a bell-shaped curve in Figure 10(b). The population of disconnected agents is determined by accessibility. The change in the disconnected population affects the number of disconnected minorities.
- 9.5
- The difference between the number of connected minorities and the number of disconnected minorities may reveal inequalities associated with the digital divide. A comparison between the number of connected minorities and the number of disconnected minorities ignores the effect of changing the population of connected agents and disconnected agents. The number of connected minorities and the number of disconnected minorities were normalized by dividing them by the population of connected agents and the population of disconnected agents, respectively. The resulting value is the connected agent's probability of becoming a minority and the disconnected agent's probability of becoming a minority. The values are illustrated in Figure 11.
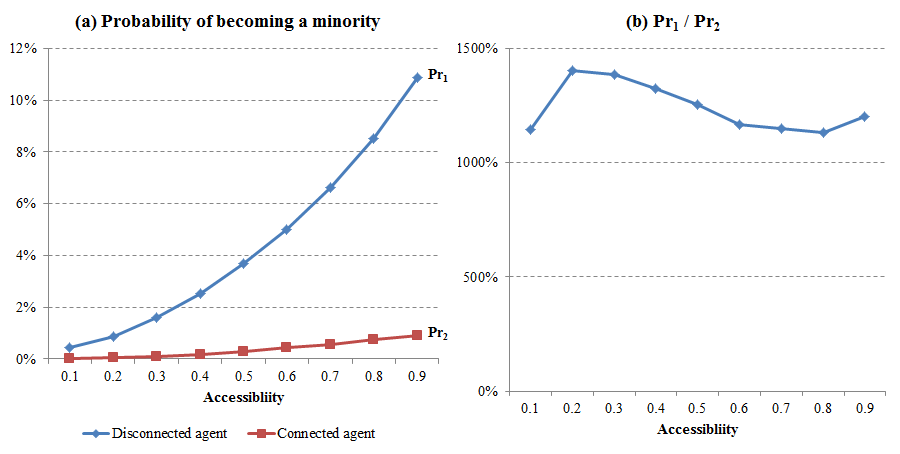
Figure 11. Comparison between connected and disconnected agents. (a) a connected agent's probability of becoming a minority and a disconnected agent's probability of becoming a minority, and (b) a disconnected agent is 11 to 14 times more likely to become a minority than a connected agent in all accessibility levels. - 9.6
- Figure 11(a) indicates that a connected agent's probability of becoming a minority and a disconnected agent's probability of becoming a minority increases in contrast with Figure 10. The curve for a disconnected agent is always located on the upper side. A comparison between the connected and disconnected agents is illustrated in Figure 11(b). A disconnected agent is 11 to 14 times more likely to become a minority than a connected agent.
- 9.7
- Connected agents are less likely to become a minority group member than disconnected agents because connected agents are quicker to form an opinion group than disconnected agents. Once they form a group, every connected agent in the group disseminates the same opinion to others and the position of the group tends not to change. The members of the group are all connected with each other, so deviation of one agent can be easily restored. When an agent deviates from the group, the agent likely interacts with one of the group members who may turn him or her back by being reminded of the original opinion. Disconnected agents are dispersed widely until connected agents form a solid opinion group. Disconnected agents are attracted by the already-formed opinion group. Disconnected agents who are located far from the group may be included in the large opinion group, or may be left behind as a minority depending on the number of disconnected agents. When there are many disconnected agents between an agent and a large opinion group, it is likely that the disconnected agents close the gap. On the other hand, when only a few disconnected agents exist between an agent and a large opinion group, the disconnected agents are likely to move towards the large group before they come to interact with the agent. The probability that a disconnected agent becomes a minority increases along with accessibility.
Discussion
- 10.1
- The research results illustrate how public opinion can be changed by different levels of the digital divide. The results imply that opinions are more likely to be fragmented and harder to predict with higher accessibility and connectivity. The Internet provides a medium for more diverse voices to be shared. An individual can enhance his or her ability to communicate and develop relationships with others using information technology. As individuals improve their communicating capability, opinions tend to converge on a consensus locally. Local unity, however, appears to accelerate segregation globally. Paradoxically, social harmony is harder to achieve as the ability for an individual to communicate his or her opinion improves. Social harmony is likely harder to achieve due to the relevance of homophily and extreme opinions on the Internet.
- 10.2
- The study results also show that disconnected agents are always more likely to have a minority opinion than connected agents. The digital divide has a potential to bring about a discriminatory consequences by itself. Prior digital divide studies focused on demographic analyses of the haves and have-nots (Goldfarb & Prince 2008; Rogers 2001; Wilson et al. 2003), which laid the groundwork for understanding the social problem exhibited by social minorities on the wrong side of the divide. Little empirical evidence exists which indicates that social inequality is brought about by the digital divide. In reality, the digital divide is associated with social stratification (Hoffman et al. 2000), so it is unclear whether social inequality is intensified by the divide or the already existing socio-economic disparities. This research considers only accessibility and connectivity and makes no assumption about social disparities between connected and disconnected agents. The study results show that disconnected agents are 11 to 14 times more likely to become a minority than connected agents. Disconnected agents become isolated more easily than connected agents. Individuals seek to become a member of groups in which they perceive to have a positive social identity following social identity theory (Tajfel 1982). The size of the group is one of the factors that contribute to a desirable group status. Majority group members often discriminate minorities to increase power differentials. The disparity between connected and disconnected agents is likely to result in discrimination against disconnected agents. If the model took the social stratification into consideration, disconnected agents might have confronted even worse consequences. Opinions of social minorities who lack access to information technology will hardly be able to attract public attention. These minorities may have to remain in a society where social contract does not reflect their interests.
- 10.3
- This study found that disconnected agents are more likely to have a minority opinion over time. In a global perspective, the number of minorities is maximized at the accessibility range of 0.7 to 0.8. From an individual perspective, the probability that an individual becomes a minority only increases as accessibility increases. The probability that a disconnect agent becomes a minority increases from 1% to 11% along with accessibility. Disconnected individuals are more likely to have a minority opinion as information technology is diffused and adopted by more of society, and may be discriminated against for having a different idea. Some disconnected agents will be excluded from society without government intervention. Governments should consider approaches like universal service provisions and subsidies for Internet subscription to close the digital divide gap.
- 10.4
- The study simulation results suggest that opinion dynamics in the digital divide is driven mainly by two processes. First, connected agents form an early opinion group. Connected agents have more chances to communicate with others than disconnected agents and are quicker to form an opinion group. Second, disconnected agents whose opinions are dispersed over a wide opinion range are drawn to the early opinion group. While interacting with disconnected agents, the position of the early opinion group tends not to change because a connected agent who deviates from the group is easily turned back to the original opinion through interactions with the group members.
- 10.5
- The processes of online opinion dynamics suggests that opinions in an equilibrium state can be forecasted by monitoring online opinions. Online opinions quickly converge on a single opinion and the converged opinion does not change much over several interactions. Online consensus may reflect opinions of the whole agents in the long run. Online opinions have been analyzed to predict political events (Ceron et al. 2013; Tumasjan et al. 2011). Ceron et al. (2013) demonstrated the predictive ability of social media by correctly forecasting the outcomes of political polls in Italy and France. Tumasjan et al. (2011) analyzed messages on Twitter to successfully predict the result of a German federal election.
- 10.6
- A risk exists that public opinion can become manipulated by those who disseminate biased information on the Internet. Individuals can usually hide their identity and pretend to be someone else online. An opinion which is considered to be prevailing tends to gain even more strength according to the theory of the spiral of silence (Noelle-Neumann 1974). A few individuals pretending to be a large group may deceive the public to take a minority opinion as a majority opinion. Companies have exploited such fraudulent practices to increase the perceived quality of their products (Hu et al. 2011). U.S. politicians Hillary Clinton and Jimmy Carter were victims of Web spams written to associate them with incompetent images (Metaxas & Mustafaraj 2012). The National Intelligence Service in South Korea was suspected of organizing its agents to post comments criticizing the presidential candidate of Democratic United Party on the Internet (Choe 2013). Online opinion dynamics may take on greater importance if instances of public opinion exploitation becomes commonplace.
Conclusion
- 11.1
- This study investigated the opinion dynamics in the presence of digital divide using the ABM method. The bounded confidence model was extended to distinguish between an online and offline context. This study makes both academic and practical implications.
- 11.2
- This research proposed a model in which researchers could explore opinion formation on the Internet. The bounded confidence model was extended by introducing accessibility and connectivity as new parameters. The model demonstrated how the Internet can change opinion formation. The worldwide Internet penetration rate was 29.7% in 2010 while the number approaches 70% among developed countries (Teltscher et al. 2011). The Internet has transformed everyday life in a relatively short period of time by transforming reality from the "here and now" to the "there and then" (Zhao 2006). The Internet is displacing traditional media and the trend of going online is expected to continue as information technology disseminates. Online opinion formation should be studied in various contexts so that people can have a deeper understanding of the transition to an information society. The model explored in this study advances online opinion dynamics studies.
- 11.3
- This study reveals the potential of the Internet. It is highly probable that a disconnected agent will be isolated if he or she has a novel idea. This study also suggests that the opposite can happen if an agent is able to leverage information technology. Individuals can find other like-minded people, rally support for the idea, and develop influential power on the Internet. An individual with a novel idea will be able to establish a party and spread the idea to the world using the Internet. As Kahn and Kellner (2004) stated, the Internet has a potential to reconfigure the political and cultural environment. People will fight for their own agendas and interests on the Internet. If individuals understand the power of the technology and act quickly with determination, they will get the most out of the technology.
- 11.4
- This study has limitations which should be addressed in future research. First, the proposed bounded confidence model in this study assumes that there is no synchronous interaction online. Internet communication was assumed to be asynchronous and involve many individuals at the same time. In reality, some online channels like instant messaging enable synchronous communications between two parties. Popular online media such as Usenet newsgroups, blogs, social network sites, and web bulletin boards are mostly asynchronous and an abstraction of reality is reasonable to represent the simulation model.
- 11.5
- Second, accessibility was assumed to be binary even though there are varying levels of access to the Internet (Warschauer 2003). Dichotomous distinction between haves and have-nots overemphasizes technological solutions (Gunkel 2003). Future research may address this limitation by assigning a stochastic accessibility parameter to each agent.
- 11.6
- Third, some parameters in the model were considered to be homogeneous. The convergence parameter was fixed at 0.2 in all simulations and the effect of the parameter was not investigated in this study. All agents were assumed to be homogeneous in terms of connectivity, but individuals in reality have different connectivity according to their motivation and purpose of using information technology. Some individuals express their opinions more frequently and actively than others on the Internet. Internet connectedness is associated with socio-economic factors (Jung et al. 2001), so social stratification may be modeled with heterogeneous connectivity. The effect of heterogeneous connectivity needs to be explored in the future study to deepen the understanding of online opinion dynamics.
- 11.7
- Finally, there was no network structure in this study. Individuals in a society are usually connected via invisible relationships, and interactions do not happen at random. Future studies should address these limitations to build up an extensive knowledge of online opinion dynamics.
- 11.8
- This study focused on opinion formation in the digital divide. The Internet can be used to promote democratic values in society and can be exploited to disseminate extreme ideas. Information technology can significantly contribute to social transformation, as exhibited during the Arab spring (Khondker 2011). Many people in the world still do not have access to the Internet. Researchers can utilize the model in this study to explore online opinion dynamics and identify measures to close the social gap that is caused by the digital divide.
References
-
ADRIANSON, L. & Hjelmquist, E. (1991). Group processes in face-to-face and computer-mediated communication. Behaviour & Information Technology, 10(4), 281–296. [doi:10.1080/01449299108924290]
AFSHAR, M. & Asadpour, M. (2010). Opinion Formation by Informed Agents. Journal of Artificial Societies and Social Simulation, 13(4).
ALTHAUS, S. L. (1997). Computer-mediated communication in the university classroom: An experiment with online discussions. Communication Education, 46(3), 158–174. [doi:10.1080/03634529709379088]
AMBLARD, F. & Deffuant, G. (2004). The role of network topology on extremism propagation with the relative agreement opinion dynamics. Physica A: Statistical Mechanics and its Applications, 343, 725–738. [doi:10.1016/j.physa.2004.06.102]
BARON, R. S., Hoppe, S. I., Kao, C. F., Brunsman, B., Linneweh, B. & Rogers, D. (1996). Social corroboration and opinion extremity. Journal of Experimental Social Psychology, 32(6), 537–560. [doi:10.1006/jesp.1996.0024]
BOHLIN, A., Gruber, H. & Koutroumpis, P. (2010). Diffusion of new technology generations in mobile communications. Information Economics and Policy, 22(1), 51-60. [doi:10.1016/j.infoecopol.2009.11.001]
BURRIS, V., Smith, E. & Strahm, A. (2000). White supremacist networks on the Internet. Sociological focus, 33(2), 215–235. [doi:10.1080/00380237.2000.10571166]
CERON, A., Curini, L., Iacus, S. M. & Porro, G. (2013). Every tweet counts? How sentiment analysis of social media can improve our knowledge of citizens' political preferences with an application to Italy and France. New Media & Society, 1–19.
CHEN, W. & Wellman, B. (2004). The global digital divide–within and between countries. IT & Society, 1(7), 39–45.
CHO, H. & Fiorito, S. S. (2009). Acceptance of online customization for apparel shopping. International Journal of Retail & Distribution Management, 37(5), 389–407. [doi:10.1108/09590550910954892]
CHOE, S.-H. (2013). South Korean intelligence officers are accused of political meddling, The New York Times. Retrieved from http://www.nytimes.com/2013/04/19/world/asia/south-korean-intelligence-officers-are-accused-of-political-meddling.html
CHOI, N. G. & Dinitto, D. M. (2013). The Digital Divide Among Low-Income Homebound Older Adults: Internet Use Patterns, eHealth Literacy, and Attitudes Toward Computer/Internet Use. Journal of Medical Internet Research, 15(5). [doi:10.2196/jmir.2645]
COMPAINE, B. M. (2001). The digital divide: facing a crisis or creating a myth? The MIT Press.
CULLEN, R. (2001). Addressing the digital divide. Online information review, 25(5), 311–320. [doi:10.1108/14684520110410517]
DAHLBERG, L. (2001). Computer-mediated communication and the public sphere: A critical analysis. Journal of Computer-Mediated Communication, 7(1), 0-0. [doi:10.1111/j.1083-6101.2001.tb00137.x]
DAVIDSSON, P. (2002). Agent based social simulation: A computer science view. Journal of Artificial Societies and Social Simulation, 5(1).
DEFFUANT, G. (2006). Comparing Extremism Propagation Patterns in Continuous Opinion Models. Journal of Artificial Societies and Social Simulation, 9(3).
DEFFUANT, G., Amblard, F., Weisbuch, G. & Faure, T. (2002). How can extremism prevail? A study based on the relative agreement interaction model. Journal of Artificial Societies and Social Simulation, 5(5).
DEFFUANT, G., Neau, D., Amblard, F. & Weisbuch, G. (2000). Mixing beliefs among interacting agents. Advances in Complex Systems, 3(4), 87–98. [doi:10.1142/S0219525900000078]
DIMITROVA, D. V., Shehata, A., Strömbäck, J. & Nord, L. W. (2011). The Effects of Digital Media on Political Knowledge and Participation in Election Campaigns: Evidence From Panel Data. Communication Research.
EASTIN, M. S. & Larose, R. (2000). Internet self-efficacy and the psychology of the digital divide. Journal of Computer-Mediated Communication, 6(1). [doi:10.1111/j.1083-6101.2000.tb00110.x]
FEAGIN, J. R. & Eckberg, D. L. (1980). Discrimination: Motivation, action, effects, and context. Annual Review of Sociology, 6, 1–20. [doi:10.1146/annurev.so.06.080180.000245]
FU, F., Chen, X., Liu, L. & Wang, L. (2007). Social dilemmas in an online social network: The structure and evolution of cooperation. Physics Letters A, 371(1–2), 58–64. [doi:10.1016/j.physleta.2007.05.116]
GARGIULO, F. & Mazzoni, A. (2008). Can extremism guarantee pluralism? Journal of Artificial Societies and Social Simulation, 11(4).
GERSTENFELD, P. B., Grant, D. R. & Chiang, C. P. (2003). Hate online: A content analysis of extremist Internet sites. Analyses of social issues and public policy, 3(1), 29–44. [doi:10.1111/j.1530-2415.2003.00013.x]
GOLDFARB, A. & Prince, J. (2008). Internet adoption and usage patterns are different: Implications for the digital divide. Information Economics and Policy, 20(1), 2–15. [doi:10.1016/j.infoecopol.2007.05.001]
GUEORGUIEVA, V. (2008). Voters, MySpace, and YouTube. Social Science Computer Review, 26(3), 288–300. [doi:10.1177/0894439307305636]
GUNKEL, D. J. (2003). Second thoughts: Toward a critique of the digital divide. New Media & Society, 5(4), 499–522. [doi:10.1177/146144480354003]
HANNAN, T. H. (1997). Market share inequality, the number of competitors, and the HHI: An examination of bank pricing. Review of Industrial Organization, 12(1), 23–35. [doi:10.1023/A:1007744119377]
HIMELBOIM, I., Gleave, E. & Smith, M. (2009). Discussion catalysts in online political discussions: Content importers and conversation starters. Journal of Computer-Mediated Communication, 14(4), 771–789. [doi:10.1111/j.1083-6101.2009.01470.x]
HO, S. S. & Mcleod, D. M. (2008). Social-psychological influences on opinion expression in face-to-face and computer-mediated communication. Communication Research, 35(2), 190. [doi:10.1177/0093650207313159]
HOFFMAN, D. L. & Novak, T. P. (1998). Bridging the racial divide on the Internet. Science, 280(5362), 390–391. [doi:10.1126/science.280.5362.390]
HOFFMAN, D. L., Novak, T. P. & Schlosser, A. (2000). The evolution of the digital divide: How gaps in Internet access may impact electronic commerce. Journal of Computer-Mediated Communication, 5(3), 0-0. [doi:10.1111/j.1083-6101.2000.tb00341.x]
HSU, C.-L. & Lin, J. C.-C. (2008). Acceptance of blog usage: The roles of technology acceptance, social influence and knowledge sharing motivation. Information & Management, 45(1), 65–74. [doi:10.1016/j.im.2007.11.001]
HU, N., Bose, I., Gao, Y. & Liu, L. (2011). Manipulation in digital word-of-mouth: A reality check for book reviews. Decision Support Systems, 50(3), 627–635. [doi:10.1016/j.dss.2010.08.013]
JAGER, W. & Amblard, F. (2005). Uniformity, bipolarization and pluriformity captured as generic stylized behavior with an agent-based simulation model of attitude change. Computational & Mathematical Organization Theory, 10(4), 295–303. [doi:10.1007/s10588-005-6282-2]
JOHNSON, T. J. & Kaye, B. K. (2004). Wag the blog: How reliance on traditional media and the Internet influence credibility perceptions of weblogs among blog users. Journalism and Mass Communication Quarterly, 81(3), 622–642. [doi:10.1177/107769900408100310]
JUNG, J. Y. (2008). Internet connectedness and its social origins: an ecological approach to postaccess digital divides. Communication Studies, 59(4), 322–339. [doi:10.1080/10510970802467387]
JUNG, J. Y., Qiu, J. L. & Kim, Y. C. (2001). Internet connectedness and inequality. Communication Research, 28(4), 507–535. [doi:10.1177/009365001028004006]
KAHN, R. & Kellner, D. (2004). New media and internet activism: from the 'Battle of Seattle' to blogging. New media & society, 6(1), 87–95. [doi:10.1177/1461444804039908]
KANN, M. E., Berry, J., Grant, C. & Zager, P. (2007). The Internet and youth political participation. First Monday, 12(8). [doi:10.5210/fm.v12i8.1977]
KANTER, R. M. (1977). Some effects of proportions on group life: Skewed sex ratios and responses to token women. American journal of Sociology, 965–990. [doi:10.1086/226425]
KATZ, J. & Aspden, P. (1997). Motives, hurdles, and dropouts. Communications of the ACM, 40(4), 97–102. [doi:10.1145/248448.248464]
KHONDKER, H. H. (2011). Role of the new media in the Arab Spring. Globalizations, 8(5), 675–679. [doi:10.1080/14747731.2011.621287]
KOZMA, B. & Barrat, A. (2008). Consensus formation on adaptive networks. Physical Review E, 77(1), 1–10. [doi:10.1103/PhysRevE.77.016102]
KVASNY, L. & Keil, M. (2006). The challenges of redressing the digital divide: a tale of two US cities. Information Systems Journal, 16(1), 23-53. [doi:10.1111/j.1365-2575.2006.00207.x]
LAROSE, R., Mastro, D. & Eastin, M. S. (2001). Understanding internet usage A social-cognitive approach to uses and gratifications. Social Science Computer Review, 19(4), 395–413. [doi:10.1177/089443930101900401]
LENHART, A. & Horrigan, J. B. (2003). Re-visualizing the digital divide as a digital spectrum. IT & Society, 1(5), 23–39.
MCKEOWN, G. & Sheehy, N. (2006). Mass media and polarisation processes in the bounded confidence model of opinion dynamics. Journal of Artificial Societies and Social Simulation, 9(1).
MCPHERSON, M., Smith-Lovin, L. & Cook, J. M. (2001). Birds of a feather: Homophily in social networks. Annual review of sociology, 415–444. [doi:10.1146/annurev.soc.27.1.415]
MERAZ, S. (2009). Is there an elite hold? Traditional media to social media agenda setting influence in blog networks. Journal of Computer-Mediated Communication, 14(3), 682–707. [doi:10.1111/j.1083-6101.2009.01458.x]
METAXAS, P. T. & Mustafaraj, E. (2012). Social media and the elections. Science, 338(6106), 472–473. [doi:10.1126/science.1230456]
MORRIS, M. & Ogan, C. (1996). The Internet as mass medium. Journal of Computer-Mediated Communication, 1(4), 0-0. [doi:10.1111/j.1083-6101.1996.tb00174.x]
NOELLE-NEUMANN, E. (1974). The spiral of silence a theory of public opinion. Journal of communication, 24(2), 43–51. [doi:10.1111/j.1460-2466.1974.tb00367.x]
POTTER, A. B. (2006). Zones of silence: A framework beyond the digital divide. First Monday, 11(5). [doi:10.5210/fm.v11i5.1327]
PUTNAM, R. D. (1995). Bowling alone: America's declining social capital. Journal of Democracy, 6(1), 65–78. [doi:10.1353/jod.1995.0002]
RAINIE, L., Smith, A., Schlozman, K. L., Brady, H. & Verba, S. (2012). Social Media and Political Engagement: Pew Research Center.
REZABAKHSH, B., Bornemann, D., Hansen, U. & Schrader, U. (2006). Consumer power: a comparison of the old economy and the Internet economy. Journal of Consumer Policy, 29(1), 3–36. [doi:10.1007/s10603-005-3307-7]
ROBERTSON, T. S. (1967). The process of innovation and the diffusion of innovation. The Journal of Marketing, 31(1), 14–19. [doi:10.2307/1249295]
ROGERS, E. M. (2001). The digital divide. Convergence: The international journal of research into new media technologies, 7(4), 96–111. [doi:10.1177/135485650100700406]
SAWHNEY, M., Verona, G. & Prandelli, E. (2005). Collaborating to create: The Internet as a platform for customer engagement in product innovation. Journal of interactive marketing, 19(4), 4–17. [doi:10.1002/dir.20046]
SCHLENKER, B. R. & Leary, M. R. (1982). Social anxiety and self-presentation: A conceptualization model. Psychological bulletin, 92(3), 641. [doi:10.1037/0033-2909.92.3.641]
SCHRADIE, J. (2011). The digital production gap: The digital divide and Web 2.0 collide. Poetics, 39(2), 145–168. [doi:10.1016/j.poetic.2011.02.003]
SIA, C.-L., Tan, B. C. & Wei, K.-K. (2002). Group polarization and computer-mediated communication: Effects of communication cues, social presence, and anonymity. Information Systems Research, 13(1), 70–90. [doi:10.1287/isre.13.1.70.92]
STONEMAN, P. & Diederen, P. (1994). Technology diffusion and public policy. The Economic Journal, 104(425), 918–930. [doi:10.2307/2234987]
STROUD, N. J. (2010). Polarization and partisan selective exposure. Journal of Communication, 60(3), 556–576. [doi:10.1111/j.1460-2466.2010.01497.x]
SULER, J. (2004). The online disinhibition effect. CyberPsychology & Behavior, 7(3), 321–326. [doi:10.1089/1094931041291295]
TAJFEL, H. (1982). Social psychology of inter-group relations. Annual Review of Psychology, 33, 1–39. [doi:10.1146/annurev.ps.33.020182.000245]
TELTSCHER, S., Gray, V., Magpantay, E., Olaya, D., Vallejo, I., Buracond, S., Stork, C., Poupaert, O., Rollet, N., Bonacheva, E. & Minges, M. (2011). Measuring the information society (pp. 1–174). Geneva, Switzerland: International Telecommunication Union.
TUMASJAN, A., Sprenger, T. O., Sandner, P. G. & Welpe, I. M. (2011). Election Forecasts With Twitter How 140 Characters Reflect the Political Landscape. Social Science Computer Review, 29(4), 402–418. [doi:10.1177/0894439310386557]
URBIG, D. (2003). Attitude dynamics with limited verbalisation capabilities. Journal of Artificial Societies and Social Simulation, 6(1), 2.
URBIG, D., Lorenz, J. & Herzberg, H. (2008). Opinion dynamics: The effect of the number of peers met at once. Journal of Artificial Societies and Social Simulation, 11(2) 4.
VENKATESH, V., Sykes, T. A. & Venkatraman, S. (2013). Understanding e-Government portal use in rural India: role of demographic and personality characteristics. Information Systems Journal, in press.
VAN DIJK, J. A. G. M. (2006). Digital divide research, achievements and shortcomings. Poetics, 34(4/5), 221–235. [doi:10.1016/j.poetic.2006.05.004]
WARSCHAUER, M. (2003). Digital Divide. SCIENTIFIC AMERICAN. [doi:10.1038/scientificamerican0803-42]
WATSON, H. J., Wixom, B. H., Hoffer, J. A., Anderson-Lehman, R. & Reynolds, A. M. (2006). Real-time business intelligence: Best practices at Continental Airlines. Information Systems Management, 23(1), 7. [doi:10.1201/1078.10580530/45769.23.1.20061201/91768.2]
WEISBUCH, G. (2004). Bounded confidence and social networks. The European Physical Journal B-Condensed Matter and Complex Systems, 38(2), 339–343. [doi:10.1140/epjb/e2004-00126-9]
WEISBUCH, G., Deffuant, G. & Amblard, F. (2005). Persuasion dynamics. Physica A: Statistical Mechanics and its Applications, 353(1), 555–575. [doi:10.1016/j.physa.2005.01.054]
WEISBUCH, G., Deffuant, G., Amblard, F. & Nadal, J.-P. (2002). Meet, discuss, and segregate! Complexity, 7(3), 55–63. [doi:10.1002/cplx.10031]
WILSON, K. R., Wallin, J. S. & Reiser, C. (2003). Social stratification and the digital divide. Social Science Computer Review, 21(2), 133–143. [doi:10.1177/0894439303021002001]
ZHAO, S. (2006). The Internet and the transformation of the reality of everyday life: Toward a new analytic stance in sociology. Sociological Inquiry, 76(4), 458–474. [doi:10.1111/j.1475-682X.2006.00166.x]