
 Abstract
- In order to analyse the behaviour of pedestrians at the very fine scale, while moving along the streets, in open spaces or inside a building, simulation modelling becomes an essential tool. In these spatial environments, simulation requires the ability to model the local dynamics of individual decision making and behaviour, which is strongly affected by the geometry, social preferences, local and collective behaviour of other individuals. The dynamics of people visiting and evacuating a museum offers an excellent case study along this line. In this paper we present an agent-based simulation of the Castello Ursino museum in Catania (Italy), evaluating its carrying capacity in terms of both satisfaction of the visitors in regime of non-emergency dynamics and their safety under alarm conditions.
- Keywords:
- Agent-Based Simulations, Carrying Capacity, Pedestrian Dynamics, Evacuation Dynamics
Motivation and Overview
- 1.1
- Walking is the most sustainable mode of transport. Survey data from a selection of seven European countries show that 12–30% of all trips are made by walking (OECD 1998). In Italy it involves 75% of all trips under a kilometer, as reported by ISFORT (2006), it is the first and last segment of every travel and affects the level of service of important transport infrastructure, such as airports and railway stations. At the same time it is also of fundamental importance in fields related to urban planning, emergency, disaster planning.
- 1.2
- In the field of transportation engineering existing pedestrian models can be roughly separated in analytical models and micro-simulations.
- 1.3
- Analitycal models include "before and after" methods and regression analysis models (Older 1968; Pushkarev & Zupan 1971), analogies with fluids, gas kinetics and other physical flow systems (Helbing 1992; Henderson 1974), entropy maximization (Butler 1978), dynamic network analysis with flow models calibrated on the basis of collected data (Di Gangi and Velonà 2007), discrete choice models to predict pedestrians' route choice (Antonini et al. 2006; Ignaccolo et al. 2006), stochastic queuing and Markovian models (Mitchell and MacGregor Smith 2001). In all these cases, the authors use mathematical models to calculate average pedestrian flows along a path, but these models are not able to include individual aspects of pedestrian behaviour.
- 1.4
- On the other hand, the micro-simulation models reproduce the movement of each single pedestrian following a set of pre-determined rules of behaviour and are applicable to a greater variety of situations, such as pedestrian planning, facility design, operations for many large-scale events and transportation terminals (Schelhorn et al. 1999; Still 2000; Berrou et al. 2005; Legion 2013).
- 1.5
- In the last decades, micro-simulation models of pedestrian dynamics have been used in a wider context beyond the transportation sector, developing the capability to capture emerging phenomena resulting from the interaction between individual features and collective behaviour, also exploiting the potential of several new approaches and techniques, such as physically inspired models, cellular automata and agent-based modelling.
- 1.6
- The simulation approach based on the concept of "social force" was introduced in 1995 by Dirk Helbing. This force acts as a sort of internal motivation of the individuals to perform certain actions (movements) and influences their continuous dynamic variables (velocity, acceleration, distance). The same author, some years later (Helbing et al. 2000), used a model of pedestrian behaviour based on quantitative theories to predict crowd dynamics under emergency conditions. In 2002, based on a molecular-dynamic like micro-simulation approach, Helbing also provided an overview of the observed collective phenomena in pedestrian crowds, such as lane formation in corridors and oscillations at bottlenecks in normal situations, while different kinds of blocked states are produced in panic situations.
- 1.7
- Cellular automata (CA) approach divides the environment into discrete cells where pedestrians are bounded to move, by occupying a single cell at each time step.
- 1.8
- Blue and Adler (2001) used CA micro-simulation for modelling bi-directional pedestrian walkways, showing that a small rule set is capable of effectively capturing the behaviours of pedestrians at the micro-level while attaining realistic macro-level activity. Burstedde et al. (2001) proposed a two-dimensional CA model to simulate pedestrian traffic, where long-range interactions between pedestrians are mediated by a so-called floor field which modifies the transition rates to neighbouring cells. Kirchner and Schadschneider (2002) simulated an evacuation process by the CA technique, where the interaction between the pedestrians is based on the idea of chemotaxis, that is a chemical trace to guide insects to food places. Weifeng et al. (2003) developed a CA model to simulate the bi-direction pedestrian movement based on simple rules of human judgment that include the effect of back stepping on the critical density of phase transition phenomena. Finally, Sarmady et al. (2008) combined a behaviour model to simulate actions of individual pedestrians with a CA model used to simulate their small scale movements.
- 1.9
- The third approach, based on Agent Based Models (ABM), focuses on the collective behavioural patterns emerging from the micro-level properties as the result of a trade-off between competitive and cooperative individual choices. In general, ABM treat pedestrians as fully autonomous entities with cognitive and often learning capabilities (Batty and Jiang 1999; Batty 2003; Osaragi 2004; Kitazawa. and Batty 2004; Koh et al. 2008; Papadimitriou 2009). These aspects, of course, play a fundamental role for both ordinary motion and emergency situations (a comprehensive review of different approaches of computer simulation of evacuation can be found, for example, in Gwynne et al. (1999), Shadschneider et al. (2008) and Kuligowski et al. (2010)).
- 1.10
- The typical case is when local pedestrian movements towards some goal can lead to undesired crowded situations, while the tendency to follow what others are doing (herding effect) can favour congestion. In other words, these simulation techniques are able to capture and explore rising crowd behaviours which cannot be described as simple aggregations of individual movements and that often are very far from intuition and hardly foreseeable by experience and common sense. In this respect, Batty (2001) argued that ABM have emerged as a powerful alternative to other approaches to spatial modelling for many reasons, since fine-scale data on urban land use, activities and flows of walkers are becoming more and more available. Kitazawa and Batty (2004) combined ABM and Genetic Algorithms to computationally emulate retail movements of shoppers in a big shopping centre. Chakrabarti et al. (2006) highlighted how computing capability continues to grow and new concepts on social complex systems are starting to blend with similar ideas in far-from-equilibrium physics.
- 1.11
- In this paper we present an agent-based simulation of people moving in a closed spatial environment, considering the Castello Ursino museum in Catania (Italy) as a case study. The simulation intends to evaluate the so called "carrying capacity" of the museum.
- 1.12
- The concept of carrying capacity is commonly used in ecology and it is usually defined as the maximum population size of a given species that the environment can sustain indefinitely, given the food, habitat, water and other necessities available. By adapting the same concept to our context, we define here the carrying capacity as the total number of visitors the building can tolerate while attempting to maximize pedestrian satisfaction and safety, in terms of evacuation strategies and performances under emergency conditions (see also Garofalo (2007) and Camillen et al. (2010)). We assume the latter as a suitable indicator of the performance of the virtual system under both the non-emergency dynamics and the emergency dynamics.
- 1.13
- It is important to stress that the main feature of our model is the ability to coupling together both the non-emergency and the emergency scenarios. In this respect, we will show in the next sections that it can also be considered as a sort of prototype model able to explore how rising crowd behaviour can simultaneously affect the level of service and the safety of a closed environment.
The case study: the Castello Ursino museum
- 2.1
- The Castello Ursino was built in 1250 as one of the royal castles of Emperor Frederick II and it is now used as a museum. It is a square compact building (Fig. 1), 50 meters in width on each size, with four towers (10 meters in diameter) and a ground floor (the only one of which we consider in this paper) with many rooms placed around a central courtyard.
- 2.2
- The museum has only one main entrance/exit door (at the bottom) and ten rooms full of paintings, sculptures and other artworks, thus providing different levels of interest to visitors. In this respect we chose it to test the effectiveness of the ABM approach in modelling the complex emerging behaviour of a variable number of visitors trying to maximize their personal satisfaction during their visit experience, while interacting each other and with the environment.
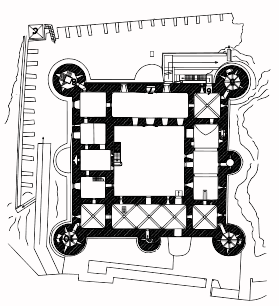
Figure 1. Real Planimetry of the ground floor of Castello Ursino museum - 2.3
- In their review Kuligowski et al. (2010) identify several features characterizing building evacuation models. These include availability, modelling methods, purpose, grid/structure, perspective of the model, behaviour, movement, visualization, counter-flow, fire conditions affecting behaviour, groups formation, etc. In order to put our model in the framework of current research and available models, it is useful to explicitly refer to this classification before entering into details.
- 2.4
- We use a museum as case study, both in non-emergency dynamics and in evacuation dynamics, but the purpose of the model is wider, because its procedures can be applied to simulate any type of buildings where many agents have to compete for the available resources (as for example the fruition space around the artworks and the emergency exits).
- 2.5
- Both the code and the interface of our model have been originally developed by us within the NetLogo software environment (Wilensky 1999), available for free to the users. Since NetLogo is a multi-purpose platform, it was necessary to write specific routines to adapt the agent's dynamics to the motion inside a closed environment. In this respect our model is a behavioural one, in the sense that each individual moves toward specific goals, performing decision-making based on its own preferences, on the conditions of the building and on the location (and behaviour) of other occupants.
- 2.6
- We use a fine network grid structure where each cell allows for only one occupant at a time. The model tracks the movements of visitors individually throughout the simulation. Each visitor views the building with an individual perspective, he is a-priori not aware of the building's emergency exit paths, except from the main entrance, and does not have any a-priori information on the best route to follow in case of emergency evacuation.
- 2.7
- The movement of the visitors in non-emergency regime is dependent on the conditions of the environment (the disposal of artworks), the structure (the geometry of the building) and on some individual properties (degree of interest towards the artworks and degree of patience) that resemble the human behaviour and its intrinsic variability among the individuals.
- 2.8
- There is no reference to the type of emergency situation the visitors have to face (e.g. fire, earthquake, etc.), so that their behaviour is not affected by possible changes in the properties of the environment (e.g. presence of smoke), of the building (e.g. not accessible areas) or of the visitor's altered abilities (e.g. injured people).
- 2.9
- The evacuation dynamics sometimes needs emergency responders to traverse in the opposite direction as the evacuating visitors in the building. We do not include this kind of "counterflow" capability in the present version of the model but it could be easily implemented with slight modifications of the code. The same considerations hold for the tendency of people to gather into groups (herding effects), not present in this version.
- 2.10
- NetLogo environment also allows a 3-D visualization of the 2-D model (not explicitly shown in this paper), which provides a better understanding of the visitors' dynamics, bottlenecks' location and points of congestion within the geometry of the building.
- 2.11
- In the next section we will address the non-emergency dynamics of visitors inside the museum and we will evaluate their satisfaction together with their average visiting time, as function of the level of crowding. The construction of the agent's movement rules was inspired by the observation of real people inside the Castello Ursino. Even if they are not statistically significant, we think that these observations are quite representative of reality.
- 2.12
- On the other hand, as most of the building belonging to historical heritage, Castello Ursino shows several concerns about safety management (we obtained information about the existing evacuation plan from the managers of the museum). The emergency dynamics will be simulated in the last section, where we will measure the safety performances in terms of global evacuation time for different configurations of the emergency exits and for several levels of crowding. The simulation results will be also averaged over different runs (events), performed with the same parameters but with a different random seed.
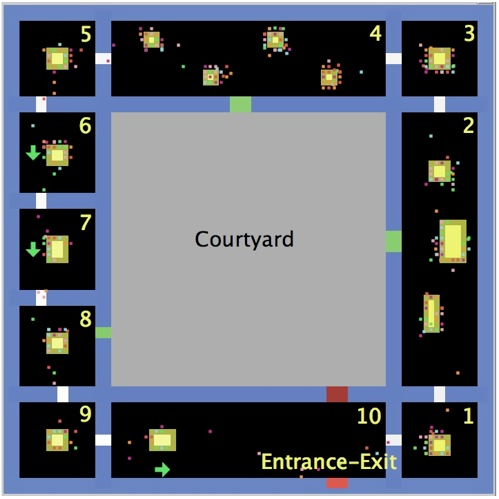
Figure 2. Virtual Planimetry of Castello Ursino, implemented within the NetLogo environment
Non-emergency dynamics: movement rules and simulation results
- 3.1
- The ground floor of Castello Ursino museum has been reproduced in detail, preserving its original spatial scale, within the simulated "world", i.e. the square grid of the NetLogo interface (see Fig. 2) where the virtual agents (visitors) move and interact. The grain of resolution of the world-grid is the "patch", i.e. a single cell representing a square of 60cm × 60cm, which we impose to carry only one visitor at a time (TRB 2010).
- 3.2
- The different patches' colour allows the agents to recognize and properly interact with objects with different "physical properties", i.e.:
- internal and external walls (in blue);
- external entrance/exit door (in red, on the bottom);
- internal doors (in white);
- three emergency exits (in green) from rooms 2, 4 and 8 to the internal courtyard (gray);
- one intermediate emergency exit (in dark red) from the courtyard to room 10;
- yellow rectangular areas, which try to reproduce the real position and size of the artworks currently present inside the museum (in some case, these yellow patches indicate an exhibition space with many, not a single, artworks);
- fruition spaces around the artworks (in light yellow) and free space (in black);
- the green arrows in rooms 6, 7 and 10 represent emergency signs indicating the direction of the closer emergency exit.
- 3.3
- In the non-emergency dynamics, visitors (visualized in Fig. 2 as little squares with different colours, each one fitting a single patch) access the museum through the main entrance/exit at the bottom with a random Poisson arrival, i.e. with exponentially distributed inter-arrival times ΔT (with a given mean <ΔT>, expressed in seconds). After entering, they move counter-clockwise (along the only path actually allowed inside the museum) going forward one patch at each time-step (1 time step= 1 second), therefore – in absence of obstacles or other reasons to stop – they walk with an average velocity of 0.60 m/s, less than the normal pace of 1.0 m/s (TRB 2010) but reasonable considering that they are going around visiting a museum. The path of the visitors is not predetermined and they move following a few intuitive rules.
- 3.4
- Each agent possesses a radius of vision and is attracted by doors or artworks around him. It is important to stress that the agent's radius of vision allow them to look around over an angle of 360° (this is quite reasonable since we simulate individuals visiting an exhibition space) and at a variable distance which has to be calibrated in order to recognize all the relevant objects (artworks, doors or emergency exits) inside the room they are visiting in a given moment. This "room-dependent" adjustment of the radius of vision is absolutely necessary since in NetLogo it is very difficult to prevent the visitors to "look through the walls" (i.e. to recognize targets in other rooms and to go forward them trying to cross the walls).
- 3.5
- In presence of a given obstacle (typically a wall or another agent), a moving agent tries to avoid it turning left or right (at random with equal probability) and, if it is possible, goes forward following his original direction.
- 3.6
- When no obstacles are present, each visitor moves towards his next target, a door or an artwork, which are dynamically stored in an individual (not limited) memory, so that he will not pass twice through the same door and will not visit the same artwork twice (this seems, as a first approximation, quite faithful to the real behaviour of visitors). When a given artwork has been reached, the agent looks for an empty patch within the corresponding fruition space around the artwork: if any patch is available, he occupies it and enjoys the artwork, otherwise he goes around the fruition space for a while waiting for someone to give way.
- 3.7
- For each artwork, each visitor has a different interest, i.e. the time he is willing to spend enjoying that artwork, and a different patience, i.e. the time he is willing to spend waiting for free space in the fruition area around that artwork before switching to the next artwork (in this latter case, the previous artwork will be stored in the memory and no more attended by the visitor). The values for these two quantities are randomly extracted with uniform probability, for every visitor and for every artwork, within the intervals [Imin=20s, Imax=50s] for the interest and [Pmin=30s, Pmax=40s] for the patience (we chosen these intervals by following what suggested by our observations inside the real museum, therefore we think they are plausible at our level of approximation).
- 3.8
- As a function of both their (random) interest and patience for the various artworks, it is possible to calculate the real time level of satisfaction of the visitors during their cultural tour inside the museum: in particular, individual satisfaction increases with the number of artworks actually visited (proportionally to the corresponding interest) and decreases with the time W spent waiting around the fruition area for every artwork (proportionally to the corresponding patience), which in turn is affected by the presence of the other visitors (the exact expression for the satisfaction will be given later – see Eq.1). Once the visit is over, visitors exit from the main entrance/exit door in room 10, which is the same used to access the museum, and their final satisfaction is added to a global variable, called 'total satisfaction'. The latter will be divided, in turn, by the number of visitors involved, in order to calculate our main quantity of interest, i.e. the 'average satisfaction'.
- 3.9
- Combining the previous rules, in our model it can happen that an agent exits the museum without visiting all the artworks, in particular in a situation of overcrowding. Of course it would be possible to complicate all these movement rules as much as it is required (for example by allowing visitors to go back looking for some missed artworks), but in this paper we intended to capture the visitors' dynamics in the simplest (but reasonable) way.
- 3.10
- For evaluating the carrying capacity of the museum, we need now to simulate the non-emergency dynamics for several stationary levels of crowding. These levels are obtained in correspondence of decreasing values of the mean inter-arrival time <ΔT> or, equivalently, for increasing values of the average flow of incoming visitors defined as <F>=1/<ΔT>. For a given value of <F>, expressed here in visitors per minute (vis./m), we let the simulation run until a stationary number Nstat of visitors are simultaneously present in the museum. In general this happens after a time interval (transient) of around 2000 s.
- 3.11
- In the top panel of Fig.3 we plot Nstat as function of <F>, averaging over 5 different events. As one could expect, we find that the stationary number of visitors inside the museum rapidly increases by increasing the incoming flow. Also the average visiting time <Tvis> (calculated over a sample of 200 agents in the stationary regime) increases with <F>, as shown in the middle panel of the same figure, but with a different slope: in fact, it stays quite constant for relatively small values of the incoming flow (up to about <F> =8 vis./min), then it begins to increase; finally, above the threshold value <F> = 40 vis./min, it tends again to a stationary value (about 16 or 17 minutes) which no longer depends on the crowding.
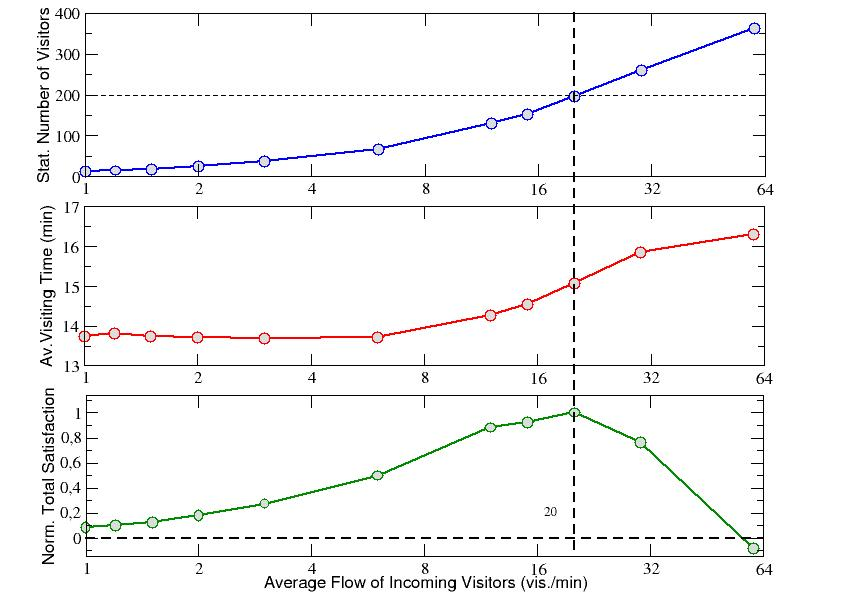
Figure 3. Top panel: The stationary number of visitors simultaneously present inside the museum is plotted for increasing values of the average flow of incoming visitors <F>. Middle panel: Average visiting time as function of <F>. Bottom panel: Normalized total satisfaction as function of <F>. An average over 5 events has been considered for each point of the three panels (the relative error for each point is of about 5%). - 3.12
- Before addressing the bottom panel of Fig.3, let us evaluate how the value of the incoming flow affects the real-time satisfaction of the visitors. If we call Nart the total number of artworks in the museum (in our simulations Nart=15), the satisfaction of the i-th agent at a given time step can be calculated through the following formula:
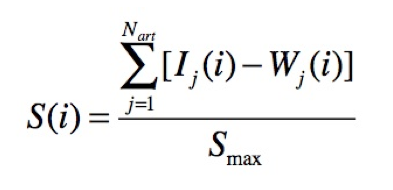
(1) where Ij(i) is the (random) values of interest (expressed in seconds) for the j-th artworks visited by the i-th agent and Wj(i) is the (random) waiting time spent by the same agent before accessing to the fruition space of the same artwork (these two quantities have been already defined before). If some artwork has not yet been visited by the visitor i-th at the considered time step we put of course Ij(i)=0 and Wj(i)=0. On the other hand, if for a given artwork (say for j=k) the waiting time Wk(i) of agent i-th overcomes the corresponding (random) patience Pk(i), the agent will skip that artwork and we will put Ik(i)=0 and Wk(i)=Pk(i) in Eq.(1). Finally, the normalization parameter Smax is defined as Nart (Imax – Pmax). Of course S(i) grows or decreases as a function of time until the visitor i-th is still inside the museum (if the number of skipped artworks becomes large – also due to a high level of crowding – the satisfaction can also assume negative values).
- 3.13
- In Fig.4 we show the single-run time evolution of both the number of visitors inside the museum (in the left column) and their average satisfaction <S> (in the right column, calculated averaging Eq.(1) over all and only the visitors present inside the museum at each time step) during the transient of 2000 s and for three events with increasing values of the average incoming flow (<F>=6, 20 and 60 vis./m respectively).
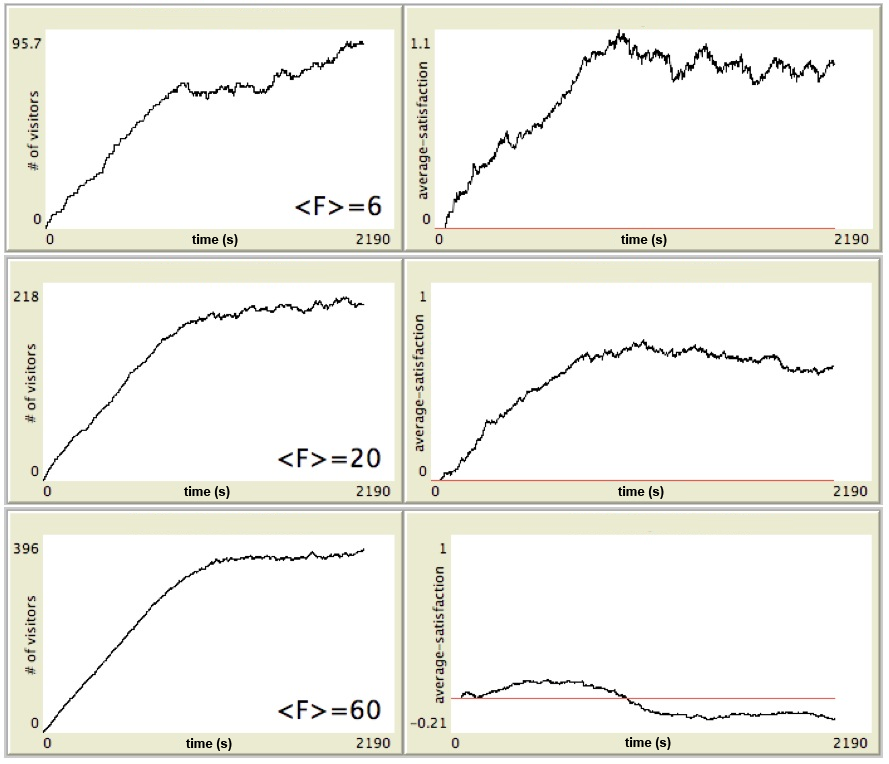
Figure 4. Real time evolution of both the number of visitors present inside the museum (left column) and their average satisfaction (right column), for three single events with increasing values of the average incoming flow <F>. - 3.14
- The plots in the left column confirm what has been previously observed, i.e. that this transient is necessary to reach the stationary number Nstat of visitors simultaneously present in the museum, a number that (as already shown in the top panel of Fig.3) increases with <F>. Notice that the fluctuating time evolution in the case <F>=6 is due to the small number of people involved (and to the fact that, at variance with the previous figure, we plot in this case only single events). However, for a larger interval of time, a convergence (in average) towards a stationary value could be observed also for <F>=6 (in Fig.4 we preferred to use the same interval of 2190 seconds for making uniform all the plots).
- 3.15
- In the right column, the corresponding average satisfaction is reported as function of time: as one could expect, it tends to increase as long as the number of visitors increases but, when the stationary number Nstat is reached, it tends to an asymptotic value which decreases with <F>, becoming also negative for <F>=60 when the fruition space has to be shared by too much visitors.
- 3.16
- Finally, in order to evaluate the global level of satisfaction of all the visitors for increasing levels of stationary crowding, we sum the satisfaction of each visitor leaving the museum after the transient of 2000 s. In particular, we perform this sum for samples of visitors with size equal to the value of Nstat corresponding to the chosen value of <F> (following the top panel of Fig.3). In such a way we obtain the total satisfaction Stot (normalized to its maximum value and averaged over the usual 5 events) which is plotted, as function of <F>, in the bottom panel of Fig.3. Quite surprisingly, this plot presents a maximum that is reached for an average flow <F> of 20 visitors per minute, which in turn corresponds to a stationary number of visitors Nstat=196 (some dashed lines have also been plotted to guide the eye).
- 3.17
- In order to better appreciate this interesting behaviour, in Fig.5 we plot again the total satisfaction Stot, but now as a function of the stationary number Nstat of visitors simultaneously present inside the museum. Furthermore, we report, in the same figure, the average satisfaction per person (which corresponds to the asymptotic value shown in Fig.4, here averaged over 5 events) and normalize the two quantities to their maximum values.
- 3.18
- As already observed in Fig.4, also in Fig.5 the average satisfaction per person (blue curve) decreases when the crowding increases. In particular, it presents its maximum value for small values of load of the museum and tends to become negative when the number of visitors overcomes 350 units.
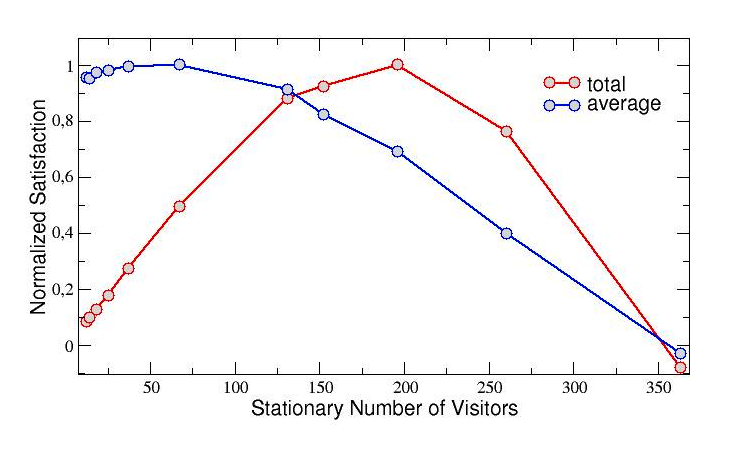
Figure 5. Normalized values of both the total and the average satisfaction as function of the stationary number Nstat of visitors present inside the museum. The satisfaction is calculated over samples of Nstat visitors who leave the museum and it is also averaged over 5 events. - 3.19
- On the other hand, the total satisfaction Stot (which can also be considered as substantially equivalent to the product between the average satisfaction and the number of visitors) shows again its maximum in correspondence of about 200 agents, as already observed in the bottom panel of Fig.3. We can conclude that such a value of crowding, evidently, represents the best compromise between the visitors' requirement of maximizing their personal satisfaction and the museum's requirement of maximizing the number of visitors simultaneously present inside the building. In other words, it results to be the best trade-off between a high level of service (point of view of the single visitor) and a high profitability of the museum (point of view of the building manager).
- 3.20
- On the basis of this result, that was quite hard to be a-priori predicted, we might reliably suppose that the number of 200 visitors is a good candidate to represent the real carrying capacity of the museum. Actually (see again the middle panel of Fig.3), this number results also consistent with a reasonable average visiting time (intermediate between the minimum and the maximum value) but we still have to test if it also meets the safety conditions. In the next section we will check this requirement by simulating an emergency scenario.
Emergency dynamics: movement rules and simulation results
- 4.1
- Let us focus on what happens when, after a transient non-emergency regime within the museum, an alarm situation suddenly arises. In such a situation, of course, the behaviour dynamics of the agents changes as well as their average speed: in order to take into account the faster pace typical of an alarm situation, we rescaled the time by dividing it for a factor 1.66, thus obtaining an average velocity of 1 m/s. We first consider the existing configuration of three internal emergency exits.
- 4.2
- Actually, as soon as an emergency alarm randomly goes off, each visitors checks if there is one of the three emergency exits overlooking the central courtyard within his radius of vision. If this is the case, he moves towards that direction, otherwise, if emergency signs are present and visible to him, he follows them; if not, he goes backward following the same path where he came from, until the external door is found (see the flowchart in Fig.6, which was inspired by the existing evacuation plan for the Castello Ursino museum). Of course, visitors gathered in the courtyard, rapidly make their way towards the intermediate emergency exit then, finally, they reach the main entrance/exit door in room 10 (see also Fig.2).
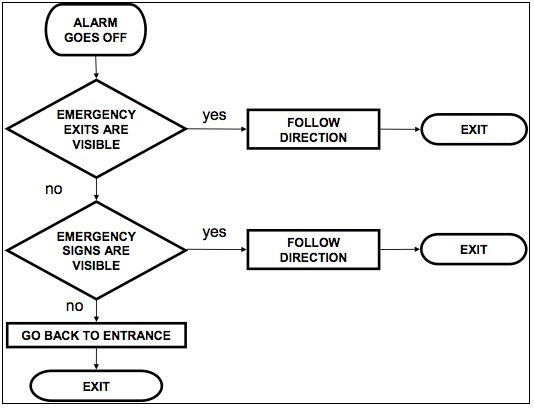
Figure 6. Flowchart of emergency dynamics. 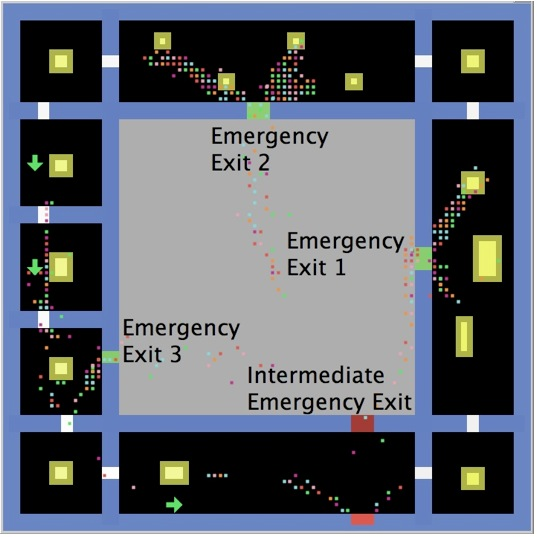
Figure 7. An example of evacuation through the courtyard in the existing configuration of three emergency exits. - 4.3
- In our simulations of the emergency dynamics we let the alarm randomly go off after the usual transient of 2000 s, i.e. only after that, for a given average flow of incoming visitors <F>, the number Nstat of visitors simultaneously present inside the museum has become stationary (as shown in the top panel of Fig.3, Nstat is a function of <F>, therefore one may consider these two quantities as interchangeable). At this point, according with the emergency procedure of the flow chart in Fig.6, the visitors reach the nearest emergency exit within their radius of vision.
- 4.4
- A snapshot of a possible situation created by such a dynamics after an alarm event is shown, just to give an example, in Fig.7, where the configuration with three emergency exits (which is the existing one in the real museum) is reported. The formation of crowding people in front of these three emergency exits is clearly visible, as well as the flow of visitors inside the courtyard towards the intermediate emergency exit. On the other hand, people coming from room 1 and from the left part of room 10 (see again Fig.2 for the rooms' numbers) go directly to the main entrance/exit, as expected from the flow chart prescriptions.
- 4.5
- In Fig.8 we plot the number of visitors crossing the available emergency exits as function of time, for four increasing values of the incoming flow (<F>=5,10, 20 and 60 vis./m). In particular, we consider three different configurations of the exits: the one actually existing in the real museum, with three available emergency exits overlooking the courtyard, and other two alternative configurations with, respectively, only two (exits 1 and 2) and only one exit (exit 2) available (of course the model might be easily adapted and employed to test different designs and configurations as well).
- 4.6
- As one can see, the majority of the visitors access to the courtyard through exit 2 (red dashed curve), while only a small number of them use exit 3 (green dot-dashed curve). When all the curves saturate (becoming stationary), it means that no more visitors are using the three exits, i.e. all visitors have now entered the courtyard in order to reach the intermediate emergency exit. The time at which this happens (corresponding to the inflection point of the curves) visibly grows with the increasing flow (it goes from 40–50 s for <F>=5 to 120 s for <F>=60 vis./m, independently of the number of exits available).
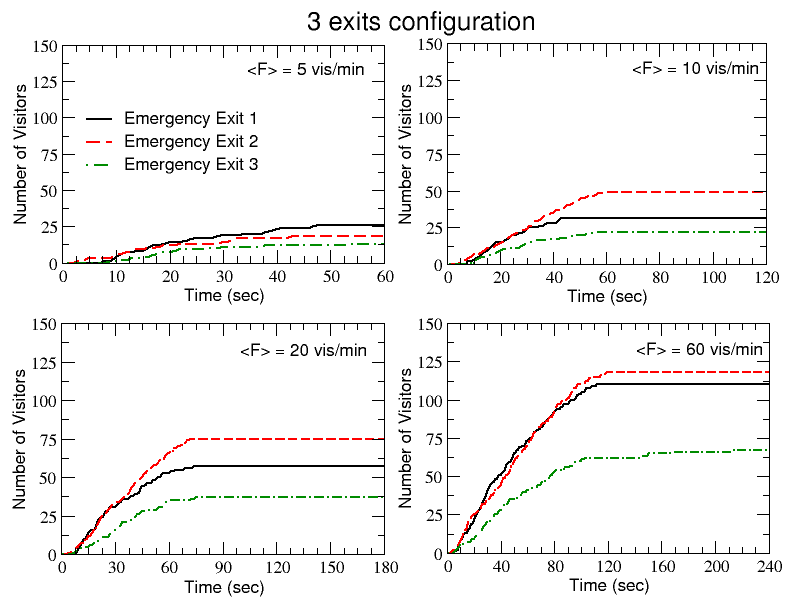
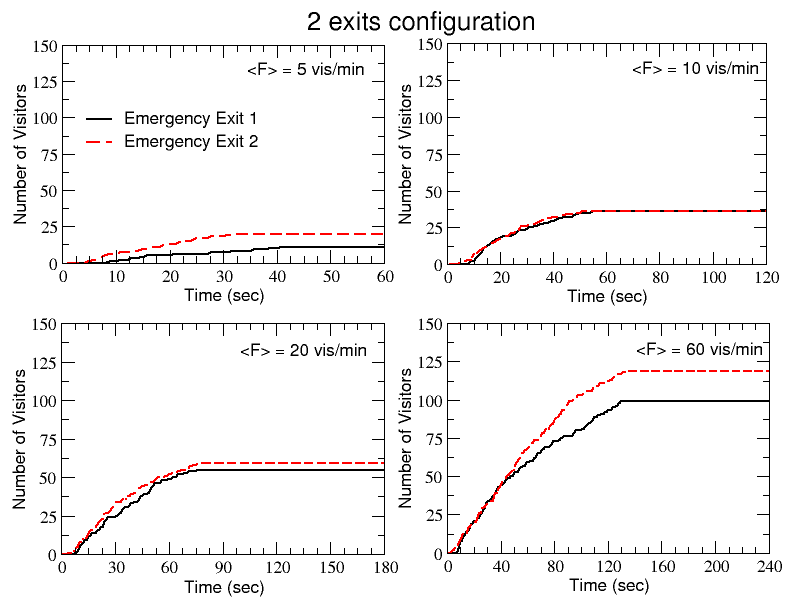
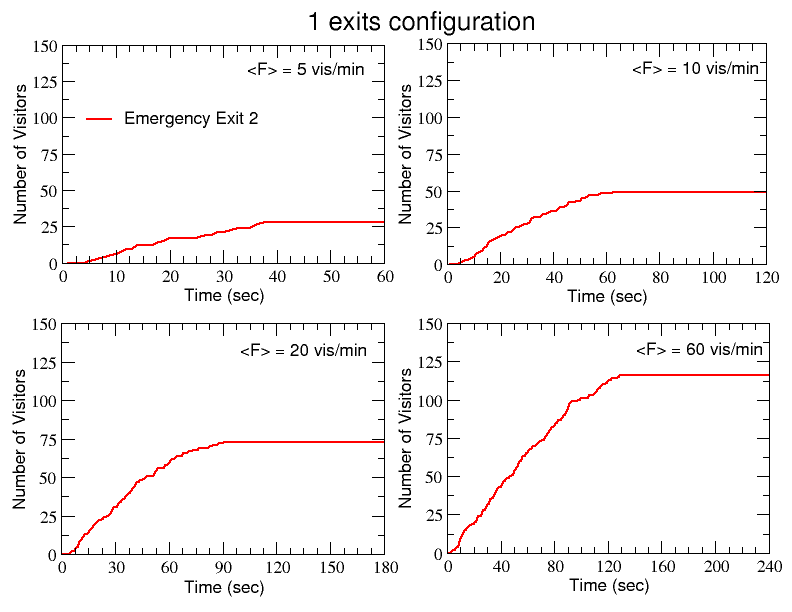
Figure 8. Emergency dynamics simulation. The number of visitors leaving the three emergency exits during single runs are reported as function of time for the three configurations with, respectively, 3, 2 and 1 available exits and, in each case, for increasing values of the average flow of incoming visitors. - 4.7
- It is worth noticing that the total number of agents who left all the available emergency exits for the three configurations presented in Fig.8 is not constant, even in correspondence of the same value of <F>, i.e. even though there is more or less the same number of visitors inside the museum when the alarm occurs (compare for example the panels with <F>=60 vis./min for the configurations with two and one available exits). In fact, as previously explained, not all the visitors use the emergency exits overlooking the courtyard but some of them (in a quantity depending on the number of emergency exits available) go back directly to the main entrance/exit.
- 4.8
- The component of visitors going back directly to the main entrance/exit can be better appreciated if we plot the distribution of visitors, collected over five different independent events, as function of their respective escape time. This is done in Fig.9, again for the three configurations with three, two and one emergency exits and for increasing values of <F>. In each panel are clearly distinguishable two peaks. The main one, on the right, includes the visitors using all the emergency exits available and also the intermediate one, before reaching the main entrance/exit: these visitors need a longer time to evacuate, due to both the longer distance to run (including the internal courtyard path) and the crowding around the emergency exits. On the other hand, the lower peak on the left includes exactly that part of visitors closer to the main entrance/exit that rapidly evacuate the museum, going out with a shorter escape time (from around 10 s for <F>=5 vis./m to around 40 s for <F>=60 vis./m).
- 4.9
- As one could expect, a shift towards higher average escape times is visible for both the peaks when the incoming flow increases. This implies that the average escape time <Tesc>, calculated over the entire bimodal distribution (and reported in the legend of each panel), also increases with <F> for each one of the three configurations. In this respect, comparing the <Tesc> when passing from three to only one emergency exit available for the same value of <F>, it is interesting to notice that <Tesc> stays quite constant or slightly oscillates for <F>=5 vis./min or <F>=10 vis./min, and shows a decrease from 106 to 98 s for <F>=20 and from 134 s to 120 s for <F>=60: this seems to suggest that, from the point of view of the average escape time, it would be more effective to keep open only the emergency exit 2 rather than two or three emergency exits (see also Camillen et al. 2010).
- 4.10
- The explanation of this apparently counter-intuitive result is simple and concerns people moving directly towards the main entrance/exit when only the emergency exit 2 is open. Actually, we know that – in general –, after the alarm, a given visitor goes backward along his/her path only if there are no emergency signs inside its radius of vision. But in rooms 6 and 7 there are two emergency signs indicating the counter-clockwise direction, therefore, when exit 3 is closed, visitors situated in rooms 6 and 7 move immediately towards that direction until they reach the main exit in room 10. At the same time, visitors in rooms 8 and 9 (where there are no signs) firstly tend to go backward (clockwise) towards room 7, but there – again following the emergency sign – they invert their motion and go forward (counter-clockwise) towards room 10. Also visitors situated in the left part of room 10, where is present another emergency sign, go immediately towards the main exit, while visitors in rooms 1, 2 and 3, being closed the emergency exit 1 and in absence of emergency signs, go backward (clockwise) until they reach the main exit in room 10. In conclusion, all these visitors leave the museum without passing through the courtyard. This explains why the average escape time slightly decreases when only exit 2 is open, according to the results presented in Fig.9.
- 4.11
- Of course the average escape time could not be considered the best indicator for testing the effectiveness of the emergency system of the museum. More likely, one should be more interested in evaluating the global evacuation time, i.e. the time required for all the visitors to leave definitively the museum through the entrance/exit door of room 10. In Fig.10 we plot such a quantity as function of the stationary number Nstat of visitors present into the museum at the alarm moment (which, as previously observed, is in turn an increasing function of <F>), averaged over five different events.
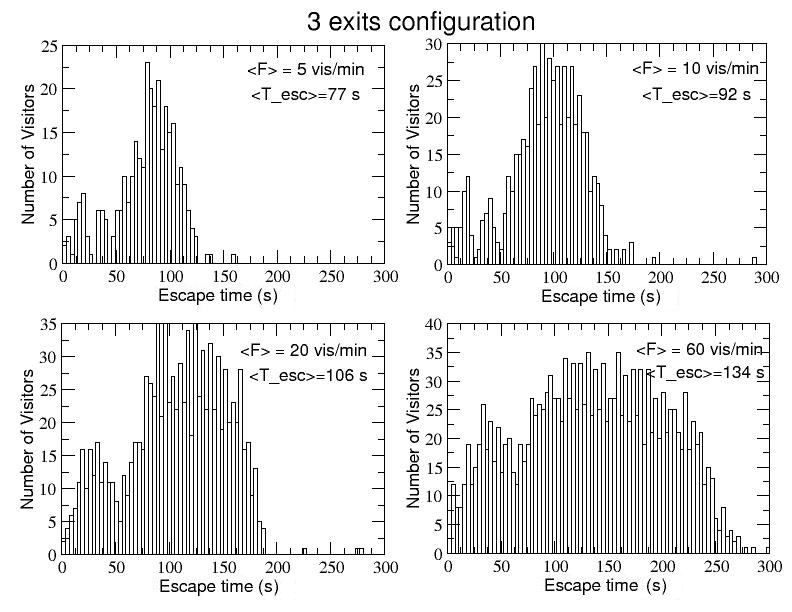
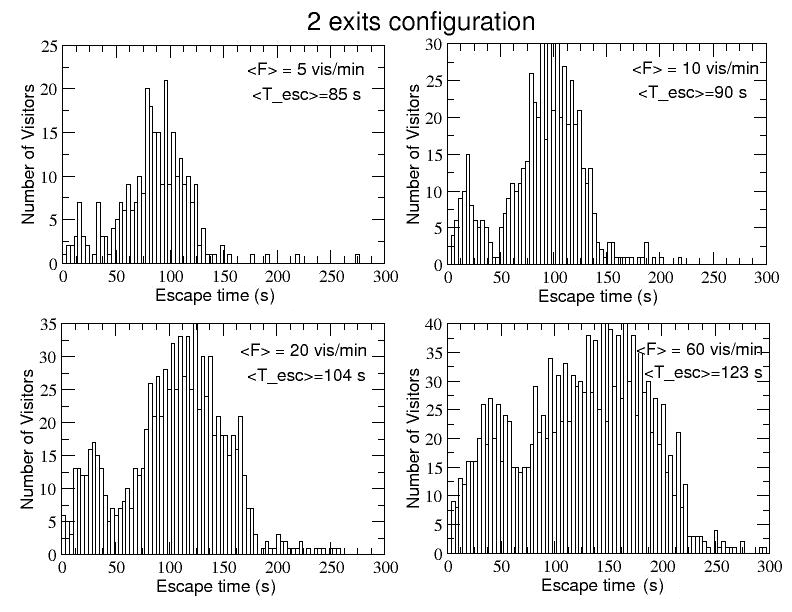
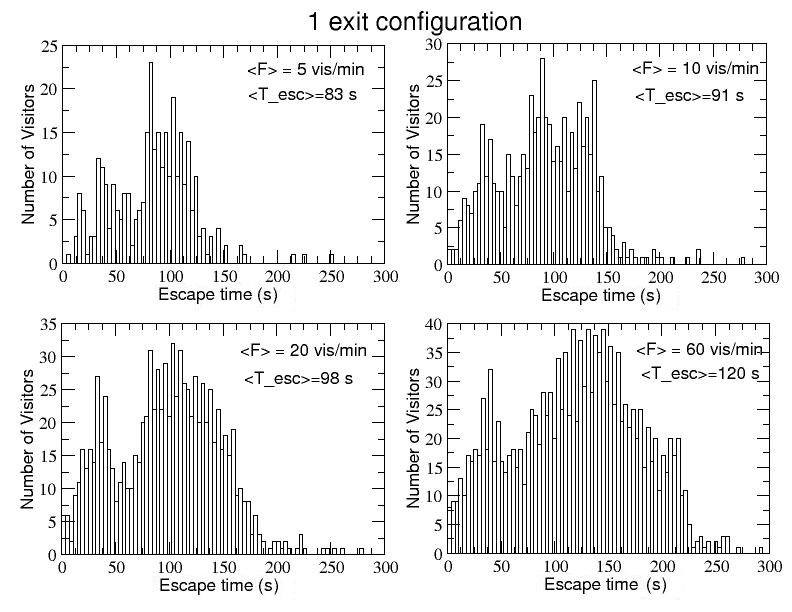
Figure 9. Emergency dynamics simulation. The frequency distributions of the visitors as function of the single agents' escape time are reported for the three configurations with 3, 2 and 1 exit and, in each case, for increasing values of the average flow of incoming visitors. 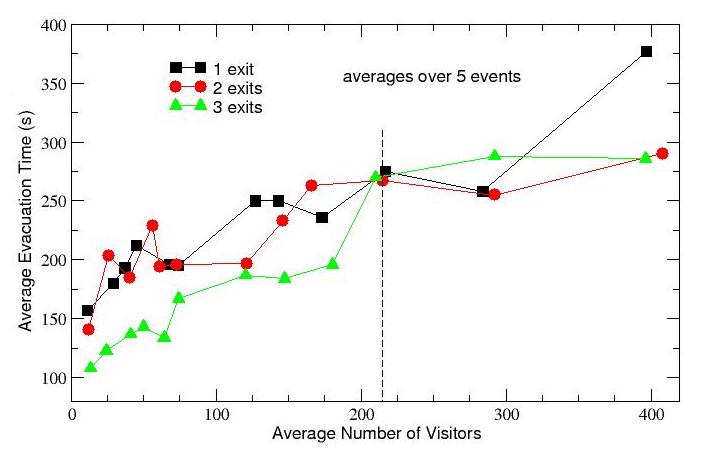
Figure 10. Emergency dynamics simulation. The global evacuation time, averaged over 5 different events, is reported as function of the (average) stationary number of visitors Nstat inside the museum when the alarm goes off. - 4.12
- The three curves refer to the usual three emergency exits configurations (with all the three exits open, with only exits 1 and 2 open and with only exit 2 open, respectively). Again, as one could expect, the global evacuation time increases increasing Nstat for all the three configurations.
- 4.13
- Notice that the resulting graph can be roughly divided in two different parts: in the first part, for 0 < Nstat < 215, the 3-exits configuration curve (green) stays always below the other two curves, thus resulting more convenient; in the second part, for Nstat > 215, it is the 2-exits configuration that seems more effective, while – on the other end – the 1-exit configuration curve diverges for high levels of crowd. But just around an average number of 215 visitors, the three configurations appear to behave in the same way, giving an average evacuation time of 270 seconds, a little less than 5 minutes. Quite interestingly, this number of visitors is very close to 200, i.e. to the optimal number that, as we shown in the previous section, would represent the carrying capacity of the museum in terms of collective satisfaction.
- 4.14
- We can conclude that the global maximum of satisfaction seems to be compatible with an acceptable level of safety, i.e. with a reasonable evacuation time, independently from the configuration of emergency exits adopted. Therefore, since the number of 200 visitors represents the best compromise between satisfaction and safety constraints, it can be reliably considered as the best carrying capacity estimation of the Castello Ursino museum, of course within the limits and the strong approximations of our simulation.
Conclusions
- 5.1
- Agent-based simulations show their potential in many context of transport management, in particular in pedestrian dynamics. We illustrated these ideas with an example based on the simulation of people visiting and evacuating a museum. This case study offers an excellent test environment for our prototypical original model, implemented within the NetLogo free software platform and able to simulate the complex dynamics emerging from local individual movements in a closed space, both in normal and in emergency conditions.
- 5.2
- In the non-emergency regime we found the optimal number of visitors ensuring a maximum in the global satisfaction, while in the alarm regime we tested the effectiveness of the existing evacuation plan for different configurations of available exits and for several rates of incoming flow of visitors.
- 5.3
- Merging the results of all these simulations, we confidently fixed the best carrying capacity estimation of the museum around 200 visitors simultaneously present inside. It would be interesting, at this point, to validate this result with reality through extended, and statistically significant, surveys and tests inside the Castello Ursino museum. We hope this could be the target of a future investigation.
- 5.4
- In any case, on one hand, our findings confirm the convenience and the effectiveness of agent-based simulations in design and analysis of complex pedestrian behaviour, fully supporting more traditional strategies already available to the engineers. On the other hand, they also show the power and the flexibility of NetLogo platform and in particular of our model, that could be easily adapted, modified and extended beyond the case study chosen in this paper, in order to simulate pedestrian dynamics in other scenarios and/or in more specific emergency situations.
Notes
- The NetLogo Model can be retrieved at the Open ABM web site: http://www.openabm.org/model/3775/version/1/view.
References
- ANTONINI, G., Bierlaire M. and Weber M. (2006). Discrete choice models of pedestrian walking behaviour. Transportation Research Part B 40, 667–687. [doi:10.1016/j.trb.2005.09.006]
BATTY, M. and Jiang, B. (1999). Multi-agent simulation: New approaches to exploring space–time dynamics within GIS. Centre for Advanced Spatial Analysis, Working Paper Series, Paper 10, Univ.College London.
BATTY, M. (2001). Agent-based pedestrian modelling. Environment and Planning B: Planning and Design, 28(3), 321–326. [doi:10.1068/b2803ed]
BATTY, M. (2003). Agent-based pedestrian modelling In P.A. Longley & M. Batty (Eds.) Advanced spatial analysis: the CASA book of GIS. (pp. 81–108). Redlands, US: ESRI Press
BERROU, J. L., Beecham, J., Quaglia, P., Kagarlis, M.A. and Gerodimos, A.(2005). Calibration and validation of the Legion simulation model using empirical data. Pedestrian and Evacuation Dynamics. Springer Berlin, Heidelberg, 167–181.
BLUE, V.J. and Adler, J.L. (2001). Cellular automata micro-simulation for modeling bi-directional pedestrian walkways. Transportation Research Part B 35, 293–312. [doi:10.1016/S0191-2615(99)00052-1]
BURSTEDDE, C., Klauck, K., Schadschneider, A. and Zittartz, J. (2001). Simulation of pedestrian dynamics using a two-dimensional cellular automaton. Physica A 295, 507–525. [doi:10.1016/S0378-4371(01)00141-8]
BUTLER, S. (1978). Modelling pedestrian movements in central Liverpool. Working Paper 98, Institute of Transport Studies, University of Leeds.
CAMILLEN, F., Caprì, S., Garofalo, C., Ignaccolo, M., Inturri, G., Pluchino, A., Rapisarda, A. and Tudisco, S. (2010). Multi agent simulation of pedestrian behaviour in closed spatial environment. In Publication on Proceedings to TIC-STH Symposium on Human Factors and Ergonomics. IEEE Catalog Number: CFP0956G CDR ISBN: 978-1-4244-3878-5, Library of Congress: 2009900493.
CHAKRABARTI, B.K., Chakraborti, A. and Chatterjee, A. (2006). Econophysics and sociophysics: trends and perspectives. Wiley-VCH. [doi:10.1002/9783527610006]
DI GANGI, M. and Velonà, P. (2007), Safety of users in road evacuation: pedestrian outflow models in a building. Urban Transport XIII, Brebbia C. A. (ed.), WIT Press.
GAROFALO, C. (2007). La Carrying Capacity - Saggio di Sociologia Matematica e Computazionale. Simonelli Editore.
GWYNNE, S., Gale, E.R., Owen, M., Lawrence, P.J. and Filippidis, L. (1999). A review of the methodologies used in the computer simulation of evacuation from the built environment. Building and Environment, 34, 6, 741–749(9). [doi:10.1016/S0360-1323(98)00057-2]
HELBING, D. (1992). A fluid-dynamic model for the movement of pedestrians. Complex Systems 6, 391–415.
HELBING, D. and Molnár, P. (1995). Social force model for pedestrian dynamics. Physical Review E, 51, 5, 4282–4286. [doi:10.1103/PhysRevE.51.4282]
HELBING, D., Farkas, I. J., and Vicsek, T. (2000). Simulating dynamical features of escape panic. Nature 407, 487–490. [doi:10.1038/35035023]
HELBING, D., Farkas, I. J., Molnar, P., and Vicsek, T. (2002). Simulation of Pedestrian Crowds in Normal and Evacuation Situations. Pedestrian and Evacuation Dynamics, Springer, Berlin, 21–58.
HENDERSON, L. F. (1974). On the Fluid Mechanic of Human Crowd Motions. Transportation Research 8, 509–515. [doi:10.1016/0041-1647(74)90027-6]
IGNACCOLO, M., Caprì, S., Giunta, U. and Inturri, G. (2006). Discrete Choice Model for Defining a Parking-Fee Policy on Island of Ortigia, Siracusa. Journal of Urban Planning and Development, ASCE. [doi:10.1061/(ASCE)0733-9488(2006)132:3(147)]
ISFORT (2006). 3° Rapporto sulla mobilityà urbana in Italia. http://www.isfort.it.
KIRCHNER, A., and Schadschneider, A. (2002). Simulation of evacuation processes using a bionics-inspired cellular automaton model for pedestrian dynamics. Physica A 312, 260–276. [doi:10.1016/S0378-4371(02)00857-9]
KITAZAWA, K. and Batty, M. (2004). Pedestrian behaviour modelling: An application to retail movements using a genetic algorithm. In Seventh international conference on design and decision support systems in architecture and urban planning.
KOH, W. L., Lin, L. and Zhou, S. (2008). Modelling and simulation of pedestrian behaviour. Proceedings of the 22nd Workshop on Principles of Advanced and Distributed Simulation, IEEE. [doi:10.1109/pads.2008.27]
KULIGOWSKI, E.D., Peacock, R., and Hoskins, B.L. (2010). A Review of Building Evacuation Models. 2nd Edition. Secretary, 1680. Available at: http://www.nist.gov/manuscript-publication-search.cfm?pub_id=906951
LEGION (2013). http://www.legion.com. Accessed on April 19, 2013.
MITCHELL, D. H. and MacGregor Smith J., (2001). Topological network design of pedestrian networks. Transportation Research Part B 35, 107–135. [doi:10.1016/S0191-2615(99)00039-9]
OECD, (1998), Safety of vulnerable road users. Organisation for Economic Co-operation and Development OECD, Paris
OLDER, S. J. (1968). Movement of pedestrians on footways in shopping streets. Traffic Engineering and Control, 10, 4, pp. 160–163.
OSARAGI, T. (2004). Modeling of pedestrian behavior and its applications to spatial evaluation. Proceedings of the third international joint conference on autonomous agents and multi-agent systems.
PAPADIMITRIOU, E., Yannis, G. and Golias, J. (2009). A critical assessment of pedestrian behaviour models. Transportation Research Part F 12, 242–255, Elsevier. [doi:10.1016/j.trf.2008.12.004]
PUSHKAREV, B. and Zupan, J. M. (1971). Pedestrian Travel Demand. Highway Research Record 355.
RONCHI, E., Colonna, P., Capote, J., Alvear, D., Berloco, N. and Cuesta, A. (2012). The evaluation of different evacuation models for assessing road tunnel safety analysis. Tunnelling and Underground Space Technology, 30, 74–84. [doi:10.1016/j.tust.2012.02.008]
SARMADY, S., Haron, F. and Talib, A. Z. H. (2008). Multi-Agent Simulation of Circular Pedestrian Movements Using Cellular Automata. Second Asia Intern. Conf. on Modelling & Simulation, 654–659, IEEE. [doi:10.1109/ams.2008.104]
SCHADSCHNEIDER, A., Wolfram, K., Hubert Klüpfel, H., Kretz, T., Rogs, C. and Seyfried, A. (2008). Evacuation Dynamis: Empirical Results, Modeling and Applications. In B. Meyers (Ed.), Encyclopedia of Complexity and System Science, Springer, Berlin.
SCHELHORN, T., O'Sullivan, D., Haklay, M. and Thurstaion-Goodwin, M. (1999). STREET: An Agent-based Pedestrian Model. Centre for Advanced Spatial Analysis (http://www.casa.ucl.ac.uk/working_papers.htm).
STILL, G. K. (2000). Crowd Dynamics. PhD Thesis of University of Warwick, Coventry, United Kingdom.
TRANSPORTATION RESEARCH BOARD (2010). Highway Capacity Manual Vol. 1. Washington DC.
WEIFENG, F., Lizhong, Y., and Weicheng, F. (2003). Simulation of bi-direction pedestrian movement using a cellular automata model. Physica A, 321, Issues 3–4, 633–640. [doi:10.1016/s0378-4371(02)01732-6]
WILENSKY, U. (1999). NetLogo. Center for Connected Learning and Computer Based Modeling. Northwestern University, Evanston, IL. http://ccl.northwestern.edu/netlogo