
 Abstract
- This paper examines the use of qualitative information in
the construction of an agent- based model in order to study the growth
of near-Zero Energy Buildings (nZEB's) in the
Netherlands through the innovation systems perspective. Drawing on
desktop research and semi-structured interviews, this paper offers two
major findings. First, we observed that the difficulties to the
development of nZEB's have been shaped by
interaction and institutional barriers: the inner complexity of the
building sector has decisively impacted on the growth of nZEB's.
Second, exploring interviewees' understanding of the system via an
agent-based model has brought fresh insights about the problem.
Overall, this is a call for an interdisciplinary approach to understand
the changes required for nZEB's in their path for a
successful adoption. Agent-based computational modelling, complemented
with knowledge that was elicited from several stakeholders within the
building sector, has helped to inspect the implication of common
beliefs in the course of shaping possible futures toward a transition
to nZEB's.
- Keywords:
- Agent-Based Model, Near-Zero Energy Buildings, Innovation Systems, Knowledge Elicitation, Systemigrams
Introduction
- 1.1
- The EU (European Union) has developed the "Europe 2020"
growth strategy, in which "climate change and energy sustainability"
plays a crucial role as one of the five main targets (European Commission 2013).
The EU has stated in "Europe 2020" the following ambitious goals: i)
GHG
(Greenhouse gas) emissions 20% lower in 2020 than in 1990; ii) 20% of
energy from renewable resources; and iii) 20% increase in energy
efficiency. From these objectives, both the first and the second ones
have become a policy measure in the Netherlands (Verhagen 2012). The building
sector accounts for 20% of the total energy consumption in the
Netherlands (Menkveld &
Beurskens 2009). Considering near-Zero Energy Buildings (nZEB's)
as those with extremely low energy needs that largely depend on
renewable resources, Directive 2010/31/EU Article 9 requests "Member
States shall ensure that by 31 December 2020 all new buildings are
nearly zero-energy buildings; and after 31 December 2018, new buildings
occupied and owned by public authorities are nearly zero-energy
buildings" (European Parliament
2010). Although the importance of energy-neutral housing is
recognized by the Dutch government, in practice the construction of nZEB's
has not become a reality (Faber
& Hope 2013).
- 1.2
- The transition from building traditional housing towards
building nZEB's, however, is a difficult and
complex process that goes beyond technological challenges. Furthermore,
little is known about how this issue can be approached. Therefore,
the challenges of nZEB development are numerous,
including understanding the interests of the several actors that are
part of the system. Not all actors involved in this transition discern
problems in the same way (Newell 1990;
Jorna 2006; Rosales-Carreón 2012).
Consequently, the perception of barriers that impede the transition
towards more energy efficient buildings may differ significantly from
one actor to another.
- 1.3
- One of the challenges lies in understanding the knowledge that actors possess and share, which has important implications on either facilitating or hindering the transition towards the construction of nZEB's. This paper examines, first, the way different actors perceive barriers that hamper the transition towards construction of nZEB's in the Netherlands. Second, it provides insights on how this knowledge is disseminated within the system. Given the pluralistic nature of the problem, we have approached the study from an interdisciplinary perspective. Interdisciplinary research integrates perspectives from two or more bodies of specialised knowledge to solve problems whose solutions are beyond the scope of a single discipline (Schoot-Uiterkamp & Vlek 2007). Therefore, this paper aims at integrating several perspectives (knowledge management, systems innovation, energy efficiency, and agent-based modelling (ABM)). From information gathered from different actors in the construction sector, we built a simple computational model that served as a vehicle to explore different scenarios for nZEB diffusion. The next section explains the proposed approach, which ultimately aimed at formulating a model that represents how relevant actors involved in nZEB construction interact.
Approach
- 2.1
- This paper considers a systematic way of incorporating
knowledge from several actors into an agent-based (AB) model that helps
to explore possible scenarios for the diffusion of nZEB's
in the Netherlands. The purpose of the model is not to faithfully
capture all aspects and details of the Dutch building system. Rather,
the purpose of it is to enrich our understanding of the key
knowledge-related processes that are present within the system. We
propose to structure the development of an agent-based (AB) model
around six steps. First, the system and its boundaries must be clearly
defined. Second, knowledge regarding how different actors represent the
building system has to be elicited. The third step consists in
identifying the barriers that impede the progress towards the
edification of nZEB's. Fourth, after discussing the
qualitative findings among experts (e.g., researchers), the model is
formulated. The model is then shared and discussed with some
stakeholders. The fifth step consists in carrying out different
simulations once the model has been (internally) validated. Finally,
the results are discussed in order to disclose important implications
for the deployment of the innovation system. Figure 1 depicts the steps
needed to build an AB model based on elicited knowledge.
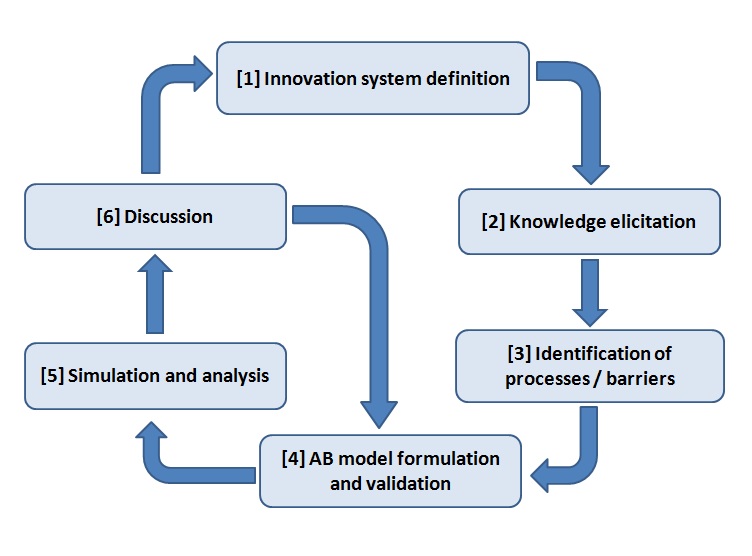
Figure 1. Building process coupling knowledge elicitation with an agent-based (AB) model Case Study: Near-Zero Energy Buildings in the Netherlands
- 2.2
- Relevant frameworks for system analysis can be found in the
literature on innovation systems. The concept of 'innovation systems'
has gained prominence in policymaking since the 1990s as it provides a
qualitative explanation for the sources of innovation and economic
growth that covers the role of policies and other institutions (Romer 1993). Different
innovation systems concepts have been scrutinized in the literature,
including national systems of innovation (Freeman
1987; Lundvall 1992;
Nelson 1993), regional
innovation systems (Asheim &
Coenen 2005; Cooke et al.
1997), sectoral systems of innovation and production (Malerba 2002) and
technological systems (Hekkert et
al. 2007). In this paper, we approach the subject through the
innovation systems perspective in general, and through a sectoral
innovation system viewpoint in particular, where the level of analysis
is the Dutch building sector.
- 2.3
- A sectoral innovation system (SIS) can be defined as "a set
of new and established products for specific uses and the set of agents
carrying out market and non-market interactions for the creation,
production and sale of those products." (Malerba
2002: 250). Klein-Woolthuis et al. (2005) summarize
failures or barriers—as we called them—into four basic categories: i)
infrastructural (i.e. physical infrastructure), ii) institutional (i.e.
norms), iii) interaction (i.e. relations in networks), and iv)
capability (i.e. lack of non-physical resources). This classification
allows identifying causes that hinder innovation. In our study, we
first try to get insights into the main barriers that impede the
construction of nZEB's. Second, we present a model
that depicts the interaction among relevant stakeholders.
- 2.4
- As stated by Malerba (2002),
the basic components of a
sectoral innovation system are: 1) product, 2) actors, 3) information
processes, and 4) interactions (including competition and
complementarities among actors / technologies). Accordingly, a
depiction of the main actors and interactions within the nZEB
sector is shown in Table 1.
There are four main phases in the project of developing new buildings.
The planning phase starts when an initiative is normally taken by a
property developer. A project management team is appointed to
coordinate the project. Then, a drafting of the contract by both
parties follows. Afterwards, during the design phase, specifications
are developed. Finally, the design is communicated to the
contractor(s). After the design phase, the actual construction of the
building takes place. That is the realization phase. Once the building
is constructed the project manager and the property developer inspect
it. The last phase is the delivery phase, where the building is sold
(or rented). House owners provide feedback on the delivered property by
means of energy consumption and—sometimes—by demanding buildings with a
specific energy performance.
Table 1. Actors involved in the different phases of near-zero energy buildings construction 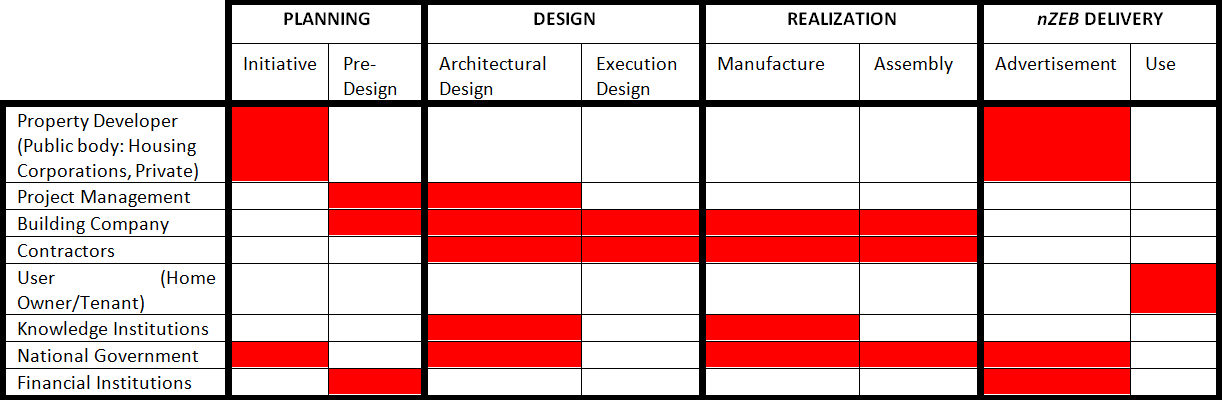
- 2.5
- Institutions also affect the system. The national
government dictates laws and provides guidance on the planning process,
construction standards, financial schemas (i.e. subsidies, mortgages)
and procurement aspects. Government influences knowledge institutions
through grant programs and development policies. Government also
provides information to potential homeowners. Knowledge institutions
develop and disseminate technology and knowledge of sustainability.
Last, financial institutions provide loans to property developers and
to potential home owners.
Knowledge Elicitation
- 2.6
- As mentioned above, interviews were conducted to explore
the possible barriers that hinder the building of energy-neutral
houses. The selected interviewees were:
- Project Managers: Six project managers were interviewed. They have an overall insight on the sector. They play a primary role in construction projects since their viewpoints affect the characteristics of the buildings to be constructed.
- Housing corporations: Three representatives of housing corporations were interviewed. These organisations are non-profit associations. They ensure an adequate supply of affordable, good-quality homes for those with middle and lower incomes.
- Municipality: Five civil servants from different municipalities were interviewed. The municipality plays the role to carry out policies, regulations and subsidies in the region. It assumes the responsibility of a regional development authority. These regulations might be compromised between high levels of energy performance and cost considerations.
- Building companies: Three representatives from different building companies were interviewed. Building companies have experience and knowledge in technical aspects of construction. However, their influence on key decisions may be limited, especially if they work in isolation.
- Contractors: Three contractors were interviewed. These actors contract with other organizations for the construction of buildings. They possess—literally—hands-on experience in the sector.
- Knowledge institutions: Two scholars in the field of energy resources and the building environment were interviewed. Not only do they develop knowledge in technical aspects of construction, but also in the social impact that this sector has.
- Financial institutions: One representative from a financial institution was interviewed. These actors are mainly concerned with the risk and return of the investment.
- Users: Three users were interviewed. Users benefit from energy efficient construction / retrofitting, although they may not be able to invest in energy efficient measures.
- 2.7
- These actors' profiles were chosen for their essential role
in the building system, as depicted in Table 1.
The participants were randomly selected while looking for recent
building projects in the province of Utrecht, the Netherlands. The
participants have been involved in both successful and unsuccessful
projects. Interviewees' participation was totally voluntary and no
incentives were offered to encourage them to participate.
- 2.8
- The interviews were conducted face-to-face with an
approximate duration of one hour. Semi-structured interviews were used
to allow actors to make an elaborated explanation of their opinions.
The interview consisted of two parts. In the first part, demographic
data was gathered. In the second part, the interviewees were asked
several questions regarding the process of building houses with energy
consumption nearly equal to zero, namely nZEB's.
However, the interviewees were not asked directly for the systemic
barriers. Questions aimed at providing indications of the four basic
barriers a system can have (see previous section). For the sake of
understanding perceptions related to infrastructural barriers, the
interviewees were invited to elaborate their thoughts on inputs and
technologies needed to build an nZEB. In order to
get information about institutional barriers, we enquired about
viewpoints related to legislation. Asking interviewees about desired
changes in the building environment allowed inspection of their
insights about interaction barriers. Finally, capability barriers were
identified by enquiring about the sources of information used by the
interviewee and his/her particular knowledge with regard to nZEB's.
The interview guide that was followed can be found in Appendix A.
- 2.9
- Miles and Huberman (1994)
argue that the richness of the information derived from the interviews
has the strength to reveal critical interactions of complex social
phenomena. However, they also acknowledge the fact that qualitative
case studies may suffer from limitations. In order to guarantee the
validity of the answers we obtained, we followed the directives
proposed by Wolcott (1990)
during the knowledge elicitation process: i)
elaborate an interview guide, ii) pre-test the interview guide, iii)
avoid the modification of the interview guide structure during the
interviews, iv) refrain from talking but rather listen carefully, v)
produce annotations that are as precise as possible, vi) write in an
early way, vii) employ a unique format to transcript the interview, and
viii) corroborate the information with the interviewee.
Data Analysis
- 2.10
- Once the interviews are finished, copied, and authorized by
the interviewees, the data derived from the interviews is analyzed. For
that, we used qualitative content analysis, which is one of the
procedures for analyzing textual material (Bauer
& Gaskell 2000). According to Flick (2006), qualitative analysis
looks for understanding of new situations and supports the discovery of
new information. Qualitative methods are appropriate in contexts where
it is necessary to first identify the variables that might later be
tested quantitatively. In each response key ideas were identified.
These ideas were merged into core themes. Below, we present some
results categorized according to i) the different phases of nZEB's
construction and ii) the barriers that may hinder the innovation
adoption.
Planning Phase
- 2.11
- Interviewees often mentioned the limited resources that
municipalities have in order to keep up with their initial ambitions of
building energy-neutral homes. Hoppe and Faber (2011)
have also
identified this situation. They suggest that this is a major cause of
the gap between ambition and realisation of energy-neutral projects. In
our study, several interviews showed that municipalities do not lay
enough emphasis on the requirements of energy performance stated in the
European energy policy.
"Such an agreement […on building energy-neutral homes by 2020]…these are mainly policy targets, but they are not really maintained. If you do not follow them it does not mean that you cannot construct. It does not mean that you will get a fine either or that you will get into trouble whatsoever." — Housing Corporation
Design and Realization Phases
- 2.12
- It appears that municipalities cannot make their voices
heard. Part of their income relies on land prices. Developers have a
negative connotation with regard to "energy-neutral building costs".
Additionally, they prefer to keep a construction routine that is well
known to them. Furthermore, housing associations lose part of their
income through the "landlord tax". Also, there are concepts that are
not well understood—or explained—by the different actors within the
building sector. For example, two related notions are "energy-neutral
house" and "energy performance certificate" (EPC).
"There is a poor communication related to these issues. For example, I do not know if neutral energy also means an EPC of zero. " — Project Manager
Interaction Barriers
- 2.13
- The economic crisis that began in 2008 hit the housing
market hard. House prices have fallen sharply. In addition, Dutch
energy regulations became stricter, thereby construction costs rose.
"Today's consumers simply cannot buy a house. Not to mention an energy-neutral house, this costs additional 20,000 euros. " — Project Manager
Institutional Barriers
- 2.14
- A number of other important emerging barriers include
issues with laws and regulations. Several respondents used the rental
sector as an example of restrictive regulations. For example, sometimes
the rental limit price for social housing is designated as a limit for
energy-neutral homes. The rental limit prescribes a maximum price so
that social housing remains affordable for low-income consumers.
However, in this situation, the extra costs for building an
energy-neutral house are not taken into account.
- 2.15
- Also, regulatory inconsistency is a source of
confusion.
Once, a municipality stopped the building of a biomass plant because of
a change in regulations. This caused irritation among actors:
"Then I think: Yes, Rich, make sure you take your responsibility, and take it fast otherwise there is the possibility of a sudden change.'" — Municipality
- 2.16
- Faber and Hoppe (2013)
also refer to the problem of regulatory inconsistency. They argue that
social support for energy efficient measures has decrease due to abrupt
policy revisions. Both the rental limit and the aesthetics committee
fail to take into account advantages of energy-neutral housing. In
addition,
inconsistent policy increases uncertainty and narrow down initiatives
in energy-neutral building.
- 2.17
- The complete analysis was summarized into a matrix. Table 2
exemplifies a glimpse of it.
Table 2: Determination of barriers for the construction of nZEB's.
INTERVIEWEEKEY IDEAS BARRIER PHASE "The municipality establishes private agreements. No building permit can be refused if you do not build according to the (...) agreed measures, but when in disagreement to the legal requirements." Municipalities do not put enough emphasis on the requirements for energy performance included in the energy performance certificate (EPC). Interaction Planning and Design "Builders and contractors have been long accustomed to squeeze subcontractors. They [builders and contractors] always go for the lowest price. A kind of fighting culture prevails in the construction sector." The choice of a particular contractor is mainly based on price. This forces contractors to focus on cost reduction. This situation prevents the use of more energy efficient systems. Interaction Design and Realization "Today's consumers simply cannot buy a house. Not to mention an energy-neutral house, which costs additional 20,000 euro." It is complicated to invest in energy-neutral housing projects in the current housing market. Institutional Delivery "The regulations make it difficult for us to build energy-neutral homes (...). We wanted to install solar panels on a meadow. We wanted to generate and deliver energy to our tenants. Well, this is not possible according to the government." Restrictive regulations exist for the installation of certain materials used to build energy-neutral homes. Institutional Design and Realization - 2.18
- The matrix relates opinions from the different interviewees
(first column) with key ideas behind those thoughts (second column). It
appears that the infrastructure and the capability needed to implement nZEB's
are already there. It also appears that the main barriers result in
institutional impediments and interaction complexity.
Agent-Based Modelling for Near-Zero Energy Buildings
- 2.19
- The core concern is how to foster the construction of nZEB's
that enable energy consumption reductions, amidst a landscape of a
decentralized set of purposeful interacting actors. The intricacy of
the dynamics and interaction of heterogeneous participants in the
adoption of better practices has called for a computational approach to
study such problems (Squazzoni
2008). Computational approaches have been used to understand
different implications of adoption scenarios (e.g. Schilperoord et al. 2008).
- 2.20
- The growth of ABM coincides with how the views and thinking
about urban systems has changed (e.g. Crooks
2012). Rather than adopting a reductionist view of systems,
whereby the modeller assumes that cities operate from the top-down and
results are filtered into the individual components of the system (see
Torrens 2001),
researchers are now adopting viewpoints that emphasise
relationships among entities (O'Sullivan
2004). This change follows the realisation that planning and
public policy do not always work in a top-down manner, and that
aggregate conditions develop from the bottom-up (i.e., emerging from
the interaction of a large number of elements at a local scale).
- 2.21
- Our objective is to explore scenarios than might assure the
construction and sale of nZEB's, which consequently
will lead to an eventual energy consumption reduction. The situation
depicted here might be considered as a diffusion problem. Yet, our
approach differs from other diffusion-related works in at least two
aspects: (i) diffusion models emphasise the positive externality effect
of adoption, which is commonly represented by a probability function
that depends on the current number of adopters (cf. Delre et al. 2007); (ii) other
works (e.g. Schwarz &
Ernst 2009) use well-known psychological frameworks to
inspect susceptibility to innovation adoption. In contrast, our work
deals with agents that possess different perceptions regarding barriers
that impede the construction of nZEB's. These
agents define certain qualitative courses of action that are contingent
upon several factors (Bharwani 2004),
such as prices, comfort levels, variable-specific sensitivities, and
sales expectations. Additionally, our work aims at a systems design
approach, and not merely at studying the determinants of specific
consumption patterns (cf. Azar
& Menassa 2012).
- 2.22
- Therefore, the use of an AB model is expected to bring forth courses of action that help nZEB construction practices to be adopted. The next sections offer details on how the elicited knowledge is integrated into a conceptual map, and how this map serves as an input for building a framework for agent specification. It is noteworthy to say that our modelling approach mainly considers the interaction elements (Table 2) and not the institutional elements. This might be a first stage of a longer research process, since modelling interaction-, information- and economic-related elements ("organizational physics") is much easier than including institutional or cultural components ("organizational chemistry" and "organizational biology"). See Levitt (2012) for a discussion on this.
Mapping
Qualitative Data into Conceptual Maps
-
Development of a Systemic Diagram
- 3.1
- Results from collected qualitative data were confronted
with the elaboration of a systemic diagram, similar to what is known as
a "systemigram" in systems engineering (Boardman
& Sauser 2008). Systemigrams were originally
conceived to convey both structured prose and graphical
representations, which result in a map of entities and their
interactions that reflect strategic plans (Blair
et al. 2007). Systemigrams, inspired by "soft systems
methodologies" (e.g. Checkland
1999), aim at visually representing strategic courses of
action in enterprise architectural design. Systemigrams may involve
multiple viewpoints from team members, and allow representing different
flow alternatives, from which "money flow" is usually a very insightful
one (cf. Boardman &
Sauser 2008).
- 3.2
- As Boardman and Sauser (2008)
point out, there are many other types of conceptual maps. However, they
argue that the advantage of systemigrams is their emphasis on holistic
thinking and strategic purpose, rather than linear thinking and
procedural plans. For that, these diagrams deploy a network-based
representation where nodes correspond to entities like actors and
factors of interaction, while links represent actions that relate such
nodes. Nodes are labelled with nouns, while links are labelled with
verbs. Some additional rules that Boardman and Sauser (2008) mention as requirements
to build good systemigrams include: (i) diagrams (congruent with the
mainstay) should read from top left to bottom right, (ii) ideally, the
ratio of nodes to links should be approximately 1.5, (iii) crossover of
links should be avoided.
- 3.3
- Importantly, we have used Boardman and Sauser (2008)'s systemic diagrams
with a clear different purpose than the one these diagrams are usually
used for in systems engineering. It is noteworthy to mention that,
although systemigrams have the main objective to unveil
counterintuitive dynamics in the search of strategic alternatives for
enterprise architecture, here the idea is to reveal all the
simultaneous forces and interdependencies among actors and factors so
that it is made explicit the implications and limitations of government
actions in fostering sustainable construction. A first difference is
that actors in the system under study have different, and conflicting,
strategic goals, and operate in a rather decentralized fashion. They do
not belong to a team with a unified strategic purpose and cannot be
boxed into a participatory scheme in order to come up with a manifesto
of sustainable construction. However, building a systemic diagram
allows representing the multiple interests of actors in a conceptual
model that is able to reflect the process dynamics in a visual way. A
second difference is that we chose to categorize the two major flow
dynamics in the same diagram (knowledge and money), according to our
interpretation of the text of the interviews.
- 3.4
- After reviewing and synthetizing the text of the
interviews, we came up with a graphical networked representation of the
system that was shared with both actors of the system and researchers
with expertise on the sustainable construction sector. The conceptual
map has been refined according to their inputs and suggestions.
- 3.5
- The interviews revealed a focus on mainly two types of
flows: knowledge and money flow. There are knowledge asymmetries among
the different actors in the system. Moreover, money flow is an
important driver of behaviour because ours is an economic-driven system
where some of the main behavioural triggers are related to construction
costs, house prices, energy consumption savings and financial standing.
In other words, while knowledge flow partially considers
construction-related practices, money flow represents a powerful way to
materialise economic incentives and explore the economic viability of
the
overall system. An additional feature we incorporated into the diagram
was a classification of links as to their predominant nature (i.e.
considering whether the link largely represents an interaction through
knowledge- or money-related transfers). Hence, the diagram
simultaneously displays both "money flow" and "knowledge flow" for the
sake of having a unique representational visual.
- 3.6
- The proposed systemic diagram can be observed in Figure 2. Our systemic diagram illustrates
two types of nodes: actors themselves (e.g. government, municipality,
contractors, etc.) and factors of interaction among actors (e.g.
prices, nZEB designs, loans, etc.). The state of
such factors can be modified according to the actions (connecting
links) of actors and/or other factors.
Identification of Main Money Flow and Knowledge Flow Asymmetries
- 3.7
- The nature of the intricate interdependence among actors is
clearly depicted in the systemic diagram (Figure 2).
Many issues that hinder the diffusion of sustainable practices were
already mentioned by the interviewees. For instance, while the property
developer initiates and delivers the final energy-neutral homes, he or
she has little monitoring power on subsequent cost transfers to
clients. Also, energy reduction capabilities are not fully internalized
in the money flow dynamics towards consumers' willingness to buy a
near-zero energy (nZE) home, and therefore nZE
home advantages lack of enough appeal to them. On top of
that, there is a lack of enforcement from governmental authorities
toward municipalities, which face a dilemma between fostering
construction of nZEB's and their own financial
viability through land sales.
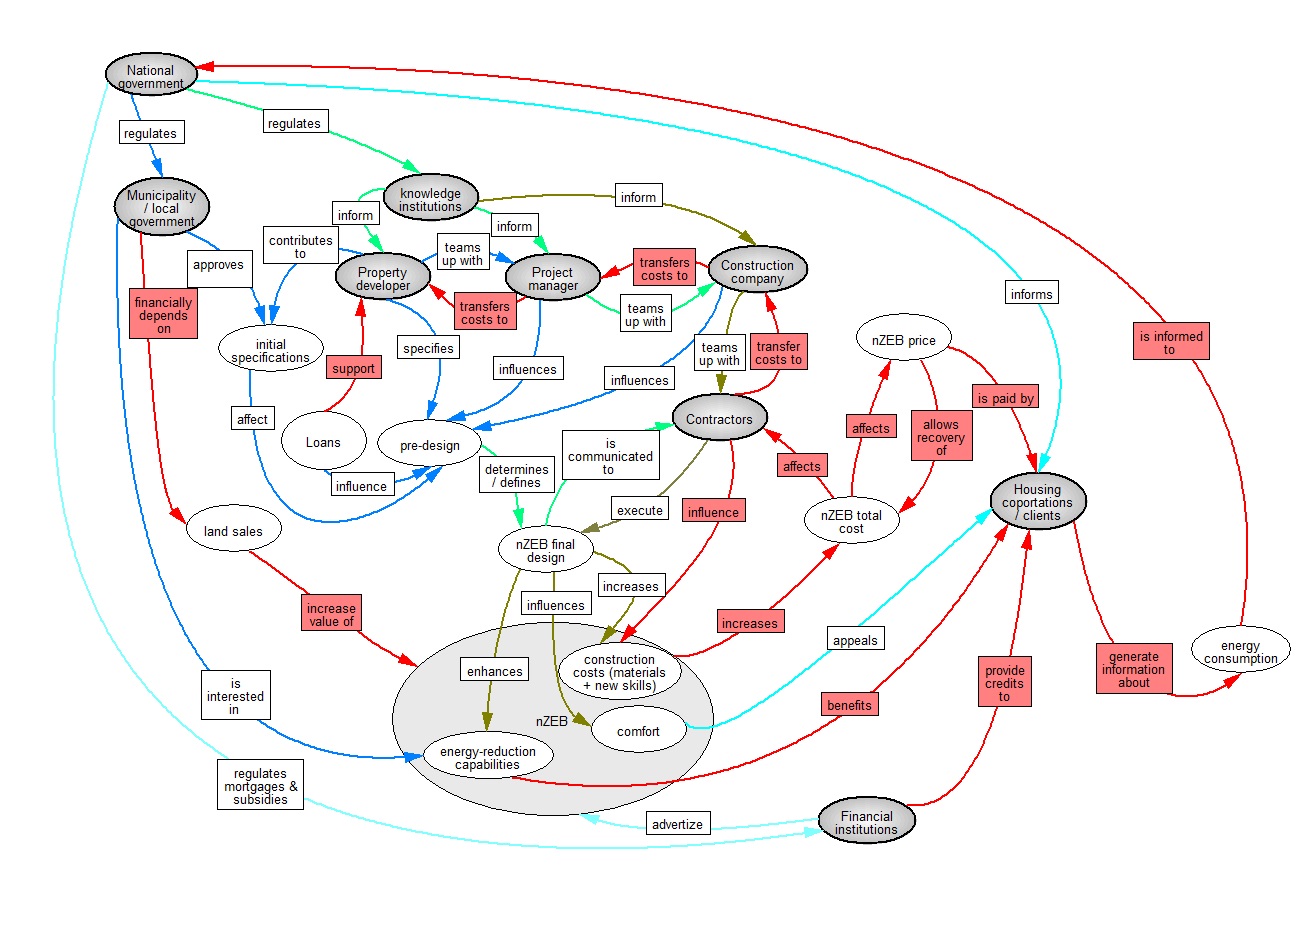
Figure 2. A systemic diagram depicting actors (dark gray ellipses) and relevant factors of interaction (white ellipses). Red colour represents "money flow", while the remaining colours represent "knowledge flow" according to the construction phases, as follows: blue = planning, green = design, khaki = realization, and cyan = delivery. - 3.8
- The systemic diagram reveals other conflictive issues not
explicitly addressed through interviews: (i) interviewees call for an
internalization of energy reduction capabilities on nZE home
rental prices for home owners (in case that owner rents
the property to someone else); however, it can be observed that such
internalisation might only work if it is embedded at multiple stages of
the nZEB production chain, since otherwise it would
imply home renters ending up transferring the energy saving benefits to
house owners, which might deter potential home renters from considering
nZE homes. Also, (ii) knowledge flow and money
flow appear to follow different dynamics. From the diagram, it is
possible to envisage that an intensive knowledge flow dynamics is
presented at the upper part of the construction chain, while the money
flow dynamics is more salient in the lower part. This implies that some
actors that are, in principle, interested in nZE
homes appear to have no clear economic-driven incentives to impulse
construction of nZEB's (e.g. construction
companies), although they possess a good degree of knowledge (e.g.,
they are involved in construction designs, are informed by knowledge
institutions, and possess a good insight about construction costs).
Building an Incidence Matrix
- 3.9
- We used the systemigram to build an incidence matrix: a
matrix that relates actors and factors (placed in both row and columns)
and their action-related link. The matrix allows clearly identifying
the number of actions a single actor performs or receives, which
denotes her or his scope of influence. Discernment of knowledge and
money flows permits identifying specific action triggers: diffusion of
desirable practices depend on how relevant actors consider knowledge at
their disposal to set future courses of action, within the frame of
money incentives.
- 3.10
- Although the rich picture provided by the systemic diagram
shows detailed intricacies of the system, the matrix provides a
criterion to choose which actors and interactions will be part of an AB
model in a clearer way. For instance, the national government has three
regulatory actions on other three actors, has one more of information
provider, and receives feedback regarding energy consumption savings.
From these, the one related to energy savings is the only action
categorised as part of the money flow. All of this implies that
government has a monitoring role that can be parameterised (with no
assignment done to a specific agent called "government") and fed back
according to energy savings. Likewise, it is possible to see that the
municipality has three actions: approving permits for initial home
specifications, considering energy consumption reduction an important
variable, but financially depending on land sales. In other words,
approving specifications and attending land sale requests are actions
in conflict, but they are both forces of municipality's behaviour.
- 3.11
- Knowledge institutions have an information dissemination
role (three actions), and thus we considered it convenient not to
include them as an agent in the model (in any case, such an information
can be parameterized, since it does not take any effect on knowledge
institutions' behaviour). A snapshot of the incidence matrix is
presented in Table 3.
Table 3. A sample snapshot of the 22 × 22 incidence matrix (9 actors plus 12 factors of interaction). Actor are specified in black, factors of interaction in blue, knowledge flow actions in black, and money flow actions in red. 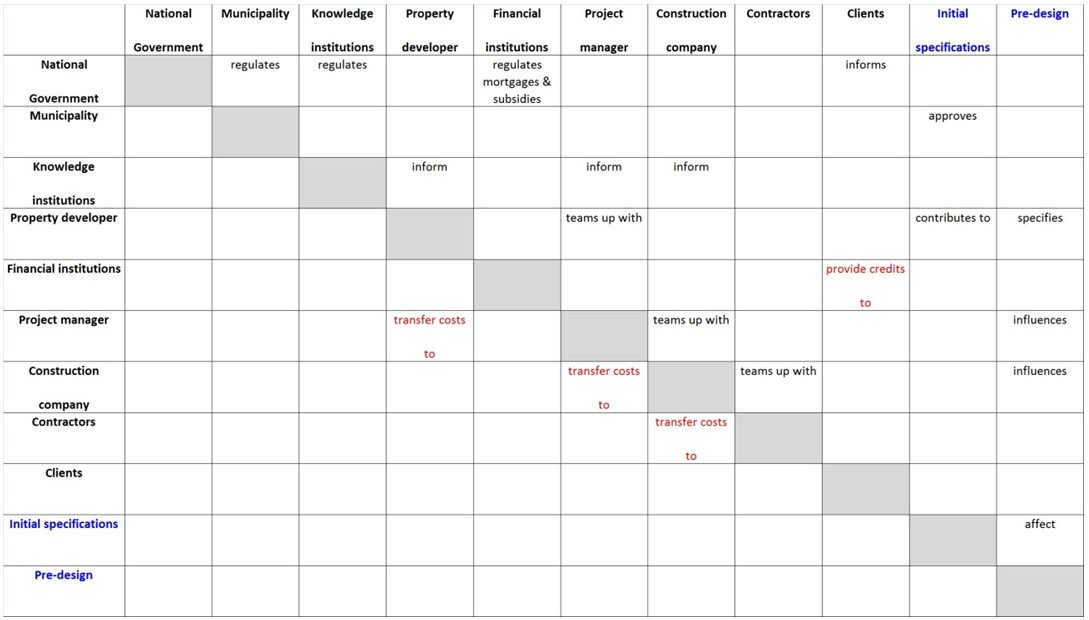
- 3.12
- After analyzing the incidence matrix, we came up with a set
of actor groupings and a categorisation of their representative
actions. The following table (Table 4)
summarises activities categorised as part of either the knowledge or
the money flow dynamics that were used as input for the AB model.
Table 4: Knowledge and money flow components by actor type Actor / set of actors Knowledge flow component Money flow component Municipality / government Energy consumption data Land sales Property developer / project manager nZEB construction technologies from knowledge institutions Construction costs Construction company / contractors Additional worker training in nZEB's construction Construction costs Clients Comfort as a relevant decision factor, comfort sensitivities, buying decisions made through joint considerations of prices and comfort Price sensitivities; home prices
A First
Framework for a Qualitative Simulation
- 4.1
- Using Table 4 as
a basis, we proceeded to specify a framework for ABM. The succinct
summary presented in Table 4
was used to select main actors / drivers of the construction process
dynamics that the computational model should include. Importantly, the
model was also built to reflect the implications of the conceptual map
(the systemigram). Additionally, it was aimed to serve as a tool in the
shaping of viable courses of action that might enlighten potential
strategies for the diffusion of sustainable construction. Next, we
present such a framework and explain the main components of the
simulation model.
- 4.2
- There two important elements of scope in the following
modelling framework:
- (i) As mentioned earlier, we constrained the framework to the "organizational physics" side of the problem (Levitt 2012). That is, we focused on the interaction and informational elements of the sustainable construction dynamics, not on the institutional elements.
- (ii) The qualitative data serves as input to build a qualitative simulation (Valente 2005). The simulation is intended to serve as a tool for inspecting the implications of what interviewees perceive. In no way we are attempting to confront model's results against past data, since this model aims to support the design of future strategies for the construction sector (which need to be complemented with other qualitative tools). Our work does not look for explanation. Instead, it attempts to provide a set of plausible scenarios for further intervention.
Environment
- 4.3
- We assume a grid-like city endowed with n
× n cells, each of which can sustain either an nZE
or a normal home. We have set n = 25. Each cell can
have one of six potential states: (i) unused land, (ii) spotted /
occupied land by a project developer, (iii) land under sale permission
request, (iv) land under a construction permission request, (v) land
hosting a built nZE home (either sold or on sale),
or (vi) land hosting a normal home (sold or on sale).
Modelling municipality's attention
- 4.4
- As said, from the incidence matrix it is possible to see
that there are three actions that dominate municipality's attention:
(i) the money-flow related dependence of land sales ("Municipality
– depends on – Land sales"), (ii) the knowledge-flow related
actions of approving nZEB specifications ("Municipality
– approves – Initial specifications"), and (iii) becoming
interested in energy-reduction capabilities ("Municipality –
is interested in – Energy saving capabilities"). To represent
the conflict between the dependency on land sales and the interest in
energy use reduction, we model the municipality as an agent whose
incentives are embodied in a utility function represented by Um(.).
It is composed of two pieces, one related to land sales and another one
related to energy consumption reduction. Formally speaking, we conceive
a single agent call "municipality" (i.e., there is only one
municipality per simulation run). Generally speaking, the
municipality's utility function may be defined according to the
following equation:
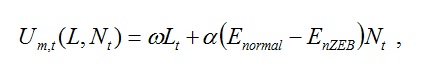
(1) where ? corresponds to a fraction of income due to sale of land (L) occurred at time t (if any); coefficient a is a scale factor that corresponds to the energy saving fraction (per nZEB home) that (positively) affects the municipality's utility function; coefficients Enormal and EnZEB are the average energy consumption and the near-zero energy building consumption per time step, per construction, respectively; Nt is the cumulative number of sold nZEB's at time t.
- 4.5
- We assume that Enormal
= EnZEB, and that the
benefit from a land sale is much larger than the maximum gain
from an nZEB energy consumption reduction. That is,
aEnormal = ?L.
This statement comes from assuming that, although at
the national level government is interested in reducing country-level
energy expenditures, local government sees only a marginal benefit from
it and strongly depends on land sales. For our model, we have set ?
= 0.3, a = 0.1, Enormal =
10, EnZEB = 5, and L
= 50.
- 4.6
- At every time step t, the municipality
has to allocate time between attending an approval for land
sale, and studying a construction permit request (which
might lead to the construction of an nZEB). This is
done by assigning a service probability according to some tracking
scores (these scores work in a similar fashion to a Q-learning
algorithm). At every time step t, the municipality
keeps track on two scores, Qti
for each option i = {house, land} and updates them
according to the observed revenue at time t-1. For
instance, the land-related indicator shows:
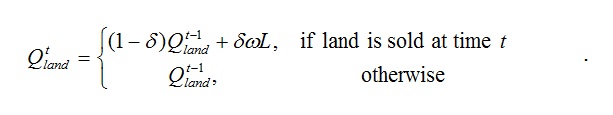
(2) Coefficient d represents an adoption rate (d is set to 0.75 in the baseline model) that quantifies how valuable is the most recent information regarding the cumulative one. Then, the probability of giving priority to a land sale request is represented by:
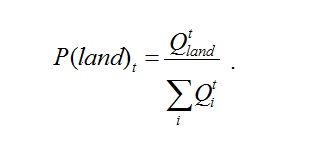
(3) - 4.7
- Likewise, attention over house construction requests is
controlled with an indicator that increases according to the number of
constructions that become nZEB's and are eventually
sold to clients. This score is computed as follows:
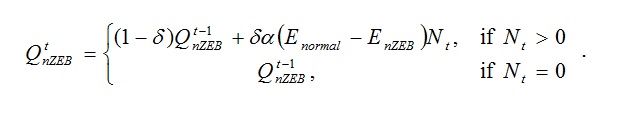
(4) P(nZEB)t is computed as 1-P(land)t. Just like land sale requests, the maximum number of total home construction requests is n × n, the size of the lattice. The initial value of both Q-related scores is 1 at time t = 0.
Behaviour of Property Developers, Project Managers and Contractors
- 4.8
- From the systemic diagram, we observed that property
developers, project managers and construction companies jointly decide
on nZEB pre-designs, which ultimately influence the
final nZEB design. In addition, construction
companies and contractors transfer their operational costs to project
managers and ultimately to developers. Although design decisions are
predominantly informational (according to both the systemic diagram and
the incidence matrix), the money flow dynamics reflects a cost transfer
chain from contractors up to project developers. Therefore, for
practical purposes, we make the simplifying assumption of merging these
three actors in the same agent, which we label with the generic term of
"developer". Upon approval for construction granted by the municipality
agent, the developer has to decide whether to build an nZEB
or a normal home. The decision on building an nZEB
is linked to different cost options. Therefore, we assume two different
cost variables, CnZEB and Cnormal,
to represent cost figures of nZEB and normal homes,
respectively. Also, we assume that CnZEB
= Cnormal. The utility
function of this agent is defined as Udeveloper
= Phouse - transCost
- L, where Phouse
= {PnZEB, Pnormal}
is defined as the home price paid by a client (PnZEB
= Pnormal), and transCost
is the cost incurred in home manufacturing (CnZEB,
Cnormal). We set Cnormal
= 50 and CnZEB = 100.
Decisions on building either type are linked to demand expectations
(that is, after checking consumer's propensity to buy at time t.
See next section). We define Pnormal =
(Cnormal + L)
* (1 + markup), where markup is
a coefficient ranging from 0 to 1 (we assume markup =
1), and the starting value of PnZEB as
a multiple of Pnormal
(several values are also explored. See next section).
- 4.9
- In addition, and according to the interviews, nZEB
construction companies take more construction time
due to the additional training workers need to get in order to build nZEB's
(tnZEB = tnormal).
We initially set such construction times as tnZEB
= 10 time steps and tnormal
= 5 time steps. This is consistent with the previous assumption of
having construction costs higher for nZEB's than
for normal constructions. Construction times are initially expected to
have an impact on municipality's assessment of requests, since Q
scores for the municipality are partially updated according to the
total number of sold nZEB's. That is, construction
lags are expected to generate delays in nZEB sales
(however, we will see further below this is not true). Also, in our
examples next, we assume the existence of 10 developer agents.
Clients
- 4.10
- A client (or a group of them) might be of three types:
house corporations, developers and private ones. Our modelling approach
here markedly considers private clients. Clients are not explicitly
modelled as agents. Instead, we indirectly use a proclivity indicator
to buy a house, which allows developers to assess expected and realized
profits (so that they can decide which house type to build). Clients
evaluate buying a home partly according to Comfort,
and not to energy savings—according to the interviews—, through their
utility function Uclient(.).
Also, we assume that clients' preferences (i.e., comfort) are
uncorrelated with construction types. That is, for a specific client, a
normal house might be more (or less) appealing than an nZE
home, as to idiosyncratic reasons. Also, a buying decision is
restricted to budgetary constraints. Such budgetary constraints are
not explicitly represented in client's equations, but we rather assume
that a price increase lowers the chances of acquiring an nZE
home (recall that PnZEB = Pnormal).
There might be many ways to represent client's behaviour, but a very
general, standard form is a Cobb-Douglas representation (Adner &
Levinthal 2001), where the client confronts both comfort and
price in order to make a decision. Additionally, sensitivities to price
and comfort can be easily included. Therefore, we consider
price-related and comfort-related elasticities (?
and 1-?, respectively; 0 < ?
< 1). We then assume that the proclivity a consumer
has for buying a house, H, depends on its price (Price)
and its perceived quality (or Comfort). Then we
define:
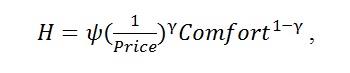
(5) where ? (? > 0) corresponds to a scale factor. Comfort levels are integer numbers on a scale from 1 to 10. ("1" indicates zero comfort, while "10" stands for maximum comfort). Coefficient ? is calibrated to obtain 0 = H = 1, so that H is, in fact, a probability:
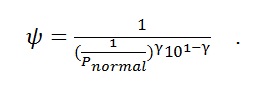
(6) Thus, Equation 5 illustrates that, for a given value of ?, the proclivity to sell (or buy) a home decreases with increases in prices, and goes up with increases in comfort levels. While we assume that normal houses have a stable (i.e. constant) price, we also assume that a higher number of available nZEB's for sale, N't, corresponds to a decreased price value:
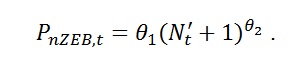
(7) Coefficients ?1 and ?2 are the price scale factor and the (approximate) inverse of the price elasticity of demand, respectively (?1 > 0, ?2 < 0). The value of ?1 is set taking into account that PnZEB = Pnormal even when Nt = 0 (we use ?1 = 2Pnormal as a baseline value, but change it to explore alternative scenarios). Coefficient ?2 allows several values but we set it to -0.1 in order to keep PnZEB = Pnormal across different simulations.
- 4.11
- To avoid asymptotic decrements in probabilities when the
price dramatically increases, we assume that the probability to buy a
home, H, only makes sense when a consumer's
participation constraint, Uo,
is fulfilled (Adner &
Levinthal 2001). Uo
indicates the minimum accepted utility to consider buying a house.
Below such minimum utility value, the probability to buy (or sell) a
home is zero. Such minimum utility value is set assuming that the least
interesting case for a consumer would be a house with joint
maximum
tolerable price and minimum possible comfort. Being congruent with the
previous definition of ?1 =
2Pnormal, such value is:
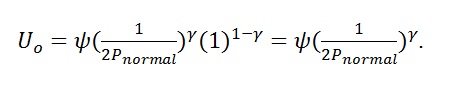
(8) For each house construction possibility (i.e., each "patch" in the grid-like city) there is a potential consumer. Therefore, for each patch, two comfort levels are generated from a uniform distribution, one related to a normal home, the other one related to an nZE home. With such values, developers assess profits expectations and, according to which one is higher, decide to build either a normal or an nZE home.
Consideration of Other Actors
- 4.12
- Of course, any modelling decision has to trade off richness of representation against parsimoniousity. Examination of the systemic diagram and the incidence matrix allowed us to come to some choices regarding model boundaries. For instance, given the fact that financial institutions' decisions can take effect through influence on minimum participation constraints, and that knowledge institutions' actions can indirectly be represented through changes in construction times and construction costs of nZEB's, we decided to leave out explicit representations of them in the present model. Likewise, national government, which may affect municipality's attention toward land sales, is indirectly represented through the Q-related scores that define the municipality's course of action. Yet, with these modelling simplifications, an interesting process dynamics is captured. Obviously, all the above-mentioned actors and more elaborated decisions-making processes can be incorporated in later exercises, but at this stage we opt for the Occam's razor principle.
Model
dynamics and main results
- 5.1
- Taking into account the definitions of Qland,
QnZEB, N',
N, Pnormal,
and PnZEB, the model
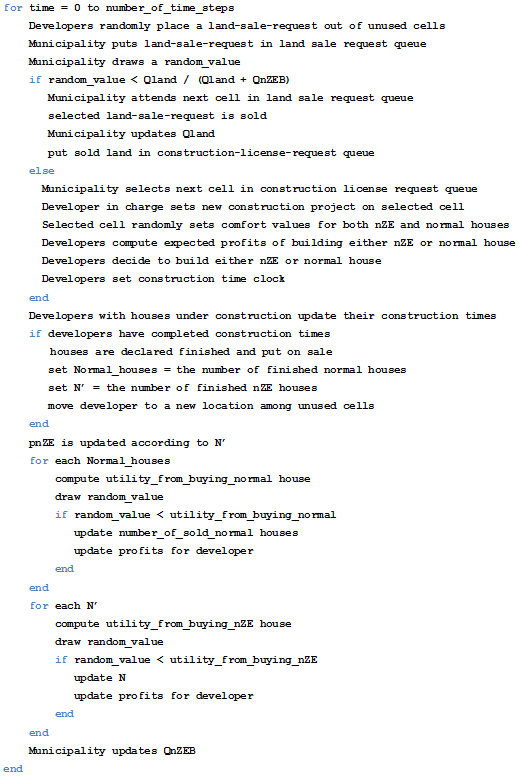
dynamics is better described through the pseudocode in Appendix B. As
mentioned above, Q-related scores (which determine
municipality's attention probabilities) are initialized to one, so the
first probability calculations on municipality's attention
probabilities are set to 0.5. The model shows the interplay among land
sales, construction permit requests, house construction and sales to
clients, and reveals how the space is populated with the two house
types. We let the model run for 5000 time steps in all scenarios and
inspect diffusion numbers, which are the proportions of sold normal
homes and nZEB's with respect to total construction
capacity. We also inspected nZEB price behaviour
and municipality's attention probabilities.
- 5.2
- At t
= 0, we assumed all space corresponds to unused land.
Noteworthy to say is that a different starting configuration could be
thought of. A starting partial occupation of space implies that the
number of starting unused cells is lower (with respect to the case
where all space is set as unused land). That could be the case when, at
t = 0, there is a starting non-zero number of
built (normal) homes. Such a modified starting setting would affect the
total capacity for house construction, but would not impact the
dynamics of Q-related scores. Moreover, that
situation would just reveal lower nZE home
diffusion numbers in the long run (consistent with having less
construction capacity) without affecting the overall qualitative
behaviour of the model. Therefore, we kept our assumption of a full
unused space at t = 0. A diagram illustrating the
conceptual model and the snapshots of the model's interface are shown
in Figure 3 and Figure 4, respectively.
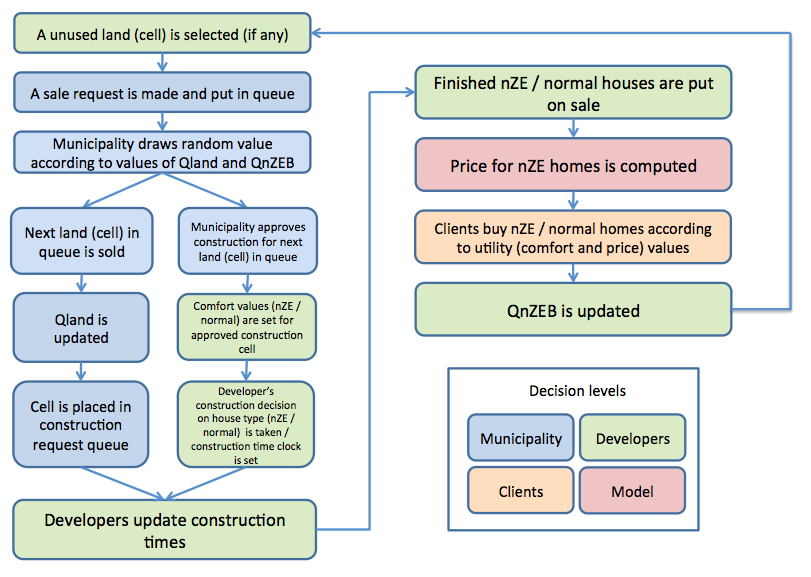
Figure 3. Conceptual model flow 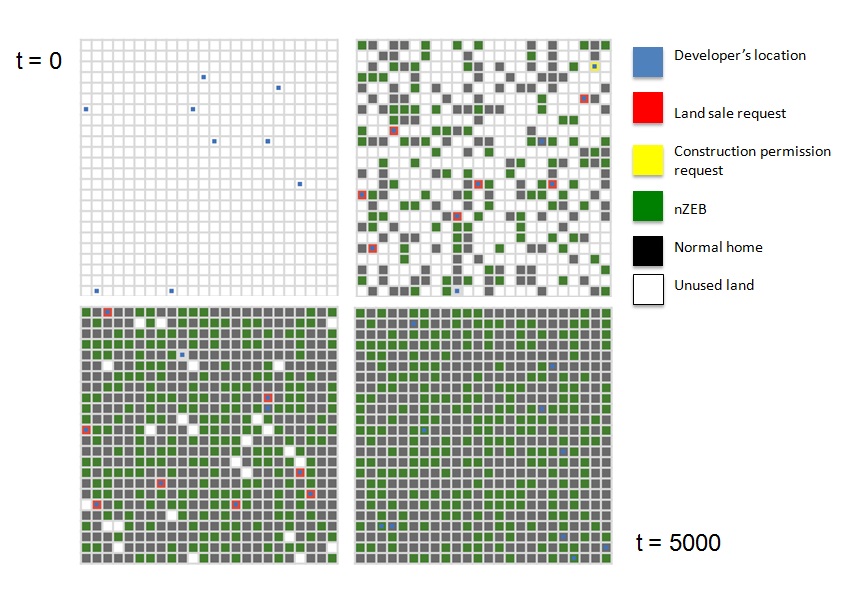
Figure 4. Snapshots of model's behaviour over time - 5.3
- We built nine different scenarios (100 runs each) using
different values for ?1,
whose increase makes larger the initial difference between PnZEB
and Pnormal (those values
are 1.2Pnormal, 2Pnormal,
and 5Pnormal). Jointly, we
also
varied the strength of price sensitivity with respect to comfort
sensitivity (i.e., ? took values of 0.1, 0.5, and
0.9). A first case we analyzed was the effect of the relative
difference between price and comfort sensitivities (that is, variations
of ?) for an initial PnZEB
slightly higher than Pnormal
(i.e., ?1 = 1.2Pnormal).
Results reveal that, for the case where price sensitivity is lower than
comfort sensitivity (? = 0.1), low diffusion numbers
(less than 20% of total construction capacity for each house type) are
observed (Figure 5). Also,
municipality's attention switched from land sales to construction
requests over time (Figure 6).
A main explanation for the latter result is the depletion of land,
which forces the municipality to switch its attention towards (nZE)
home construction requests. However, this behaviour is not enough to
boost
the relatively low nZEB construction figures over
the simulation horizon (Figure 5).
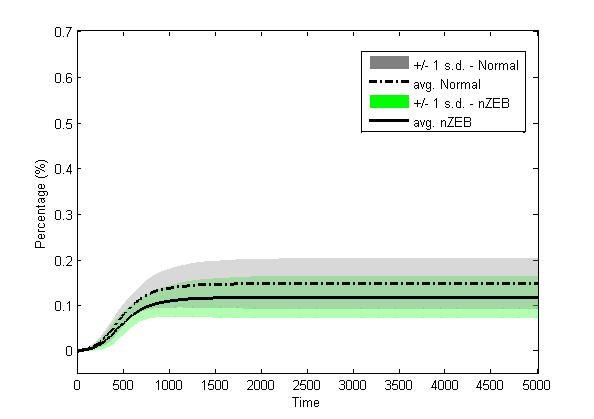
Figure 5. Average diffusion (number of sold homes over total construction space) when price sensitivity is lower than comfort sensitivity (?1 = 1.2Pnormal, ? = 0.1). Shadowed regions indicate a one standard deviation variation over all runs. 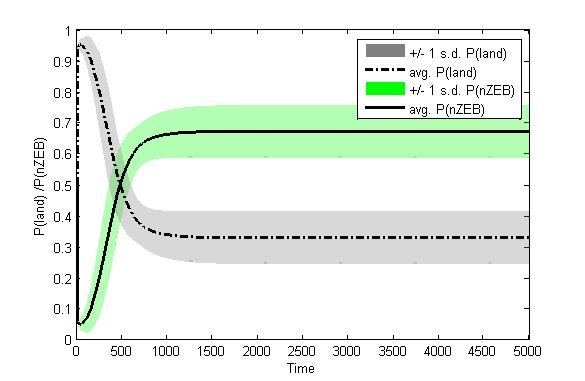
Figure 6. Average municipality's probabilities of attention when price sensitivity is lower than comfort sensitivity (?1 = 1.2Pnormal, ? = 0.1). Shadowed regions indicate a one standard deviation variation over all runs. - 5.4
- An increase in price sensitivity (from (?
= 0.1 to ? =
0.5) while maintaining ?1 =
1.2Pnormal makes clear a
dominant diffusion in favour of normal houses (Figure 7). Municipality's attention switch
of focus from land sales to construction permission requests
is even sharper with ? =
0.5, favouring nZEB construction (Figure 8). This eventually leads to a higher
diffusion of nZEB's with respect to the case of ?
= 0.1, but a much lower figure than the number of
normal homes (compare Figure 7
with Figure 5). Likewise, we
inspected cases (not reported here) where consumers are much more
sensitive to price than to comfort variations (?
= 0.9), which resulted in a full diffusion of normal
homes with no incentives for nZEB construction from
developers.
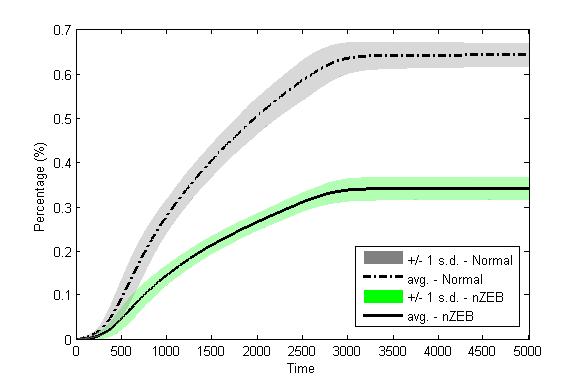
Figure 7. Average diffusion (number of sold homes over total construction space) when price sensitivity and comfort sensitivity have equal strength (?1 = 1.2Pnormal, ? = 0.5). Shadowed regions indicate a one standard deviation variation over all runs. 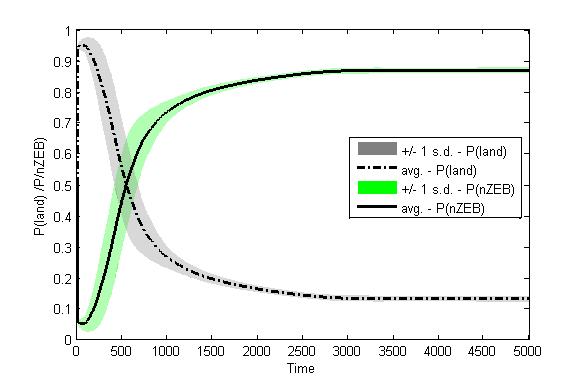
Figure 8. Average municipality's probabilities of attention when price sensitivity and comfort sensitivity have equal strength (?1 = 1.2Pnormal, ? = 0.5). Shadowed regions indicate a one standard deviation variation over all runs. - 5.5
- Similar inspections were carried out in a second set of
scenarios, where we assumed a larger initial difference between nZEB
and normal home prices (i.e., ?1 =
2Pnormal). The evolution of
both nZEB price and the probabilities of attending
requests, P(land) and P(nZEB),
remain almost invariant with respect to the first set of cases
presented (cases where ?1 =
1.2Pnormal). However, the
number of sold nZE constructions dramatically
increases in comparison with that first set of cases. This would imply
that (i) a client's weaker focus on price, (ii) a marked attention on
comfort, and (iii) higher incentives for developers to build nZEB's,
as a result of larger price differences between nZE
and normal homes, might help boosting up the number of nZE
constructions (see Figure 9).
Nonetheless, this positive effect on nZEB diffusion
tends to get undermined as clients become more sensitive to prices
(i.e., when the value of ? increases).
- 5.6
- An extreme price difference between nZEB's
and normal houses occurs when ?1 =
5Pnormal. Developers are
stimulated to build nZEB's due to the larger price
difference between nZEB's and normal homes (Figure 10). However, success on sales
depend on fulfilment of utility participation constrains, which depend
on the relative sensitivity between comfort and price. A very high nZEB
diffusion occurs when clients are more comfort- than price-conscious
(see PnZEB behaviour over
time in Figure 11).
Nonetheless, an extremely price sensitive client (i.e., ?
= 0.9)
will never buy an nZE home, and nZEB
diffusion might never occur (see Figure 12).
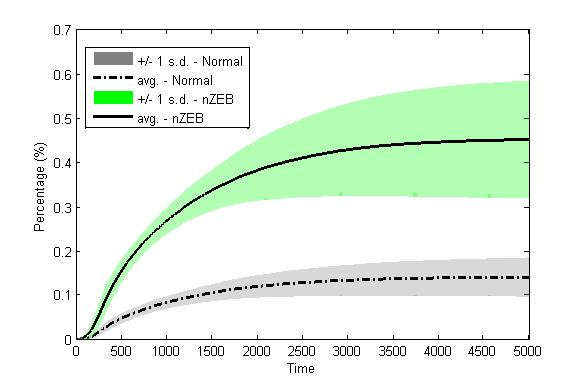
Figure 9. Average diffusion (number of sold homes over total construction space) when price sensitivity is lower than comfort sensitivity (?1 = 2Pnormal, ? = 0.1). Shadowed regions indicate a one standard deviation variation over all runs. 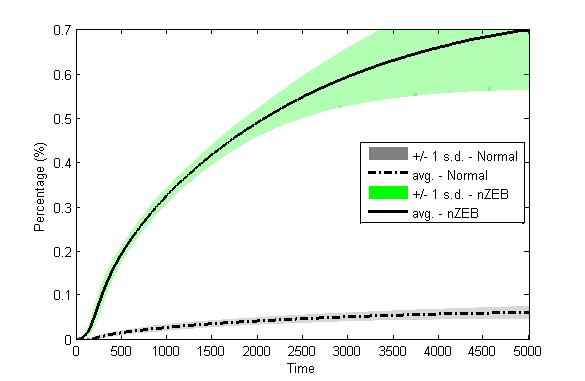
Figure 10. Average diffusion (number of sold homes over total construction space) when price sensitivity is lower than comfort sensitivity (?1 = 5Pnormal, ? = 0.1). Shadowed regions indicate a one standard deviation variation over all runs. 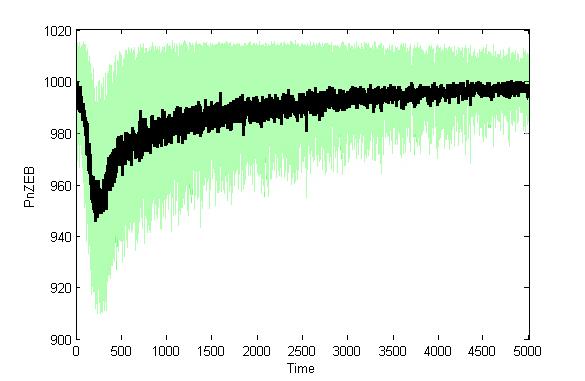
Figure 11. Average price behaviour when price sensitivity is lower than comfort sensitivity (?1 = 5Pnormal, ? = 0.1). Shadowed region indicates a one standard deviation variation over all runs. 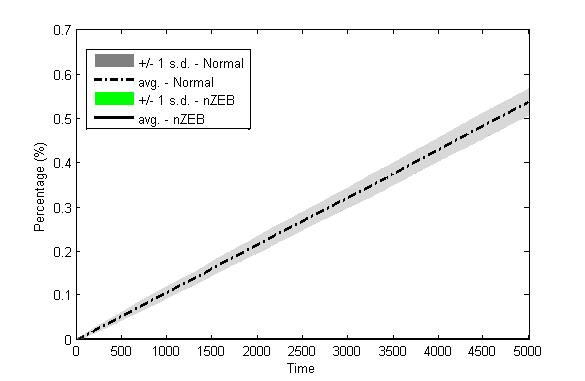
Figure 12. Average diffusion (number of sold homes over total construction space) when price sensitivity is higher than comfort sensitivity (?1 = 5Pnormal, ? = 0.9). Shadowed regions indicate a one standard deviation variation over all runs. - 5.7
- Knowledge assimilation of new construction techniques can
be an important factor in system's evolution. That is, improving
construction times might have a positive impact on increasing the
diffusion of nZE homes. We built an additional
analysis scenario by varying construction times and exploring outcomes
of the model. Interestingly, changes in nZE
construction times, which were regarded as a key factor in the nZE
house market by interviewees, did not reveal any significant impact on
diffusion behaviour. Figure 13
illustrates the model dynamics when tnZEB
= 10 * tnormal (a much
larger time difference than what Figure 6
revealed). It can be observed
that differences in construction times do not alter significantly
diffusion numbers. In other words, the price/comfort relative
sensitivity appear to have a much stronger impact than construction
time improvements.
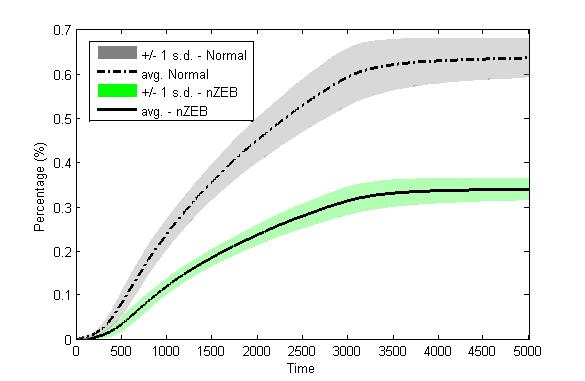
Figure 13. Average diffusion (number of sold homes over total construction space) when price sensitivity and comfort sensitivity have equal strength (?1 = 1.2Pnormal, ? = 0.5) and tnZEB = 10 * tnormal. Shadowed regions indicate a one standard deviation variation over all runs. Compare with Figure 7. - 5.8
- All the previously presented results bring up some additional important points: First, economic-driven incentives are important for developers to generate interest in building nZE homes. In our model, such incentives are purely driven by price differentials (although they might also relate to cost reductions in real life). However, the success of increased offer of houses has to go hand in hand with an increased focus on intervening clients' sensitiveness to factors other than prices. Higher incentives for construction (even if they imply significant cost reductions), coupled with extremely price sensitive clients will not produce the desired effect. Such price sensitiveness might lose dominance if, for instance, comfort perception is forced to correlate with potential energy savings (through, say, emphasising the importance of factors like environmental friendliness in the mind of consumers). In such a case, important diffusion figures could be reached. Additionally, a focus on optimizing building processes in terms of construction times has shown to have a very marginal impact.
Conclusions
- 6.1
- The European Union has put special emphasis on the
diffusion of nZEB's. By 2020, all new buildings
will have to demonstrate very high energy performance. European
countries are seeking to restructure their building environment and
stimulate energy efficiency investments. Policy measures have been also
introduced in order to achieve this goal. Building energy codes are
probably the most frequently used instrument designed to increase the
energy efficiency of buildings (El-Shagi
et al. 2014; Jacobsen
& Kotchen 2013). Other authors like Sesana and
Salvalai (2013) argue that
efforts should be also directed towards Life Cycle Methodologies (LCEA,
LCA, LCC and LC-ZEB) in order to improve the design of nZEB's.
Fragments of the literature on nZEB's have also
focused on identifying their social acceptance (cf. Brown & Vergragt 2008; Heiskanen et al. 2013).
Heiskanen et al. (2013)
mostly speak of acceptance barriers in nine countries (Austria,
Bulgaria, Czech Republic, Finland, France, Germany, Italy, Romania and
Spain). They argue previous analyses have illustrated that "differences
in barriers and drivers are in many cases greater among building owner
groups than among countries" (Heiskanen
et al. 2013: 3). Context specific factors of nZEB
adoption include geography, infrastructure, history and culture,
policy, markets and companies, experts and professional communities,
citizens and social movements, and media ((Heiskanen
et al. 2013: 5).
For a very detailed analysis, we remit the reader to their comparative
study.
- 6.2
- Other few studies (not necessarily related to EU countries)
have aimed at tackling the problem from a modelling perspective. For
instance, (Fonseca i Casas et al.
2014) modelled the energy performance at specific levels of
an nZEB. They calculated the energy demand of a
building through its life cycle using a simulation based on the
Specification and Description Language (SDL). An ABM approach is also
carried out by Azar and Menassa (2012)
to study energy consumption in commercial buildings.
- 6.3
- Nevertheless, to the best of our knowledge, attempting to
understand the construction sector combining innovation theory,
qualitative approaches and agent-based modelling offers an unexplored
avenue for research. We used an interdisciplinary approach to
understand some implications of the perspectives held by different
actors regarding the transition toward nZEB's,
which have become the basis for description and formulation of a
computational model. The systematic qualitative inquiry on involved
actors was found to be an effective tool to improve formal modelling,
since it provided a much better understanding of the knowledge and
money flows within the system under study. This exercise also indicates
that, given the nature of the problem under study, multiple
perspectives (where ABM might be one of them) are needed to tackle this
problem.
- 6.4
- Simulation modelling offers a relevant, yet partial view,
to building possible future states of the system. However, the
fundamental motivation for modelling arises from a lack of full access
to data related to the diffusion of nZEB's. One
very important limitation is that we have focused on modelling the
informational and money related dynamics of the problem
("organizational physics"), which is much easier than attempting to
model institutional and evolutionary features of it ("organizational
chemistry" and "organizational biology") (cf. Levitt
2012). Even in the explicit, yet complex,
informational view of the problem, results that challenge actors'
viewpoints are interesting because they force such actors to develop
new paradigms to intervene the system. The AB model reveals some
interesting drivers of building construction dynamics; yet,
institutional barriers still need to be included / complemented with
other qualitative points of view in future research.
- 6.5
- Regarding our modelling approach, it is important to recall
that we have disaggregated entities only to the point where having
informational/money flows distinctions is important to drive the
behaviour of the model. For instance, agents like developers,
constructors and project managers are involved in mutual cost
transfers, whose disaggregation do not offer additional insight from
such an organizational physics perspective. Nevertheless, inclusion of
institutional / interaction barriers would lead the model to a whole
different perspective ("organizational chemistry"). Such an inclusion
might also generate an increased level of complexity and (possibly)
need a new set of interviews. Important factors to consider beyond the
"organizational physics" lenses are (i) the degree of power (im)balance
among actors (which could lead to effectively consider developers,
constructors and project managers separately) (cf. Sibertin-Blanc et al. 2013;
Abdollahian et al. 2013),
and (ii) alternative diffusion processes, like those related to
cultural transitions of social practices on the demand side (cf. Holtz 2014).
- 6.6
- As any exercise that attempts intervention, not explanation
and generalization, our approach is country—and sector—specific. In
addition, it was not our intention to provide a richly detailed
computational model able to capture all the micro details revealed in
the interviews, but rather to use a complementary set of qualitative
tools (conceptual maps and incidence matrices) that helped to decide on
the most representative elements that might drive systems' behaviour.
Our aim was also to illustrate that (i) qualitative information is
relevant even in systems where a money (i.e., quantitative) flow is
explicit, and that (ii) even parsimonious modelling representations
might challenge beliefs that are commonly held among actors in the
system.
- 6.7
- We hope this kind of exercises prove to be fruitful for stakeholders. Our experience with this work is that even communicating the conceptual systemigram to stakeholders is a challenge. However, we also think that building models for design purposes can bring on new perspectives that could lead to change mental paradigms and to the consideration of policies never thought before.
Acknowledgements
- We are grateful to our interviewees in the Netherlands for their time and contribution. We also thank the different colleagues who have provided valuable comments to our work, and the participants at the 9th Conference of the European Association for social Simulation (ESSA) in Warsaw (September 16-20, 2013). We remain solely responsible for any errors and omissions in the findings and interpretations expressed in this paper.
Appendix
A. Interview guide
-
General Data
2 Name:
3 Contact Information: (e-mail, telephone, address)
4 Age:
5 Background (profession):
6 Organization:
7 Position (and years in this position):Introduction
Dear Sir / Madame, We would like to understand the factors involved around the diffusion of near-Zero Energy Buildings. We know that you are an active professional within the Dutch building sector. Therefore, we would like to learn from you so others can benefit from your knowledge and your experience. This interview is confidential and your name will only be known by the researchers to assure the validity of the study. The interview consists of 15 questions and it will take 1 hour approximately. Please, feel free to express any thought you may have. Before starting the interview, may I ask your permission to record the conversation? Furthermore, is there anything else you would like to know before starting the interview? Otherwise, we will proceed to begin..Questions
- What are your main professional activities?
- What is your knowledge regarding energy efficient households?
- How do you get the information regarding houses with an EPC=0?
- What do you think about the technologies / products for building a house with an EPC=0?
- How implementable are these technologies/products?
- How is the concept of EPC=0 promoted within the building system?
- How do the new EPC 0 techniques match within the current legislation?
- What changes in the system would benefit you in order to (design/build/develop new legislation for/buy) houses with an EPC=0?
- What factors do you take into account when you (design/build/develop legislation for/buy) a new house
- What are the main reasons to decide (or not) to (design/build/develop legislation for/buy) an energy-neutral home?
- Please, think about the projects you have been involved in the last year, what considerations have you made when (designing/building/developing legislation for/buying) your home?
- What changes would benefit the (design/building/developing legislation for/buying) houses with and EPC=0?
Closing
This was the last question. We appreciate your participation. Is it possible to contact you in case we need some clarification while transcribing the interview? Also, if you are interested, we can provide you with feedback regarding this research. Thank you for your collaboration!
Appendix
B. Model dynamics pseudocode
References
- ABDOLLAHIAN, M., Yang, Z.,
& Nelson, H. (2013). Techno-social energy infrastructure
siting: sustainable energy modelling programming (SEMPro). Journal
of Artificial Societies and Social Simulation, 17(1) 1: https://www.jasss.org/16/3/6.html.
ADNER, R., & Levinthal, D. (2001). Demand heterogeneity and technology evolution: Implications for product and process Innovation, Management Science, 47(5), 611–628. [doi:10.1287/mnsc.47.5.611.10482]
ASHEIM, B.T., & Coenen, L. (2005). Knowledge bases and regional innovation systems: Comparing Nordic clusters, Research Policy, 34(8), 1173–1190. [doi:10.1016/j.respol.2005.03.013]
AZAR, E., & Menassa, C. (2012). Agent-based modeling of occupants' impact on energy use in commercial buildings, Journal of Computing in Civil Engineering, 26(4), 506–518. [doi:10.1061/(ASCE)CP.1943-5487.0000158]
BHARWANI, S. (2004). Adaptive Knowledge Dynamics and Emergent Artificial Societies: Ethnographically Based Multi Agent Simulations of Behavioural Adaptation in Agro-climatic Systems, Ph.D. thesis, University of Kent, 369 pp.
BAUER M. & Gaskell, G. (2000). Qualitative Research with Text, Image and Sound. London, UK, SAGE Publications.
BLAIR, C. D., Boardman J. T., & Sauser, B. J. (2007). Communicating intent with systemigrams: Application to the network-enabled change. Systems Engineering 10(4): 309–322. [doi:10.1002/sys.20079]
BOARDMAN, J. & Sauser, B. J. (2008). Systems Thinking: Coping with 21st Century Problems, Boca Raton, FL, CRC Press. [doi:10.1201/9781420054927]
BROWN, H.S. & Vergragt, P. J. (2008). Bounded socio-technical experiments as agents of systemic change: The case of a zero-energy residential building, Technological Forecasting and Social Change, 75(1), 107–130. [doi:10.1016/j.techfore.2006.05.014]
BRYMAN, A. (2008). Social Research Methods (3rd ed.), Oxford, Oxford University Press.
CHECKLAND, P. (1999). Systems Thinking, Systems Practice, Hoboken, NJ, Wiley.
COOKE, P., Uranga, M. G., & Etxebarria, G. (1997). Regional innovation systems: Institutional and organisational dimensions, Research Policy, 26(4–5), 475–491. [doi:10.1016/S0048-7333(97)00025-5]
CROOKS, A. T. (2012). The use of agent-based modeling for studying the social and physical environment of cities. In: Complexity and Planning: Systems, Assemblages and Simulations, (De Roo, G., Hiller, J., & Van Wezemael, J., eds.). Burlington, Ashgate Pub. Co., pp. 385–408.
DELRE, S. A., Jager, W., & Janssen, M. (2007). Diffusion dynamics in small-world networks with heterogeneous consumers, Computational and Mathematical Organization Theory, 13(2), 185–202. [doi:10.1007/s10588-006-9007-2]
EL-SHAGI, M., Michelsen, C., & Rosenschon, S. (2014). Regulation, Innovation and Technology Diffusion. Evidence from building energy efficiency standards in Germany. Discussion Papers 13, DIW Berlin. Berlin.
EUROPEAN COMMISSION. (2013). Europe 2020. Retrieved February 13, 2013, from European Commission: http://ec.europa.eu/europe2020/europe-2020-in-a-nutshell/targets/index_en.htm
EUROPEAN PARLIAMENT (2010). Directive 2010/31/EU of the European Parliament and of the Council of 19 May 2010 on the energy performance of building. Official Journal of the European Union. L 153/13–L 153/35.
FABER, A., & Hoppe, T. (2013). Co-constructing a sustainable built environment in the Netherlands—Dynamics and opportunities in an environmental sectoral innovation system, Energy Policy, 52, 628–638. [doi:10.1016/j.enpol.2012.10.022]
FLICK, U. (2006). An Introduction to Qualitative Research. London, UK, SAGE Publications.
FONSECA I CASAS, P., Fonseca i Casas, A., Garrido-Soriano, N., & Casanovas, J. (2014). Formal simulation model to optimize building sustainability, Advances in Engineering Software, 69, 62–74. [doi:10.1016/j.advengsoft.2013.12.009]
FREEMAN, C. (1987). Technology Policy and Economic Performance: Lessons from Japan, London, UK, Pinter.
HEISKANEN, E., Matschoss, K., & Kuusi, H. (2013). Report on specific features of public and social acceptance and perception of nearly zero-energy buildings and renewable heating and cooling in Europe with a specific focus on the target countries D2.6. of WP2 of the Entranze Project.
HEKKERT, M. P., Suurs, R. A. A., Negro, S. O., Kuhlmann, S., & Smits, R. E. H. M. (2007). Functions of innovation systems: an approach for analyzing technological change, Technological Forecasting and Social Change, 74(4), 413–432. [doi:10.1016/j.techfore.2006.03.002]
HOLTZ, G. (2014). Generating social practices. Journal of Artificial Societies and Social Simulation, 17(1) 1: https://www.jasss.org/17/1/17.html. [doi:10.18564/jasss.2333]
HOPPE, T. & Faber A. (2011). Waarom de energietransitie van de woningsector niet opschiet. Milieu Dossier,(4), 21–25.
JACOBSEN, G. D. & Kotchen, M. J. (2013). Are building codes effective at saving energy? Evidence from residential billing data in Florida, Review of Economics and Statistics 95(1), 34–49. [doi:10.1162/REST_a_00243]
JORNA, R. J. (2007). Knowledge dynamics: a framework to handle changes in type of knowledge. In: Advances in Knowledge Management Vol. 3., 15 Years of Knowledge Management (Schreinemakers, J. F., & Van Engers, T. M., eds.), Würzburg, Ergon Verlag, pp. 25–46.
KLEIN-WOOLTHUIS, R., Lankhuizen, M., & Gilsing, V. (2005). A system failure framework for innovation policy design, Technovation, 25(6), 609–619. [doi:10.1016/j.technovation.2003.11.002]
LEVITT, R. E. (2012). The virtual design team: designing project organizations as engineers design bridges, Journal of Organization Design 1(2), 14–41. [doi:10.7146/jod.6345]
LUNDVALL, B-Å. (1992). National Systems of Innovation. Towards a theory of Innovation and Interactive Learning, London, UK, Pinter Publishers.
MALERBA, F. (2002). Sectoral systems of innovation and production, Research policy, 31(2), 247–264. [doi:10.1016/S0048-7333(01)00139-1]
MENKVELD, M. & Beurskens, L. (2009). Duurzame Warmte en Koude in Nederland. Petten, ECN.
MILES, M., & Huberman, A. (1994). Qualitative Data Analysis: An Expanded Source-book, Thousand Oaks, CA, SAGE publications.
NELSON, R. (1993). National Innovation Systems. A Comparative Analisis. Oxford, UK, Oxford University Press.
NEWELL, A. (1990). Unified Theories of Cognition, Cambridge, MA, Harvard University Press.
O'SULLIVAN, D. (2004). Complexity science and human geography, Transactions of the Institute of British Geographers, 29(3), 282–295. [doi:10.1111/j.0020-2754.2004.00321.x]
ROMER, P. (1993). Idea gaps and object gaps in economic development, Journal of Monetary Economics, 32(3), 543–573. [doi:10.1016/0304-3932(93)90029-F]
ROSALES-CARREÓN, J. (2012). Mind and Soil. Knowledge Aspects of Sustainable Agriculture, PhD dissertation, University of Groningen, 221 pp.
SCHILPEROORD, M., Rotmans, J., & Bergman, N. (2008). Modeling societal transitions with agent transformation, Computational and Mathematical Organization Theory, 14(4), 283–301. [doi:10.1007/s10588-008-9036-0]
SCHOOT-UITERKAMP, A. J. M., & Vlek, C. (2007). Practice and outcomes of multidisciplinary research for environmental sustainability, Journal of Social Issues, 63(1), 175–198. [doi:10.1111/j.1540-4560.2007.00502.x]
SCHWARZ, N., & Ernst, A. (2009). Agent-based modelling of the diffusion of environmental innovations: An empirical approach, Technological Forecasting and Social Change, 76(4), 497–511. [doi:10.1016/j.techfore.2008.03.024]
SESANA, M. M., & Salvalai, G. (2013), Overview on life cycle methodologies and economic feasibility for nZEBs. Building and Environment, 67, 211–216. [doi:10.1016/j.buildenv.2013.05.022]
SIBERTIN-BLANC, C., Roggero, P., Adreit, F., Baldet, B., Chapron, P., El-Gemayel, J., Mailliard, M., & Sandri, S. (2013). SocLab: a framework for the modelling, simulation and analysis of power in social organizations. Journal of Artificial Societies and Social Simulation, 16(4) 8: https://www.jasss.org/16/4/8.html.
SQUAZZONI, F. (2008). A (computational) social science perspective on societal transitions, Computational and Mathematical Organization Theory, 14(4), 266–282. [doi:10.1007/s10588-008-9038-y]
TORRENS, P. M. (2001). Can geocomputation save urban simulation? Throw some agents into the mixture, simmer, and wait, Centre for Advanced Spatial Analysis (University College London) Working Paper, 32, London.
VALENTE M (2005). Qualitative simulation modeling. Working paper, Universitá dell'Aquila.
VERHAGEN, M. (2012). Nationaal Hervormingsprogramma 2012, 's-Gravenhage: Ministerie van Economische Zaken, Landbouw en Innovatie.
WOLCOTT, H. F. (1990). Writing Up Qualitative Research, London, UK, SAGE publications.