
 Abstract
- In social dilemmas punishment costs resources, not just from the one who is punished but often also from the punisher and society. Reciprocity on the other side is known to lead to cooperation without the costs of punishment. The questions at hand are whether punishment brings advantages besides its costs, and how its negative side-effects can be reduced to a minimum in an environment populated by agents adopting a form of reciprocity. Various punishment mechanisms have been studied in the economic literature such as unrestricted punishment, legitimate punishment, cooperative punishment, and the hired gun mechanism. In this study all these mechanisms are implemented in a simulation where agents can share resources and may decide to punish other agents when the other agents do not share. Through evolutionary learning agents adapt their sharing/punishing policy. When the availability of resources was restricted, punishment mechanisms in general performed better than no-punishment, although unrestricted punishment was performing worse. When resource availability was high, performance was better in no-punishment conditions with indirect reciprocity. Unrestricted punishment was always the worst performing mechanism. Summarized, this paper shows that, in certain environments, some punishment mechanisms can improve the efficiency of cooperation even if the cooperating system is already based on indirect reciprocity.
- Keywords:
- Public Goods Games, Punishment, Cooperation, Reciprocity, Evolution of Cooperation
Introduction
- 1.1
- From an evolutionary point of view cooperation is a double-edged sword. On the one hand, it can bring an evolutionary advantage to a group, since some tasks can only be achieved through cooperation or at least in a more efficient way through the contribution of the group. On the other hand, from an individual's perspective the most efficient choice seems to be enjoying the fruits of cooperation, without investing in it. This is the typical free-rider problem that characterizes social dilemmas. Since selection in evolution takes place on the level of the individual, cooperators should be replaced by free-riders, putting cooperation to an end. So why is there cooperation?
- 1.2
- It is trivial to see that the classic mechanism of evolution does not directly select for generosity. However, indirect mechanisms have been proposed to show how cooperating leads not just to an advantage to the individual but also for the group. Henrich (2004) catches this in a formula in which the chance for altruistic behavior positively correlates with the chance of others being cooperative. Nowak (2006) lists five rules under which cooperation can evolve. Each of these rules itself is sufficient to lead to cooperation in an evolutionary system. Only humans seem to have used all five during evolution. The one we will focus on in our paper is 'indirect reciprocity' (IR). IR – more specifically 'downstream reciprocity' (Nowak & Roch 2007) – implies that by cooperating an individual increases the chance that someone else will cooperate with him. Nowak and Sigmund (1998) provide evidence that IR will lead to cooperation if the chance of knowing how often someone has shared before is bigger than the ratio of 'costs of sharing'/'benefit of sharing'.
- 1.3
- The problem of the emergence of cooperation in social dilemmas has been widely studied by social psychologists (Dawes & Messick 2000; Messick & Brewer 1983), game theorists (Rapoport & Chammah 1965; Axelrod 1984; Fudenberg & Levine 1994; Kandori 2002), and political scientists (Ostrom 1990). Experimental economists have studied the emergence of cooperation with special reference to the problem of market failures in the provision of public goods (Ledyard 1995; Chaudhuri 2011). In recent years behavioral economists have explained cooperation in social dilemmas using the concepts of peer costly punishment (Fehr & Gächter 2000; 2002). Fehr and Gächter studied a Public Goods Game where cooperation leads to a high payoff for all if everyone cooperates, but the single player earns the maximum payoff when all the others cooperate and he/she free-rides. Free-riding is hence the unique Nash equilibrium of the game. They compare a treatment without punishment opportunities with a treatment in which subjects can punish their peers. Punishment was costly for the target because it reduced her payoff in proportion of the punishment points received, but it was costly also for the punisher, who had to pay a certain amount of money for each punishment point assigned. In this type of experiments one typically observes a significant and stable growth of the level of cooperation as a consequence of the introduction of punishment.
- 1.4
- According to some authors the willingness to punish non-cooperators, known as altruistic punishment (Fehr & Gächter 2000; Fehr et al. 2002; Carpenter et al. 2009) is widespread, has a key role in promoting collective action and is a fitness enhancing device in human evolution (Boyd et al. 2003; Henrich et al. 2006; Gintis et al. 2008; Gintis & Bowles 2011; Mathew & Boyd 2011).
- 1.5
- Other authors are skeptical about the contribution of this mechanism to the emergence of cooperation. Some stress the fact that altruistic punishment, implying a cost for the punisher, presents a second-order social dilemma problem, and show that this problem can be solved only under very specific conditions, like the case in which the participation to the joint enterprise is voluntary and not compulsory as in the typical public goods production scenario (Hauert et al. 2007, 2008). Ye et al. (2011) found that if a group has the possibility to show appreciation for altruistic behavior, this is sufficient for altruistic behavior to emerge and the group will learn to cooperate. In addition, when implemented in a model of indirect reciprocity, costly punishment seems to lead to an efficient equilibrium only in a small parameter region (Ohtsuki et al. 2009).
- 1.6
- Our main hypothesis is that punishment is more than just a stopgap to achieve cooperation, and that it can play a facilitating role for the emergence of cooperation in certain contexts, even when it is not explicitly needed to keep cooperation going. To test this hypothesis we implement an agent-based simulation in which we compare agent systems that can punish and use IR, with agent systems that only use IR. In addition we compare the performance of different punishment mechanisms under a (small) variety of environmental conditions, specifically the availability of resources (the importance of which has been suggested many times (Dyken & Wade 2012; Brockhurst et al. 2008; Farjam et al. 2012)).
- 1.7
- The study of alternative punishment mechanisms and their interaction with reciprocity through simulation is not new. Among the most recent contributions, Jaffe and Zaballa (2010) compare a specific punishment mechanism (cooperative punishment, see below) with the punishment mechanism used by Fehr and Gächter and find that their mechanism works better. However, it is not clear whether the increase in performance remains stable under different parameter settings. What is new in our study is that, to the best of our knowledge, it is the first comparing many punishment mechanisms in one simulation.
- 1.8
- Humans seem to have a feeling for when punishment is necessary. Obviously it is important to not punish too often, as punishment comes with a cost and accepting a little bit of free-riding may be acceptable, but if one does not punish enough free-riding becomes dominant. In our simulation agents will have their tendency to free-ride (not cooperate) and their tendency to punish encoded in their genes. As in other Public Goods Games agents try to maximize their own earnings. Through mutation and selection agents learn when free-riding is acceptable and when punishment is necessary for the public good.
- 1.9
- The remaining part of the paper is organized as follows: in section 2 we present four different punishment mechanisms: Unrestricted punishment, legitimate punishment, cooperative punishment, and the hired gun mechanism. In section 3 we describe the implementation of the simulation and all punishment mechanisms. The results are presented in section 4. In section 5 we present our conclusions, particularly the suggestion that punishment can be a facilitator for effective cooperation, by bringing about additional coordinative advantages.
Punishment
mechanisms
- 2.1
- Fehr and Gächter (2000, 2002) studied a form of peer punishment that can be defined as Unrestricted Punishment (UP). In their setting everyone can punish everyone else. This means that it is also possible for free-riders to punish cooperators. This phenomenon is called antisocial punishment and it is undesirable when punishment is meant to be a means to enforce cooperation, because it decreases the fitness of cooperators (Herrmann et al. 2010; Rand & Nowak 2011).
- 2.2
- Faillo, Grieco and Zarri (2013) propose a different punishment mechanism that they call Legitimate Punishment (LP). In LP an agent can only punish another agent if they contribute more than the agent they want to punish. This mechanism prevents antisocial punishment. Faillo et al. found that LP compared to UP saves resources to the group ensuring higher levels of cooperation among human players of a Public Goods Game.
- 2.3
- The Hired Gun Mechanism (HGM), as proposed by Andreoni and Gee (2012), restricts the possibility to punish to prevent antisocial punishment. In contrast to LP in HGM punishment is not carried out by peers, but by an external agent - the 'hired gun'- who is in charge of punishing low contributors. In particular in Andreoni and Gee the hired gun always punished the agent that has contributed the least. Hence agents have an incentive to provide at least the second lowest level of contribution.
- 2.4
- The final mechanism that we consider is based on an agent based simulation from Jaffe and Zaballa (2010), called Co-operative Punishment (CP). In CP no restrictions are made on who may punish who, instead the costs of punishing are not paid by the individual that punishes but by the entire group. Punishment becomes thereby a less altruistic action. Jaffe and Zaballa found that CP was a much stronger stabilizer of cooperation than altruistic punishment. We go one step further than CP in our simulation. In UP, LP, and HGM punishment implies a cost both for the punisher and for the punished. The resources subtracted to the punished thus vanish. In many social situations this is not true. If we get a traffic ticket, we pay this amount to the government. We do not burn the money. Nevertheless punishment is still costly, as the society has to pay the police officer. In the punishment mechanism that we call 'Zero Loss Punishment' (ZLP), the costs for punishment are, as in CP, shared by all agents, but the cost for the punished will be reallocated to all agents. From an agent's point of view punishment will cost the 'cost to punish'/'number of agents' but will pay back 'loss of punished'/'number of agents'. This means that punishment will lead to a small increase of resources for the punishing agent if the costs to punish are less than the payoff the punished loses (as it is in our simulation and in almost all Public Goods Games). This implies that punishment in this context is different from "altruistic" and completely disinterested punishment activity observed in UP and LP. Although in ZLP punishment is not costly from an agent's point of view, it is costly from a global point of view, as the cost to punish still vanishes. Note that antisocial punishment is only possible for punishment mechanisms UP and ZLP, where every agent is free to punish any other agent.
- 2.5
- In figure 1 the four punishment mechanisms are classified according to two criteria: the presence of restrictions on punishment activity (restricted or unrestricted) and the presence of a net cost attached to the punishment activity (altruistic or not altruistic).
- 2.6
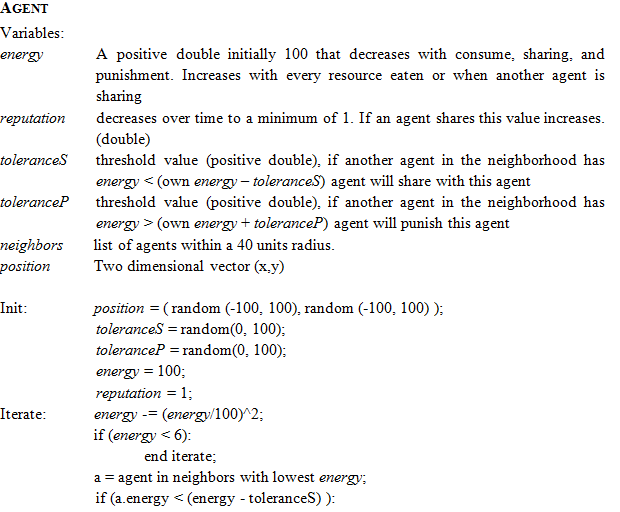
- In our simulation we assume that cooperation is also
costly. Agents must invest an extra amount x to cooperate/share y
resources. This assumption of the model is based on the transaction
cost theory by Williamson (1981)
and captures the fact that moving resources from one actor to the other
consumes resources (the 'transaction costs'). If the transaction costs
needed to cooperate with another agent are higher than the social
synergy achieved, agents should not cooperate.
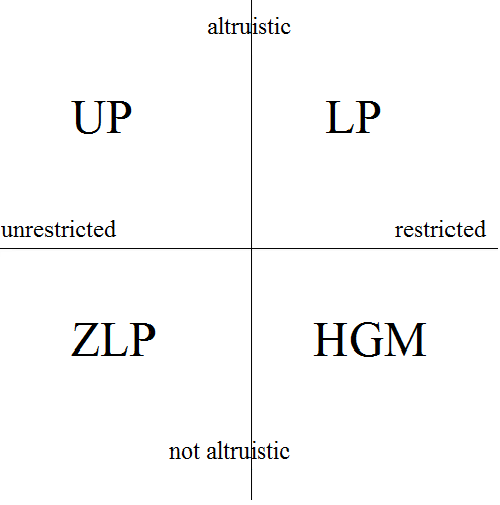
Figure 1. Classification of punishment mechanisms used in the simulation
The model
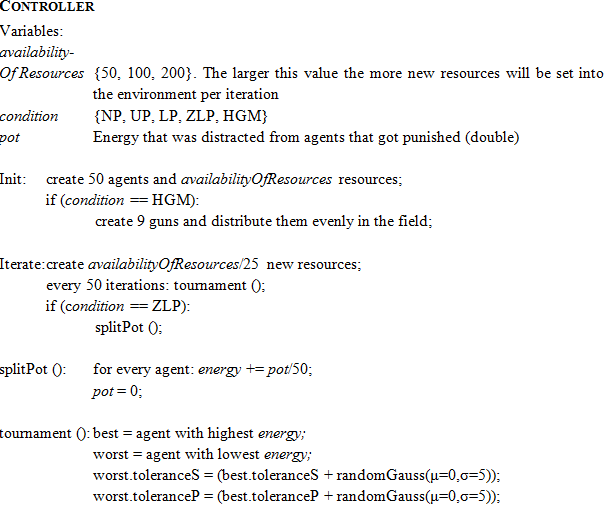
- 3.1
- The simulation was programmed with the open source software
Breve 3D (Klein 2002),
using the programming language Steve. No special libraries have been
used for implementation. In Appendix B we show details of the
implementation. The following sections will describe the simulation on
a conceptual level. The full code can be found on https://www.openabm.org/model/3848/version/2/view.
Table 1 provides an overview
of crucial parameters determining the environment in which agents
interact. Table 2 does the
same for variables that differ per agent. Figure 2
shows the sequence of steps that an agent executes during every
iteration.
Table 1: Parameters of the environment (fixed during one simulation) Name value Description NumberOfAgents 50 The number of agents. They have a fixed random position in the field. They will not die. Share 5 The amount that is given to a poorer agent in a sharing action. Punishment 5 The amount that is taken from the punished agent. CostOfSharing 1 Cost of a sharing action for the sharing agent. CostOfPunishment 1 Cost of a punishment action for the punishing agent. Conditions NP:
UP:
LP:
ZLP:
HGM:sharing, no punishment
unrestricted punishment
legitimate punishment
zero loss punishment
the hired gun mechanismAvailabilityOfResources 50 (low)
100 (mid)
200 (high)Number of resources. Each resource represents an energy value of 50. - 3.2
- At the initialization "availabilityOfResources" resources
are placed randomly in the environment. During the simulation a
constant supply of availabilityOfResources/25 resources is put into the
simulation at random positions. Resources move toward the agent that is
closest by and as soon as they reach the agent they are 'eaten' (the
object is destroyed) and the agent's energy increases by 50. Because of
the random positioning of resources, areas of the simulation differ in
the amount of resources available. Without sharing of resources energy
will be heterogeneous among agents.
Table 2: Parameters of agents (change during simulation) Name Initially Description Update rule toleranceS random value in [0,100] Tolerance for sharing, always positive. If the poorest agent in its neighborhood has energy less than self.energy - toleranceS, the agent will share with that agent with a probability poorest.reputation / self.reputation. When an agent is the worst after a period of 50 iterations, its genome is replaced by a mutated version of the best agent. toleranceP random value in [0,100] Tolerance for punishment, always positive. If the richest agent in its neighborhood has energy greater than self.energy + toleranceP, the agent will punish that agent. When an agent is the worst after a period of 50 iterations, its genome is replaced by a mutated version of the best agent. energy 100 The energy of the agent, always positive. When an agent's energy is lower than 20, it consume no more energy and if it has not enough energy left, it will neither share nor punish other agents.The energy is an agent's fitness for the evolution. Each iteration an agent's energy consumption is quadratically proportional to its energy.
Whenever an agent consumes a resource, energy+=50. An agent's energy will also change by sharing and punishment actions.reputation 1 The agent's reputation. When an agent shares, then reputation+=5. This increase is slowly forgotten according to Ebbinhaus' forgetting curve, so that after 200 iterations a sharing action does no longer contribute to the agent's reputation. - 3.3
- Agents are placed randomly in a quadratic, flat area.
Within a neighborhood agents can punish or share with other agents. The
neighborhood size is chosen such that on average every agent has five
other agents to interact with (the average degree of the agent network
is 5). This number is comparable to the group-size in most studies done
on Public Goods Games. Throughout a simulation an agent stays at its
initial position, to avoid any effect of a certain kind of random
movement of agents on cooperation as described by Smaldino and Schank (2012). Every iteration agents
do three things: (1) Decide if (and if yes, who) to punish, (2) decide
to share and (3) consume energy (figure 2).
The way in which punishment works depends on the punishment mechanism
and is described in the following paragraphs.
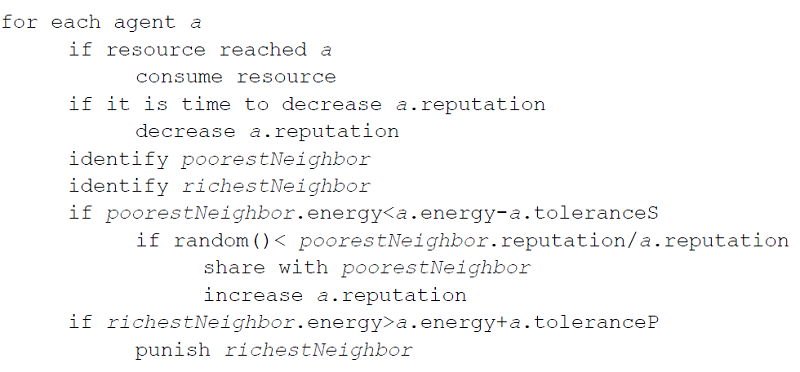
Figure 2. Pseudo code showing the sequence of steps during every iteration - 3.4
- Every agent is initialized with two fixed parameters: toleranceS and toleranceP (always positive doubles). An agent punishes the richest neighbor once per iteration if that neighbor has toleranceP more energy. An agent decides to share once per iteration with the poorest neighbor if that neighbor has toleranceS energy less. Whether this decision really leads to an action depends on a chance that is equal to 'others reputation'/ 'own reputation' (if this value exceeds 1 it is rounded to 1). The reputation of an agent is initially 1 to prevent division by 0. Whenever an agent has the highest reputation it can be sure that others will share with it if the agent is the poorest in the neighborhood. If its reputation is low hardly anyone shares with it. This is the implementation of 'downstream reciprocity' as introduced by Nowak and Roch (2007). Whenever an agent shares with another, this will increase its reputation by the amount it has shared. After 40 iterations half of the increase in reputation vanishes. During iteration 80, 120 and 160 the remaining effect is halved and in iteration 200 the effect completely vanishes. This process mimics Ebbinghaus's forgetting curve (Ebbinghaus 1885).
- 3.5
- In simulations where UP is the punishment mechanism an agent has to pay an incentive of one energy point to punish another agent (distract five energy points from the other). In UP punishment will thus consume six energy points in total. In simulations where LP is used only agents with a higher reputation can punish agents with a lower reputation. With ZLP the costs of the incentive for punishing is paid by all agents collectively and the energy that the agent who is punished loses is re-distributed to all agents. In HGM agents cannot punish each other. Instead nine 'hired guns' are evenly distributed in and observe a part of the area. Together they observe the entire field. Every gun observes about six agents. This number is similar to the group size used by Andreoni and Gee (2012). Furthermore it is the same number of agents that are in the neighborhood of agents in the other conditions. Once every 10 iterations a gun punishes the agent in its neighborhood with the lowest reputation. Cooperation is implemented by sharing. In all punishment mechanisms an agent has to invest six energy points in order to share five with another. Sharing thus leads to a loss of one energy point to the system of agents. A detailed description of an agent's and all other object's behavior in the simulation can be found in Appendix B.
- 3.6
- Each Agent starts with 100 energy units and consumes energy
per iteration. If an agent has 6 energy units it cannot punish nor
share and its energy consumption is 0. Hence an agent's energy cannot
drop below 0. The consumption of an agent grows quadratic with the
energy an agent has (figure 3).
If the total energy is distributed among few agents, total consumption
is much higher than in the case in which total energy is distributed
among a larger number of agents. The extreme cases are those in which
one agent has all the energy (maximum disparity) and the case in which
energy is evenly distributed among all the agents (minimum disparity).
This assumption of the model is based on the literature of economic
inequality. It has been found that in societies where disparity is high
economic growth phases are more likely to end than in societies where
disparity is low (Berg et al. 2012).
Furthermore high disparity is linked to high crime rates (Fajnzylber et al. 2002) and
bad health (Sapolsky 2005)
in societies. In our model efficiency is therefore at its maximum when
disparity is minimal, i.e. when agents share. This makes our
interaction system similar to a typical social dilemma in which the
single agent has the incentive to collect the maximum amount of energy
for itself, but the highest level of energy for the society is reached
when all the agents share their energy.
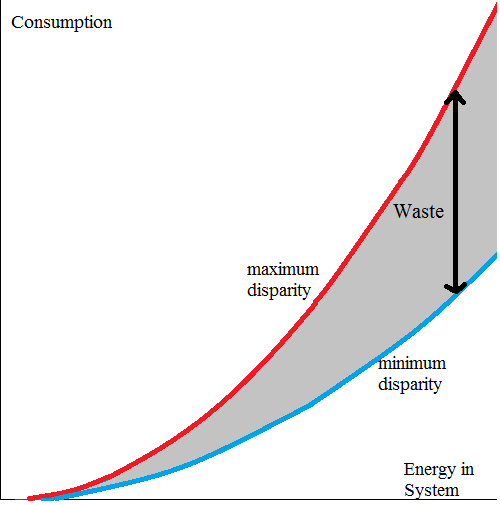
Figure 3. Total energy consumption of agents per iteration increases quadratically when total energy in the simulation increases. Red: one agent has all energy, blue: all agents have equal energy - 3.7
- The population of agents learns to punish and share with others with the help of an evolutionary algorithm. In evolutionary algorithms genes represent solutions to a problem and these solutions/genes increase their probability to get reproduced when they increase the fitness of the agent that reproduces them (Bäck et al. 1997). The evolution of the population is implemented as follows. The fitness of an agent is equal to its energy. The values of toleranceS and toleranceP (the genes) represent possible punishment/sharing policies. Every 50 iterations a tournament selection is done, meaning that the agent with the worst fitness takes over values for toleranceS and toleranceP of the fittest agent + Gaussian noise with μ=0 and σ=5. Energy and reputation are not changed. Every agent faces the trade-off between keeping energy high to have a high fitness and sharing to avoid punishment. Sharing brings also an indirect advantage since it decreases the disparity in the system, thereby the total energy consumption (i.e. it reduces 'waste'), and hence there will be more energy in the future that the agents can benefit from. Note that all agents keep their initial position and that the neighborhoods do not change during the simulation.
- 3.8
- All simulations end after 30,000 iterations and per simulation there are 50 agents. The amount of resources set into the simulations varies and is implemented via a variable called availabilityOfResources. Possible initial values are 50 (low), 100 (mid) and 200 (high) with an addition of resources of respectively 2, 4 and 8 per iteration. AvailabilityOfResources is in some way similar to the 'marginal per capita return' (MPCR) in standard Public Goods Games. Figure 3 shows that with more resources. in the system the difference between the blue and the red function increases. When the availabilityOfResources increases agents will lose more and more resources when their disparity is high. Cooperation thus becomes more important. This connects it to the MPCR: When high, cooperation is rewarded more than when it is low.
- 3.9
- Punishment mechanism and the availability of resources are treated as the independent variables. Per simulation only one punishment mechanism is used, so there are 5 types of simulations: no punishment but only sharing (NP), UP, LP, HGM and ZLP. The dependent variable will be the performance of the system of agents (operationalized as the average energy of all agents during the last 10,000 iterations). Furthermore we will look at the change of agent behavior during simulations and interactions between the independent variables.
Results
- 4.1
- We performed 100 simulations for each possible combination
of the two independent variables (availabilityOfresources and
punishment mechanism), leading to 3 (availabilityOfResources) × 5
(punishment mechanism) × 100 = 1500 simulations. For a better
understanding table 3 defines
terms used in this section.
Table 3: Operationalization of variables. In the analysis only the last 10,000 iterations were taken into account average energy average energy of all agents during simulation disparity average absolute deviation of energy during simulation sharing actions average number of sharing actions per agent and iteration (antisocial) punishments average number of punishments per iteration per agent coefficient of variation disparity / average energy - 4.2
- Average energy of all simulations is reported in figure 4, while figure 5
(left) shows the distribution of average energy per condition during
the last 10,000 iterations (kurtosis and skewness always between -1.3
and 1.0). A detailed analysis of the relative performance of the
punishment mechanisms can be found in the regression models reported in
Appendix A. Independently of the level of availabilityOfResources
unrestricted punishment (UP) performs worse in terms of average energy
than all other punishment mechanisms (see Appendix A, column 2 in
Tables A1, A2, and A3).
Figure 4 shows that for all
values of availabilityOfResources UP has the greatest variability of
average energy compared to other punishment mechanisms. In other words,
how well the system of agents learns to share resources is least
predictable in UP. Also, figure 4
shows that generally with increasing availability of resources the
distribution of average energy during simulation becomes more
homogenous.
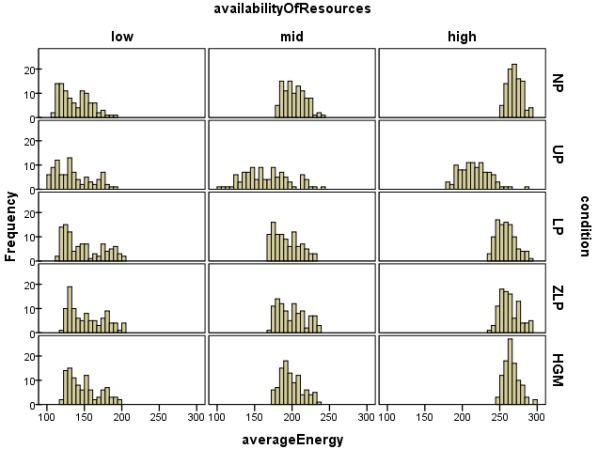
Figure 4. Distribution of average energy of all 100 simulations per condition - 4.3
- Figure 5 (left)
shows the performance of the various punishment mechanisms in terms of
average energy. When the availabilityOfResources is medium ('mid') or
high, NP is the best performing mechanism (Tables A2
and A3, column 1). When the
availabilityOfResources is 'low', legitimate punishment (LP), zero loss
punishment (ZLP), and the hired gun mechanism (HGM) perform
significantly better than no punishment (NP) (Table A1, column 1). These punishment
mechanisms thus increase the performance of agents that have to share
when the availability of resources is low. No significant difference
was found between LP, ZLP, and HGM with a low availabilityOfResources
(Table A1, columns 3 and 4).
ZLP and HGM perform significantly better than LP when
availabilityOfResources is mid or high (Tables A2
and A3, column 3). We can
observe that LP, ZLP and HGM are always performing better than UP.
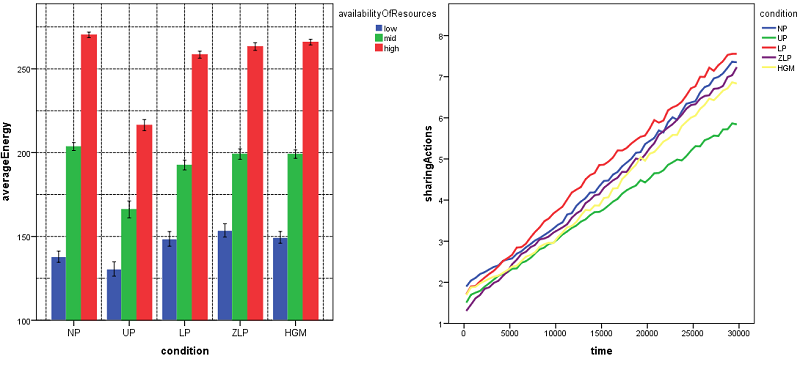
Figure 5. Average energy in various simulations (left). Bars indicate the 95 % confidence interval. Development of the average number of sharing actions of all agents (right) in a simulation per iteration - 4.4
- Summarizing these results from the perspective of the availability of resources, the following can be said. It is only in the case of low availabilityOfResources that punishment mechanisms, with the exception of UP, become effective compared to NP, without significant differences amongst themselves. Yet, they do not perform equally bad amongst themselves under conditions of 'relative luxury' (when availabilityOfResources was mid or high). There UP performs worst, LP medium, and ZLP and HGM best. We suggest that one way of formulating this set of findings is that LP and especially ZLP and HGM are most effective in establishing the sharing of resources even in cases where environmental pressures to do so are relatively low (due to the absence of scarcity).
- 4.5
- Figure 5 (right) shows that independently of the punishment mechanism that was used agents increased their number of sharing actions over time. For the figure only simulations with low availabilityOfResources were used, but the increase was similar for all conditions. The difference between NP and the punishment mechanisms regarding sharing actions was not significant. However, there was a significant difference in average energy (Figure 5, left) between NP and UP on the one hand, and LP, ZLP and HGM on the other hand. Since reallocation of resources, through sharing, was the only possibility for agents to save energy, the difference in average energy must be due to a more effective use of the same number of sharing actions. It seems that LP, ZLP and HGM were helping agents to increase the number of sharing actions in a cost-efficient way. While NP and UP may lead to "blindly sharing", more advanced punishment mechanism like LP, ZLP and HGM helped the agents identify situations in which sharing was more efficient (e.g. when their own energy level is not too low). As described earlier punishment is costly not only from the point of view of the individual but also for the system of agents. When the availabilityOfResources was low the costs of punishment actions turn out to be relatively lower than the advantage that agents produce in terms of effective sharing by means of the LP, ZLP and HGM punishment mechanisms.
- 4.6
- Figure 6 (left) shows how many punishments were performed per iteration during the simulations when availabilityOfResources was 'low'. Note that there are much less punishment actions than there are sharing actions (figure 5, right). For instance, at iteration point 30,000 (end of the simulation), with the LP mechanism there are about 1.7 punishments (figure 6, left) and ∼7.5 sharingActions (figure 5, right). Figure 6 (right) shows how much of this punishment was antisocial punishment. As indicated in the introduction, antisocial punishment means that free-riders can punish cooperators, which is only possible for punishment mechanisms UP and ZLP. Antisocial punishment decreases the fitness of cooperators and, since in our model punishment was meant to facilitate cooperation, it can be considered as a misusage of punishment. In the simulations with UP more than half of all punishment was antisocial punishment. The difference between UP and ZLP reflects the fact that ZLP is more effective in boosting the number of sharing actions while reducing the number of antisocial punishments. Apparently spreading the costs of punishment the punisher has to pay across all agents, as well as the reallocation of the cost for the punished to all agents in ZLP has a positive effect. For figure 6 only data from the simulations where availabilityOfResources was 'low' is used (the ratio of punishment/antisocial punishment for 'mid' and 'high' is similar to that of 'low').
- 4.7
- Interestingly the ratio between punishment actions in general and antisocial punishment is almost exactly the same in ZLP as in UP. In the LP simulations the system used much less punishments compared to all other mechanisms to keep cooperation going. Nevertheless, as discussed in the previous sections, ZLP is performing as well as LP in terms of average energy (figure 5, left, low energy). A combination of LP (avoiding antisocial punishment) and ZLP (minimizing the costs of punishment for individuals and the group) will probably lead to a punishment mechanism which is more effective than ZLP and LP alone.
- 4.8
- Simulations with duration of 100,000 iterations show that
after 25,000 iterations the amount of punishment actions stabilized in
all conditions. Punishing others (though it was altruistic punishment
in case of UP and LP) must have brought an (indirect) evolutionary
advantage to the individual to remain encoded in the agents' genes.
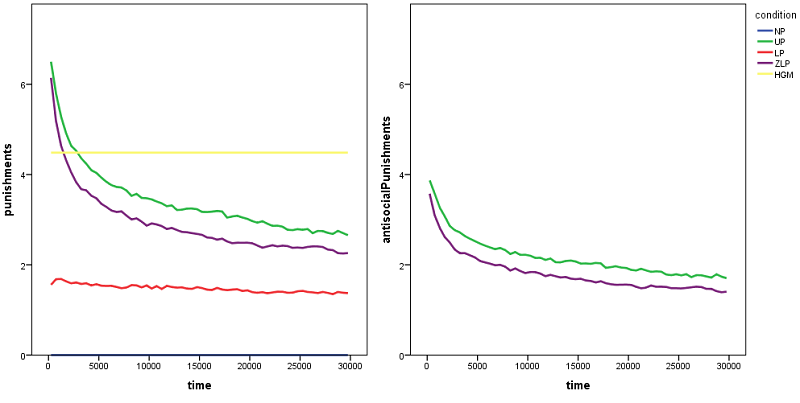
Figure 6. Development of average number of punishment actions (left) and antisocial punishments of all agents (right) during simulations per iteration. For reasons of clarity every data point represents the average of 500 iterations - 4.9
- Figure 7 (left)
shows three clusters of simulations (representing different
availabilityOfResources) and suggests that average energy and the
disparity (variation of energy level of agents) during a simulation are
negatively correlated. The correlations per condition were between
-.679 and -.966 (p < .001 for all
conditions). In figure 7
(right) we see that ZLP was always the mechanism leading to the lowest
disparity. In the figure we use the coefficient of variation
(definition in table 1) to
correct for different average energy in the conditions. As we already
saw in figure 5 (left) ZLP was
not always the best performing mechanism in terms of average energy of
agents. Keeping the disparity low among agents seemed to be more
effective with regard to average energy when the availability of
resources was low, than when it was high.
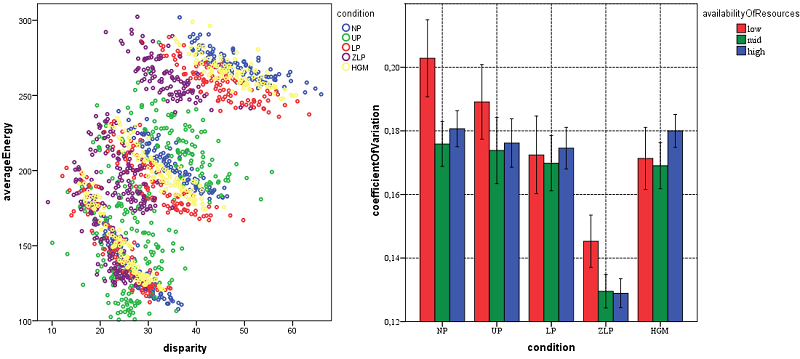
Figure 7. Left, Every dot represents the average of one simulation. Right, Coefficient of variation of agent's energy during the last 10,000 iterations
Discussion
- 5.1
- With the help of an agent based simulation we showed that punishment can be a facilitator for effective cooperation. Punishment is not just a stopgap for cooperation when agents lack information about each other but can bring an additional coordinative advantage. In our simulation selection took place on the agent level. Since punishment was constant during evolution (figure 5) we showed that (altruistic) punishment is effective not just on a group level, but also for individuals, even when it is not explicitly needed to keep cooperation going. However, when which punishment mechanism works best and if it can play a facilitating role for maximizing the efficiency of cooperation depends on the environment in which agents interact.
- 5.2
- Our simulations show that punishment mechanisms can be a facilitator of the effectiveness of cooperation if the availability of resources is low. Because of the energy consume function of agents this corresponds to Public Goods Games where the marginal per capita return (MPCR) is low. The MPCR works as a motivator for cooperation in Public Goods Games and the lower the return the lower the willingness of subjects to cooperate (Kim & Walker 1984). In our simulation we reach a first important result: as shown by Ohtsuki et al. (2009), indirect reciprocity is enough to induce cooperation and punishment does not give a significant contribution to the growth of cooperation rate (Ohtsuki et al. 2009). However, this is only true when resources are abundant. It seems that mechanisms like indirect reciprocity, giving all responsibility for cooperation to the individual, work not strong enough as a facilitator to ensure cooperation in these situations. It seems to be necessary and effective to give the group the possibility to steer cooperation through punishment when MPCR is low.
- 5.3
- The second important result is that when resources are low, punishment is useful but only if it is restricted. The simulations show that the negative effects of antisocial and counter punishment can be effectively cut back through legitimate punishment. LP was always performing better than unrestricted punishment and this confirms the results of Faillo et al. (2013). We assume that a combination of LP and ZLP (minimizing the costs of a punishment action for group and individual) will lead to an even better outcome. Therefore, comparing indirect reciprocity only with unrestricted punishment (Ohtsuki et al. 2009) could lead to partial conclusions about the effectiveness of the two cooperation-enhancing mechanisms.
- 5.4
- The results for the hired gun mechanism have to be interpreted with care. The effectiveness of HGM may depend on variables like punishment frequency and group size. By fine-tuning them performance of HGM may increase significantly. However we saw that HGM can outperform other punishment mechanism even without fine-tuning when the availability of resources was high.
- 5.5
- Research in social dilemmas has focused on the extent to which punishment and reciprocity lead to cooperation, but cooperation should not be a goal in itself. In the simulations presented cooperation also consumes resources, leading to the necessity for agents to find a balance between benefits of cooperating and not cooperating. This is a fact ignored within the framework of Public Goods Games and our results show that it can be a crucial aspect when judging the effectiveness of resource management.
- 5.6
- In our simulations all agents were learning (through evolution) the actions that were best for their fitness. Despite this egocentric point of view, agents did neither stop punishing nor sharing, although those did not bring a direct advantage to them. We confirm the findings of Ye et al. (2011) that through the incorporation of reciprocity in our evolutionary model the first- (why should we share?) and second-order social dilemmas (why should we altruistically punish?) resolve themselves. Contrary to Ye et al. 'altruistic' behavior was not rewarded directly by the group but indirectly through a higher chance that others will cooperate. We did not make any specific cognitive assumptions about the types of agents, but made them as simple as possible (i.e. no rational or deliberative capacities) and then let them evolve.
- 5.7
- The environments investigated in the simulations only differ in one parameter: the availability of resources. Many more parameters such as a changing availability of resources during simulation, or a changing number of agents are possible and should be taken into account in order to increase the external validity of our results. Furthermore all agents were equal in their energy consumption and only differed with respect to toleranceS and toleranceP. Humans are far more diverse and research is needed to understand how well various punishment mechanisms can deal with this diversity.
- 5.8
- Because of the simulation methodology and the evolutionary learning algorithm underlying our simulations, this research has a strong computational flavor. It is not often fully realized that social simulation cannot only help to validate theories in economics and social science, but the findings can also be used to create or improve artificial social intelligence. The results point towards solutions for problems in e.g. decentralized power grids or wherever software agents have to autonomously share resources. In order to keep e.g. a power grid stable very quick decisions have to be made about when energy producers are allowed to feed electricity into the grid or when e.g. extra energy has to be bought from foreign countries. Instead of centrally steering this network, one could decide to give agents (energy producers) local control about the energy grid. This would avoid an exploding computational complexity of decisions to be made in such networks and help to increase the speed and flexibility with which the system can react. The objectives would be similar to those in the simulation: Maximize own energy feed-in, while sharing and punishing others on rights to feed energy. Given the increasing size, flexibility, and demands on such systems, we assume that more social intelligence is needed for agents within these networks.
Appendix
A
-
This appendix contains the tables with the results of the regression analyses as referred to in the results section. The average level of energy of each condition is compared with the average level of energy of the benchmark condition. The analysis is replicated for each of the three levels of resources available to the agents.
Table A1: Average Energy across treatments (Resources=50) Average
Energy
Benchmark=NP
(1)
Benchmark=UP
(2)
Benchmark=LP
(3)
Benchmark=ZLP
(4)
NP
7.29**
(3.33)-10.64
(3.33)-15.70**
(3.33)
UP
-7.29**
(3.33)-17.94**
(3.33)-23.00**
(3.33)
LP
10.60**
(3.33)17.94**
(3.33)-5.06
(3.33)
ZLP
15.70**
(3.33)23.00**
(3.33)5.06
(3.33)
HGM
11.55**
(3.33)18.85**
(3.33)0.91
(3.33)-4.15
(3.33)
CONST.
137.76**
(2.36)130.56**
(2.36)148.51**
(2.36)153.57**
(2.36)OLS estimation.
Regressors are all dummy variables.
NP = 1 in case of no punishment and 0 otherwise; UP =1 in case of unrestricted punishment and 0 otherwise; LP =1 in case of legitimate punishment and 0 otherwise; ZLP=1 in case of zero loss punishment and 0 otherwise; HGM= 1 in case of hired gun punishment mechanism and 0 otherwise;
N=500 (100 simulations x 5 treatments)
F(4, 495)=16.13**
Root MSE=23.60
R-squared=0.11
Standard error in parentheses
** significant at 1%; * significant at 5%Table A2: Average Energy across treatments (Resources=100) Average
Energy
Benchmark=NP
(1)
Benchmark=UP
(2)
Benchmark=LP
(3)
Benchmark=ZLP
(4)
NP
37.49**
(2.83)11.00**
(2.83)4.43
(2.83)
UP
-37.49**
(2.83)-26.49**
(2.83)-33.05**
(2.83)
LP
-11.60**
(2.83)26.49**
(2.83)-6.56**
(3.33)
ZLP
-4.43
(2.83)33.05**
(2.83)6.56**
(2.83)
HGM
-4.49
(2.83)33.04**
(2.83)6.51**
(2.83)-0.05
(2.83)
CONST.
203.58**
(2.00)166.09**
(2.00)192.58**
(2.00)199.14**
(2.20)OLS estimation.
Regressors are all dummy variables.
NP = 1 in case of no punishment and 0 otherwise; UP =1 in case of unrestricted punishment and 0 otherwise; LP =1 in case of legitimate punishment and 0 otherwise; ZLP=1 in case of zero loss punishment and 0 otherwise; HGM= 1 in case of hired gun punishment mechanism and 0 otherwise;
N=500 (100 simulations × 5 treatments)
F(4, 495)=56.49**
Root MSE=20.038
R-squared=0.31
Standard error in parentheses
** significant at 1%; * significant at 5%Table A3: Average Energy across treatments (Resources=200) Average
Energy
Benchmark=NP
(1)
Benchmark=UP
(2)
Benchmark=LP
(3)
Benchmark=ZLP
(4)
NP
53.84**
(1.93)11.81**
(1.93)6.97**
(1.93)
UP
-53.84**
(1.93)-42.03**
(1.93)-46.87**
(1.93)
LP
-11.81**
(1.93)42.03**
(1.93)-4.84**
(1.93)
ZLP
-6.97**
(1.93)46.87**
(1.93)4.84**
(1.93)
HGM
-4.30**
(1.93)49.54**
(1.93)7.51**
(1.93)2.67
(1.93)
CONST.
270.25**
(1.36)216.41**
(1.36)258.44**
(1.36)263.28**
(1.36)OLS estimation.
Regressors are all dummy variables.
NP = 1 in case of no punishment and 0 otherwise; UP =1 in case of unrestricted punishment and 0 otherwise; LP =1 in case of legitimate punishment and 0 otherwise; ZLP=1 in case of zero loss punishment and 0 otherwise; HGM= 1 in case of hired gun punishment mechanism and 0 otherwise;
N=500 (100 simulations × 5 treatments)
F(4, 495)=257.29**
Root MSE=13.66
R-squared=0.67
Standard error in parentheses
** significant at 1%; * significant at 5%
Appendix
B
-
In the following, a semi-formal description will be presented of objects active during the simulation. Objects contain a list of variables, the Init-method (executed when the object is created), an Iterate-method (executed every iteration, beginning one iteration after creation), and if needed a set of extra functions. The Controller is created as soon as the simulation starts and creates and coordinates all other objects. Variables are written in italics, the name of the object bold.
Appendix
C
-
The following figures show the results of a parameter sensitivity analysis. Additionally to the independent variable availabilityOfResources that we present in the main part of the paper we also manipulated the variables numberOfAgents (35, 50, and 65), ratio between costOfPunishment, and punishment (0.2 or 0.5) and the forgetting curve of reputation (Ebbinghaus or sudden forgetting). Summarized, those variables changed the absolute performance of agents during the simulation, but none changed the ranking of the punishment mechanisms and they were thus not included in the main part of the paper. For each of the levels of the parameters (numberOfAgents, costOfPunishment and forgetting) we ran 10 simulations per punishment mechanism. For numberOfAgents 3×5×10=150 simulations were done and for costOfPunishment and forgetting 2×5×10 simulations.
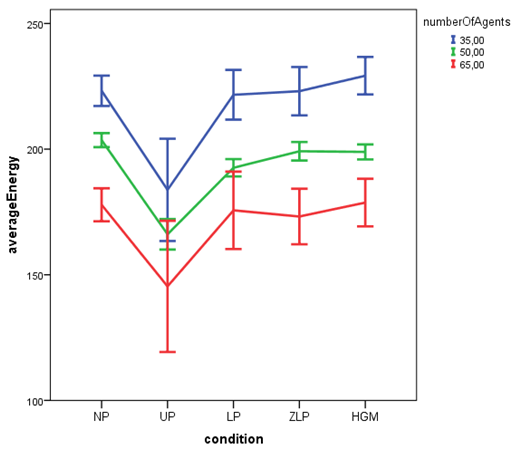
Figure A1. AverageEnergy during simulations with different numberOfAgents. Bars indicate the 95 % confidence interval Figures A1 and A2 show that neither numberOfAgents nor ratio costOfPunishment/punishment changed the ranking of the punishment mechanism with regard to the averageEnergy. Since the numberOfAgents and the punishment ratio were tested in a pilot study fewer simulations were done with values for this variables differing from those in table 1 in the main part of the paper. For those variables only 10 simulations were run per condition and the shown confidence intervals are therefore larger.
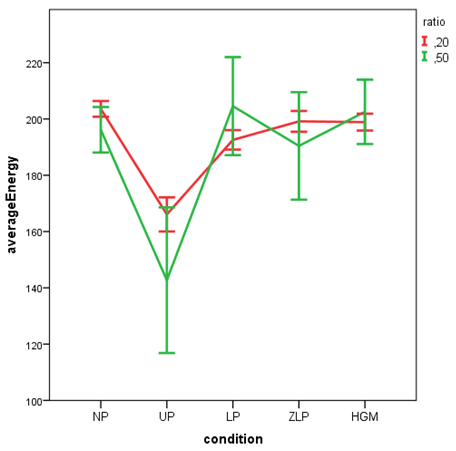
Figure A2. AverageEnergy during simulations with different ratios of costOfPunishment/punishment. Bars indicate the 95 % confidence interval Figure A3 compares the results of an earlier version of the model (left) and the actual version of the model (right). In the old version agents increased their reputation by 200 whenever they shared and after 200 iterations this effect on the reputation was gone. In the new version agents did not "forget" this reputation suddenly after 200 iterations but in a way that mimics the Ebbinghaus' forgetting curve (as discussed in the main paper). The different forgetting curves do not make a big difference. However sudden forgetting (figure A3, left) seemed to make UP more effective. In that case, when the availabilityOfResources is low UP performs better than NP.
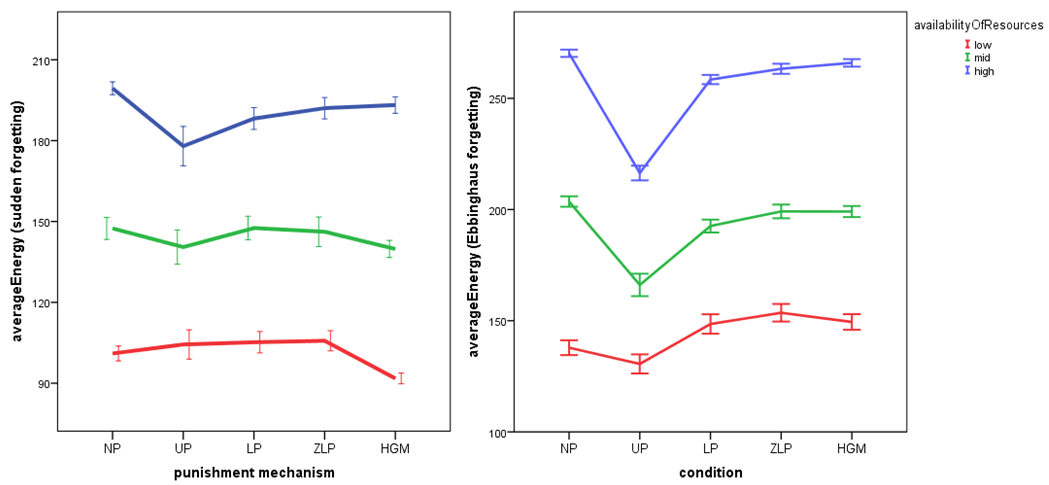
Figure A3. AverageEnergy during simulations with different forgetting of reputation. Bars indicate the 95 % confidence interval
References
- ANDREONI, J., & Gee,
L.K. (2012). Gun for Hire: Delegated Enforcement and Peer Punishment in
Public Goods Provision. Journal of Public Economics, 96,
1036–1046. [doi:10.1016/j.jpubeco.2012.08.003]
AXELROD, R. (1984). Evolution of Cooperation, Basic Books.
BäCK, T., Fogel, D., & Michalewicz, Z. (1997). Handbook of Evolutionary Computation. Oxford University Press.
BERG, A. G., Ostry, J. D., & Zettelmeyer, J. (2012). What makes growth sustained? Journal of Development Economics, 98(2), 149–166. [doi:10.1016/j.jdeveco.2011.08.002]
BOYD, R., Gintis, H., Bowles, S., & Richerson, P. J. (2003). The evolution of altruistic punishment. Proceedings of the National Academy of Sciences, 100(6), 3531–3535. [doi:10.1073/pnas.0630443100]
BROCKHURST, M. A., Buckling, A., Racey, D., & Gardner, A. (2008). Resource supply and the evolution of public-goods cooperation in bacteria. BMC Biology, 6(1), 20. [doi:10.1186/1741-7007-6-20]
CARPENTER, J., Bowles, S., Gintis, H., Hwang, S. (2009). Strong reciprocity and team production: Theory and evidence, Journal of Economic Behavior & Organization, 71, 221–232. [doi:10.1016/j.jebo.2009.03.011]
CHAUDHURI, A. (2011). Sustaining cooperation in laboratory public goods experiments: a selective survey of the literature. Experimental Economics, 14, 47–83. [doi:10.1007/s10683-010-9257-1]
DAWES, R.M., & Messick, D.M. (2000). Social dilemmas. International Journal of Psychology, 35, 111–116. [doi:10.1080/002075900399402]
EBBINGHAUS, H. (1885). Über das Gedächtnis. Untersuchungen zur experimentellen Psychologie. Leipzig: Duncker & Humblot.
FAILLO, M., Grieco, D., & Zarri, L. (2013). Legitimate Punishment, Feedback, and the Enforcement of Cooperation. Games and Economic Behavior, 77, 271–283. [doi:10.1016/j.geb.2012.10.011]
FAJNZYLBER, P., Lederman, D., & Loayza, N. (2002). Inequality and Violent Crime. Journal of Law and Economics, 45(1), 1–40. [doi:10.1086/338347]
FARJAM, M.D., Haselager, W.F.G., & Sprinkhuizen-Kuyper, I.G. (2012). Greed, envy, jealousy: A tool for more efficient resource management. Proceedings of the 24th Benelux Conference on Artificial Intelligence (BNAIC 2012). In Jos W.H.M. Uiterwijk, Nico Roos, and Mark H.M. Winands (eds.), The 24th Benelux Conference on Artificial Intelligence (BNAIC) 2012, Proceedings of the 24th Benelux Conference on Artificial Intelligence, 25–26 October 2012, Maastricht, The Netherlands, pp. 99–107
FEHR, E., & Gächter, S. (2000). Cooperation and Punishment in Public Goods Experiments. American Economic Review, 90, 980–994. [doi:10.1257/aer.90.4.980]
FEHR, E., & Gächter, S. (2002). Altruistic Punishment in Humans. Nature, 415, 137–140. [doi:10.1038/415137a]
FEHR, E., Fischbacher, U., & Gächter, S. (2002). Strong Reciprocity, Human Cooperation and the Enforcement of Social Norms, Human Nature, 13, 1–25. [doi:10.1007/s12110-002-1012-7]
FUDENBERG, D., & Levine, D.K. (1994). Efficiency and Observability with Long-Run and Short-Run Players. Journal of Economic Theory, 62, 103–135 [doi:10.1006/jeth.1994.1006]
GINTIS, H., & Bowles, S. (2011). A Cooperative Species: Human Reciprocity and Its Evolution. Princeton, N.J: Princeton University Press
GINTIS, H., Henrich, J., Bowles, S., Boyd, R., & Fehr, E. (2008). Strong Reciprocity and the Roots of Human Morality. Social Justice Research, 21, 241-253. [doi:10.1007/s11211-008-0067-y]
HAUERT, C., Traulsen, A., Brandt, H., Nowak, M.A., & Sigmund, K. (2007). Via Freedom to Coercion: The Emergence of Costly Punishment, Science, 319, 1905–1907. [doi:10.1126/science.1141588]
HAUERT, C., Traulsen, A., Brandt, H., Nowak, M.A., & Sigmund, K. (2008). Public goods with punishment and abstaining in finite and infinite populations, Biological Theory, 3(2), 113–122. [doi:10.1162/biot.2008.3.2.114]
HENRICH, J. (2004). Cultural group selection, coevolutionary processes and large-scale cooperation. Journal of Economic Behavior and Organization, 53, 3–53. [doi:10.1016/S0167-2681(03)00094-5]
HENRICH, J., Mcelreath, R., Barr, A., Ensminger, J., Barrett, C., Bolyanatz, A., Cardenas, J. C., Gurven, M., Gwako, E., Henrich, N., Lesorogol, C., Marlowe, F., Tracer, D., & Ziker, J. (2006). Costly Punishment Across Human Societies. Science, 312, 1767–1770. [doi:10.1126/science.1127333]
HERRMANN, B., Thöni, C., & Gächter, S. (2008). Antisocial Punishment across Societies. Science, 319, 1362–1367. [doi:10.1126/science.1153808]
JAFFE, K., & Zaballa, L. (2010). Co-operative Punishment Cements Social Cohesion. Journal of Artificial Societies and Social Simulation, 13 (3) 4: <https://www.jasss.org/13/3/4.html>
KANDORI, M. (2002). "Introduction to Repeated Games with Private Monitoring", Journal of Economic Theory, 102, 1–15. [doi:10.1006/jeth.2001.2853]
KIM, O., & Walker, M. (1984). The free rider problem: Experimental evidence. Public Choice, 43, 3–24. [doi:10.1007/BF00137902]
KLEIN, J. (2002). Breve: a 3D simulation environment for the simulation of decentralized systems and artificial life. Proceedings of Artificial Life VIII, the 8th International Conference on the Simulation and Synthesis of Living Systems. The MIT Press.
LEDYARD, J. (1995). Public Goods: A Survey of Experimental Research. In Kagel, J & Roth, A (eds): Handbook of Experimental Economics (pp. 111–181). Princeton: Princeton University Press.
MATHEW, S., & Boyd, R. (2011). Punishment sustains large-scale cooperation in prestate warfare. Proceedings of the National Academy of Sciences, 108(28), 11375–11380. [doi:10.1073/pnas.1105604108]
MESSICK, D.M., & Brewer, M.B. (1983). Solving social dilemmas: A review. Review of Personality and Social Psychology, 4, 11–44.
NOWAK, M.A. (2006). Five rules for the evolution of cooperation. Science, 314, 1560–1563. [doi:10.1126/science.1133755]
NOWAK, M.A., & Roch, S. (2007). Upstream reciprocity and the evolution of gratitude. Proceedings of the Royal Society of London, Series B: Biological Sciences, 274, 605–610. [doi:10.1098/rspb.2006.0125]
NOWAK, M.A., & Sigmund, K. (1998). Evolution of indirect reciprocity by image scoring. Nature, 393, 573–577. [doi:10.1038/31225]
OHTSUKI, H., Iwasa, Y., & Nowak, M.A. (2009). Indirect reciprocity provides only a narrow margin of efficiency for costly margin, Nature, 457, 79–82. [doi:10.1038/nature07601]
OSTROM, E. (1990). Governing the Commons: The Evolution of Institutions for Collective Action. Cambridge University Press. [doi:10.1017/cbo9780511807763]
RAND, D.G., & Nowak, M.A. (2011). The evolution of antisocial punishment in optimal public goods games. Nature, Communication, 2:434. [doi:10.1038/ncomms1442]
RAPOPORT, A., & Chammah, A.M. (1965). Prisoner's Dilemma, Univ. of Michigan Press.
SAPOLSKY, R. (2005). Sick of Poverty. Scientific American, 293, 92–99. [doi:10.1038/scientificamerican1205-92]
SMALDINO, P.E., & Schank, J.C. (2012). Movement patterns, social dynamics, and the evolution of cooperation. Theoretical Population Biology, 82, 48–58. [doi:10.1016/j.tpb.2012.03.004]
VAN DYKEN, J.D., & Wade, M.J. (2012). Origins of altruism diversity I: The diverse ecological roles of altruistic strategies and their evolutionary responses to local competition. Evolution; international journal of organic evolution, 66(8), 2484–97. [doi:10.1111/j.1558-5646.2012.01630.x]
WILLIAMSON, O.E. (1981). The Economics of Organization: The Transaction Cost Approach. The American Journal of Sociology, 87, 548–577. [doi:10.1086/227496]
YE, H., Tan, F., Ding, M., Jia, Y., & Chen, Y. (2011). Sympathy and Punishment: Evolution of Cooperation in Public Goods Game. Journal of Artificial Societies and Social Simulation, 14 (4) 20: <https://www.jasss.org/14/4/20.html>