
 Abstract
- Peer review is ubiquitous in modern science: from the evaluation of publications to the distribution of funding. While there is a long tradition of, and many arguments for, peer review as a beneficial and necessary component of scientific processes, the exponential growth of the research community, the 'publish or perish' pressures and increasing insecurity and competition for research grants have led to an increasing number of voices describing the weaknesses of the system. One of the most frequent accusations against the peer review system is that it inhibits true innovation. The availability of better data mining tools allows interested stakeholders, in principle, to monitor many aspects of the process and to promote a better understanding of the interplay of various factors. 'In principle' – because a lot of information is hidden behind the screens of anonymity and confidentiality. Our work presents an attempt at a theoretical understanding of some aspects of the process via an idealized agent-based model, which describes the effects of the peer review done by 'imperfect' agents, in particular with respect to promotion of mediocrity and to formation of self-serving cliques. The results of the model suggest that both phenomena can be quite robust and require careful monitoring of the system to combat their negative effects. Some mitigating measures are simulated and discussed.
- Keywords:
- Innovation, Research Funding, Cliques
Introduction
- 1.1
- Modern science is a highly competitive enterprise in many ways. In addition to the race to be the first to discover Nature's secrets, scientists deal now with the parallel races for the creation of commercially viable intellectual property, solutions and products; the competition over limited funding as well as job prospecting in an increasingly insecure academic environment (Ziman 1994).
- 1.2
- Despite these competitive pressures, some of the basic research processes assume that participants would behave in a deeply cooperative way. Perhaps the most visible of such areas is the use of peer review to evaluate the results obtained by other researchers (in the form of publication reviews) or the promises of such results (in the form of the research proposal evaluations used in most competitive funding programs). The basic arguments for the use of peer review rely largely on its historical role in the development of science, on the premise that research results should be verifiable and reproducible (and the belief that the pre-publication peer review would ensure at least partial verification), and on the assumption that there is no one better qualified to evaluate someone's research than that person's peers – certainly not the administrators or bureaucrats! Today, for most scientists, it is hard to imagine research without peer review, which is needed to ensure the quality of research. Yet, this ubiquitous presence is a relatively new phenomenon – for a large part of modern science history quality control was the domain of the editors of journals or the governing bodies of research societies.
- 1.3
- On the other hand, we have to take into account several changes in research that happened in the last decades of the 20th century and in the first years of the 21st. The exponential growth of science, observed long ago (de Solla Price 1986), has continued and new technologies have resulted in an increase in the number of ways in which it can be observed. Now not only does the number of scientists and papers grow exponentially, so does the number of journals and specialized disciplines. Similar growth would presumably also be observable in analyses of the specialized vocabularies, acronyms and concepts used in science[1]. This growth, in situations where research funding grows more slowly or remains fixed, must lead to increased competition for resources, funding, jobs and even attention to results and achievements, creating the conditions for the 'steady state' science described by Ziman (1994).
- 1.4
- These changes in the environment have revealed several
shortcomings in the peer review process. The increasing load on
reviewers has led to a growing number of cases where substandard work
gets through the sieve of peer review. This is well documented by both
the increasing amount of forced retractions (the web site
retractionwatch.com provides an excellent view of the phenomenon) as
well as the provocative experiments in the submission of bogus papers (Labbé and Labbé 2013; Kabra 2013; Stribling et al. 2005; Van Noorden 2014). At
least some of these problems are connected with the explosive growth of
low-quality, open-access journals, which actively solicit papers
without any review process (Bohannon
2013).
Peer review in science funding
- 1.5
- A significant part of the funding for research and development (R&D) is distributed through competitive programs, in which research proposals are compared and judged for their excellence, expected results and probability of completion. Many of these competitions rely on peer review to evaluate the proposed research projects. With its long-standing status in assuring high quality research (e.g. in checking the originality and quality of scientific publications, Merton 1973) peer review is considered a good method to ensure that the right proposals would get financial support. The main arguments were (and still are) the ability to use the expertise already in the field and the democratic – in the sense of the decisions originating, at least partially, within the research community – nature of the process (Rennie 1999; Benos et al. 2007). However, for over thirty years, many people have been pointing out the shortcomings of peer review, as applied to the selection of proposals for research grants (see below). One of the most important differences in the use of peer review in competitive funding schemes as compared to the publishing of papers is that a good paper rejected by one journal would almost always eventually get published somewhere, a grant proposal which is not funded is likely to lead to dropping the line of research altogether (Wessely 1998; Horrobin 1996). The competitive nature of the process, influenced by the slow growth of the available funds (at best) and exponential growth in the number of researchers makes proposal preparation and the winning of grants a matter of survival for many scientists.
- 1.6
- Langfeldt and Kyvik (2011) have discussed the increasing impact that review tasks of various types have had on the research community. This influence is not limited to the obvious time conflict between doing research and evaluation tasks, but also creates other important tensions related to impartiality, neutrality and accountability of actions.
- 1.7
- Another widely recognized negative result of the use of peer review for funding selection is the 'mediocrity bias'. This refers to situations when truly innovative proposals have less chance of being funded than those focused on established areas, extending knowledge in a predictable way. This can happen for several reasons, for example due to the difficulty in choosing the right reviewers: those too close to the subject of the proposal may treat it as competition, while those too far from it would have trouble recognizing the true innovations. Moreover, some popular topics or research areas receive special attention and funding, diminishing the chances of applicants focusing on other fields. The danger of focusing on mediocrity has been recognized, for example in Berezin (1998); Horrobin (1996); Spier (2002); Lawrence (2009); Azoulay et al. (2011); Alberts et al. (2014). The subjective nature of the evaluation process is crucial because of the increased focus that research funding agencies place on 'impact', including economic impact (as described, for example, in the Horizon 2020 framework), which can only be guessed for inherently unpredictable discovery projects. With respect to relatively fashionable fields like nanotechnology, Beaudry and Allaoui (2012) have described the impact of funding on the quality of research and innovativeness, finding differences between results of public and private funds. Three recent publications (Scheiner & Bouchie 2013; Danthi et al. 2014; Gallo et al. 2014) have shown no or only a weak correlation between the reviewer rating of research proposals and their academic impact, as measured by the number of citations.
- 1.8
- Interestingly, the negative consequences of using (and abusing) peer review in the funding process have received less attention than the role of peer review in publishing. In fact, some commentators have pointed out the reluctance to consider the peer review process as a subject of scientific study in itself (Marsh et al. 2008; Horrobin 1996). Wenneras and Wold (1997) have stressed that the 'credibility of the academic system will be undermined in the eyes of the public if it does not allow scientific evaluation of its own evaluation system'. One reason for this relative scarcity of studies may be that, in contrast to studies of the publishing of papers, many aspects of the grant awarding process are covered by confidentiality rules.
- 1.9
- Empirical studies of selection programs have been conducted in the USA (Wessely 1998; Beaudry & Clerk-Lamalice 2010; Kardes et al. 2013; Stephan 2010), the UK (Horrobin 1996; Bence & Oppenheim 2004), India (Mouly & Sankaran 1999), Sweden (Wenneras & Wold 1997; Sandström and Hällsten 2008), Australia (Martin 2000; Goldsworthy, 2009), Hungary (Böröcz 2000), Germany (Grimpe 2012), Korea (Lee et al. 1999), and other countries (Demicheli & Di Pietrantonj 2007). Unfortunately, in many cases, the conclusions of these works are based on subjective perceptions and anecdotal evidence rather than on statistical analyses.
- 1.10
- A good example of such a detailed analysis is a study of European Research Council (ERC) grant applications with the goal of detecting innovative, 'frontier' research (Scherngell et al. 2013). Out of five variables that might correlate with innovation, three were found to play a relatively insignificant role in the evaluation process: investigator risk, applicability and timeliness. On the other hand, interdisciplinarity (despite being promoted) was found to have a negative effect on funding selection, while similarity (defined in relationship to clusters of the fastest growth in a given field/discipline) was the only variable for which a strong, positive correlation was found. This is disturbing because the results suggest the dominance of research fashions and a type of herd behavior.
- 1.11
- An interesting observation has been made by Tague et al. (1981), who compared the number
of innovative papers and the total number of papers published on the
topic of obsolescence between 1944 and 1980. They found that while the
number of papers grew exponentially, the truly innovative ones (defined
as those introducing new ideas and results) had at best a linear
growth. While this result refers to publications, it may serve as a
suggestion that the overall results of research grants (including
publications, patents, know-how, etc.) may follow a similar pattern.
Agent-based models of peer-review
- 1.12
- In addition to empirical research, one of the most fruitful approaches to studying social phenomena in recent decades is research using agent-based models, which allow one to reproduce, qualitatively or quantitatively, the characteristics of the social systems studied and to provide an understanding of the various factors that may determine their behavior. Research processes, the growth of science, knowledge diffusion, co-authorship and citation networks have been fruitful subjects of many agent-based works (for a recent review see Scharnhorst et al. (2012)).
- 1.13
- Nevertheless, the number of modeling studies devoted to peer review in the selection process is very small, as noted by almost all authors of such papers. Squazzoni and Takács (2011) have noted this gap in research and have called for simulations with the 'objective of understanding biases in the reviewing processes'. Indeed, Squazzoni and Gandelli (2012, 2013) have published agent-based models of scientific behavior and peer review in a highly abstract and simplified system. They have focused on the reliability of the process and the effects of fairness and self-interest among the authors and reviewers. The results suggested that differences in reviewer behavior may dramatically influence the quality of the published work.
- 1.14
- Sonnenberg (2005) has presented a simple mathematical model of the ratio of creative works, connected with out-of-the-box thinking and high cost and risk in academic medicine (called 'deviations'). Some of these deviations were associated with new and creative developments, but more often the term may cover other departures from the research norm, such as unusual methods, a waste of resources, negligence or poor performance. The model leads to much slower growth of all types of deviations (including innovative works), compared to the overall growth of the number of publications, eventually leading to the decline of the ratio of innovative versus all output.
- 1.15
- The few other existing models have focused on different aspects of peer review selection. Geard and Noble (2010) have analyzed scientific output and the quality of research. Bentley (2009) has looked at the process from a game theoretic point of view, and one of his findings (important for our analysis on cliques) was the emergence of cooperation, despite the highly competitive nature of the process. This result provides theoretical support for the emergence and stability of possible cooperative activities, both overt (research consortia) and covert (cliques). Allesina (2012) has used an agent-based model, focusing on journal submissions. The model indicates that even in an idealized system, where there is no bias and perfect estimation of the manuscript value, the introduction of measures external to peer review, such as the adoption of editorial rejection, can improve the quality of the published results. This has been partially confirmed by an empirical study by Calcagno et al. (2012), which has shown that articles resubmitted after rejection from other journals received significantly more citations than papers that were published in the first choice journals (provided that the resubmissions occurred within certain journal communities). It is quite reasonable to extend some of the results to the case of the peer review of funding proposals.
- 1.16
- Fang (2011) has modeled the effects of creating majority view in over competitive environments. He has shown that the peer review process in such environments effectively created a dominant 'mainstream opinion', even though the initial difference between the mainstream and non-mainstream viewpoints was very small. Continuing this line of research, Liu and Fang (2012) have analyzed cosmology research and found quantitative agreement between the model and the observed publication data.
- 1.17
- Thurner and Hanel (2011) have proposed a model focused on journal reviews and publications, looking at the effects of 'rational' referee behavior (defined as those who know that publishing work better than their own might draw attention away from their own and who reject such submissions). The simulations have shown that even a small admixture of such 'rational' evaluators may significantly lower the quality of the published literature. Our model shares some conceptual similarities with that of Thurner and Hanel, but we note here that any deficiency of the system in the context of funding has much more impact than in article publication, because the competition is stronger and there are fewer alternatives.
- 1.18
- Paolucci and Grimaldo (2014)
have also modelled the effects
of a rational cheating strategy, defined as
deliberate mis-evaluation by the reviewers of papers with intrinsic
values that are greater or equal than the quality of the reviewer when
he or she behaves as an author. While focusing on publication-related
peer review, this approach is similar to the one presented here.
Abuse of the system: cronyism, cliques, biases
- 1.19
- One of the major issues identified in peer review for funding is the presence of institutional cronyism and the formation of 'old boy' networks (cliques) influencing the selection process. Such phenomena have been criticized in many countries. Travis and Collins (1991) have used very strong language to describe the system: 'the peer review system consists of a group of committees whose members hand out grants to each other and to their friends'. Berezin (1998) puts it as follows 'the secretive nature of the funding system turns it into a self-serving network operating on the principles of old-boys club'. Mouly and Sankaran (1999) found in their study that 'respondents believed that researchers who are part of the cliques get funded all the time. [...] Nepotism and favoritism are rampant.' These perceptions have also been partially substantiated by empirical studies (despite difficulties due to the secretive nature of abuses of the funding system). Most of the papers mentioned in the previous section suggest that such privileged groups might exist and that the negative effects of their existence may be important (for example Horrobin (1996), who concludes that 'the system encourages dishonesty and elevates the corrupt').
- 1.20
- Bias in the evaluation process may also appear without any dishonest intent, simply from higher scores given on the basis of personal connections between researchers who know and trust each other. This has been demonstrated in (rare) situations where the identity of the evaluators was known and could be matched with the identities of the applicants (Wenneras & Wold 1997; Ragone et al. 2011; Marsh et al. 2008). Sandström and Hällsten (2008) have observed that 'principal investigators with reviewer affiliation always receive higher grade than applicants with no reviewer affiliation', with statistically significant difference. When we note that a joint applicant-evaluator affiliation is one of the few available proxies for belonging to a clique, the proposed mechanism for preference is quite natural. In some cases the abuse may extend to willful actions intended to favor the members of an 'old boy' network, or through influencing the criteria set for the evaluation and manipulation of the composition of the reviewing bodies. At the extreme end of the abuse spectrum is the formation of mutual support pacts (including the forced sharing of the funds received in the manipulated evaluation process with the 'helpful' reviewers[2]).
- 1.21
- Despite the above discussion, some studies defend the objectivity of peer-review, for example Bornmann and Daniel (2007); Bornmann et al. (2010). Additionally, many scientists (whether acting as researchers, reviewers or administrators) have pointed out that peer-review of grant applications gives useful feedback, allowing the principal investigators to improve their research ideas and methodologies, potentially resulting in a successful re-submission. Taking into account that over 50% of proposals may be re-worked and re-submitted[3], this argument is valid. Unfortunately, the usefulness of the feedback communication process can be limited by the template structure of some review forms and suffers from terse comments because the primary goal of peer-review is selecting the best proposals, rather than improving the submissions.
The
agent-based model
- 2.1
- The model presented in the current work provides a mathematical framework to express a few intuitions regarding the effects of particular peer review characteristics on the process of funding research proposals. The description is simplified and focuses on only a few aspects, which seem to have a direct correspondence with mediocrity promotion and the appearance of cliques, as discussed in the previous section. As such, the model corresponds to the goal of illuminating the core dynamics, ignoring most factors in the long list compiled by Epstein (2008).
- 2.2
- In our model we try to describe a competitive funding program in which researchers submit proposals evaluated by a peer review process in which only a small fraction of proposals get funded. The role of the programme officers is limited to the possible detection of malpractice (discussed in section 4.2). The term 'researchers' encompasses individual scientists, focused research groups/labs or institutions. The model does not apply to 'big science' projects such as CERN, ITER or the Human Genome project, which are designed for larger common goals and are governed by different, more politicized, processes. We shall also not consider the politics of consortia formation, which is becoming more and more important in the current funding programs, especially in the European Union. This topic is certainly worthy of detailed studies (Breschi & Cusmano 2004; Scherngell & Lata 2013), to unveil the statistical traces of the cooperation network – and, possibly, showing the value of cooperation and the transfer of competencies.
- 2.3
- The present model is based on several simplifying
assumptions.
- We consider an open funding programme. There are no specific topics or conditions that limit access to the competition for grants.
- We assume that in each time step (which may correspond to a single year or a longer time) all active researchers submit just a single proposal[4].
- Both the participants (principal investigators) and the evaluators are drawn from the same pool of agents.
- The grants are all of equal size.
- There are no consortia, alliances or other ways of combining the submissions among the participants.
- 2.4
- To consider the role of the funding programs and peer review in the promoting or suppression of innovation we should first define this within the model. This is a rather elusive goal, as innovation value in the real world is hard to establish – especially in proposals, which have not yet led to any results. We started by assuming that each proposal P has a distinctive innovation value V(P), which reflects the capacities of the proposing agent P=PA. Moreover, we assume that the innovation potential of the agent does not change over time. While there are studies on the time dependence of research productivity (e.g. Fox 1983; Fronczak et al. 2007), innovativeness is much harder to measure. In some cases it might increase as a scientist gathers experience, in others decline, as routine and administrative tasks take more time. Thus, while the assumption of constant value of PA is without empirical foundation, it has the benefit of being simple, which is important for the conceptual basis of the model.
- 2.5
- We define innovation potential here relative to the current `body of knowledge' in a given discipline. While this state of the art would evolve over time, a static measure is nevertheless reasonable. To give an example: the development of the physics of semiconductors progressed from a basic recognition of band theory and the general role of impurities (truly innovative in the 1930s), through the understanding of p-n junctions, selective doping and material modifications, to engineering of low-dimensional structures, etc. As our knowledge expands, one can provide examples of research focused within the limits set out by the current `frontier' (e.g. studying an already known phenomenon or property in a new material or with increased accuracy) and the works that truly extended the frontier of knowledge. Our assumption of the constant innovation potential of a researcher is related to her or his capability to address such `frontier challenges' (relative to the current knowledge) as a personal capacity – which is, of course, a significant simplification, but allows the simulations to span timeframes for which the progress of the considered research discipline is significant.
- 2.6
- Setting the distribution of the innovation values of the
agents and proposals is equally difficult. Rather than using a normal
distribution (as done by Thurner and Hanel (2011)),
we opted for a form that shows a more pronounced fat tail behavior,
indicating a higher chance of truly innovative agents (following
reasoning similar to Haitun (1982)).
We have chosen the lognormal distribution of V(P),
again, without any empirical support other than the simplicity and
presence of the fat tail behavior, so that the probability density
function is:
(1) with μ=0 and σI=0.4 used in the simulations. The units of V are, of course, arbitrary, and the chosen parameters lead to a median value of the distribution equal to 1, and a substantial minority of proposals with high innovation values (see Fig. 2). For the purposes of this paper we arbitrarily define `innovators' as agents with a proposal value greater than 1.5. This choice corresponds roughly to the top 15% of researchers from the original distribution.
- 2.7
- As in real life, only a small fraction pF (30%)[5] of the proposals get funded. The successful agents simply keep their innovativeness and submit proposals in the next round.
- 2.8
- The behavior of the authors of the rejected proposals is more complex. We assumed that 60% of the proposals are resubmitted with the same innovativeness value; while the remaining 40% of unsuccessful agents drop out from research or abandon a particular research line, starting in a wholly new field (where their competencies and innovativeness may be different). The 'resigning' agents are replaced by new ones with an innovation value drawn from the original distribution (Eq. 1). The choice of a drop out ratio of 40% for unsuccessful proposals is based on the data from Wessely (1998), who quoted 43% for NIH and 48% for NSF programs.
- 2.9
- The simulations were run for a 'community' of NA agents increasing exponentially with time, with a growth of 2% per year. The latter figure is roughly in agreement with the data on real world exponential growth of research (deSollaPrice 1951, 1986; Tague et al. 1981; Larsen & von Ins 2010; Bornmann & Mutz 2014). As in the case of the replacements, all new agents have their innovativeness V(PA) drawn from the same lognormal distribution.
- 2.10
- The selection of proposals is done by groups of NE evaluators (we use NE=5), drawn randomly from a pool of experts R of size NX (for the starting value of NA=1000 we have assumed NX=150). The expert pool is assumed to be of constant size. In the event that an expert decides to leave research (due to a lack of success in obtaining funding for his/her own research), a replacement is found, selecting randomly from the winners of the previous round of funding. This choice reflects the policy of funding agencies to pick reviewers from among the successful researchers in specific fields[6]. The requirement that the new reviewer should be successful in the last round of funding is a simplification present in the current version of the simulations; alternative approaches could include choosing the reviewers from among the researchers successful in several past rounds or from those with the most grants. As in real life, experts in the model are excluded from evaluating their own proposals.
From the
ideal to the real world: suppression of innovativeness
- 3.1
- In the ideal world every evaluator E
would assign any proposal P a score S equal
to its innovation value
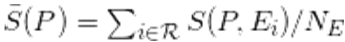
S(P, E) = SI(P, E) = V(P). (2) As the score does not depend on the reviewer's characteristics, the average score from a panel of NE experts is also equal to the value of the proposal. The funding is therefore distributed over the topmost pF proposals. It is obvious that such a scheme strongly supports innovation: not only are the most innovative agents assured of funding, but the process of replacing the resigning low-innovation agents would also eventually lead to an increase in the number of innovators. The overall distribution of innovativeness evolves into the characteristic shape shown in Figure 1a, marked by the presence of a characteristic triangular peak, shifting in time to higher innovation values. This shift continues indefinitely (with a decreasing rate), as long as the funding growth is preserved. The distribution of the age and accumulated value of grants among the researchers is shown in Figure 1c. The majority are single-year, unsuccessful researchers, who drop out of the system very quickly. Considering only those who have succeeded in obtaining funding, the accumulated grant amount falls roughly exponentially, with a pronounced peak at the right-hand end of the scale: researchers who have been successful every year in the studied range.
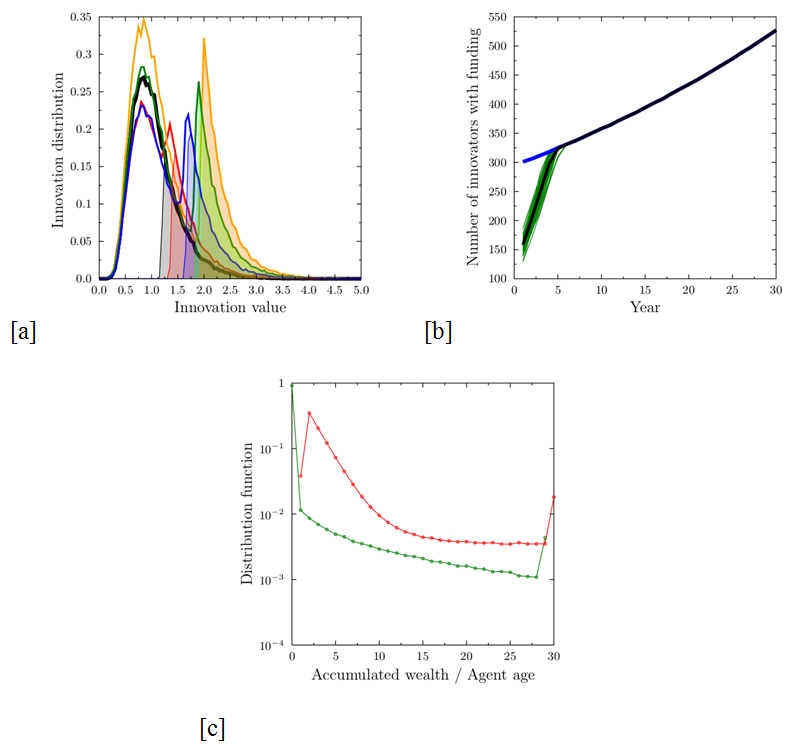
Figure 1. Results of simulations in the 'ideal world' case, where each proposal is evaluated exactly according to its value. (a) Distribution of innovativeness of all proposals (lines) after the first year (black) and after three (red), 10 (blue), 20 (green) and 30 (yellow) years of system functioning. Distribution is normalized to the number of proposals in the first year, growing in absolute value by 2% per year. The shaded areas show the range of funded proposals, shifting to increasing values of innovativeness; (b) the number of funded proposals: thick blue line – average total number, growing by 2% per year, thin green lines – single simulations of funded innovative proposals (defined as V(P)>1.5), thick black line – average of the number of funded innovators over 50 simulation runs. In this ideal world case, after a few years, only the innovative proposals receive funding. (c) Distribution of the agent ages (red line) and accumulated wealth (in grant units, green line) at the end of the 30-year-long simulation cycle on a semi-logarithmic scale. With the exception of the group of permanently successful researchers (from among the most innovative ones), who receive funding every year, and the huge number of those who fail to get even a single grant, the wealth distribution falls roughly exponentially. When one takes into account only those researchers who have got at least one grant, the Gini coefficient for the income is 0.48. - 3.2
- This ideal world case, in which, shortly after the funding
programme starts, only innovative proposals get funded (Figure 1b), is often given as an argument in
favor of competitive funding schemes. While the ideal world case
strongly promotes innovative proposals, the bulk of submissions are
drawn from the original lognormal distribution, which contains a large
number of low-quality submissions. In our opinion, this is unavoidable
– the key process is the selection of the proposals that should get the
funding. Unfortunately, in real life it is very hard to assure that the
evaluation and scoring mechanisms would accurately correspond to the
true values of the proposals. For one thing, in the simulations the two
groups – the successful innovators and the bulk of the mediocre
researchers – would not only be visible as two separate peaks in the
simulated proposal distribution (Figure 1a),
but they would also become separated socially[7].
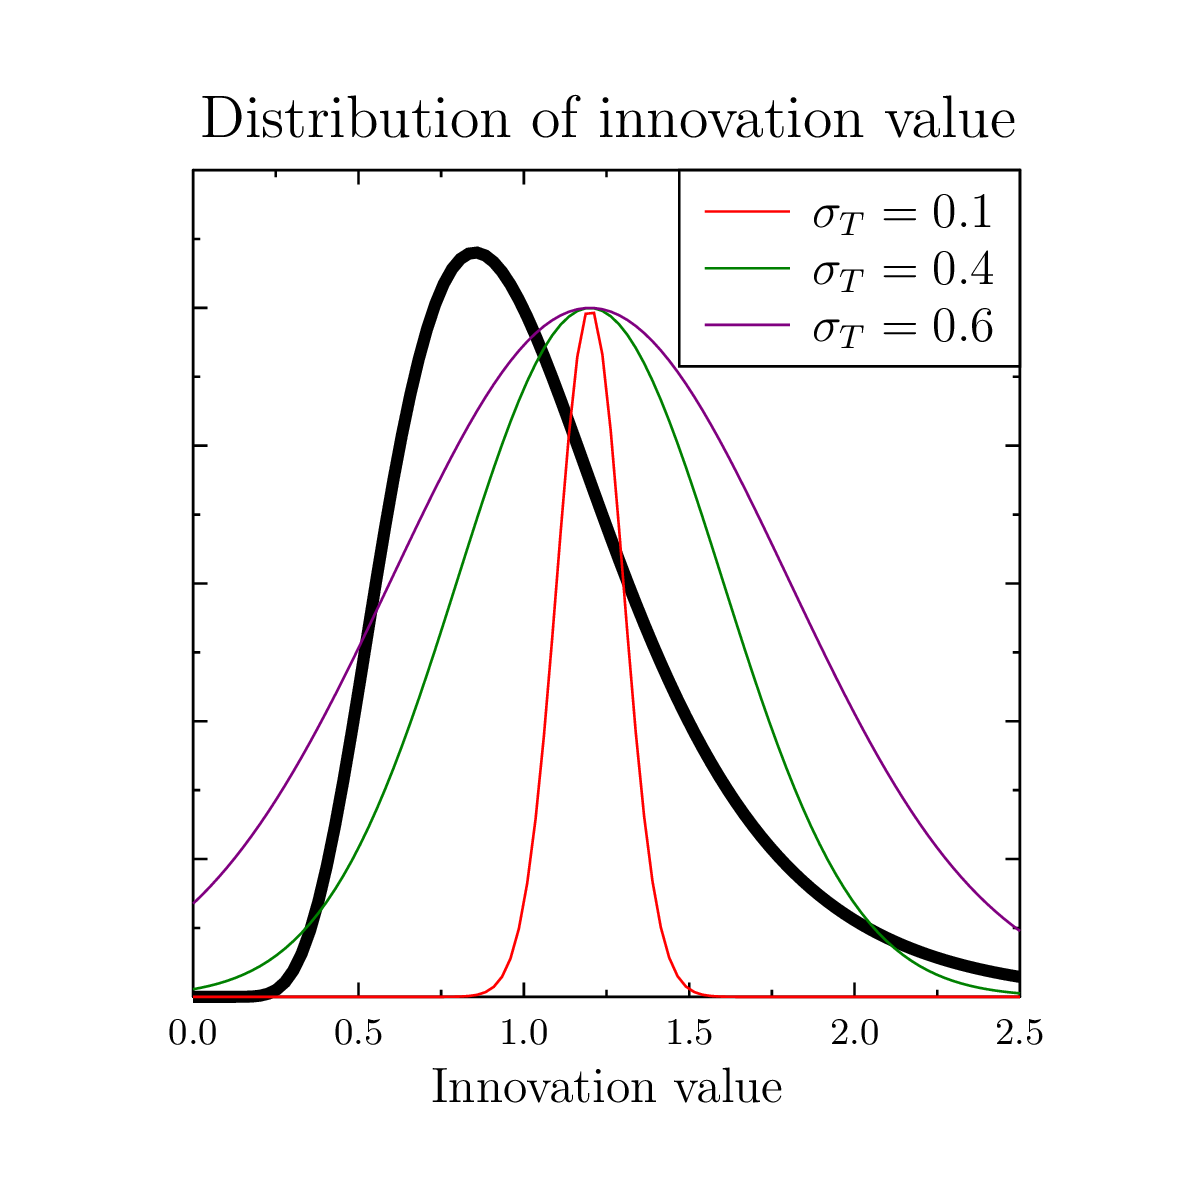
Figure 2. Black line – the assumed lognormal probability distribution function of innovation value; color lines show examples of tolerance filter for evaluator whose innovativeness is equal to 1.25 and tolerance σT is equal 0.1, 0.4 and 0.6. - 3.3
- One of the ways the system deviates from the ideal is
through limitations and preferences of the individual reviewers. In the
simplest model we do not consider any effects due to social links, or
institutional, gender or other biases. We focus on the limitations
resulting from the capacity to understand and correctly evaluate
innovative potential of a proposal that are due to the innovativeness
of the evaluator. We assume that each reviewer would assign to a
proposal a score equal to its innovation value modified by the
difference between his/her own innovativeness:
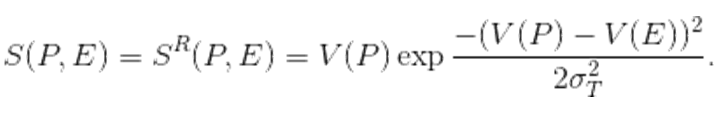
(3) The second factor acts thus as a tolerance filter for the evaluated proposals, centered around the reviewer's own innovativeness. Because different reviewers are characterized by different values of V(E), in the case of multiple evaluators, we have to calculate the average score
 . The value of σT
determines the behavior of the system. The lower it is, the less chance
the unusual proposals have.
. The value of σT
determines the behavior of the system. The lower it is, the less chance
the unusual proposals have. - 3.4
- The proposed scheme is, of course, simplistic. While
individual idiosyncrasies and preferences are undoubtedly present in
the process, they may extend to other aspects of the proposal scoring,
such as the evaluation of the capacity to execute, and the previous
track record. Yet these topics are much easier to structure and
formalize during the evaluation process, whereas the innovation
potential, inherently connected to the exploration of the unknown, is
the most prone to differences between reviewers. The proposed mechanism
reflects some of the remarks of the critics of peer-review in funding
quoted in Section 1. The use of the 'filter' may correspond to the
observations of low levels of agreement between reviewers when they
assess the same contribution (Rothwell
& Martyn 2000; Thorngate
et al. 2002; Ramulu et
al. 2005; Gupta et al. 2006;
Mayo et al. 2006; Neff & Olden 2006; Ragone et al. 2011).
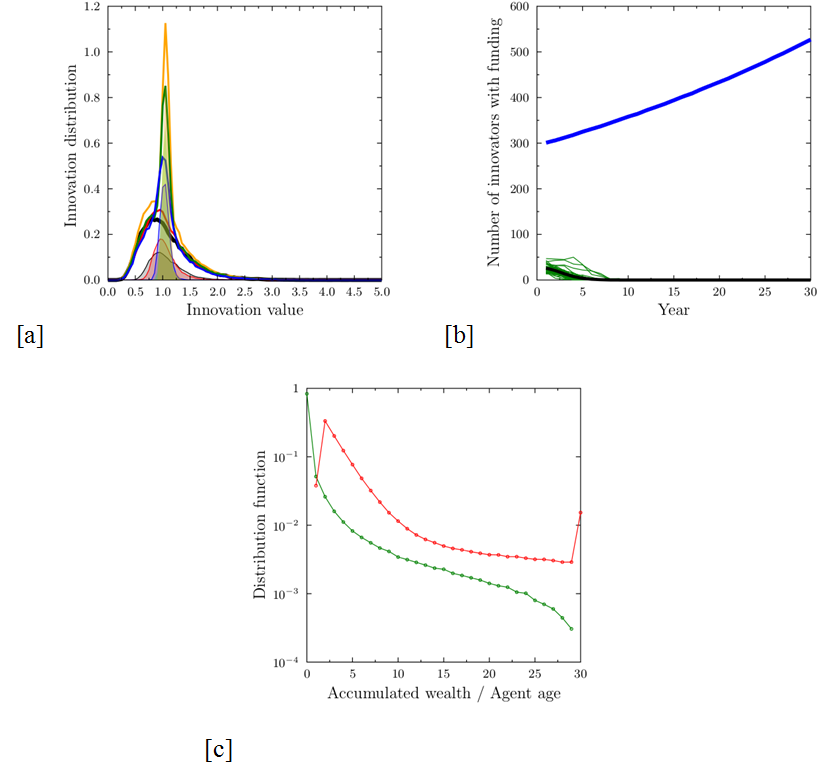
Figure 3. Results of simulations for reviewer tolerance σT=0.1 and five evaluators per proposal. (a) Distribution of innovativeness of all proposals and funded proposals (lines) after the first year (black) and after three (red), 10 (blue), 20 (green) and 30 (yellow) years of system functioning. Distribution is normalized to the number of proposals in the first year, thus there is growth in absolute value of 2% per year. The shaded areas show the range of funded proposals. Instead of a triangular peak shifting to higher and higher innovation value, we observe a narrowing peak representing funded proposals, centered around mediocre innovation value. The slight increase of the innovation value (shift of the peak to the right) is due to the asymmetry of the original lognormal distribution of innovative potential. (b) the number of funded proposals: thick blue line – average total number, growing by 2% per year, thin green lines – funded innovative proposals (V(P)>1.5) in single simulations, thick black line – average of the number of funded innovators over 50 simulation runs. Note that the ratio of innovative proposals receiving the funding drops to zero rather quickly. (c) Distribution of the agent ages (red line) and accumulated wealth (in grant units, green line) at the end of the 30-year-long simulation cycle, on the semi-logarithmic scale. As in the case of the ideal world model, the wealth distribution is roughly exponential. When one takes into account only those researchers who have got at least one grant, the Gini coefficient for the income is 0.61. - 3.5
- The 'real world' scenario, with small values of the
reviewer tolerance σT, leads
to results that are drastically different from the ideal case. Instead
of the increasing presence of innovators among the successful
proposals, the funding goes to mediocre proposals: in Figure 3a, for σT=0.1,
we observe a growth of a peak of funded proposals centered close to the
innovation value of 1. The peak shifts slightly to higher values as the
time passes, due to the asymmetry of the original innovation potential
distribution. More importantly, the number of successful innovative
proposals (defined as those with V(P)>1.5)
quickly drops to zero. The model recovers therefore the empirical
observations of 'promotion of mediocrity'. There is no peak in the
distribution of income (Figure 3c),
corresponding to the persistent winners, present in the ideal world
case.
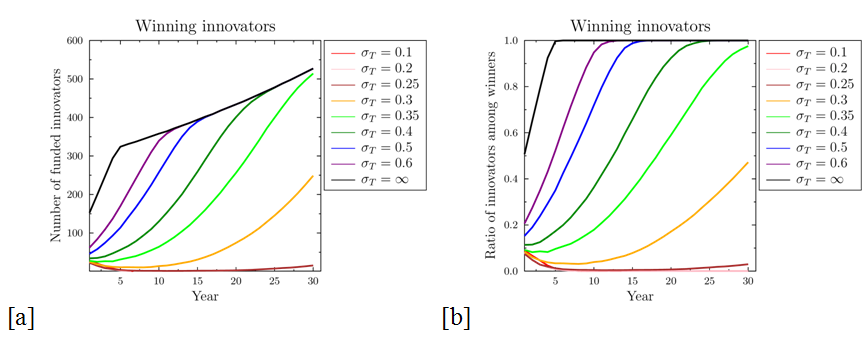
Figure 4. Comparisons between the numbers and relative success of innovators as functions of reviewer tolerance σT. (a) evolution of the number of funded innovative proposals as function of σT; (b) evolution of the ratio of innovative proposals among all funded ones. For σT>0.4 (when the width of the filter is comparable to the width of the innovativeness distribution, see Fig. 2) innovators eventually collect most of the funding. On the other hand, below σT=0.25 the system disfavors innovation and evolves into a mediocrity-favouring one, such as shown in Figure 3. - 3.6
- The dependence of the system behavior on σT is rather interesting. For small values, where the width of the tolerance filter is smaller than the distribution of innovation value (σ <0.25) the number of successful innovative proposals drops to zero. On the other hand, in the limit σT→∞, we recover the ideal world case. The transition between the two regimes is a continuous one, as can be seen from Figure 4.
- 3.7
- Our simulation stresses the importance of open mindedness in the evaluation process. The capacity to correctly recognize the potential value of a proposal is, however, very difficult to develop, and is much more difficult than evaluating past achievements and expertise. This suggests a special role for programme officers or 'super-experts', whose job would be to ensure that special attention is paid to proposals receiving very low scores (possibly due to the filtering mechanisms), or widely differing scores, so that they are re-evaluated with attention to innovation value and to detect possible conflicts of interest (Oleinik 2014). This would make it possible to search for and to 'select proposals with particular properties (risky, excellent, outside the mainstream)'[8].
- 3.8
- Another way to improve the situation would be to reserve part of the funding for the initial phases of a larger number of projects (even if chosen randomly). While such random strategy might seem absurd at first, it has been proven to be quite successful in areas where success depends on unknown factors and human reasoning might lead to systematic errors of judgment used in evaluation of individual capacities. This approach could answer the point raised by Lawrence (2007): the current system favors those scientists who spend a lot of effort on self-promotion ('the show-offs') and on achieving the right kind of evaluation factors (e.g. Hirsch index), while discriminating against the modest and meek and the newcomers. A staged funding of a larger number of projects and monitoring their results and progress might be beneficial. Agent-based simulations in business and political environments show that in certain environments the random promotion strategy might be quite beneficial (Pluchino et al. 2009, 2011a, 2011b; Sobkowicz 2010). The strategy would decrease the role of many types of bias and could be combined with the approach proposed by Leijten et al. (2010), focusing on good content-related monitoring and evaluation, and the possibility to stop or to extend projects on the basis of how they perform and develop. This would allow a shift from the evaluation of promises to the evaluation of results. On the other hand, the random strategy would most likely be judged socially unacceptable, especially in the context of using public funds.
Clique
evolution
- 4.1
- We shall turn now to the effects of the presence of 'old boy' networks in the community competing for the grants. The task is, if possible, even more elusive, due to the hidden nature of the cliques and the number of social and psychological circumstances that may influence their formation and success or lack thereof. The simplifications we propose are focused on the role of clique membership on the peer-review process, with an assumption that the manipulation of the system should be minimal to avoid possible detection and its consequences. We would not consider, therefore, programs written 'for' a specific research group where the whole competition is fictitious. Such practices, while quite feasible in real life, are extremely difficult to model due to their dependence on specific social circumstances. Our goal is to look for effects of rather subtle manipulation of the scoring process within standard, openly accessible funding programs.
- 4.2
- First we need to describe the way the clique influences the outcomes of the competition. We focus on a very simple approach, in which the reviewers belonging to the clique manipulate the evaluation scores received by the submitted proposals, favoring proposals submitted by other clique members. This kind of malpractice has several characteristics. First, the clique should consist mostly from the agents in the evaluator pool R, as these have the possibility of influencing the results. While it is possible that some members of the coterie would not belong to the pool (due to specific social links, owed favors or other reasons), in our simulations we have assumed that all the clique members are in the potential reviewer class. Second, the preferential treatment is difficult to uncover: it is very easy to hide the true intentions behind a smoke screen of descriptions of the excellence of proposed research, its innovativeness or experience of the submitting team or criticisms of non-clique proposals. As we have noted, in the few cases where such information could be analyzed, there are statistically significant differences in the scores due to links between the reviewers and authors of proposals.
- 4.3
- Within the model we consider two cases of clique behavior:
- 'Fair' or 'safe playing': the clique evaluators EC give clique proposals PC their true value as the score, so that S(PC, EC) = V(PC). All other proposals are evaluated with the previously discussed filter (Eq. 3), making their score smaller than the true value. This might correspond to the following reasoning: 'I am no expert on my colleague research topic, but since I know him/her, I am going to accept the proposal promises at face value'. For those other proposals no such trust is applied.
- 'Preferential scenario' – clique reviewers provide fair evaluation of clique-based proposals and, in addition, increase it by some `bonus' value, so that for the clique proposal score evaluated by a clique reviewer: S(PC, EC) = V(PC) + Δ, where Δ is an adjustable simulation parameter. The preferential scenario is a simple implementation of the findings of Marsh et al. (2008), who found out that the single major source of systematic bias in the evaluation of grants of the Australian Research Council was the inflated, unreliable, and invalid ratings given by assessors nominated by the applicants themselves – an overt version of in-clique support. The same phenomenon has been documented by Schroter et al. (2006) and Donovan et al. (2014) for paper submissions.
Clique size evolution
- 4.4
- The above description of ways that a clique may support its members is quite straightforward. Much more difficult are the processes leading to changes of the clique size NC(t). Starting a clique, excluding existing or inviting new members depends on so many specific circumstances (e.g., social networks, individual relationships, permissiveness of the society, possibility of penalization) that any agent-based model would necessarily be considered only a crude approximation.
- 4.5
- With this sobering thought in mind, we propose a combination of mechanisms that allow at least some interpretation in social or psychological terms, as some guesses for the associated model parameters.
- 4.6
- Let us consider first the ways in which an agent may leave the clique. The first occurs naturally when an unsuccessful agent leaves research. For the non-clique agents we have assumed this happens 40% of the time, as in section 3. On the other hand, the clique members should have much higher expectations of possible future success thanks to support from the other clique members. Thus we have assumed that the probability of 'leaving the game' for a clique member who did not receive funding is four times smaller, namely 10%. The second mechanism is when an unsuccessful clique member remains active, but decides to leave the clique. This is assumed to happen in the (100%−10%)·5%=4.5% cases of unsuccessful proposals. Unfortunately, these estimates have no empirical support and were chosen on the basis of personal feeling of plausibility.
- 4.7
- So far the mechanisms were 'natural', in the sense of individual decisions of those clique members who could not support themselves due to lack of funding. We have to consider also the methods by which the growth and influence of the clique may be controlled by society. In many situations such regulating mechanisms are provided by increasing costs of a growing sub-community, leading eventually to a stable equilibrium size. In our opinion, it is not the case here. The costs of forming and keeping the 'old boy network' (including monitoring and controlling the actions of the clique members), are negligible in comparison to the size of grants provided by the funding agencies. In the scenario considered, the day-to-day costs are limited to keeping the communication within the clique, ensuring that the members are placed correctly in the funding program process and – for certain kinds of operational mode – sharing of the `profits' with other clique members.
- 4.8
- The growth-controlling mechanism must, therefore, have external origins. A simple example is provided by punitive measures imposed when manipulation of the competition rules is detected. Let us assume that such detection happens with probability pD at each evaluation where a preference is present. Upon detection, all clique agents immediately involved in the event (the proposal author and the clique reviewers) are expelled from the community. Moreover, any other member of the clique may be exposed during the subsequent investigation, due to confessions of the culprits. This probability is denoted by pE. All expelled agents are replaced by new ones not belonging to the clique. The value of pD is one of the crucial parameters of the model, corresponding to the vigilance of the community against the abuse. The values are between zero and 0.01, where the latter case corresponds to an average time between discoveries of the malpractice on the order of ten years, depending on the size of the clique. In our simulations pE was set at much higher value of 0.20 – in real life it may well depend on the 'solidarity' of the community or the diligence of the investigators.
- 4.9
- While leaving the clique voluntarily may be considered to
be an individual process, we assume that clique growth is related to
group decisions. 'Invitations' are 'sent out' when the group considers
that expanding the network would benefit the existing members. Such a
situation is possible, for example, when growth in the previous years
was accompanied by increasing benefits (defined as the average grant
winning ratio within the clique, xC(t)).
In our model we used a simple proportionality between the growth rate
and improvements inthe winning ratio
ΔNC(t) = Int(G ΔxC NC(t)), (4) Where ΔxC=xC(t)−xC(t−1) and the proportionality factor G determines the speed at which the clique grows in reaction to positive ΔxC. In most simulations we have used G equal to 2 or 3. As we noted previously, the new clique members are recruited from the review panel members (otherwise they would be useless to the existing clique, free-riders who benefit from the preferential treatment, but are not able to help others). This imposes a hard upper limit on the clique size: the number of reviewers in the system. We note that in situations where all (or almost all) evaluators get recruited to the clique, the detection of malpractices might become quite easy: it would be very suspicious if most of the panel members would get their proposals `approved.
- 4.10
- On the other hand, in reality, the condition of clique members who must belong to the reviewer pool R might not be true. For example one can imagine situations where proposal authors are admitted to the clique on the condition of sharing the financial benefits with the 'older' clique members. Or situations where, due to rotation of the reviewers in the pool, it is advisable to have a broader base for the coterie. Our present simulations do not include such possibilities, focusing on direct mechanism of manipulating the scores by the evaluators.
- 4.11
- Figure 5 presents
results of simulations of clique growth when there are no penalties in
the system. Clique growth depends crucially on the parameter G:
for G≤1 the erosion of the cliques due to dropping
out of the unlucky members who did not receive funding leads to
eventual decrease of the clique size. For G=2 the
size of the clique is either stable (for the 'fair' clique, Δ=0, fig. 5a) or grows slowly (Fig. 5c). For G=3 the
growth is much faster and there are simulations in which the old boy
network extends to almost all reviewers (Fig. 5b,d).
For G≥4 the cliques grow very quickly in almost all
cases.
Figure 5. Evolution of the size of the clique when there are no penalties in the system. Specific panels correspond to: (a) Δ=0, G=2 (fair clique, slow growth); (b) Δ=0, G=3 (fair clique, fast growth); (c) Δ=1, G=2 (strongly preferential clique, slow growth); (d) Δ=1, G=3 (strongly preferential clique, fast growth). The growth rate of the clique may be governed by the coefficient G, determining the reactions to improved results or by the additional bonus given to clique-based proposals Δ. Red lines – results of single simulations, black lines – averages of 50 runs. Starting clique size NC(0)=20 members, tolerance σT=0.1. The inset in panel (a) shows a typical example of the time evolution of funded innovative projects: within the model, the formation of the clique has very little influence on the innovation, which resembles closely that of Figure 3. - 4.12
- We note that the system behavior depends only slightly on
the initial size of the clique NC(0),
provided that the starting clique may be considered small (less than
1/4 of the size of the reviewer pool) but not too small (cliques of
size smaller than 5, for our choice of other parameters, have little
chances of survival, because the chances of finding a 'friendly' panel
are too small). For very large cliques (above 1/2 of the reviewer pool)
the clique may dominate the selection process entirely and quickly grow
to encompass almost all evaluators. As we noted, such behavior could
raise all kinds of suspicion and for this reason might be considered
unrealistic. Still, in a study of the biomedical research funding
agency in the Netherlands, Van den Besselaar (2012)
has provided data showing that the evaluation committee members are
more successful in grant applications than other researchers, an
observation not explained by performance differences. In the case of
the Medical Research Council of Canada, Poulin and Gordon (2001) have estimated that 'nearly
100 percent of the peer review committee members received grants from
other members of these committees on which they serve, albeit at
different times' – an extreme case of clique-like behaviour.
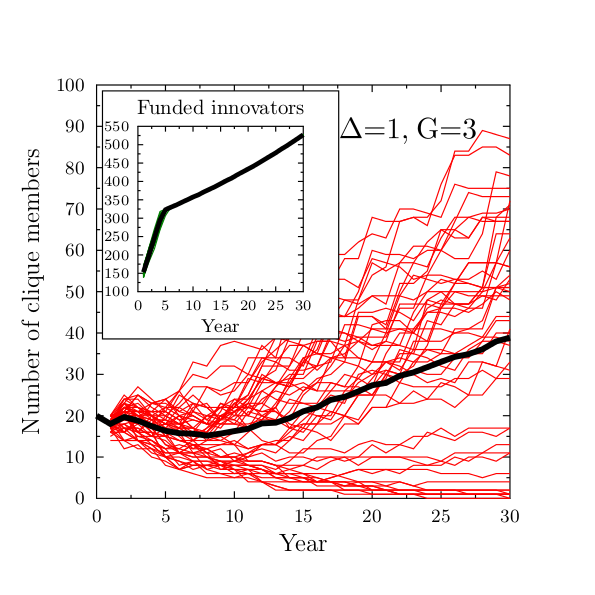
Figure 6. Evolution of the size of the clique in the ideal world case, when there are no penalties in the system with fast growth and strongly preferential clique (Δ=1, G=3). The inset panel shows the evolution of funded innovative projects: here again the formation of the clique has very little influence on the funding of innovation, which is similar to that of Figure 1. - 4.13
- The presence of the cliques has a negligible effect on the promotion or suppression of innovation. Figure 5 presented results for the case of a relatively small tolerance &963;T=0.1, and, as in the case without the clique, the number of successful innovative proposals quickly drops to zero. In the ideal world case (&963;T=∞) the clique can gain advantage only in the preferential scenario, when the additional bonus is present (because all proposals are evaluated via their intrinsic value). Figure 6 presents the clique size evolution for Δ=1 and G=3. The growth of the clique is much slower, but still present, and innovative proposals dominate.
- 4.14
- The existence of the clique has very little impact on the
promotion or suppression of innovations if the clique is formed by a
selection of agents with a random distribution of innovativeness. This
is documented by the insets in Figures 5b
and 6, which show the evolution
of the number of funded innovative proposals in the presence of a
clique (for σT=0
and σT=∞,
respectively). Practically, the only difference is the presence of a
small number of innovative proposals getting funding in the low
tolerance scenario, which were absent when there was no clique in the
system. These are simply clique proposals that are innovative, but
which get funding not because of their value, but because their authors
are connected within the supporting network. On the other hand, one can
imagine a situation when clique members, assured of the higher
probability of funding would drop their level of effort (and
subsequently their innovativeness) – then the clique presence would
lead to even further decrease of the system performance. Another such
situation would be a clique formed by agents with low innovation
capacity, using large enough values of Δ to ensure a preferred status,
which would naturally lead to a decrease in innovation capacity of the
funded projects. Such scenarios, although plausible, are not included
in our simulations.
Penalizing cliques
- 4.15
- The detection of clique manipulation and the subsequent
expulsions of clique members significantly changes the evolution of
clique sizes. The expulsions may cause significant decreases in clique
sizes, which then cause losses in the clique success ratio, because
there are fewer occasions for manipulation. This incurs further loss of
clique members due to loss of funding. Increasing the probability of
detection pD may freeze the
growth of the clique or even lead to its disappearance. Figures 7 and 8
show the evolution of clique size in conditions corresponding to those
in Figure 5, but with detection probabilities of pD=0.03
and pD=0.10, respectively.
In the latter case, the higher probability of detection leads to a
strong decrease in success clique. The red lines, representing
individual simulation runs, show significant variations of clique
sizes, depending on the history of successful grant applications and
the related growth opposed by the clique detection events separated by
the periods without such detection. At the same time the averages over
200 separate simulations, shown as black lines, present rather smooth
behavior. Above a certain probability detection threshold (in the case
of the initial size of the clique of 20 agents this threshold is about pD=0.01),
after an initial 2-year period, the average size of the clique decays
smoothly, with the rate of the decrease described by a power function At-p
, where the power exponent p increases with
increasing pD. The best fits
of the power function formula are shown as green lines in figures 7 and 8.
Figure 9a shows the dependence
of p on pD
for the cases of the fast growing cliques (G=3),
both fair Δ=0 and preferential Δ=1. There is no sudden transition,
indicating the optimal value of the detection rate pD,
rather a smooth increase of the value of p.
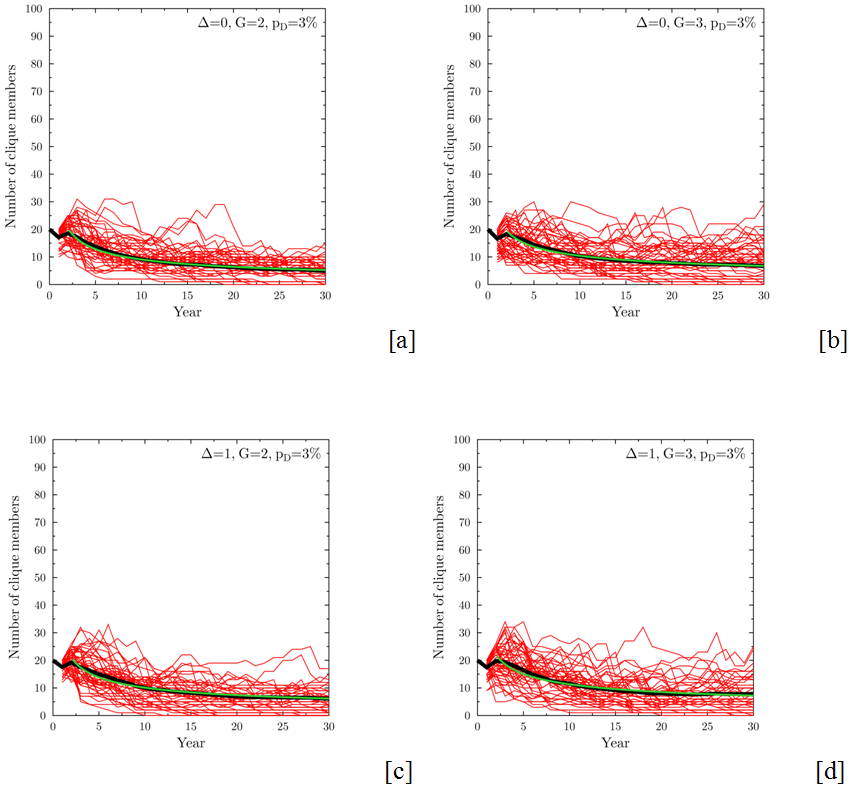
Figure 7. Evolution of the size of the clique for the detection probability pD=3%. Specific panels correspond to: (a) Δ=0, G=2 (fair clique, slow growth); (b) Δ=0, G=3 (fair clique, fast growth); (c) Δ=1, G=2 (strongly preferential clique, slow growth); (d) Δ=1, G=3 (strongly preferential clique, fast growth). A relatively low probability of clique detection leads to a change from clique growth to a stable size (except in the least advantageous conditions, panel a, where the average size of the clique decreases due to detection). Red lines – examples of results of single simulations, black lines – averages of 200 runs. Starting clique size NC(0)=20 members, tolerance σT=0.1. Green lines are the best fit of a power law function At-p, to the average of the clique sizes after year 2, where t denotes time and A and p are fitting parameters. 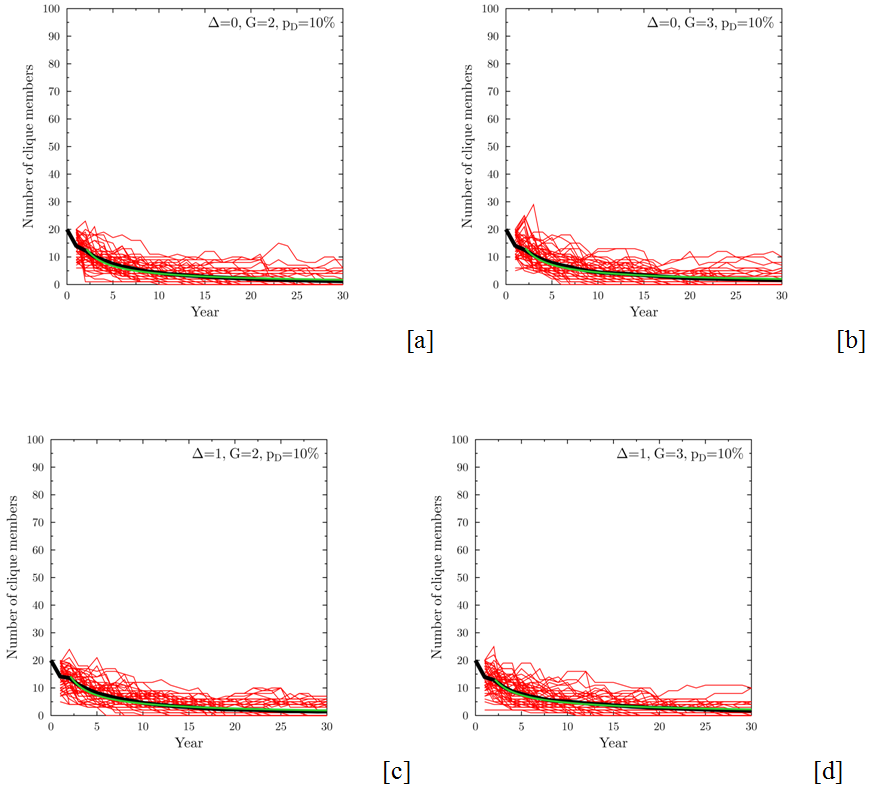
Figure 8. Evolution of the size of the clique for the detection probability pD=10%. Specific panels correspond to: (a) Δ=0, G=2 (fair clique, slow growth); (b) Δ=0, G=3 (fair clique, fast growth); (c) Δ=1, G=2 (strongly preferential clique, slow growth); (d) Δ=1, G=3 (strongly preferential clique, fast growth). The increased detection rate leads to quick decrease of the role that a clique can play, even in the most advantageous condition (panel d). Red lines – results of single simulations, black lines – averages of 200 runs. Starting clique size NC(0)=20 members, tolerance σT=0.1. Green lines are the best fit of a power law function At-p, to the average of the clique sizes after year 2, where t denotes time and A and p are fitting parameters. - 4.16
- Another way of looking at the effectiveness of the clique
detection and elimination process is to count the number of individual
simulations that end with a clique size of at most one, for example at
the end of the simulated period of thirty years. The ratio of such
simulations among the total number of 200 runs is shown in Figure 9b. As in the case of the power
exponent, the increase of the number of clique-free systems is a smooth
function of pD, only weakly
dependent on the type of the clique (G=3, Δ=0 or 1).
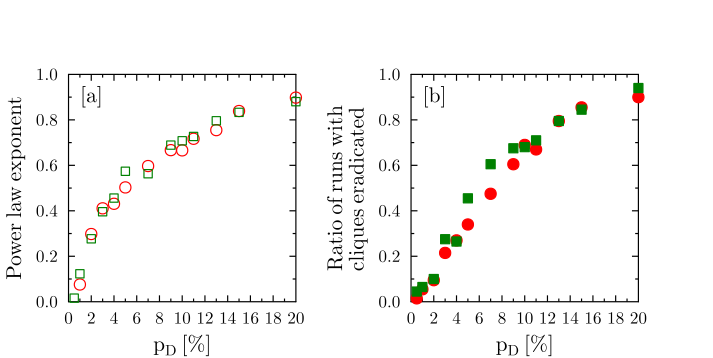
Figure 9. Dependence of the effectiveness of the clique suppression on the detection probability pD. Panel a: power law exponent p, determining the rate of decrease of the average clique size with time. Panel b: ratio of the simulation runs, for which, after 30 years the clique size is at most equal to one (calculated for 200 independent runs). Green symbols correspond to Δ=0, G=3 (fair clique, fast growth), while red symbols are for Δ=1, G=3 (strongly preferential clique, fast growth). While the individual simulation runs may differ considerably (as shown in Figures 7 and 8), the two measures of the effectiveness of the clique suppression show similar behavior, bringing visible effects when pD exceeds 6%. Conclusions
- 4.17
- The goal of our model was to build a simple agent-based
system, described by a few intuitive parameters, which would show some
similarity with the observations of suppression of innovativeness and
promotion of mediocrity and the existence of old boy networks
manipulating the system. There is no attempt to compare quantitatively
the results of the simulations with observed data – mainly due to the
lack of such data. On the other hand, there are a few observations
resulting from the model, which might be useful in analyzing the
competitive funding programs and planning their improvements.
- Within our model, innovation is suppressed due to a lack of understanding and a low tolerance for proposals that differ from the reviewer's own characteristics. Unless the reviewers are very open-minded, the scoring process may indeed favor regression towards mediocrity.
- Even a relatively weak preference within a clique of reviewers for the proposals originated by clique members may lead to disproportionate advantages in the selection process. Averaging over a group of evaluators is no defense: even a single 'friend' or 'enemy' may influence the result, by biasing the scores. Moreover, the reliance on 'objective' numerical scores (present in many funding schemes) may simply serve as a convenient way to hide such manipulative malpractices.
- The two processes: the promotion of mediocrity and the existence of cliques only weakly influence each other. Separate corrective mechanisms are needed in both cases. We shall discuss these suggestions in the last section.
- 4.18
- The effects of using a broad range of evaluation criteria in high-risk/high-gain funding projects (such as the ones funded by ERC) have been analyzed in depth (Leijten et al. 2010). Many funding schemes use a wide range of quality and eligibility criteria, complementing scientific quality (which in our language may be compared to innovation) with the quality of the research team or research consortium; the potential impact of the project and the quality of the project implementation plan. Yet despite the broad range of sources checked, Leijten et al. state that the evidence about the actual performance of the programmes [devoted to high-risk/high-gain research] in comparison with "regular" funding schemes is scarce.
- 4.19
- With respect to the existence and evolution of old-boy networks, we note here that our attention was focused on the intentional creation of cliques, with the aim of abusing the system, rather than on a spontaneous appearance of fashionable research domains, which receive disproportionally higher funding rates (McVittie 1964; von Krzywoblocki 1965; Rip 2000; Green 2002; Starbuck 2009; Abrahamson 2009). The latter phenomenon is not only very important from a practical point of view (how to distinguish truly valuable, high impact research directions from temporary fads), but also from a theoretical perspective: the appearance of such fads and fashions is an example of interesting self-organization within the research community. When such popular subjects offer higher chances of funding, they act as magnets to potential participants, many of whom use 'proper' keywords in proposals without real connections to the topic. In many cases, mediocre proposals, 'decorated' with the current buzzword, can use the popularity of the research direction to increase their chances. Additionally, the popularity of some research topics or directions, assuming a limited amount of available funding, must decrease the chances of funding truly breakthrough research in less popular disciplines. Park et al. (2013) have presented a model of peer review in the publication process, focused on the herding phenomenon. The model stresses that reliance on individual knowledge and subjectivity in reviewer decisions may be beneficial to the quality of published results, avoiding publication of unreliable but fashionable works. The analysis of Park et al. provides a model that is complementary to ours: it points out the value of independent (subjective) evaluation compared to 'objective' reviews, for which the criteria are derived from the observed behavior of other scientists – a self-reinforcing effect which, in some cases, might lead to a wrong direction. In our opinion, herding and mediocrity promotion are two parallel processes in which deficiencies in the peer review quality may negatively influence the quality of research.
- 4.20
- Emerging phenomena, such as the appearance of research fads, are certainly very important. The current work focuses on the simpler aspects: direct effects of the lack of acceptance of truly novel ideas leading to mediocrity promotion and the intentional abuse of the peer-review system by certain groups of researchers. We plan to extend the analyses in the future by including the fashions and unintentional appearance of unequal distribution of grants in a separate work. In the latter case, the ABM approach could be better compared with the real world, for example based on the statistical analyses of the occurrence of certain keywords and other tell-tale signs in winning/losing proposals, which could be possible with the right choice of the research domain, as proven by Liu and Fang (2012).
- 4.21
- Another interesting avenue for further research is the
analysis of funding programs requiring multi-institutional (even
multi-national) cooperation and the possible ways that formation of
consortia may influence the way proposals are evaluated and the
landscape of winners and losers. The latter case might become fertile
ground for research, as the European Council framework programs might
provide rich data on institutions and investigators involved in
successful and unsuccessful proposals.
Suggestions for improving the research funding process
- 4.22
- Based on the results of our model, what methods of fighting the unfairness brought by the clique formation can we suggest? One of the ways would be to penalize participation in a clique, especially when its actions have an openly negative effect of disturbing the fairness of the process. This would amount to an additional (potential) cost for the clique members, and might inhibit its formation. However, as we have mentioned above, it is very difficult to prove that a specific scoring decision or recommendation is pre-arranged rather than coming from the best intentions and knowledge of the evaluator. With respect to fighting clique formation, the best solution seems to be the full visibility of the multiple connections between evaluators and submitters. What makes such an approach impossible today is that the identities of the evaluators remain hidden from view, as most of the programs keep these confidential; and the scores given by particular members to the evaluated proposals.
- 4.23
- As can be learned from the fight against organized crime, once the benefits surpass the perceived costs due to possible penalties the abuse of the system is very likely. The additional factor is that the individual transgressions (such as increasing or decreasing someone's score) may be very slight, more like tweaking than breaking the rules, so that the self-perception of wrongfulness is small. Once the size of the clique becomes large enough, it would be very difficult not only to discover it but also to fight the abuse, because it might become a part of the established culture of the community, or even reach the status of an official institution. Here, the crucial element is the capacity for an early detection of the abuse, rather than stiff penalties.
- 4.24
- Fortunately, there is a huge difference between organized crime and the research community: the possibility for openness of communication and access to information about the decision process. The research teams, the proposals and the received evaluation scores are publicly available, in most cases. What is missing is information about the evaluators. But even the partial available information allows in-depth analyses.
- 4.25
- Ragone et al. (2011) have analyzed the fate of conference submissions (where the review boards are small and known), and have shown some adverse effects, so in principle this approach may be expected to improve the situation. There are already a few other works on social networks linking the applicants and grantees (Kardes et al. 2013; Beaudry & Clerk-Lamalice 2010). An interesting study by Breschi and Cusmano (2004) has not only discovered a small core of major participants, who are the frequent prime contractors, but also a group of low-profile participants, who enter the projects as partners and take advantage of linking with several leading actors. Using the methodology typical for multi-level, coupled networks this study could be extended to include the committee members and their social network, even without losing the anonymity of the review. Multi-level networks have already been used in the analyses of innovation, separating the scientists and inventors (Breschi & Catalini 2010). In terms of advice for the future funding programs, multi-network analysis and agent-based models could provide novel ideas on the monitoring and improvement of the system efficiency and detection of possible abuses. It would be especially effective if the tools were available to the funding agencies, which do have the information regarding the identities of the reviewers, programme officers, panel members etc. Using social analysis as a standard systemic solution that would map the structure of relationships between the researchers and evaluators could prevent a lot of 'preferred' evaluations.
- 4.26
- We have to remember, however, that social network analysis would uncover not only the intentional abuse of the system, but also the links due to a variety of 'natural' causes, such as the researchers' personal histories of cooperation or common scientific interests. A lot of caution is therefore necessary. On the other hand, the full disclosure approach would have the advantage of the psychological mechanisms of knowing that the process is under open scrutiny. Such calls for an improvement of the peer review by making it a fully open process have already been voiced (Goldsworthy 2009; Wenneras & Wold 1997). The ability to analyse the evaluation process in its multifaceted aspects could also provide a way out of the standard dilemma in which the evaluators too close to the proposal pose a risk of jealousy or theft of ideas, while the reviewers too far from the topic may not understand the importance. Openness of the process, perhaps augmented at the final interview stage by inviting international evaluators, would serve as a signal to the local communities, especially in countries that are the most vulnerable to the abuse described in this work.
- 4.27
- We have already noted a special role that the oversight by programme officers may play in the promotion of risky, truly innovative projects. The same may be said about fighting clique formation: the officers form the first line of defense against informal influences and old boy networks. However, this also makes them the first 'targets' for the cliques: ensuring the good will of the programme officer is the best tactic.
- 4.28
- With respect to the promotion of innovations, an important improvement would be to look not only for the average scores received by grant applications, but to pay special attention to those proposals that show the greatest divergence between the scores given by individual reviewers. Such large differences or very low scores (even in the current, wholly anonymous peer-review scheme) might indicate controversial nature of the proposal, which, in turn, might be due to innovative nature (among other reasons, of course). But double checking of the controversial and the lowest-scoring proposals might be worth the effort.
- 4.29
- To check the possible results of special attention paid to
controversial proposals we have modified the simulations, including a
re-evaluation of projects that received the average score
 smaller than 0.001, and those where a difference between individual
evaluations greater than 0.5, with the goal of identifying the
proposals of outstanding innovativeness that were not recognized due to
low reviewer tolerance. In these simulations, all proposals with very
low scores were evaluated again by a 'special' panel, chosen randomly
from the pool but with tolerances 5 or 10 times higher than the
original ones. If the score given by the 'special' reviewer team is
greater than the average score in the previous round of funding, the
new score is used in the ranking of the proposal. Figure 9 presents the results of such
simulations, for conditions corresponding to the ones in Figure 3, but including the corrective
measures. Here the number of successful innovative proposals does not
drop to zero, but increases – almost to the level in the ideal world
case (Figure 1). This indicates
that the effort of re-checking proposals with the explicit goal of
looking for the ones that might be misunderstood in the normal process
might be truly beneficial.
smaller than 0.001, and those where a difference between individual
evaluations greater than 0.5, with the goal of identifying the
proposals of outstanding innovativeness that were not recognized due to
low reviewer tolerance. In these simulations, all proposals with very
low scores were evaluated again by a 'special' panel, chosen randomly
from the pool but with tolerances 5 or 10 times higher than the
original ones. If the score given by the 'special' reviewer team is
greater than the average score in the previous round of funding, the
new score is used in the ranking of the proposal. Figure 9 presents the results of such
simulations, for conditions corresponding to the ones in Figure 3, but including the corrective
measures. Here the number of successful innovative proposals does not
drop to zero, but increases – almost to the level in the ideal world
case (Figure 1). This indicates
that the effort of re-checking proposals with the explicit goal of
looking for the ones that might be misunderstood in the normal process
might be truly beneficial.
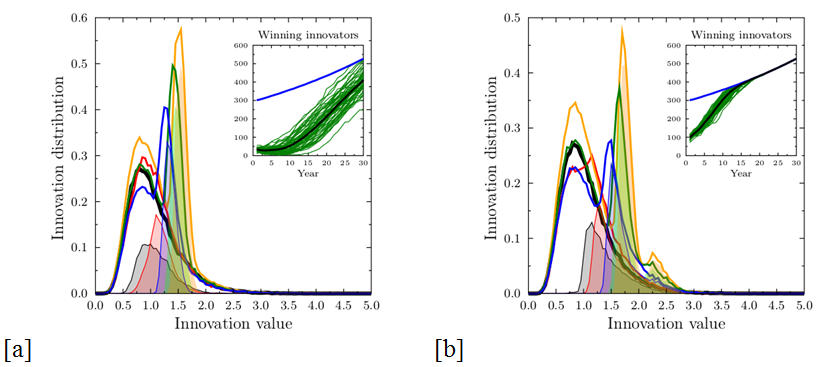
Figure 10. Results taking into account the re-evaluation of proposals that received very low scores (those with  ) and proposals for which the score given by
individual reviewers differed by more than 0.5, by a 'special' expert
panel with much higher tolerances than the original σT=0.1
(panel a: σ'T=0.5, panel b: σ'T=1.0)
. Distribution of innovativeness of all proposals and funded
proposals(lines) after the first year (black) and after three (red), 10
(blue), 20 (green) and 30 (yellow) years of system functioning, for the
reviewer tolerance σT=0.1,
corresponding to Figure 3. The
distribution is normalized to the number of proposals in the first
year; thus there is growth in absolute value of 2% per year. The shaded
areas show the range of funded proposals. This re-evaluation
drastically increases the chances of the innovative proposals to
receive funding. The insets show the numbers of successful innovative
proposals as function of time. All other parameters as in Figure 3.
) and proposals for which the score given by
individual reviewers differed by more than 0.5, by a 'special' expert
panel with much higher tolerances than the original σT=0.1
(panel a: σ'T=0.5, panel b: σ'T=1.0)
. Distribution of innovativeness of all proposals and funded
proposals(lines) after the first year (black) and after three (red), 10
(blue), 20 (green) and 30 (yellow) years of system functioning, for the
reviewer tolerance σT=0.1,
corresponding to Figure 3. The
distribution is normalized to the number of proposals in the first
year; thus there is growth in absolute value of 2% per year. The shaded
areas show the range of funded proposals. This re-evaluation
drastically increases the chances of the innovative proposals to
receive funding. The insets show the numbers of successful innovative
proposals as function of time. All other parameters as in Figure 3.
- 4.30
- Langfeldt and Kyvik (2011) have proposed some two possible directions for improvement: using the evaluators in defining a research agenda (not just ranking of proposals), and the introduction of open peer review and self-selection of the reviewers (which would prevent gatekeeper roles held by small selected groups). The latter idea is quite important in breaking the effects of cliques and old boy networks. One should note, however, that while open peer review is well suited to reviews of publications (where it may provide in-depth analysis and even post-publication quality control) it may not be practical in reviewing research proposals. This is true especially where innovative projects are concerned: full disclosure needed for the open peer review would compromise the priority and put researchers at risk of having their ideas 'stolen'. Therefore, in our opinion, the openness should focus on the social network of submitting researchers, evaluators, institutions involved and past projects conducted and publications. Coupled with careful analysis of the scores given to proposals this could provide programme boards/officers with effective tools to complement the peer review and to recognize possible manipulations of the system. The programme officers are already well positioned in the system, with a lot of information (such as the identities of the reviewers) at their disposal, and the development of the right tools would make the management of funding more effective. The social network analysis tools could also be connected with the use of bibliometric ones.
- 4.31
- With respect to the latter issue, Langfeldt and Kyvik (2011) pointed out a possible inherent weakness of reliance on quantitative indices in evaluating research. While bibliometric performance indicators might seem to provide impartiality and objectivity, 'they may also be seen as aggregated outcome of previous peer reviews' (as is the case of publications, previously obtained grants, etc.). For this reason, bibliometric measures are not an independent source of information. Moreover, Cabezas-Clavijo et al. (2013) have noted that the correlation between reviewer scores and bibliometric data is highly dependent on the discipline. Special attention should then be paid to the choice of the mixture of such 'objective' evaluation schemes.
- 4.32
- Of course, there are no simple recipes for the problems described above. Some of the critics of the competitive funding system, especially the one based on peer review, think it is not possible to 'repair' it and the research community should move to a wholly different scheme. For example, Lawrence (2009) calls for creation of system tracking achievements, focused on individual productivity and open to all. Instead of judging promises (as is the case in evaluations of proposals), the evaluation would cover the results of the past funding (ideally allowing for the risk of failure inherently present in the research of the unknown). In each round of funding the applicants would be able to preserve the freedom of research. This would not only combat the advantage that large research groups have over small ones (institutional bias), but also allow truly innovative research to be funded. Currently, many of the best ideas are not put into the proposals for fear of being seen by competitors, who may have more resources to pursue the proposed research ideas ahead of the applicant. Similar conclusions were reached by Berezin (1998), for whom the search for 'better peer review' is a red herring. The proposed alternative is funding the researchers, not proposals. It is interesting that the call comes from a person who has had the opportunity to witness the workings of the centrally directed Soviet management of research as well as the grant-based US/Canadian one. Wessely (1998), analyzing multiple deficiencies of the current system, proposes as one of the alternatives the use of post-hoc, bibliography measures that would shift the evaluation to the actual research already done (where we should remember the problems related to differences between disciplines).
- 4.33
- The 'publish or perish' pressure has become widely known. But with respect to the competitive funding another phrase has been coined by Quake (2009): 'funding or famine'. It is not surprising that such pressures would pave the way for 'creative' behavior. There are also other fundamental problems associated with the current funding methods. Martinson et al. (2009) have found significant correlations between receiving federal funding (which may be assumed to come via competitive procedures) and serious research misbehavior and neglect or careless behavior. Still, for many reasons (including political ones) abandoning the peer review in the funding process seems impossible. A much more limited change, focused on opening of the evaluation process to scrutiny and introduction of the tools designed to unveil the possible errors, deviations from objectivity, or manipulation is not only more realistic, but also could provide the necessary data to judge whether the system does need complete overhaul or if it may be improved step by step. Hörlesberger et al. (2013) have voiced the need to accept and nourish 'frontier research', which is characterized by boldness and risk, including personal risk for the researcher. They postulated that inclusion of bibliometric analyses in the process of monitoring of the operation of the peer-review. In our opinion, a combination with social network studies and openness of the review to statistical oversight, might improve the quality and capacity to recognize ideas worth taking the risk. An additional measure, proposed by Leijten et al. (2010), has already been mentioned: improving the capacity for stop-and-go decisions for existing projects and for flexibility in the research, including the opportunities to test new ideas, not described in the original proposals. Recently, Alberts et al. (2014) have described a long list of possible actions, directed at improvement of specific field of biomedical research, but equally applicable to a broader scope. One of the objectives was 'to rebalance the research portfolio by recognizing the inertia that favors large projects and by improving the peer review system so that more imaginative, long-term proposals are being funded and scientific careers can have a more stable course'. Such a call, especially when related to the one of the fastest growing research fields, shows how important it is to understand and improve the funding process. It seems both prophetic and ironic, that in his science fiction story 'Mark Gable foundation' (Szilard 1961), written in 1948, Leo Szilard, one of the fathers of atomic bomb, described a system for funding of science designed to retard the progress, which looks uncannily like the one that we use now.
Notes
-
1This
hypothesis is a subject worthy of a separate investigation.
2A criminal case of this type has been uncovered in Poland in 2013 http://www.prokuratura.legnica.pl/pliki/akt478.pdf (in Polish, accessed 26.04.2014) .
3As can be deduced from the data indicating that the drop-out ratio for unsuccessful proposals is between 40% and 50% (Wessely, 1998)
4In the summer of 2014, NSF asked ('strongly encouraged') astronomers to submit just one proposal per year, as a response to a falling success ratio for funding (Mervis 2014).
5This number is actually greater than the actual success rates for many funding schemes (e.g. 24% for NSF in 2012, 10.2% for ERC Starting grant 2007–2013, 13.9% for ERC Advanced Grant 2007–2013, 19.3% for NIH grants 2013; data from publicly available NSF, ERC and NIH databases).
6For example, 'NSF selects the reviewers from among the national pool of experts in each field', http://www.nsf.gov/about/how.jsp
7We note that there is a definite need for the right kind of non-innovative research in many domains. In particular, the present funding schemes discourage efforts directed at reproducing and double-checking the earlier results, as well as the mundane task of filling the gaps in the available data. Such efforts do not fulfill the criteria for groundbreaking research, nor are they 'applied science' leading to industrial innovations, responding to the needs of the industry. Yet they are needed. A good example is provided by studies of properties of matter under nuclear radiation, where most of the data comes from the 1960s era. The role played by such reproductive research is exemplified by the growing number of retractions. Without the right support for these non-innovative studies, the self-correcting capacity of science is diminishing.
8These are founding goals of the European Research Council (ERC).
References
- ABRAHAMSON, E. (2009).
Necessary conditions for the study of fads and fashions in science. Scandinavian
journal of management, 25(2): 235–239. [doi:10.1016/j.scaman.2009.03.005]
ALBERTS, B., Kirschner, M.W., Tilghman, S., & Varmus, H. (2014) Rescuing us biomedical research from its systemic flaws. Proceedings of the National Academy of Sciences 111(16): 5773–5777 [doi:10.1073/pnas.1404402111]
ALLESINA, S. (2012) Modeling peer review: an agent-based approach. Ideas in Ecology and Evolution 5(2): 27–35 [doi:10.4033/iee.2012.5b.8.f]
AZOULAY, P., Graff Zivin, J.S., & Manso, G. (2011) Incentives and creativity: evidence from the academic life sciences. The RAND Journal of Economics 42(3): 527–554 [doi:10.1111/j.1756-2171.2011.00140.x]
BEAUDRY, C., & Allaoui, S. (2012) Impact of public and private research funding on scientific production: The case of nanotechnology. Research Policy 41(9): 1589–1606 [doi:10.1016/j.respol.2012.03.022]
BEAUDRY, C., & Clerk-Lamalice, M. (2010) Grants, contracts and networks: What influences biotechnology scientific production? In: Danish Research Unit for Industrial Dynamics (DRUID) Conference, London, June, pp 16–18, http://www2.druid.dk/conferences/viewpaper.php?id=501711&cf=43, accessed 30.11.2014
BENCE, V., & Oppenheim, C. (2004) The influence of peer review on the research assessment exercise. Journal of Information Science 30(4): 347–368 [doi:10.1177/0165551504045854]
BENOS, D.J., Bashari, E., Chaves, J.M., Gaggar, A., Kapoor, N., Lafrance, M., Mans, R., Mayhew, D., McGowan, S., Polter, A., Qadri, Y., Sarfare, S., Schultz, K., Splittgerber, R., Stephenson, J., Tower, C., Walton, R.G., & Zotov, A. (2007). The ups and downs of peer review. Advances in physiology education, 31(2): 145–152 [doi:10.1152/advan.00104.2006]
BENTLEY, P.J. (2009) The game of funding: modelling peer review for research grants. In: Proceedings of the 11th Annual Conference Companion on Genetic and Evolutionary Computation Conference: Late Breaking Papers, ACM, pp 2597–2602 [doi:10.1145/1570256.1570367]
BEREZIN A (1998) The perils of centralized research funding systems. Knowledge, Technology & Policy 11(3):5–26 [doi:10.1007/s12130-998-1001-1]
VAN DEN BESSELAAR, P. (2012) Selection committee membership: Service or self-service. Journal of Informetrics 6(4): 580–585 [doi:10.1016/j.joi.2012.05.003]
BOHANNON, J. (2013) Who's afraid of peer review? Science 342(6154): 60–65. [doi:10.1126/science.342.6154.60]
BORNMANN, L., & Daniel, H.D. (2007) Gatekeepers of science: effects of external reviewers' attributes on the assessments of fellowship applications. Journal of Informetrics 1(1): 83–91 [doi:10.1016/j.joi.2006.09.005]
BORNMANN, L., & Mutz, R. (2014) Growth rates of modern science: A bibliometric analysis. arXiv preprint arXiv:14024578, http://arxiv.org/abs/1402.4578, accessed 30.11.2014
BORNMANN, L., Leydesdorff, L., & Van Den Besselaar, P. (2010) A meta-evaluation of scientific research proposals: Different ways of comparing rejected to awarded applications. Journal of Informetrics 4(3): 211–220 [doi: [doi:10.1016/j.joi.2009.10.004]
BÖRÖCZ, J. (2000) Informality and nonprofits in East Central European capitalism. Voluntas: International Journal of Voluntary and Nonprofit Organizations 11(2): 123–140 [doi:10.1023/A:1008967824623]
BRESCHI, S., & Catalini, C. (2010) Tracing the links between science and technology: An exploratory analysis of scientists' and inventors' networks. Research Policy 39(1): 14–26 [doi:10.1016/j.respol.2009.11.004]
BRESCHI, S., & Cusmano, L. (2004) Unveiling the texture of a European Research Area: emergence of oligarchic networks under EU framework programmes. International Journal of Technology Management 27(8):747–772 [doi:10.1504/IJTM.2004.004992]
CABEZAS-CLAVIJO, A., Robinson-García, N., Escabias, M., & Jiménez-Contreras, E. (2013) Reviewers' ratings and bibliometric indicators: hand in hand when assessing over research proposals? PLoS ONE 8(6): e68,258
CALCAGNO, V., Demoinet, E., Gollner, K., Guidi, L., Ruths, D., & De Mazancourt, C. (2012). Flows of Research Manuscripts Among Scientific Journals Reveal Hidden Submission Patterns. Science, 338(6110), 1065–1069. [doi:10.1126/science.1227833]
DANTHI, N., Wu, C.O., Shi, P. & Lauer, M. (2014). Percentile Ranking and Citation Impact of a Large Cohort of National Heart, Lung, and Blood Institute-Funded Cardiovascular R01 Grants. Circulation Research, 114(4), 600–606. [doi:10.1161/CIRCRESAHA.114.302656]
DEMICHELI, V., & Di Pietrantonj, C. (2007) Peer review for improving the quality of grant applications. Cochrane Database Systematic Review 2, http://onlinelibrary.wiley.com/doi/10.1002/14651858.MR000003.pub2/pdf/standard, accessed 30.11.2014 [doi:10.1002/14651858.mr000003.pub2]
DONOVAN, C., Butler, L., Butt, A.J., Jones, T.H., & Hanney, S.R. (2014), Evaluation of the impact of National Breast Cancer Foundation-funded research. The Medical Journal of Australia 200, 4, 214–218. [doi:10.5694/mja13.10798]
EPSTEIN, J.M. (2008). Why Model? Journal of Artificial Societies and Social Simulation, 11(4) 12. <https://www.jasss.org/11/4/12.html>
FANG, H. (2011) Peer review and over-competitive research funding fostering mainstream opinion to monopoly. Scientometrics 87(2): 293–301 [doi:10.1007/s11192-010-0323-4]
FOX, M.F. (1983) Publication productivity among scientists: A critical review. Social Studies of Science 13(2):285–305 [doi:10.1177/030631283013002005]
FRONCZAK, P., Fronczak, A., & Hołyst, J. (2007) Analysis of scientific productivity using maximum entropy principle and fluctuation-dissipation theorem. Physical Review E 75(2): 026,103
GALLO, S.A., Carpenter, A.S., Irwin, D., McPartl, C.D., Travis, J., Reynders, S., Thompson, L.A. & Glisson, S.R. (2014). The Validation of Peer Review through Research Impact Measures and the Implications for Funding Strategies. PLoS ONE, 9(9), e106474. [doi:10.1371/journal.pone.0106474]
GEARD, N., & Noble, J. (2010) Modelling academic research funding as a resource allocation problem. In: 3rd World Congress on Social Simulation, http://eprints.soton.ac.uk/271374/, accessed 30.11.2014
GOLDSWORTHY, J. (2009) Research grant mania. Australian Universities Review 50(2): 17–24.
GREEN, R.F. (2002). Fashions in science, Technical Report TR-2002-8, University of Minnesota, Duluth, http://d.umn.edu/~rgreen/Fashions%20in%20Science.pdf, accessed 30.11.2014
GRIMPE, C. (2012) Extramural research grants and scientists' funding strategies: Beggars cannot be choosers? Research Policy 41(8): 1448–1460 [doi:10.1016/j.respol.2012.03.004]
GUPTA, P., Kaur, G., Sharma, B., Shah, D., & Choudhury, P. (2006) What is submitted and what gets accepted in indian pediatrics: Analysis of submissions, review process, decision making and criteria for rejection. Indian pediatrics 43(6): 479.
HAITUN, S.D. (1982) Stationary scientometric distributions. part 3. Scientometrics 4(3): 181–194. [doi:10.1007/BF02021059]
HÖRLESBERGER, M., Roche, I., Besagni, D., Scherngell, T., François, C., Cuxac, P., Schiebel, E., Zitt, M., & Holste, D. (2013) A concept for inferring `frontier research' in grant proposals. Scientometrics 97(2): 129–148. [doi:10.1007/s11192-013-1008-6]
HORROBIN, D.F. (1996) Peer review of grant applications: a harbinger for mediocrity in clinical research? The Lancet 348(9037): 1293–1295. [doi:10.1016/S0140-6736(96)08029-4]
KABRA, N. (2013) How I published a fake paper, and why it is the fault of our education system. http://smritiweb.com/navin/education-2/how-i-published-a-fake-paper-and-why-it-is-the-fault-of-our-education-system, accessed 26.04.2014
KARDES, H., Sevincer, A., Gunes, M.H., & Yuksel, M. (2013) Complex Network Analysis of Research Funding: A Case Study of NSF Grants, http://www.cse.unr.edu/~mgunes/papers/snam.pdf, accessed 26.04.2014
VON KRZYWOBLOCKI, M.Z. (1965). Fashion and Competition in Science. Science, 147(3655): 237–237. [doi:10.1126/science.147.3655.237]
LABBÉ, C., & Labbé, D. (2013) Duplicate and fake publications in the scientific literature: how many scigen papers in computer science? Scientometrics 94(1): 379–396. [doi:10.1007/s11192-012-0781-y]
LANGFELDT, L., & Kyvik, S. (2011) Researchers as evaluators: tasks, tensions and politics. Higher Education 62(2): 199–212. [doi:10.1007/s10734-010-9382-y]
LARSEN, P.O., & von Ins, M. (2010) The rate of growth in scientific publication and the decline in coverage provided by Science Citation Index. Scientometrics 84(3): 575–603 [doi: ] [doi:10.1007/s11192-010-0202-z]
LAWRENCE, P.A. (2007) The mismeasurement of science. Current Biology 17(15): R583–R585. [doi:10.1016/j.cub.2007.06.014]
LAWRENCE, P.A. (2009) Real lives and white lies in the funding of scientific research. PLoS Biol 7(9): e1000,197. [doi:10.1371/journal.pbio.1000197]
LEE, C.J., Sugimoto, C.R., Zhang, G., & Cronin, B. (2013) Bias in peer review. Journal of the American Society for Information Science and Technology 64(1): 2–17. [doi:10.1002/asi.22784]
LEE, M., Om, K., & Koh, J. (1999) Blind review of research proposals in Korea: Its effectiveness and factors affecting applicant detection. Scientometrics 45(1): 17–31. [doi:10.1007/BF02458466]
LEIJTEN, J., Rosenboom, H. & Hofer, R. (2010). MORE FRONTIER RESEARCH FOR EUROPE A Venture Approach for Funding High Risk – High Gain Research ("SIS 2009 ERABSTUDY"), report for EC DG Research, http://ec.europa.eu/research/erab/pdf/erab-study-high-risk-high-gain-2010_en.pdf, accessed 01.10.2014
LIU, X.Z., & Fang, H. (2012) Peer review and over-competitive research funding fostering mainstream opinion to monopoly. Part II. Scientometrics 90(2): 607–616. [doi:10.1007/s11192-011-0526-3]
MARSH, H.W., Jayasinghe, U.W., & Bond, N.W. (2008) Improving the peer-review process for grant applications: reliability, validity, bias, and generalizability. American Psychologist 63(3): 160–168. [doi:10.1037/0003-066X.63.3.160]
MARTIN, B. (2000) Research grants: Problems and options. Australian Universities' Review 43(2): 17–22.
MARTINSON, B.C., Crain, A.L., Anderson, M.S., & De Vries, R. (2009) Institutions' expectations for researchers' self-funding, federal grant holding and private industry involvement: Manifold drivers of self-interest and researcher behavior. Academic Medicine: journal of the Association of American Medical Colleges 84(11): 1491–1499.
MAYO, N.E., Brophy, J., Goldberg, M.S., Klein, M.B., Miller, S., Platt, R.W., & Ritchie, J. (2006) Peering at peer review revealed high degree of chance associated with funding of grant applications. Journal of clinical epidemiology 59(8): 842–848. [doi:10.1016/j.jclinepi.2005.12.007]
MCVITTIE, G.C. (1964). Fashion and Competition in Science. Science 146(3642): 341. [doi:10.1126/science.146.3642.341]
MERTON, R.K. (1973) The sociology of science: Theoretical and empirical investigations. University of Chicago Press
MERVIS, J. (2014) Just one proposal per year, please, NSF tells astronomers. Science 344: 1328. [doi:10.1126/science.344.6190.1328]
MOULY, V.S., & Sankaran, J.K. (1999) Project Administration by Indian Federal R&D Agencies. Journal Society of Research Administrators 31: 35–48.
NEFF, B.D., & Olden, J.D. (2006) Is peer review a game of chance? BioScience 56(4): 333–340. [doi:10.1641/0006-3568(2006)56[333:IPRAGO]2.0.CO;2]
OLEINIK, A. (2014) Conflict (s) of interest in peer review: Its origins and possible solutions. Science and engineering ethics 20: 1–21. [doi:10.1007/s11948-012-9426-z]
PAOLUCCI, M. and Grimaldo, F. (2014) Mechanism change in a simulation of peer review: from junk support to elitism. Scientometrics, 1–26. [doi:10.1007/s11192-014-1239-1]
PARK, I.-U., Peacey, M.W. & Munafò, M.R. (2013). Modelling the effects of subjective and objective decision making in scientific peer review. Nature 506: 93–96. [doi:10.1038/nature12786]
PLUCHINO, A., Rapisarda, A., & Garofalo, C. (2009) The Peter principle revisited: A computational study. Physica A: Statistical Mechanics and its Applications 389(3): 467–472.
PLUCHINO, A., Garofalo, C., Rapisarda, A., Spagano, S., & Caserta, M. (2011a) Accidental politicians: How randomly selected legislators can improve parliament efficiency. Physica A: Statistical Mechanics and its Applications 390(21): 3944–3954.
PLUCHINO, A., Rapisarda, A., & Garofalo, C. (2011b) Efficient promotion strategies in hierarchical organizations. Physica A: Statistical Mechanics and its Applications 390(20): 3496–3511.
POULIN, B.J. & Gordon, R. (2001). How to Organize Science Funding: The New Canadian Institutes for Health Research, an Opportunity to Increase Innovation. Canadian Public Policy/Analyse de Politiques, XXVII(1): 95–111. [doi:10.2307/3552376]
QUAKE, S. (2009) Letting scientists off the leash. URL Opinionator: A New York Times blog, http://opinionator.blogs.nytimes.com/2009/02/10/guest-column-letting-scientists-off-the-leash, accessed 30.11.2014
RAGONE, A., Mirylenka, K., Casati, F., & Marchese, M. (2011) A quantitative analysis of peer review. In: 13th International Society of Scientometrics and Informetrics Conference, Durban, http://sisinflab.poliba.it/publications/2011/RMCM11/ISSI2011-PeerReview_online.pdf, accessed 30.11.2014
RAMULU, V.G., Levine, R.B., Hebert, R.S., & Wright, S.M. (2005) Development of a case report review instrument. International journal of clinical practice 59(4): 457–461. [doi:10.1111/j.1368-5031.2005.00319.x]
RENNIE, D. (1999) Editorial peer review: its development and rationale. In: Godlee F, Jefferson T, eds. Peer review in health sciences. BMJ Books, London.
RIP, A. (2000). Fashions, lock-ins and the heterogeneity of knowledge production, in The Future of Knowledge Production in the Academy edited by Jacob, M. and Hellström, T., (pp. 28–39). Society for Research into Higher Education & Open University Press.
ROTHWELL, P.M., & Martyn, C.N. (2000) Reproducibility of peer review in clinical neuroscience is agreement between reviewers any greater than would be expected by chance alone? Brain 123(9): 1964–1969. [doi:10.1093/brain/123.9.1964]
SANDSTRÖM,U., & Hällsten, M. (2008) Persistent nepotism in peer-review. Scientometrics 74(2): 175–189. [doi:10.1007/s11192-008-0211-3]
SCHARNHORST, A., Börner, K., & Van Den Besselaar, P. (eds) (2012) Models of science dynamics: encounters between complexity theory and information sciences. Springer Verlag. Heidelberg. [doi:10.1007/978-3-642-23068-4]
SCHEINER, S.M. & Bouchie, L.M. (2013) The predictive power of NSF reviewers and panels. Frontiers in Ecology and the Environment, 11(8): 406–407. [doi:10.1890/13.WB.017]
SCHERNGELL, T., & Lata, R. (2013) Towards an integrated European Research Area? Findings from Eigenvector spatially filtered spatial interaction models using European Framework Programme data. Papers in Regional Science 92(3): 555–577.
SCHERNGELL, T., Roche, I., Hörlesberger, M., Besagni, D., Züger, M.E., & Holste, D. (2013) Initial comparative analysis of model and peer review process for ERC starting grant proposals. Research Evaluation 22:248–257 [doi:10.1093/reseval/rvt015]
SCHROTER, S., Tite, L., Hutchings, A., & Black, N. (2006) Differences in Review Quality and Recommendations for Publication Between Peer Reviewers Suggested by Authors or by Editors. JAMA 295(3):314–317 [doi:10.1001/jama.295.3.314]
SOBKOWICZ, P. (2010) Dilbert-Peter Model of Organization Effectiveness: Computer Simulations. Journal of Artificial Societies and Social Simulation 13 (4) 4: https://www.jasss.org/13/4/4.html
DE SOLLA PRICE, D.J. (1951) Quantitative measures of the development of science. Archives internationales d'histoire des sciences 14: 85–93.
DE SOLLA PRICE, D.J. (1986) Little science, big science... and beyond. Columbia University Press New York.
SONNENBERG, A. (2005) The inevitable rise of mediocrity in academic medicine. Medical hypotheses 65(2): 400–404. [doi:10.1016/j.mehy.2005.02.028]
SPIER, R. (2002) Peer review and innovation. Science and Engineering Ethics 8, 1, 99–108. [doi:10.1007/s11948-002-0035-0]
SQUAZZONI, F., & Gandelli, C. (2012) Saint Matthew strikes again: An agent-based model of peer review and the scientific community structure. Journal of Informetrics 6(2): 265–275. [doi:10.1016/j.joi.2011.12.005]
SQUAZZONI, F., & Gandelli, C. (2013) Opening the black-box of peer review: An agent-based model of scientist behaviour. Journal of Artificial Societies and Social Simulation 16 (2) 3: https://www.jasss.org/16/2/3.html
SQUAZZONI, F., & Takács, K. (2011) Social simulation that 'peers into peer review'. Journal of Artificial Societies and Social Simulation 14(4) 3: https://www.jasss.org/14/4/3.html
STARBUCK, W.H. (2009). The constant causes of never-ending faddishness in the behavioral and social sciences. Scandinavian Journal of Management, 25(1): 108–116. doi: ] [doi:10.1016/j.scaman.2008.11.005]
STEPHAN, P.E. (2010) The economics of science-funding for research. Tech. rep., ICER-International Centre for Economic Research Working Paper http://papers.ssrn.com/sol3/papers.cfm?abstract_id=1634772, accessed 30.11.2014 [doi:10.2139/ssrn.1634772]
STRIBLING, J., Krohn, M., & Aguayo, D. (2005) Scigen - an automatic cs paper generator. http://pdos.csail.mit.edu/scigen/, accessed 26.04.2014
SZILARD, L. (1961) The Mark Gable Foundation, Simon and Schuster, New York.
TAGUE, J., Beheshti, J., & Rees-Potter, L. (1981) The law of exponential growth: evidence, implications and forecasts. Library Trends 30(1): 125–149.
THORNGATE, W., Faregh, N., & Young, M. (2002) Mining the archives: Analyses of CIHR research grant adjudications, http://www.carleton.ca/hot/wp-content/uploads/mining_the_archives.pdf, accessed 26.04.2014
THURNER, S., & Hanel, R. (2011) Peer-review in a world with rational scientists: Toward selection of the average. European Physical Journal B-Condensed Matter 84(4): 707. [doi:10.1140/epjb/e2011-20545-7]
TRAVIS, G.D.L., & Collins, H.M. (1991) New light on old boys: cognitive and institutional particularism in the peer review system. Science, Technology & Human Values 16(3): 322–341. [doi:10.1177/016224399101600303]
VAN NOORDEN, R. (2014) Publishers withdraw more than 120 gibberish papers. Nature [doi:10.1038/nature.2014.14763]
WENNERAS, C., & Wold, A. (1997) Nepotism and sexism in peer-review. Nature 387, 341–343 (387): 341–343.
WESSELY, S. (1998) Peer review of grant applications: what do we know? The Lancet 352(9124): 301–305. [doi:10.1016/S0140-6736(97)11129-1]
ZIMAN, J. (1994) Prometheus Bound, Cambridge University Press, Cambridge. [doi:10.1017/CBO9780511585067]