
 Abstract
- This paper describes the development of the Individual
Reporting Compliance Model (IRCM), an agent-based model for simulating
tax reporting compliance in a community of 85,000 U.S. taxpayers.
Design features include detailed tax return characteristics, taxpayer
learning, social networks, and tax agency enforcement measures. The
taxpayer's compliance reporting decision is modeled as a partially
observable Markov decision process that takes into account taxpayers'
heterogeneous risk profiles and non-stationary beliefs about the
expected costs associated with alternative reporting strategies. In
order to comply with legal requirements prohibiting the disclosure of
taxpayer information, artificial taxpayers are created using data from
the Statistics of Income (SOI) Public Use File (PUF). Misreported
amounts for major income and offset items are imputed to tax returns
are based on examination results from random taxpayer audits. A
hypothetical case study illustrates how IRCM can be used to compare
alternative taxpayer audit selection strategies.
- Keywords:
- Partially Observable Markov Decision Process, Taxpayer Compliance, Repast
Introduction
- 1.1
- In tax year (TY) 2006, the U.S. Internal Revenue Service
(IRS) estimates the gross tax gap – the true amount of tax due but not
paid voluntarily and timely – was $450 billion, representing 16.9
percent of the total tax due from individuals and corporations. The
loss of revenue associated with the tax gap is a burden that falls
disproportionately on compliant taxpayers and contributes to the
nation's budget deficit. Consequently, finding ways to reduce the tax
gap is an ongoing concern for the IRS.
- 1.2
- Research on individuals' motives for complying with tax
laws has flourished since the 1972 publication of Allingham and
Sandmo's (1972)
groundbreaking theoretical work on the subject. However, this vast body
of knowledge has not been successfully integrated into computational
tools that could help tax administrators improve taxpayer compliance.
The lack of progress on applications development stems from
researchers' inability to incorporate sufficient realism into
theoretical models of taxpayer behavior (Alm
1999). The realization that analytical methods are often
inadequate for modeling complex social phenomena has led to the growing
interest in agent-based modeling (Axtell
2000; Janssen &
Ostrom 2006; Alm et al. 2010).
- 1.3
- During the last decade a number of agent-based models
(ABMs) of taxpayer compliance have appeared in the literature (Antuñes et al. 2007; Bloomquist 2004, 2006; Davis et al. 2003; Hokamp & Pickhardt 2010;
Korobow et al. 2007; Mittone & Patelli 2000;
Szabó et al. 2008; Zaklan et al. 2009; Andrei et al. 2014).
Mainly exploratory in nature, these models lack the degree of realism
required for applied use, such as a detailed representation of income
reporting requirements and key institutional relationships linking
taxpayers, tax preparers, employers and the tax agency. This paper
introduces a model that addresses many of these operational
deficiencies.
- 1.4
- This paper describes the design and implementation of the
Individual Reporting Compliance Model (IRCM), an ABM that simulates the
income tax reporting behavior of a community of 85,000 individual
taxpayers. This paper's main contribution to the ABM literature is a
model on a topic (tax compliance) having significant importance for
national and sub-national governments worldwide and that incorporates a
high degree of fidelity to the environment in which both taxpayers and
tax agencies operate. For example, the IRCM (or the "model") includes
many enforcement mechanisms used by tax agencies, such as audits and
information reporting, as well as detailed information on the reporting
compliance for major income and offset items. A point-and-click
interface allows the user to easily explore the impact on taxpayer
reporting compliance of alternative assumptions concerning tax agency
enforcement and information reporting. In order to comply with IRS
disclosure rules no taxpayer data is used. Instead, a dataset of
artificial taxpayers is created by selecting cases (with replacement)
from the Statistics of Income (SOI) Public Use File (PUF) (Weber 2004) that are close
statistical matches for actual tax returns. The model is written in
Java and uses Repast (North et al.
2007) software libraries for random number generation and
chart production. Finally, the model design allows for new information
about taxpayer behavior to be incorporated as such information becomes
available.
- 1.5
- The outline of this paper is as follows. Section two gives
an overview of the IRCM framework and describes agents and agent
behaviors. Section three describes the steps involved in constructing
the dataset of artificial taxpayers used by the model. Section four
discusses model validation and calibration. Section five presents a
hypothetical case study analyzed using IRCM. Section six concludes and
highlights topics for further research.
Model Description
-
Agents
- 1.6
- Figure 1 graphically displays the IRCM agent architecture.
A single Region is composed of multiple non-overlapping zones. Each
Zone represents the place of residence for a group of filers (e.g., a
postal zip code zone). Each Zone also has a list of all tax preparers
and employers located within its borders. A Preparer agent prepares tax
returns for its clients. Employer agents represent firms having one or
more employees. Form 1040 filers are represented by Filer agents. A tax
return is an instance of the TaxReturn class. All tax returns are
reviewed by a tax agency (an instance of the TaxAgency class) and are
subject to a possible audit. The tax agency selects filers for audit
using one of three user-specified audit strategies: random, fixed
proportion, and constrained maximum yield (CMY). The CMY audit
selection strategy uses a simple learning algorithm to incrementally
improve overall yield per return audited.
- 1.7
- The interaction between filers and the tax agency is
illustrated in Figure 2. The
filer either uses a paid preparer or self-prepares. The tax agency
reviews the return and determines if any discrepancies are present on
items with third-party information reporting (e.g., Form W-2 for wage
and salary income). If the return is audited the amount misreported is
recorded. If not audited, the filer decides how much income to report
in the next period for items with little or no third-party information
reporting. If audited, the filer may reevaluate reporting on all major
income and offset items.
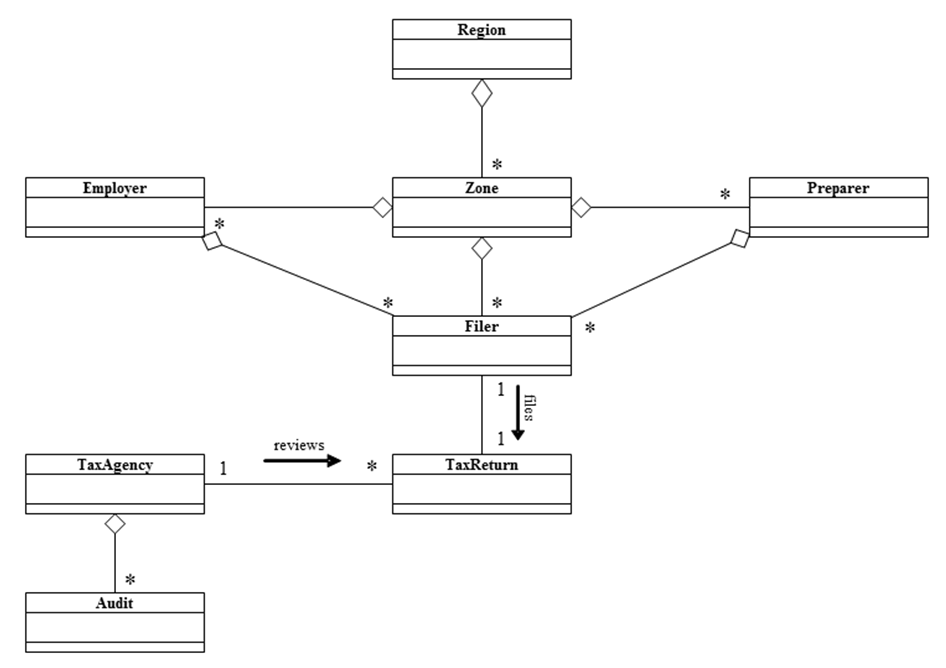
Figure 1. IRCM Agent Hierarchy Model Execution
- 1.8
- The steps followed in executing a simulation using IRCM are
shown in Figure 3. The model
reads tax return data for the population of artificial taxpayers and
instantiates agents. During instantiation, IRCM estimates a true amount
for the most important Form 1040 income and offset items which is
defined as the reported amount plus imputed misreporting. Imputed
amounts are based on audit results from the TY 2001 National Research
Program (NRP) study. Details of the imputation methodology are
described in Bloomquist (2012).
- 1.9
- Each time step represents one filing cycle (year). Tax
calculations are performed twice for all taxpayers, once using reported
amounts and again using estimated true amounts. The difference in
calculated tax using true and reported amounts is the tax gap for each
filer. By default, IRCM assumes the difference between the true and
reported tax amounts is the amount identified by the tax auditor. An
option is provided to account for underreporting not detected by
examiners (see Bloomquist 2012).
- 1.10
- Tax audits are performed at the penultimate step in each
time loop. During wrap up, the tax agency issues notices to taxpayers
who are not audited but where computer checking of tax returns against
information documents detects some underreporting. In addition, filers
who stop filing, either because they leave the region or no longer have
an obligation to file, are replaced by a new filer having identical
income and network relationships as the "stop filer" being replaced,
but with reporting behavior and memory reset to baseline levels (i.e.,
no memory of a prior audit experience or audits of reference group
members, if that option is selected). The reporting behavior of filers
who are not "stop filers" is also updated at each time step, as is the
audit selection strategy of the tax agency. Finally, data collection
occurs during the wrap-up phase. When the user-specified number of time
steps has completed the model generates output in the form of tables
and charts that can be reviewed and saved for further analysis.
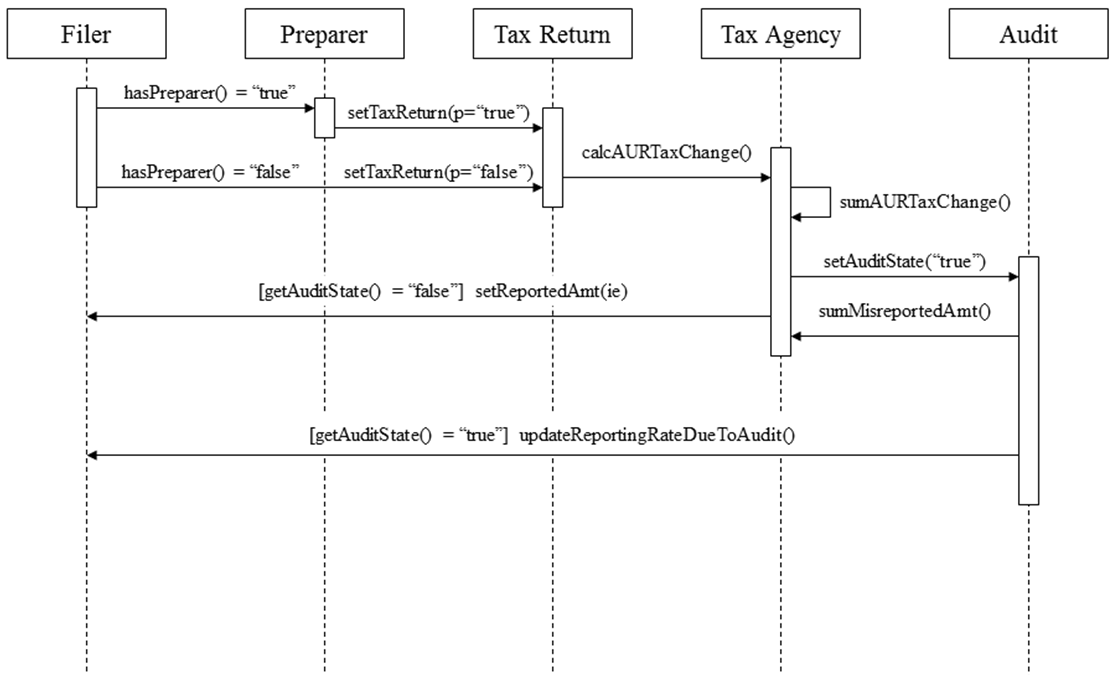
Figure 2. Interaction Between Filer and Tax Agency 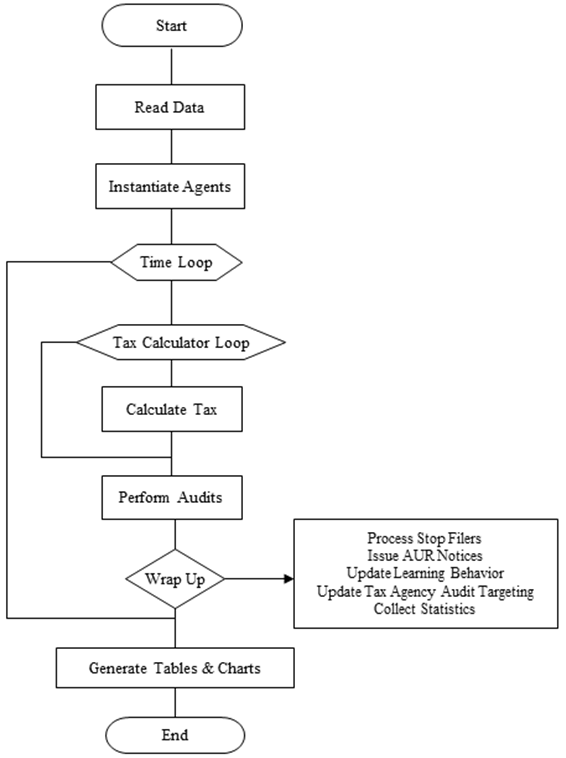
Figure 3. IRCM Execution Sequence: Top-Level View Filer Response to a Tax Audit
- 1.11
- Following Gemmell and Ratto (2012)
a filer's response to a tax audit is based on user-supplied
probabilities that cover two mutually-exclusive states (selected for a
tax audit or not selected) and four response categories (perfect
compliance, increase compliance, decrease compliance and no change).
Since taxpayers do not know with certainty that taking a specific
action will result in being selected for a tax audit, this problem is
classified as a partially observable Markov decision process (POMDP) (Ghallab et al. 2004). A POMDP
is a 5-tuple
T = (S,A,P,C,O) (1) where
- S is a finite set of states
- A is a finite set of actions
- P is a probability distribution where for each if there
exists and such that Lastly, we have
?s'?S P(s,a,s') = 1 (2) - is the cost/reward (or expected cost/reward) experienced from transition to state s' from state s with transition probability Pa(s'|s). The quantity Pa(s'|s) is the probability that if action a is executed in state s, then state s' will result. For example, if a taxpayer decides to increase compliance following a tax audit, one can infer that the action is being taken in order to reduce the probability of being selected for an audit (and the associated costs) in future time periods.
- O is a set of observations with
probabilities Pa(o|s),
for any a?A, s?S
and o?O. Pa(o|s)
represents the probability of observing o in state s
after executing action a. Finally, it is required
that the sum of probabilities over the set of observations is 1,
?o?O Pa(o|s) = 1 (3)
- 1.12
- Since the observations in a POMDP represent probability
distributions, rather than exact states of the system, the probability
distributions are called belief states and are
updated using Bayes Rule. The use of Bayes Rule implies that the
probabilities represented by Pa(o|s)
are not static but change as knowledge of the enforcement environment
changes.
- 1.13
- In IRCM neither the belief states (O)
nor the cost functions (C) of individual filers are
modeled explicitly but are implied in the stochastically driven
"choices" made by filers. This approach is taken since, at present, so
little empirical data is available to indicate about how taxpayers
perceive the tax enforcement environment or the specific causes that
motivate changes in observed behavior. However, modeling filers'
response to audits as a stochastic process is supported by observed
behavior in tax compliance laboratory experiments (Alm
1999).
- 1.14
- Figure 4
graphically illustrates the POMDP portraying a filer's response to a
tax audit. The two states are not audited (S0)
and audited (S1). The filer's
belief about the probability of audit is defined as rak
= b(r|ak)
which implies that the filer's perceived probability of being selected
for a tax audit depends on his or her belief about how the baseline
audit probability (r) changes with a change in
reporting behavior (action) ak.
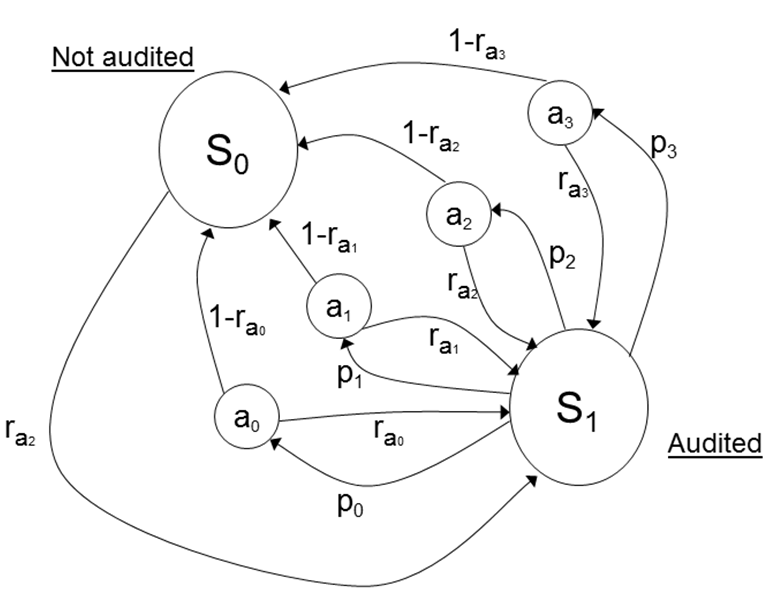
Figure 4. POMDP of the Filer's Response to the Tax Audit Environment - 1.15
- In Figure 4 it is
assumed a0 = no change in
reporting compliance, a1 =
an increase in reporting compliance, a2
= decrease in reporting compliance and a3
= perfect reporting compliance. If not audited in time t
the filer may start or increase underreporting in time t+1
on income subject to little or no information reporting, assuming the
filer has such income from one or more sources. If the filer is audited
in time t, the decision to select action a0…a3
is determined in IRCM by a random draw and the user-specified
probabilities p0…p3.
Although IRCM models the filer's response as a stochastic process,
actual filers are presumed to select an action ak
based on their (heterogeneous and non-stationary) beliefs about the
expected cost associated with that action.
User Interface
- 1.16
- Figure 5 displays
the IRCM's main screen where the user defines the baseline and
alternative scenarios, launches simulations, and views output for the
region and zones. Zones can be displayed with different characteristics
including the number of filers, average reported income, and tax
compliance rate. Tables summarizing key measures can be displayed for
the entire region or for individual zones. From these tables the user
can drill-down to the level of individual employers and tax preparers
located within the selected area. This capability is useful for model
verification and to investigate the spatial variation in filing and
compliance behavior.
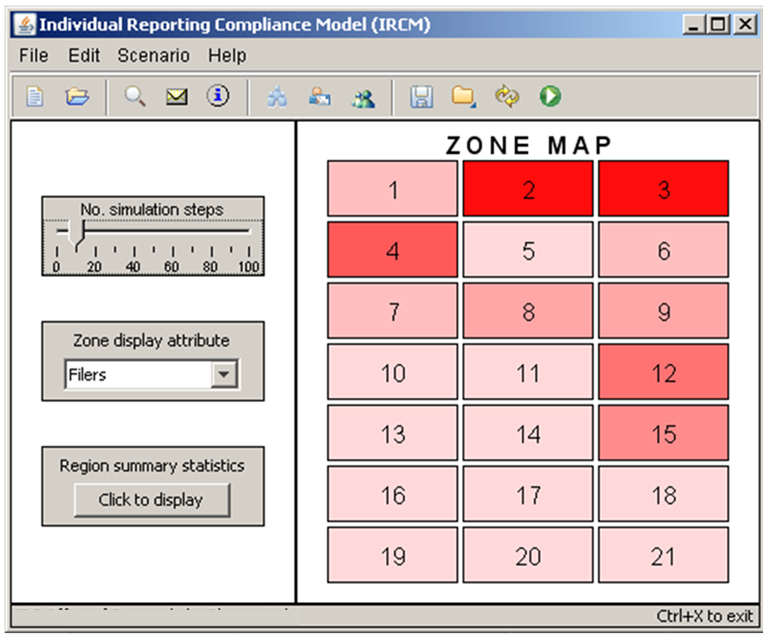
Figure 5. IRCM Main Screen
Study
Area Selection and Artificial Taxpayer Data
- 2.1
- The area selected as the test-bed region is a single county
with 85,000 individual tax filers in TY 2001. The region was selected
based on its overall similarity to the nation on key economic and
demographic characteristics (e.g., age structure, industry structure,
racial composition, per capita income, etc.) as well as number of
filers, which is sufficiently small to be modeled on a personal
computer. In order to preserve taxpayer anonymity yet allow for
independent verification and validation, the model is implemented using
a dataset of artificial taxpayers. The basic idea in creating a dataset
of artificial taxpayers is to substitute cases from the 2001 Statistics
of Income (SOI) Public Use File (PUF) for actual tax returns of
individual filers in the study area. Although most fields in the PUF
are derived from tax forms, SOI modifies the data in order to protect
the identity of individuals. The statistical matching procedure used to
create the database of artificial taxpayers is described in detail in
Bloomquist (2012).
Model Validation and Calibration
- 2.2
- A two-stage approach is used to validate and calibrate the
IRCM. In stage 1 (validation) the model is executed using values from
the PUF (the "SOI reporting regime" option) and output is compared to
IRS estimates of reporting noncompliance published tax gap studies. The
method of comparison follows the cumulative approach of Axtell and
Epstein (1994). They
propose a hierarchy of four levels at which an ABM can be validated. A
model with Level 0 validity is considered to be a caricature of
reality. At this level the model needs to show only that the system as
a whole exhibits behavior that is consistent with the available data
(e.g., the aggregate response of agents to changing environmental
conditions is in the appropriate direction). At Level 1 the model is
expected to be in qualitative agreement with empirical
macro-structures. This is demonstrated by comparing the distributional
characteristics of the actual population to the modeled population. To
be valid at Level 2 the model must show quantitative agreement with
empirical macro-structures. Finally, at Level 3 the model exhibits
quantitative agreement with empirical micro-structures, as determined
from cross-sectional and longitudinal analysis of the agent population.
IRCM's on-board graphical and statistical routines are used to
demonstrate model validity through Level 2 (Bloomquist
2012). Validation at Level 3 requires panel data on
individuals' tax reporting behavior, which is a standard not yet
available to researchers.
- 2.3
- The goal in stage 2 (calibration) is to find a combination
of values for the six "rule-based reporting regime" parameters that can
closely replicate IRCM output using the "SOI reporting regime" option.
Formally, we want to minimize the sum of differences in reported
incomes between the SOI and rule-based reporting regimes:
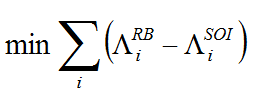
(4) In expression (4),
 is the calculated
reported amount using the rule-based reporting regime in IRCM for
income type i and
is the calculated
reported amount using the rule-based reporting regime in IRCM for
income type i and  is the calculated
reported amount for income type i using the SOI
reporting regime. A solution for expression (4) is found by inspection
using multi-stage Monte Carlo simulation, the details of which are
described in Bloomquist (2012).
is the calculated
reported amount for income type i using the SOI
reporting regime. A solution for expression (4) is found by inspection
using multi-stage Monte Carlo simulation, the details of which are
described in Bloomquist (2012).
Case
Study
- 3.1
- This section presents a simulation experiment that shows
how the IRCM can be used to assess the impact on taxpayer compliance of
alternative audit case selection strategies. For this experiment the
IRCM is executed using the rule-based reporting regime option with
default values for the six parameters. In addition, it is assumed that
if taxpayer j is audited then each of j's
neighbors or co-workers have a 25 percent chance of increasing their
compliance, a 25 percent chance of decreasing their compliance and a 50
percent chance of no change. Both coworker and neighbor reference
groups are assumed to have a fixed size of five members. Default values
were used for all other model options.
- 3.2
- Table 1 displays the output from IRCM for four alternative
audit allocation strategies. The strategy labeled "Random" is the
baseline for comparing all other strategies and represents the direct
effect (Audit Results), total misreported tax, and no change rate when
individuals are randomly selected for a tax audit. Strategy 1
represents a slight improvement over the Random strategy by assigning
more audits to groups of taxpayers with the highest average expected
yield while not auditing more than one percent of taxpayers in a given
audit class. Strategy 2 is similar to Strategy 1 but has no fixed
constraint on the maximum coverage rate for audit classes. This
strategy has the largest direct tax change ($2,739,000) and the lowest
no change rate. However, this strategy also has the lowest deterrence
multiplier (1.5), which indicates that indirect effects (i.e., a change
in compliance behavior of audited taxpayers in subsequent time periods
and "contagion" effects via social networks) account for a relatively
small share of the total compliance impact. Finally, Strategy 3 allows
up to a 10 percent coverage rate within an audit class but also
requires a minimum of five audits for each audit class to ensure a
minimum level of coverage for all taxpayers. This strategy results in
somewhat lower direct effects and higher no change rate (compared to
Strategy 2) but a higher overall reduction in misreported tax. The
larger reduction in misreported tax for Strategy 3 is due to a larger
indirect effect since this strategy affects a broader segment of the
taxpayer population.
Table 1: Comparing Alternative Audit Allocation Strategies 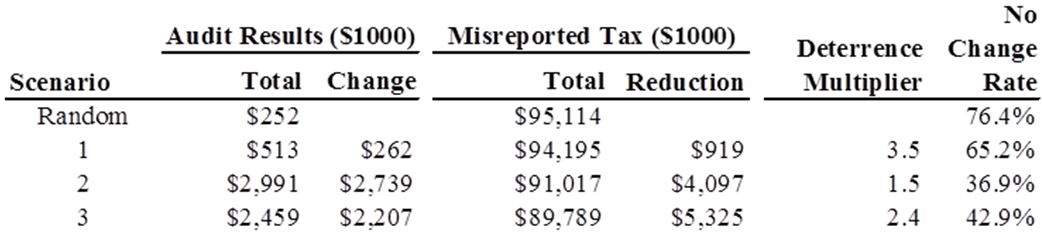
- 3.3
- Figure 6 displays
the time series of the average tax Net Misreporting Percentage (NMP) --
defined as the net amount misreported in the taxpayer's favor divided
by the sum of the absolute values of the amounts that should have been
reported -- of these five simulation runs for the four audit selection
strategies. Based on visual inspection, the model reaches a
stochastically stable solution for all strategies after about 250 time
steps.[1]
Using the simulation output for the last 50 time steps, the random
audit selection strategy has the highest tax NMP at 15.1 percent.
Strategy 1 is the next highest with a tax NMP of 15.0 percent. The NMP
for the Strategy 2 is 14.5 percent. Strategy 3 has the lowest average
tax NMP (highest voluntary compliance) at 14.3 percent.
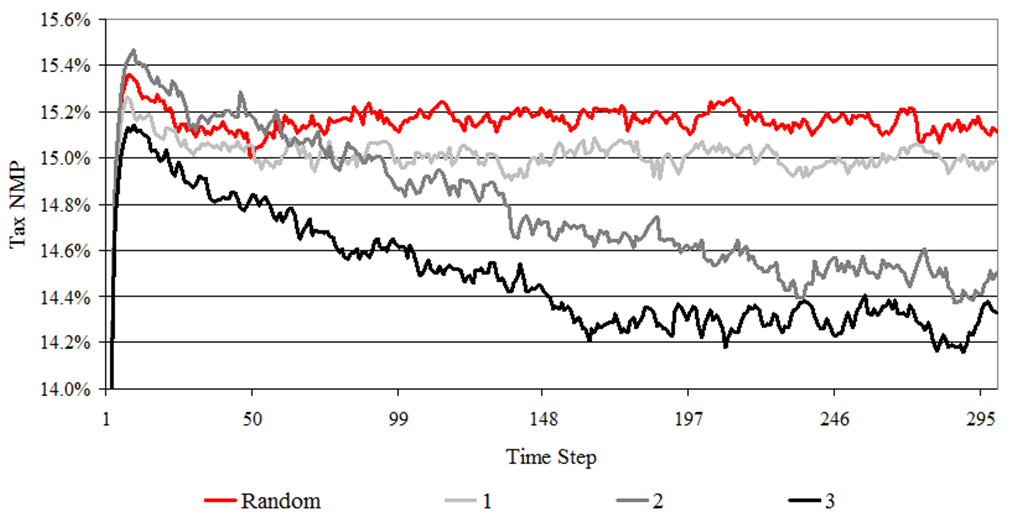
Figure 6. Model Time Series of Tax NMPs for Alternative Audit Selection Strateg
Conclusion
and Future Research
- 4.1
- The development of the IRCM demonstrates that agent-based
simulation is able to model the complexities of real-world tax systems,
such as differences in reporting compliance at the line item level and
taxpayers' heterogeneous response behaviors, which researchers have
found difficult to incorporate in analytical models of taxpayer
reporting behavior (Alm 1999).
The value of having a model like the IRCM grows as our knowledge of
taxpayer behavior improves. Therefore, an important component to future
development and use of ABMs for tax administration is an ongoing
program of research to further identify and restrict, as appropriate,
the behavioral parameters used in such models. Such a research program
must necessarily employ a range of data collection methodologies as
appropriate including laboratory experiments, field studies, and
surveys.
- 4.2
- The IRCM has undergone independent verification and validation testing by analysts at The MITRE Corporation. The model has been ported successfully to both Windows and Mac-OS platforms running Repast 2.0 and MASON. In addition, researchers from the MITRE Corp., in collaboration with the authors, are porting the IRCM to a multi-processor computing environment using Repast HPC to build a national-scale ABM (~108 U.S. taxpayers). Cline et al. (2014) describes the initial stage of this research to port the IRCM from Repast to Repast HPC.
Acknowledgements
- Kim Bloomquist is especially grateful to Professors Robert L. Axtell and Claudio Cioffi-Revilla for their guidance and encouragement on this project, which was done in partial fulfillment of his PhD in Computational Social Science at George Mason University, Fairfax, Virginia. The views expressed herein do not necessarily reflect those of the Internal Revenue Service.
Notes
- 1Having to perform a simulation for 250 time steps to achieve a stochastically stable solution is an artifact of the optimization routine which reallocates a single audit from the least to the most productive audit strategy at each time step. Without this optimization feature selected (i.e. using the default option of random audit selection) a stochastically stable solution is achieved in 10 to 15 time steps. This can be seen in Figure 6 for the Random Audit Selection Strategy.
References
- ALLINGHAM, M.G. &
Sandmo, A. (1972). Income Tax Evasion: A Theoretical Analysis. Journal
of Public Economics 1, 323–338. [doi:10.1016/0047-2727(72)90010-2]
ALM, J. (2010). Testing Behavioral Public Economics Theories in the Laboratory. National Tax Journal 63, 635–658. [doi:10.17310/ntj.2010.4.02]
ALM, J., Martinez-Vazquez, J., & Torgler, B. (2010). Developing Alternative Frameworks for Explaining Tax Compliance. Routledge, New York.
ANDREI, A.L., Comer, K., & Koehler, M. (2014). An Agent-Based Model of Network Effects on Tax Compliance and Evasion. Journal of Economic Psychology 40 (C): 119-133.
ALM, J. (1999). Tax Compliance and Administration. In: Hildreth, W.B. and Richardson, J.A. (eds.), Handbook on Taxation. Mercel Dekker, New York.
ANTUÑES, L., Balsa, J., Respicio, A., & Coelho, H. (2007). Tactical Exploration of Tax Compliance Decisions in Multi-Agent Based Simulation. In: Antuñes, L, and Takadama, K. (eds.), Multi-Agent Based Simulation VII. Springer-Verlag, Berlin.
AXTELL, R.L. (2000). Why Agents? On the Varied Motivations For Agent Computing in the Social Sciences. Center on Social and Economic Dynamics Working Paper No. 27. Brookings Institution, Washington, D.C.
AXTELL, R.L. & Epstein, J. M. (1994). Agent-Based Modeling: Understanding Our Creations. Bulletin of the Santa Fe Institute: 28–32.
BLOOMQUIST, K.M. (2004). Multi-Agent Based Simulation of the Deterrent Effects of Taxpayer Audits. National Tax Association Proceedings: 159–173.
BLOOMQUIST, K.M. (2006). A Comparison of Agent-Based Models of Income Tax Evasion. Social Science Computer Review 24, 411–425. [doi:10.1177/0894439306287021]
BLOOMQUIST, K.M. (2012). Agent-Based Simulation of Tax Reporting Compliance. Doctoral dissertation in Computational Social Science, George Mason University, Fairfax, Virginia. http://digilib.gmu.edu/dspace/bitstream/1920/7927/1/Bloomquist_dissertation_2012.pdf.
CLINE, J, Bloomquist, K.M., Gentile, J.E., Koehler, M., & Marques, U. From Thought to Action: Creating Tax Compliance Models at National Scales. Paper presented at the 11th International Conference on Tax Administration, Sydney, Australia, April 14–15, 2014.
DAVIS, J.S., Hecht, G., & Perkins, J.D. (2003). Social Behaviors, Enforcement and Tax Compliance Dynamics. Accounting Review 78, 39–69. [doi:10.2308/accr.2003.78.1.39]
GEMMELL, N. & Ratto, M. (2012). Behavioral Responses to Taxpayer Audits: Evidence from Random Taxpayer Inquiries. National Tax Journal 65, 33–58. [doi:10.17310/ntj.2012.1.02]
GHALLAB, M., Nau, D., & Traverso, P. (2004). Automated Planning: Theory and Practice. Morgan Kaufmann Publishers Inc., San Francisco, California.
HOKAMP, S. & Pickhardt, M. (2010). Income Tax Evasion in a Society of Heterogeneous Agents – Evidence from an Agent-Based Model. International Economic Journal 24, 541–553. [doi:10.1080/10168737.2010.525994]
JANSSEN, M.A. & Ostrom, E. (2006). Empirically Based, Agent-Based Models. Ecology and Society 11, 37. http://www.ecologyandsociety.org/vol11/iss2/art37/.
KOROBOW, A., Johnson, C., & Axtell, R.L. (2007). An Agent-Based Model of Tax Compliance with Social Networks. National Tax Journal 60, 589–610. [doi:10.17310/ntj.2007.3.16]
MITTONE, L. & Patelli, P. (2000). Imitative Behaviour in Tax Evasion. In: Stefansson, B. and Luna, F. (eds.), Economic Modelling with Swarm. Kluwer, Amsterdam.
NORTH, M.J., Tatara, E., Collier, N.T., & Ozik, J. (2007) Visual Agent-based Model Development with Repast Simphony. Proceedings of the 2007 Conference on Complex Interaction and Social Emergence, Argonne National Laboratory, Argonne, IL USA. https://cc.ist.psu.edu/BRIMS2013/archives/2008/Tutorials/08-BRIMS-001.pdf. Archived at http://www.webcitation.org/6LIwtrn5z.
SZABÓ, A. Gulyÿs, L., & Tóth, I.J. (2008). TAXSIM Agent Based Tax Evasion Simulator. Paper presented at the European Social Simulation Association Conference (ESSA).
WEBER, M. (2004). General Description Booklet for the 2001 Public Use Tax File. Individual Statistics Branch, Statistics of Income Division, Internal Revenue Service.
ZAKLAN, G., Westerhoff, F., & Stauffer, D. (2009). Analysing Tax Evasion Dynamics via the Ising Model. Journal of Economic Interaction and Coordination 4, 1–14. [doi:10.1007/s11403-008-0043-5]