
 Abstract
- This paper presents the agent-based model INFSO-SKIN, which provides ex-ante evaluation of possible funding policies in Horizon 2020 for the European Commission’s DG Information Society and Media (DG INFSO). Informed by a large dataset recording the details of funded projects, the simulation model is set up to reproduce and assess the funding strategies, the funded organisations and projects, and the resulting network structures of the Commission’s Framework 7 (FP7) programme. To address the evaluative questions of DG INFSO, this model, extrapolated into the future without any policy changes, is taken as an evidence-based benchmark for further experiments. Against this baseline scenario the following example policy changes are tested: (i) What if there were changes to the thematic scope of the programme? (ii) What if there were changes to the instruments of funding? (iii) What if there were changes to the overall amount of programme funding? (iv) What if there were changes to increase Small and Medium Enterprise (SME) participation? The results of these simulation experiments reveal some likely scenarios as policy options for Horizon 2020. The paper thus demonstrates that realistic modelling with a close data-to-model link can directly provide policy advice.
- Keywords:
- Research Networks, Policy Modelling, Simulation Laboratory, EU Research Landscape
Introduction
- 1.1
- This paper has two objectives: its broader objective is to present a case study demonstrating that policy modelling using Agent Based Modelling (ABM) can assist policymakers in their decision processes; as a secondary objective, the paper examines a set of concrete research questions about the potential impacts of several European Commission research funding policy options.
- 1.2
- To address these two objectives, the SKIN model[1] (Gilbert, Ahrweiler & Pyka 2014), is used for ex-ante impact assessment of Information and Communication Technologies (ICT) research in the Commission's research funding scheme, Horizon 2020. This was the subject of a tender study for the Evaluation Unit of the Directorate General for the Information Society and Media (DG INFSO) (http://ec.europa.eu/dgs/information_society/evaluation/index_en.htm).
- 1.3
- Policy modelling means to identify areas that need intervention, to specify the desired state of the target system, to find the regulating mechanisms, policy formation and implementation, and to control and evaluate the robustness of interventions (John 1998). The methodological difficulty is to bridge the gap between policy practice, often expressed in qualitative and narrative terms, and the scientific realm of formal models. Furthermore, policymaking in complex social systems is not a clear-cut cause-effect process but is characterised by contingency and uncertainty. To take into account technological, social, economic, political, cultural, ecological and other relevant parameters, policy modelling has to be enhanced and supported by new ICT-oriented research initiatives.
- 1.4
- What and how can modelling and simulation contribute to policy making in research and innovation? Worldwide, every year, governments spend billions on promoting research and development (R&D) and innovation (e.g. for the current funding scheme, Horizon 2020, covering the period 2014–2020, the European Commission will spend about €70B). Datasets and simulations for the policy-making community are needed that could be used to inform decisions by the European Commission and national Governments when they aim to support innovation.
- 1.5
- The first conceptual frameworks for understanding policy interventions in social systems were linear. This has been true for all policy areas, whether they be regulatory (Bulmer 2007), distributive (Eijffinger & Haan 2000), or coordinative. However, it began to be realised that the linear top-down idea of triggering a desired system performance on the macro level was clearly amiss (cf. Sabatier 2007). The resulting critique of the linear model led to concepts such as the garbage can model of policymaking (Kingdon 1984).
- 1.6
- Policymaking in complex social systems is characterised by contingency and uncertainty. These terms were used to criticise the principal-agent theory of policymaking following the observation that the principal is not able to control the agent but has a serious contractual problem (Braun & Guston 2003; Dinar et al. 2008). Policymakers face policy problems in contexts: an agent who is subject to certain strategic behaviours of other agents is located in a technological, regulatory, political, economic context, has a certain experience and history of others' strategic behaviours, is situated in a certain competition/cooperation structure with other agents, is changing over time and so on.
- 1.7
- Furthermore, strategy formation is no longer a privilege of governmental actors. In most policy domains, the term "governance" hints at the fact that there are non-governmental actors involved in policymaking and control issues (Fukuyama 2004). The term "organisational governance" (Foss & Klein 2007) refers to the fact that coordination mechanisms appear from the interaction of participating agents in a sector. These strategies and coordination mechanisms might further interfere with desired goals and impacts of governmental policy strategies.
- 1.8
- The policy process can give rise to all sorts of positive feedback mechanisms: changes in policy lead to changes in actor behaviour, which can again invoke new policy problems. Alternative models, such as the neo-liberal model of policy making, therefore erased the notions of sequentiality and linearity, and centred instead on processes of recursive learning, self-organisation, and non-linear dynamics (Prasad 2006).
- 1.9
- The problems with techniques that rely on the linearity of societal processes and predictability of future states inferred from past data and estimated from simple explanatory models such as forecasting (cf. Kress & Snyder 1994; Makridakis et al. 1998; Rescher 1998) have been discussed along the same lines. For an evidence-based (Davies et al. 2000; Pawson 2005) and computational approach to policy design we need the ability to identify potential futures (Clapham et al. 1980). Since it is impossible to predict future system states due to the underlying complex micro dynamics of social systems, even for foresight exercises (Loveridge 2007), it would not be reasonable to insist on examining the most likely future scenario but to compare and analyse interventions, their side effects, their bottlenecks and constraints in a set of possible future developments.
- 1.10
- Reviewing the current state-of-the-art of policy context analysis such as forecasting, foresight, backcasting, impact assessment, scenarios, early warning systems, and technology roadmapping (see literature review in CROSSROAD State-of-the-Art Analysis 15.04.2010 , pp. 143–163), the need for policy intelligence dealing with complexity becomes more and more obvious. "There is a gap of appropriate tools and technologies to support existing and well established methodologies for policy context analysis and strategic planning. Besides, often only isolated applications exist, which are strongly customized to a specific purpose and, therefore, cannot be reused for different purposes. Hence, scalability of current tools and technologies in the field of policy context analysis and strategic planning is very low" ( CROSSROAD Final Gap Analysis Report, 13.08.2010, p. 54). A particular challenge is the relationship between large-scale quantitative data and formal policy models. This is a twofold issue: First, providing knowledge discovery and data mining techniques for large and heterogeneous databases is generally required for policy analysis. Second, to connect these large databases to formal models constitutes a methodological gap in the existing state-of-the-art.
- 1.11
- Advanced ICT tools are being developed for research and
innovation policy modelling, prediction of policy impacts, development
of new governance models and collaborative solving of complex policy
problems. These tools enable the modelling of R&D policy
initiatives and the simulation of the impacts of proposed R&D
policy measures. The approach and the related research is novel in two
respects:
- It focuses on knowledge exchange and mutual knowledge creation in innovation and research networks. Since collaborative innovation has become the dominant and most promising way to produce high-quality output (Bozeman & Lee 2005), these collaboration structures have become an important target for policy interventions as well as for the evaluation of policy impacts. Without the consideration of interactions among heterogeneous actors in networks, knowledge generation and diffusion processes cannot be understood and effective policy instruments cannot be designed;
- It allows for considering innovations as real novelties. The traditional methodological framework referring to optimal decision making is no longer applicable. Policy design and evaluation methods in this area are challenged by the imponderability of research and innovation, which are characterised by true uncertainty and are exposed to failures (Knight 1921). Therefore, optimization approaches are not suited; instead innovation research has to acknowledge the possibility of novel behaviours (including failure) as a likely outcome, which, however, might be considered as an important source of knowledge to guide further research.
- 1.12
- Recent studies of networks and their dynamics indicate that the success of innovation networks is related to their specific structures as well as the mechanisms of network evolution. The emergence of these network structures and their underlying dynamics are not accessible with numerical simulations. There is scope for the improvement of the policy instruments used to create and to support innovation networks.
- 1.13
- In this paper we introduce agent-based modelling as an alternative approach which allows for the explicit consideration of true uncertainty in innovation as well as the interaction of heterogeneous agents in research and innovation networks (Fagiolo & Pyka 2007).
The model
- 2.1
- Our model (Simulating Knowledge Dynamics in Innovation Networks, SKIN)[2] allows users to address questions that involve different levels of the innovation ecosystem: from start-up firms (micro level) to academic-industry partnerships (meso level) to whole sectors or regions (macro level). It also can be calibrated using large empirical data sets.
- 2.2
- "SKIN is a multi-agent model containing heterogeneous agents that act and interact in a complex and changing environment. The agents represent innovative actors who try to sell their innovations to other agents and end users but who also have to buy raw materials or more sophisticated inputs from other agents (or material suppliers) in order to produce their outputs. This basic model of a market is extended with a representation of the knowledge dynamics in and between the agents. Each agent tries to improve its innovation performance and its sales by improving its knowledge base through adaptation to user needs, incremental or radical learning, and co-operation and networking with other agents" (Gilbert, Ahrweiler & Pyka 2010, 235).
- 2.3
- SKIN is grounded in empirical research and theoretical frameworks from innovation economics and economic sociology. It is the result of a number of projects that combined empirical research into innovation networks with agent-based simulation. The work started with the EU project "Simulating self-organising Innovation Networks" (SEIN). This project combined five empirical case studies in different sectors of technological innovation and in different EU member states with agent-based simulation of these case studies.
- 2.4
- The results of the SEIN project are summarised in Pyka and Kueppers (2002). Case studies described knowledge-intensive European industry sectors such as the biotechnology-based pharmaceutical industry in France (Pyka & Saviotti 2002), combined heat and power technology networks in The Netherlands, Germany and the UK (Weber 2002), knowledge-intensive business services in the UK web design industry (Windrum 2002), and the UK Virtual Centre of Excellence in the European telecommunication industry (Vaux & Gilbert 2002). The task of the SEIN project was threefold: theory formation, empirical case studies, and agent-based simulation. The objective was to derive a theory of innovation networks from insights derived inductively from the case studies and to implement this theory of innovation networks into an agent-based model.
- 2.5
- The result of the modelling activities was a model grounded in empirical research and informed by empirical data coming from the case studies (Gilbert, Pyka & Ahrweiler 2002). The model was used by the European Commission for scenario modelling of current and future innovation policy strategies (Ahrweiler, de Young & Windrum 2002) referring to the technological sectors and EU Member States of the case studies. In this respect, the model is currently unique in its field (cf. Watts & Gilbert 2014).
- 2.6
- In the INFSO-SKIN application, agents are R&D
organisations (universities and research institutes), R&D
departments in Large Diversified Firms (LDFs) and Small and Medium
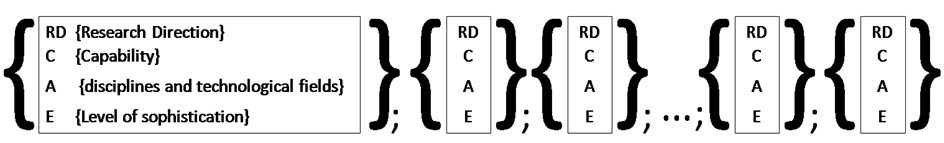
sized Enterprises (SMEs). Each agent has a kene, which in this case is
a "quadruple". A quadruple includes the following elements: Research
Direction (RD) represented by an integer, Capabilities (C) represented
by an integer, Abilities (A) represented by a real number and Expertise
(E) represented by an integer.
- 2.7
- The research direction (RD) represents the general knowledge orientation, which can be related to basic or applied research. A value of 0 indicates completely theoretical knowledge (i.e. basic research); higher values indicate an increasingly applied orientation; a value of '9' means exclusively applied research. For every knowledge field, applied as well as fundamental research directions exist. These research directions are included in the actors' quadruples to allow for a differentiation between e.g. university and firm actors. The capabilities (C) represent different knowledge areas and technological disciplines e.g. biochemistry, telecommunications or mechanical engineering. For modelling purposes the number of different capabilities has to be chosen to be large enough to cover all potential research areas that are encompassed in the European Framework Programmes. The knowledge space is structured: for example 800 different capabilities are divided equally among each of eight themes. The ability (A) represents the actors' specialisation in the capabilities' fields. In biochemistry, for instance, abilities are protein design, genomics, combinatorial chemistry, bioinformatics, filtering etc. The expertise (E) stands for the advancement of an actor's skills in the respective knowledge field.
- 2.8
- In INFSO-SKIN, three different types of agents: research
institutions including universities (RES), large diversified firms
(LDFs) and small and medium-sized enterprises (SMEs), are implemented;
see Table 1.
Table 1: Agent types and attributes Agent types Contribution (indicated by length of kene) Objectives Research<br>Direction Capacity for partnerships RES Variety of knowledge Publications, Patents Basic or Applied Large (>2) LDFs Variety of knowledge Patents Applied Large (>2) SMEs Specialised knowledge Patents, Publications Applied Small (1 or 2) - 2.9
- The general behaviour of the agents follows an empirical
understanding of the phases in network formation and evolution of the
Framework Programmes, which was previously the subject of a SKIN study
using the SKEIN model "Simulating Knowledge Dynamics in European-funded
Innovation Networks" (Scholz et al.
2010). The remainder of this section details the procedures
followed by the agents.
Policy incentives and rules for R&D collaboration
- 2.10
- The EU provides funding for collaborative research. The
rules are defined in the Framework Programmes (e.g. rules for project
consortia, research topics, time span of the FP etc.). INFSO-SKIN was
developed to model Framework 7 (FP7), the Seventh Research Funding
Programme of the European Commission, running from 2007–2013 and the
predecessor of the current Horizon 2020 programme. Actors (research
institutes, firms etc.) want to apply for funding. The Calls of the
Commission specify:
- The type of instrument. This may either be IP or STREP; IP stands for "Integrated Project" and is the funding scheme for financing large projects with many partners; STREP stands for "Specific Targeted Research Project" and is the funding scheme for financing comparatively small consortia. The instrument specifies the minimum number of partners in a consortium, the composition of partners, and the length of the project.
- The date of Call (to determine the deadline for submission).
- A range of capabilities, a sufficient number of which must appear in an eligible proposal (how many is sufficient depends on the type of instrument, e.g. lower for a narrowly focused STREP than for a IP with a broad scope).
- The funding available for this Call.
- The number of projects that will be funded.
- The desired basic or applied orientation.
Process of consortium formation / partner choice
- 2.11
- The agents form project consortia. Partner choice mechanisms apply. Firstly, the agent looks at the list of its previous partners. Secondly, previous partners that agreed to join the proposal can add previous partners from their list. Thirdly, new partners will be searched for. The search process is guided by the requirements outlined in the Call, a list of capabilities. The proposal is considered to be eligible only if a sufficient number of these capabilities appear. If no agent from the list of previous partners can contribute such a capability in the first iteration, then in the second iteration previous partners of those agents that agreed to join the proposal can ask their previous partners. If the required capability is still not found, the proposal consortium can search for the knowledge in the population of all agents. This is done on a random basis. During each iteration, \(n\) agents can be asked whether they have the respective capability and whether they want to join the proposal consortium. The possibilities to join a proposal consortium are determined by the same rules as for the determination of project initiations (see next step). The length of the kene determines whether the agent has free capacities for new activities. For example, an SME, whose kene is of minimum size (i.e. five quadruples) and which is already in a project or a proposal consortium has to reject the offer.
- 2.12
- The agents in a collaboration produce a proposal,
representing the relevant knowledge of the partners. The consortium
submits the proposal to the Commission. Each agent contributes one or
more capabilities. The upper bound on how many capabilities an agent
can contribute depends on the size of the agent's kene. If the agent
has only one of the capabilities specified in the Call, it contributes
this capability. If the agent has none of the required capabilities, it
declines to join. A proposal will be submitted if a sufficient number
of capabilities appear.
Process of proposal selection
- 2.13
- The Commission evaluates the proposals according to a
template that emphasises the contents (programme match), and the
quality and architecture of the consortium (e.g. minimum number of
members, industry involvement etc.). Proposals need to have sufficient
partners with a sufficient number of capabilities as specified in the
Call to be considered eligible. All proposals that fulfil the
eligibility criteria are then ranked according to the average expertise
level of the proposals (i.e. the expertise levels of the capabilities
are summed and divided by the number of quadruples in the proposal). If
some proposals turn out to have the same average expertise level, the
tied proposals are ordered according to the number of the capabilities
in the proposal that were specified in the Call. If, after the
application of this rule, proposals are still ranked equally, one of
them is selected at random. As many proposals as specified in the Call
are then selected working down the ranked list. Proposal consortia that
are not successful are dissolved. Those consortia that are selected
start their projects.
Process of R&D cooperation
- 2.14
- The projects start to work on a "project hypothesis", i.e.
they are involved in research and cooperative learning activities. They
produce deliverables (e.g. a number of publications and patents). The
research in the projects follows the ideas of SKEIN (Scholz et al. 2010). Agents in
project consortia are randomly allocated to sub-projects and combine
their kenes. Every three months they produce an output (deliverable),
which can be a publication or a patent. A transformation function for
the project hypothesis produces (i) a number between 0 and 1, which
decides on the type of outcome and (ii) a figure describing the
probability of success of the project hypothesis. The potential outcome
(publication or patent) depends a) on the research orientation of
actors (i.e. an applied research orientation increases the probability
of a patent whereas a basic research orientation decreases this
probability); b) the variance in capabilities involved in a project
hypothesis – the lower the variance, the lower the probability of a
patent. The research undertaken in projects is incremental (abilities
are substituted, expertise levels are increased). The potential of a
radical innovation is realised only when the proposal is put together
in the sense that new capability combinations can appear in consortia.
SMEs are important candidates for contributing new capabilities and
their involvement increases the likelihood for radical innovation. New
knowledge is injected into the system most often by new, small and
sophisticated companies. In order to allow the SMEs to play their
special role we define 10 capabilities per theme as "rare" capabilities
and give these capabilities in the starting distribution exclusively to
SMEs. The learning processes and knowledge sharing in the projects
follow the SKEIN version (Scholz et
al. 2010). The expertise levels of the capabilities used for
the deliverables increase at each iteration. Capabilities of
deliverables are exchanged among partners to model knowledge transfer
in projects. At the end of the project all results are delivered to the
Commission. The following flowchart shows this modelling cycle of
INFSO-SKIN:
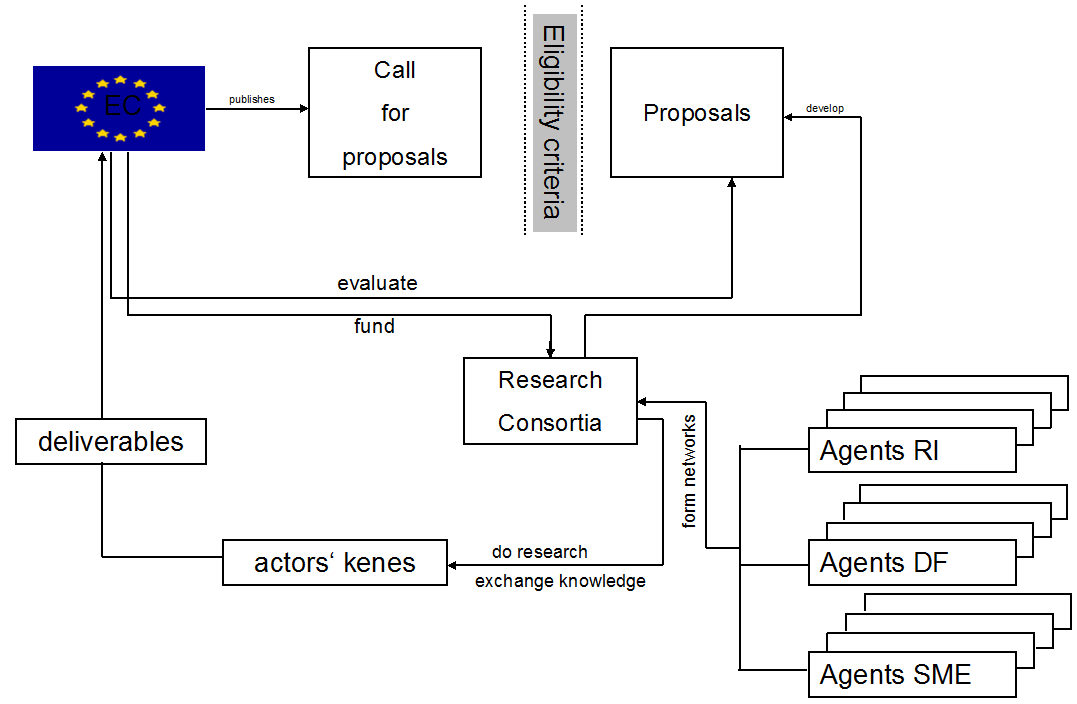
Figure 1. Flowchart of INFSO-SKIN - 2.15
- We define an iteration of the simulation to correspond to
one month. This allows us to represent all processes in a reasonable
order. For example, when a new Call is published, the deadline for a
proposal is six months away, i.e. the agents have six time steps to set
up a consortium and to "write a proposal". Another example is the
length of research projects (e.g. three years, giving 36 iterations for
consortium members to improve and exchange knowledge.) Picture A1 in
the Appendix shows a flowchart of the above model narrative; Picture A2
details each step.
Funding decisions in the model
- 2.16
- The funding dimensions of the framework, instruments,
calls, proposals and projects are implemented in the following way:
- for the Framework, a (global) value for total funding is set.
- for instruments, a multiplier is defined that relates to the average funding per partner per month. (The distribution of the index for FP7 is bell-shaped with equally long tails of "rich" and "poor" projects.)
- for Calls, the available funding is set as a percentage of the total Framework funding.
- for proposals and projects, the required EC contribution is calculated using the formula: (contribution) = (multiplier) × (size) × (duration)
- in the evaluation of proposals, the number of projects that will be funded depends on the required contributions for the highest ranked eligible proposals and the available funding for the call.
Parameters and measures
- 2.17
- The Instruments are pre-defined at the model set-up.
Differences between the Instruments are defined by the set of
parameters that can be adjusted before running the simulation (List 1
of the Appendix). The list of Calls is pre-defined at the model set-up,
according to the list of Instruments. The set of parameters for each
Call can be adjusted before running the simulation (List 2 of the
Appendix). In response to the (open) Calls, the agents create new
proposals and recruit their partners. Meanwhile (and as result of their
interactions), the agents develop their kenes. The model's interface
provides information about the overall collaboration network of the
programme, the nodes being the organisations that are beneficiaries of
funding and the edges being the links to their partners. This network
has certain structural properties (List 3 of the Appendix). In addition
to these measures about the collaboration network, the model's
interface provides several statistics on the participants, proposals
and projects over the course of the simulation (List 4 of the
Appendix). The statistics on project consortia provided by the model's
interface (List 5 of the Appendix) help to interpret the collaboration
network measures (e.g. a high percentage of small projects can explain
a low network density).
Creating the starting configuration
- 2.18
- To find a realistic starting configuration, the model was
calibrated using an existing database of the ICT project networks
funded by DG INFSO. Figure 2
shows the structure of the database. First, a list of IP and STREP
projects from the first FP7 call is retrieved from the database. Agents
(research institutes, diversified firms and SMEs) are created, based on
the organisations that are listed as participants of these projects.
Links are created between all the members of the projects. To give the
opportunity for the network to grow by connecting so-far unconnected
agents to the existing (starting) network, additional agents are then
created up to a user-specified number. In reality, there are many
research organisations that write proposals which are not then funded.
However, the DG INFSO database contains no data about such
organisations. We therefore had to estimate the number of additional
agents (we used 3000) that is sufficient to allow the network to grow.
These additional agents are not part of the starting network.
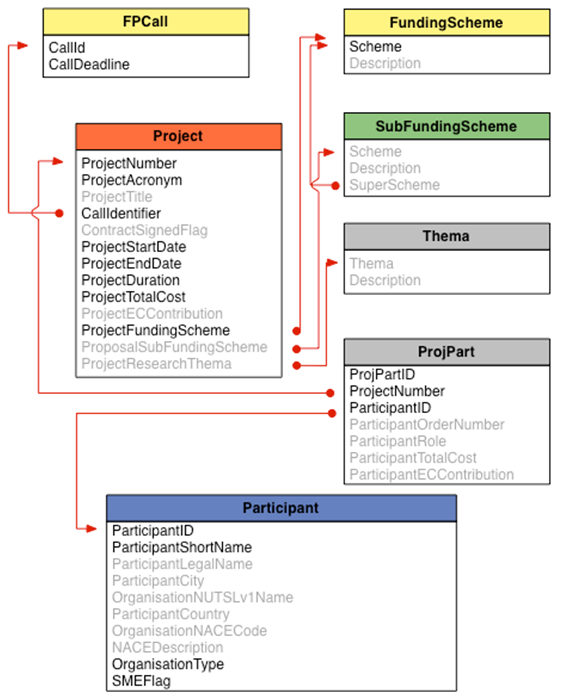
Figure 2. Database structure from DG INFSO for starting networks in INFSO-SKIN. Highlighted items were used to calibrate the simulation. - 2.19
- Participant size, a measure of the capacity of organisations to interact and exchange knowledge, is based on total FP7 funding, information read from the DG INFSO database. For very large participants (such as the French CNRS, which encompasses many research groups and centres located throughout France), multiple agents (proportional to the funding) were created to represent the organisation. Agents are endowed with their initial kenes (capabilities, abilities, expertise levels and research directions) using randomised designs for the agent types, based on the model's partitioning (with 9 themes, common/rare capabilities) of the knowledge space, in a way that results in a distribution similar to that shown in Figure 3. The Calls of FP7 cover eight thematic areas, but one extra is created in order to accommodate the first policy experiment, which examines the effect of increasing the coverage with an additional theme. The ninth theme is left unpopulated in all the other experiments.
- 2.20
- Instruments and Calls are then created to complete the
setup procedure.
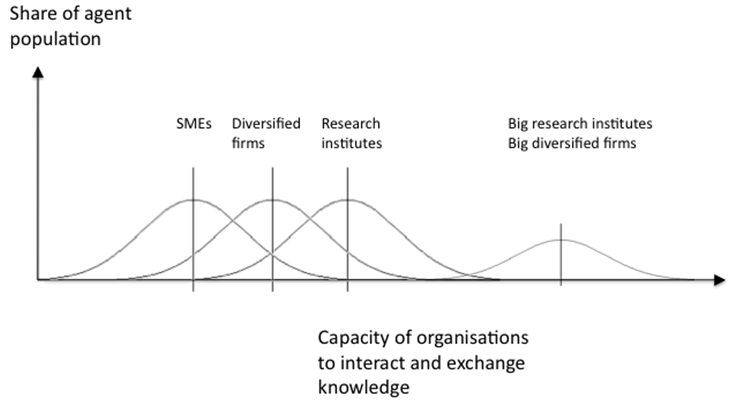
Figure 3. Configuration of initial capacity of organisations
The
Baseline Scenario
- 3.1
- For the Calls 1–6 that have actually occurred in FP7, we
have data on the number of participants (funded organisations
differentiated between research institutes (RES), large diversified
firms (LDFs) and small and medium sized enterprises (SMEs)), and the
number of funded projects. Furthermore, we have information on the size
of the projects as measured by the number of participants, the duration
of the project, and the average funding per project. Analysing this
information provides empirical information on important network
indicators. These numbers can be used to calibrate and validate the
model.
Replications and confidence limits
- 3.2
- The number of replications used for calculating statistics
about the Baseline Scenario and each of the experiments is 15. This is
sufficient for convergence and yields a small enough confidence
interval for the set of indicators used (see Figure 4).
The issue of the number of simulation replications is covered in
Robinson (2004, Chapter
9).
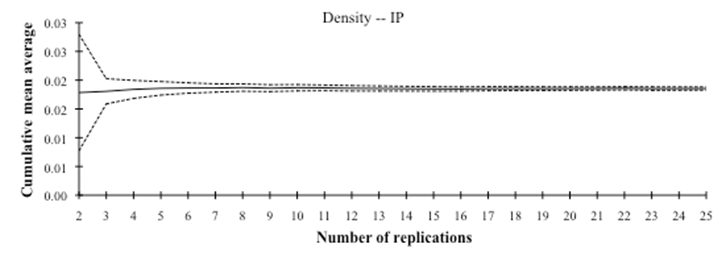
Figure 4. An example of convergence and confidence intervals (shown for the density indicator, Baseline Scenario, IP - 3.3
- The simulated data for the Baseline Scenario is summarized
using corridors marking the 95% confidence interval around the mean
(Figure 5). Most of the plots
for each of the 15 replications will lie within this corridor. Note
that the summarizing tables in this paper only present the end value
(after 112 months) and the standard deviation.
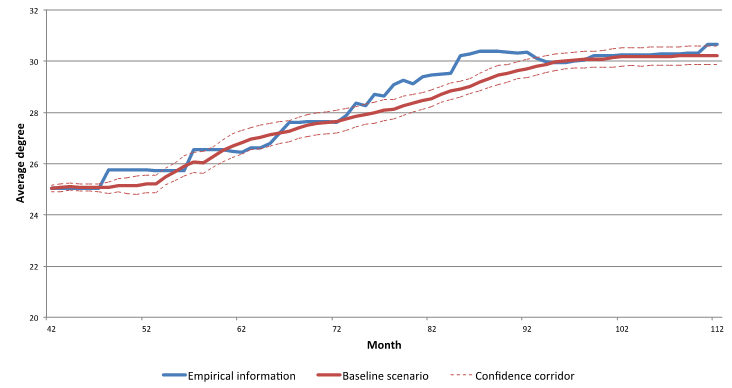
Figure 5. Corridor for simulated data (shown for average degree indicator, Baseline Scenario, IP) - 3.4
- Comparing the empirical and – for the Baseline Scenario –
the simulated data, the next two tables below summarise all values per
instrument (IP and STREP). The values where we have empirical
information are in bold. Values for the empirical "unobservables"
(proposal writing activities, the amount of knowledge held by the
agents, and knowledge flows between the agents in the network) are in
italic and can be obtained only from the simulation.
Table 2: Results of Baseline Scenario (Sim) per instrument (IP) compared with the empirical data (Emp). N/A = Not available (unobservable) Emp IP Sim IP (15 runs) Mean St dev
ParticipantsRES in projects 599 569.7 16.572 LDFs in projects 458 501.3 14.105 SMEs in projects 462 520.1 18.928 Participants in proposals (avg) N/A 2.578 0.083 Participants in projects (avg) 1.968 2.002 0.030
ProposalsNumber of proposals N/A 347.5 19.276 proposals-size-avg N/A 13.682 0.187 proposals-capability-match-avg N/A 19.4 0.229
ProjectsNumber of projects 209 206.9 7.652 Consortium size (avg) 15.383 13.622 0.213 Project duration (avg) 41.2 41.0 0.000 Project funding (avg) 7.9 7.6 0.118
KnowledgeKnowledge per participant N/A 16.4 0.054 Knowledge flow per project N/A 13.8 0.221
CapabilitiesCapability diffusion (Theme 1-8) N/A 0.729 0.006 Capability diffusion (Theme 9) N/A 0.706 0.007 Capability frequency (avg) N/A 54.6 0.178
NetworkDensity 0.019 0.018 0.001 Number of components 1 1.0 0.000 Size of the largest component 1634.0 1634.2 37.474 Diameter 4 4.067 0.258 average-path-length 2.539 2.620 0.017 average-degree 30.7 30.2 0.532 average-clustering 0.840 0.728 0.007 Table 3: Results of Baseline Scenario per instrument (STREP). N/A = Not available (unobservable)
Emp STREP Sim STREP (15 runs) mean st dev Participants RES in projects 786 809.9 12.738 LDFs in projects 522 692.3 8.464 SMEs in projects 747 804.6 11.005 Participants in proposals (avg) N/A 4.022 0.095 Participants in projects (avg) 2.354 2.340 0.021 Proposals Number of proposals N/A 1292.1 35.789 proposals-size-avg N/A 8.231 0.056 proposals-capability-match-avg N/A 11.0 0.068 Projects Number of projects 644.0 592.3 5.496 Consortium size (avg) 8.025 8.208 0.072 Project duration (avg) 34.2 34.0 0.000 Project funding (avg) 2.8 3.0 0.028 Knowledge Knowledge per participant N/A 17.1 0.048 Knowledge flow per project N/A 6.8 0.145 Capabilities Capability diffusion (Theme 1-8) N/A 0.745 0.010 Capability diffusion (Theme 9) N/A 0.704 0.006 Capability frequency (avg) N/A 57.0 0.160 Network Density 0.008 0.009 0.000 Number of components 2 1.0 0.000 Size of the largest component 2190.0 2349.7 18.495 Diameter 6 5.000 0.000 average-path-length 2.846 2.846 0.015 average-degree 17.0 20.4 0.176 average-clustering 0.812 0.603 0.005 - 3.5
- Tables 2 and 3 confirm that the model achieves a
good match between the empirical and the simulated number of
participants and projects. Figure 6
shows the distributions of number of participants per project (project
size) and funding per instrument (project contribution) for the
Baseline Scenario and for the empirical data.
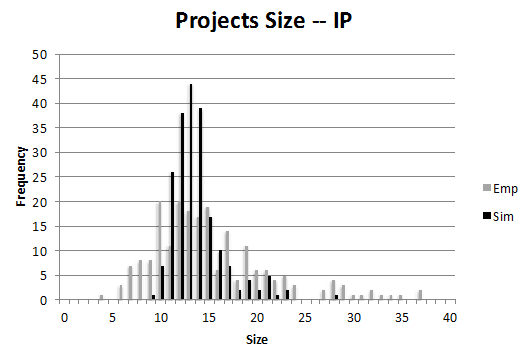
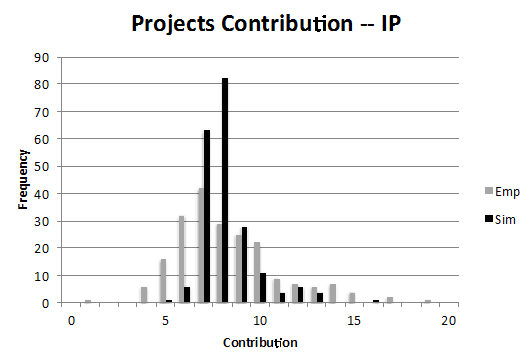
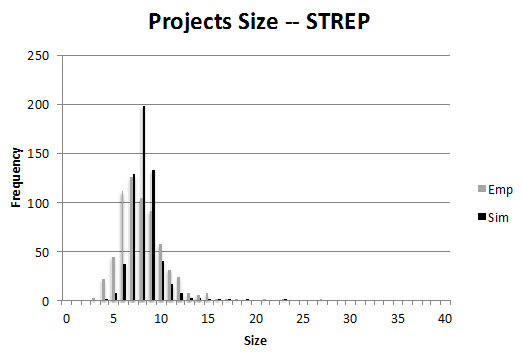
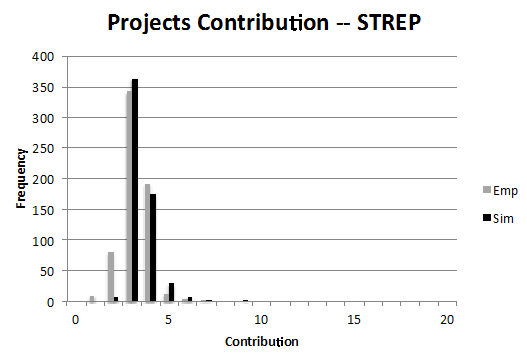
Figure 6. Distributions of projects size and funding per instrument (IP and STREP) for the Baseline Scenario (Sim) compared with the empirical distributions (Emp) - 3.6
- The figures illustrate the distributions of the number of actors in consortia (project size) and the financial size of projects (project contribution). For both STREPs and IPs, we observe a few large consortia and financially larger projects. There are some very large IP projects in the empirical data in the first of these four figures. We consider them to be a consequence of administrative actions by the Commission, merging certain projects, not an endogenous outcome. The empirical information on participants and projects is more or less matched by the calibrated simulation.
- 3.7
- The development of the empirical largest component and of
the largest component of the simulated baseline scenario over the 112
months of the simulated Programme is displayed in Figure 7. This indicator comprises the
number of agents who can in principle be reached by traversing links
between agents within the largest coherent part of the network. One of
the basic aims of Framework Programmes is to contribute to the
establishment of a European research landscape and the size of the
largest component can be interpreted as a measure of the achievement of
this goal. The largest component remains at the initial size for 42
months and only then starts to increase because of an artefact: in the
simulation, participants announce their updated partner lists only once
a project has finished, which correspond to a six months proposal
writing period plus 36 months project work after the first Call has
been published.
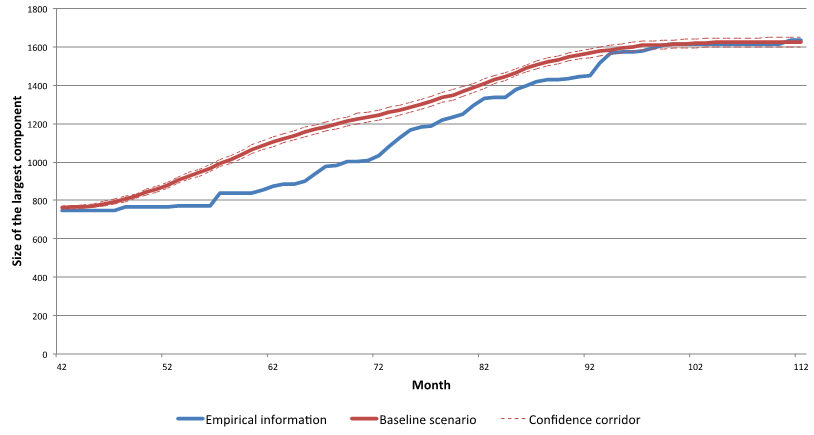
Figure 7. Development of the largest component
Note. Due to the small number of replications, the corridors in this and next figures were constructed using t-based confidence intervals (95%). - 3.8
- The second indicator is the network density, which
describes the overall level of linkage among the actors. It is the
number of links between actors, expressed as a percentage of the
maximum possible number of links. The indicator measures the effects of
policy interventions on the extent and speed of knowledge diffusion in
the network. Higher density values indicate faster potential diffusion
of knowledge; lower values indicate a reduction in the potential speed
of diffusion. Although the interpretation of the density is
straightforward, one has to keep in mind that it is a relative measure
and its magnitude depends on the overall network size. Therefore,
densities of networks of different sizes cannot be compared. As
indicated by the growth of the largest component we are confronted with
growing networks, which lead to a decreasing density over time (Figure 8).
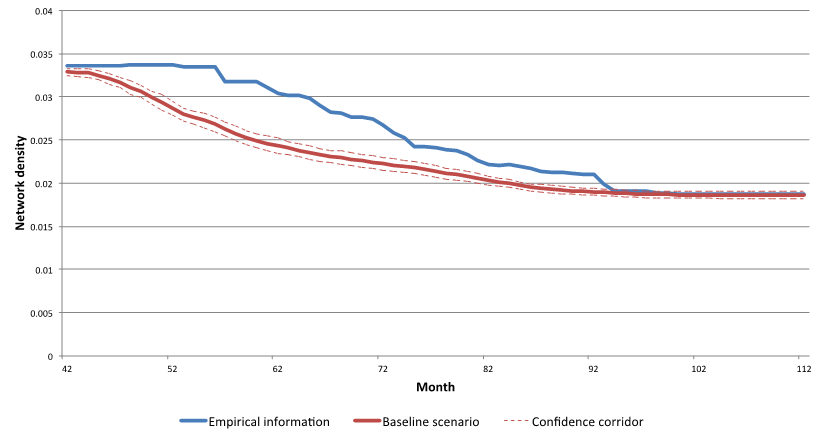
Figure 8. Development of the network density - 3.9
- The average degree and the degree centrality are widely
used indicators from Social Network Analysis, especially in cases where
large networks of varying sizes are analysed. The average degree simply
divides the sum of the number of connections of every agent by the
number of agents and gives a rough idea of the overall direct
connectivity of the agents, an indicator of the cohesion of the
network. Figure 9 shows the
empirical and simulated development of the average degree. Because the
degree is increasing in later periods we conclude that the cohesion of
the network increases despite the decreasing density.
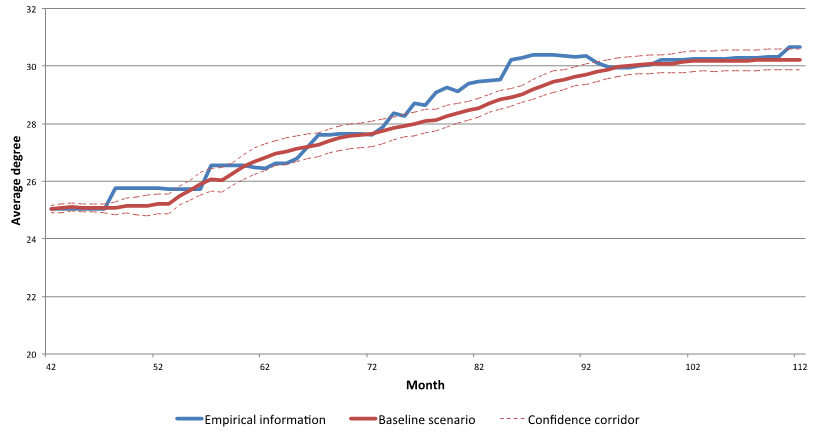
Figure 9. Development of the average degree - 3.10
- However, the stage of development of the network's
knowledge base also matters. In early exploratory stages the average
degree might decrease because new actors bring in new knowledge fields;
for more mature knowledge bases, a decreasing average degree might
indicate a dissolving network. The structure of the research networks
referring to the various knowledge fields and their connections can be
approximated by the average clustering coefficient of the network.
Higher clustering coefficients indicate that research networks are
characterized by highly connected subgroups of agents that are only
loosely connected by few linkages. For such networks, actors who might
act as boundary spanners can be critical for the transmission of ideas.
Figure 10 illustrates that in
the simulated networks, clustering is decreasing and therefore
structural holes between different knowledge areas are increasingly
closed.
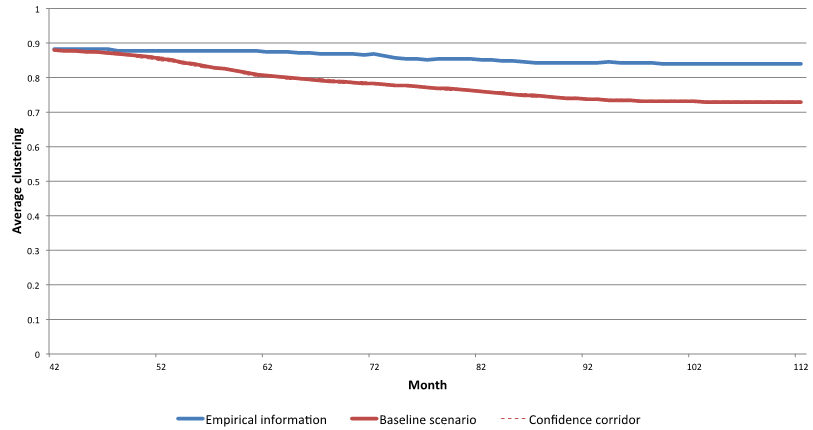
Figure 10. Clustering in the networks - 3.11
- The average path length is defined as the average number of
steps along the shortest paths between all possible pairs of agents in
a network. In the case of knowledge transfer, the quality of knowledge
exchange processes is negatively affected by increasing path length.
Figure 11 displays, for both
the baseline scenario and the real network, the development of the
average path length. In both cases, there is a decrease in average path
lengths over time. This result can be interpreted as a success for
network policies in FP7. In Figure 11,
the empirical trend is stronger than the simulated one; the difference
can be traced back to the construction of the database, which only
includes actors in consortia whereas the simulated data also includes
unconnected actors, leading to the relatively higher values of this
indicator.
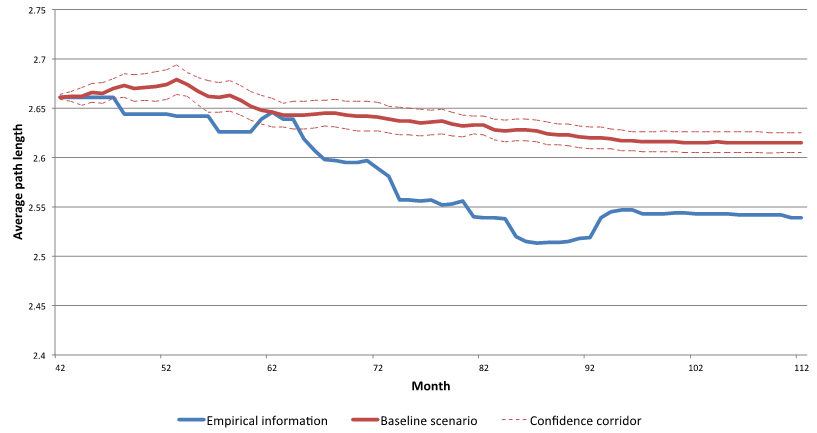
Figure 11. Average path length - 3.12
- In the tables for the experiments that follow in the next section, there are two indicators listed: the actual number of proposals (proposals), and the thematic match between proposal requirements in terms of knowledge capabilities and the capabilities recorded in the submitted proposals (cap-match). The number of proposals produced in the simulation is about double the number of projects that are funded. This means a model success rate for proposals (IP and STREP) of approximately 50%, which is well above the empirical success rate of 20% according to FP7 subscription statistics (source: FP7 Subscription, Performance, Implementation report, 2007–2008). However, in this case we do not need an empirical match, because the agent population in the simulation does not mirror the number of all potentially participating organisations in the European funding landscape that could theoretically submit proposals. We just need a realistic evaluation procedure with the acceptance conditions for submitted proposals set so that the number and size of accepted proposals (= funded projects) match as closely as possible the empirically recorded number of projects and the empirical size distribution of projects.
- 3.13
- The knowledge-related indicators of the Baseline Scenario (Ahrweiler, Pyka & Gilbert 2011)
demonstrate the additional advantage of a simulation to record
"un-observables". Empirically, we cannot see and only with difficulty
can we measure knowledge generation, knowledge exchange, and learning.
To assess the knowledge of participants, we used a measure (\(k\)) that
is equal to the length of a participant's kene. The knowledge flow is
the total increase of knowledge over all participants arising from
their learning from partners. Let \(k_i^{t-1}\) be the knowledge of a
participant before learning from partners and \(k_i\) be the knowledge
of a participant after learning from partners. The knowledge flow then
is
$$ kf = \sum_{\{Projects\}} \sum_{i\in\{Partners\}} \left(k_i^t-k_i^{t-1} \right) $$ - 3.14
- An additional indicator focuses on the qualitative
composition of the networks' knowledge bases. Modifying the call for
proposals and asking for different knowledge areas to be involved might
exert an influence on the depth and breadth of the agents' knowledge
base. This is measured with the number of shared capabilities among the
agents. We implemented an indicator (diffusion) to
track the diffusion of capabilities based on the information in Table 4.
$$ D_k = \frac{|\{(i): i\in \{Participants\}, X_i \cap X_k \neq\emptyset\}|}{|\{Participants\}|} $$ where
\(D_k\) is the diffusion value for capabilities from theme \(k\)
\(X_i\) is the set of capabilities carried by participant \(i\)
\(X_k\) is the set of capabilities from theme \(k\) - 3.15
- Figure 12 shows
the Baseline Scenario values for the diffusion of capabilities. Note
the lower diffusion value for capabilities from theme 9, which is not
included in the Calls.
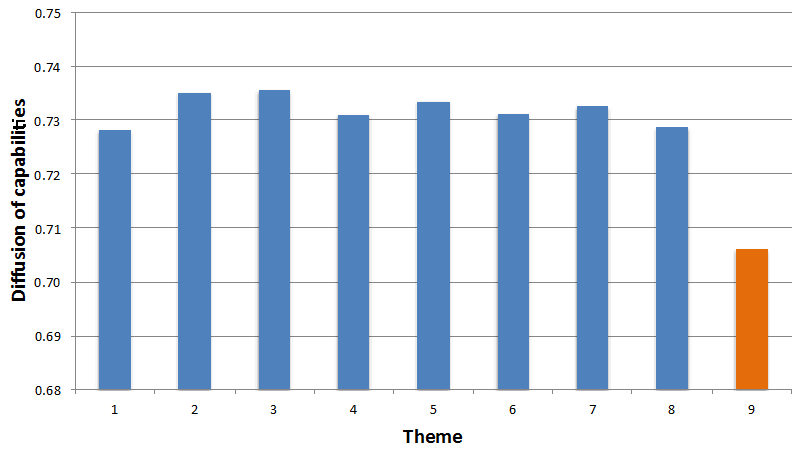
Figure 12. Diffusion of capabilities in the Baseline Scenario
The
experiments
- 4.1
- The discussion above shows that the networks created by DG
INFSO in FP7 and those created by the agent-based model are
qualitatively similar. The simulation experiments reproduce the
empirical data and cover the decisive mechanisms and resulting dynamics
of the real networks. This qualifies the model to be used for in
silico experiments, which take these outcomes as a starting
point and test potential future developments in the sense of the ex-ante
evaluation outlined above.
The "Business as Usual" experiment as benchmark
- 4.2
- The first experiment simply prolongs the time horizon and
keeps the instrument design as outlined in FP7. In other words the
coming funding programme, Horizon 2020, is treated as a simple
extension of FP7. The outcomes of this experiment, which we have
labelled "Business as Usual", are outlined in the two Tables 4 and 5
below, one for the IP and one for the STREP case. We are interested in
the effect on the number and composition of participants, the number of
submitted proposals and the qualitative features of the underlying
network structures. Analysing these outcomes allows for an ex-ante
evaluation of FP7 instruments concerning their sustainability beyond
the FP7 time horizon.
Table 4: Results of the Baseline Scenario per instrument (IP) – Horizon 2020 (* indicates significant at the 5% level using a t-test) Sim IP (15 runs) Sim IP 2020 (15 runs) Mean st dev Mean St dev
LDFs in projects 501.3 14.105 568.6 13.323 * SMEs in projects 520.1 18.928 608.8 19.693 * Participants in proposals (avg) 2.578 0.083 3.836 0.110 * Participants in projects (avg) 2.002 0.030 2.521 0.060 * Proposals Number of Proposals 347.5 19.276 621.9 32.338 * proposals-size-avg 13.682 0.187 13.896 0.134 * proposals-expertise-level-avg 5.1 0.053 4.8 0.053 * proposals-capability-match-avg 19.4 0.229 19.4 0.116 Projects Number of projects 206.9 7.652 311.4 7.511 * Project size (avg) 13.622 0.213 13.739 0.159 Project duration (avg) 41.0 0.000 41.0 0.000 Project funding (avg) 7.6 0.118 7.6 0.088 Knowledge Knowledge per participant 16.4 0.054 14.5 0.055 * Knowledge-flow per project 13.8 0.221 15.5 0.450 * Capabilities Capability diffusion (Theme 1-8) 0.729 0.006 0.684 0.010 * Capability diffusion (Theme 9) 0.706 0.007 0.634 0.008 * Capabilities frequency (avg) 54.6 0.178 48.3 0.182 * Network Density 0.018 0.001 0.019 0.001 * Number of components 1.0 0.000 1.0 0.000 Size of the largest component 1634.2 37.474 1845.4 40.540 * Diameter 4.067 0.258 4.040 0.200 Avg-path-length 2.620 0.017 2.546 0.017 * Avg-degree 30.2 0.532 35.0 0.669 * Avg-clustering 0.728 0.007 0.668 0.008 * Table 5: Results of the Baseline Scenario per instrument (STREP) – Horizon 2020 (* indicates significant at the 5% level using a t-test) Sim STREP (15 runs) Sim STREP 2020 (15 runs) Mean st dev mean st dev Participants RES in projects 809.9 12.738 855.6 13.166 * LDFs in projects 692.3 8.464 734.3 8.834 * SMEs in projects 804.6 11.005 878.5 14.633 * Participants in proposals (avg) 4.022 0.095 6.560 0.139 * Participants in projects (avg) 2.340 0.021 2.907 0.031 * Proposals Number of proposals 1292.1 35.789 2286.3 51.279 * proposals-size-avg 8.231 0.056 8.304 0.032 * proposals-expertise-level-avg 5.1 0.028 4.8 0.034 * proposals-capability-match-avg 11.0 0.068 11.1 0.049 * Projects Number of projects 592.3 5.496 822.9 5.456 * Projects-size-avg 8.208 0.072 8.199 0.054 Projects-duration-avg 34.0 0.000 34.0 0.000 Projects-contribution-avg 3.0 0.028 3.0 0.020 Knowledge Knowledge per participant 17.1 0.048 15.2 0.050 * Knowledge-flow per project 6.8 0.145 7.8 0.151 * Capabilities Capability diffusion (Theme 1-8) 0.745 0.010 0.704 0.009 * Capability diffusion (Theme 9) 0.704 0.006 0.633 0.007 * Capability frequency (avg) 57.0 0.160 50.8 0.167 * Network Density 0.009 0.000 0.009 0.000 Number of components 1.0 0.000 1.0 0.000 Size of the largest component 2349.7 18.495 2511.4 23.353 * Diameter 5.000 0.000 5.000 0.000 avg-path-length 2.846 0.015 2.768 0.013 * avg-degree 20.4 0.176 23.4 0.273 * avg-clustering 0.603 0.005 0.554 0.006 * - 4.3
- At first glance, the results of the Business as Usual Experiment confirm the sustainability of FP7 policy designs. Extending policies beyond FP7 can be considered as a strategy that conserves the trends sustaining the networks. A closer look at the relevant figures, nevertheless, indicates some subtle changes that qualitatively affect the networks and the resulting dynamics.
- 4.4
- All the agent groups (RES, LDF and SME) are affected, i.e. their rate of participation grows, though the rates differ. The lowest growth rate of approximately 10% is for research institutes, perhaps because the majority of institutes are already in the networks. Large Diversified Firms (LDFs) are the second fastest growing group and extend their participation by approximately 13%. Again, most of the European LDFs, at least those including R&D departments, are already linked to the networks. The highest growth in participation is for Small and Medium Sized Enterprises (SMEs), which increase their participation on average by 17%.
- 4.5
- The strongest effect is on the number of proposals being submitted, which almost doubles in the extension experiment. There is no change in the average number of agents that join a proposal team. However, the average expertise characterising proposal writers decreases moderately, as a side-effect of the increasing proposal activity: agents with somewhat lower expertise levels manage to be included in proposal teams because of the scarcity of relevant competences. This scarcity can also be considered as a factor supporting SMEs with rare capabilities, relative to LDFs and RESs. The number of proposals that succeed in passing the evaluation of the Commission also increases, but only by half as much as the growth in the number of proposals. The increase in the rejection rate implies an increase in the quality of the projects. There are no significant changes to the average project size, duration or Commission contribution (the value of financial support per project).
- 4.6
- The quantity and quality of linkages among project consortium members moderately increases, which leads to increasing knowledge flows within the projects. With the larger number of agents in the networks, a decrease in the rate of knowledge diffusion was to be expected and, indeed, the capability diffusion slightly decreases. In total, however, the conditions for knowledge flows within the network and therefore for mutual learning and cross-fertilisations increase. The largest component – measuring the number of agents that are in principal connected in the network – increases by 12%, complemented by a moderate increase in the network density. The increase in the average degree from 30 to 35 reflects a more egalitarian distribution of linkages caused by the higher participation of SMEs and a higher number of projects. These developments lead to a decrease in the clustering in the network, which corresponds to a somewhat decreasing influence of LDFs.
- 4.7
- To summarise, Business as Usual shows
that under a continuation of FP7 policies networks not only survive but
grow, while the structure of those networks tends to evolve towards a
more balanced distribution of influence between agents, and the
networks become more effective at producing proposals.
Experiments with policy changes
- 4.8
- In helping to design the new Horizon 2020, DG INFSO had the opportunity to consider new policy options, such as supporting certain funding instruments more strongly, accentuating some aspects, and addressing new topic areas in order to initiate the emergence of new industries and scientific fields. The following policy changes were tested for ex-ante evaluation of the new programme: (i) What if there would be changes to the thematic scope of the programme? (ii) What if there would be changes to the funding instruments? (iii) What if there would be changes to the overall amount of programme funding? (iv) What if there would be changes to increase SME participation?
- 4.9
- The results of the experiments have to be understood against the baseline scenario, the reproduction and dynamic extension of FP7 (the "Business as Usual" Experiment above). The outputs (baseline scenario and the scenario under investigation) were compared using an independent two-sample t-test with equal sample sizes and unequal variance. Comparisons that are noted as statistically significant are those with \(p\) values less than 0.05.
- 4.10
- There are many dimensions of the network evolution that can
be used for the comparisons. In order to cover the multi-facetted
aspects of our explanandum – the networks and their
dynamics – we tabulate the four experiments and the effects of the
modified policy design in six rows (see Table 6).
The heads of the columns label the different experiments performed, and
the rows are labelled with the variables under investigation.
Table 6: Possible ranges of the results of experiments Programme Scope Experiment Hubs and Spoke Experiment Elite and Selectivity Experiment Specialisation Experiment A
Lower number of thematic areasB
Higher number of thematic areasC
Smaller consortiaD
Larger consortiaE
Higher funds per consortiumF
Lower funds per consortiumG
Higher funds per programH
Lower funds per programI
More SMEsJ
More applied researchParticipants SMEs (-0+) LDF (-0+) RES (-0+)
Proposals More submitted proposals (+)
Less submitted proposals (-)Projects Size of consortia (+0-); participation of SMEs, RES, LDF (+0-) Knowledge Increasing (+) or decreasing (-) knowledge exchange among agents Capabilities Wide (+) or narrow (-) diffusion of capabilities Networks Density (-0+), Average Path Length (-0+), Average Degree (-0+), Average Centrality (-0+), Average Clustering (-0+) - 4.11
- In the first row the effect on the number of participants and their rate of participation in the networks is listed. In particular we differentiate between research institutes (RES), large diversified firms (LDFs) and small and medium sized enterprises (SMEs). An increasing rate of participation is indicated with a plus, while a minus indicates a decreasing participation rate.
- 4.12
- The second row lists the number of proposals, and whether there is an increase in proposal writing activities (plus) or a decrease (minus). This figure is of interest as the number of proposals submitted can be interpreted as an indicator determining the potential for network growth.
- 4.13
- In the third row, the effects on the projects are listed. Especially, we differentiate between the number of projects, the size of the projects as measured by the number of participants, the proportion of each agent type, and the average funding per project. The respective figures can be used to evaluate the effects of various sizes and forms of project consortia on the overall network evolution.
- 4.14
- The fourth row deals with the effects of knowledge exchange processes measured as knowledge flows between the agents in the networks. The modifications in the various experiments can lead either to increasing or decreasing mutual learning triggered by knowledge flows and therefore allows for the evaluation of the effectiveness of various policy designs for knowledge diffusion.
- 4.15
- The last row deals with the network as a whole. To illustrate deviations from the baseline scenario, the effects of the experiments on important network indicators are documented in the table and their development over time is displayed. Any statistically significant deviation from the Baseline Scenario for these indicators is marked by a plus (+) or a (-). No significant effect is recorded by the entry "no effect" in the respective cell.
Results
and discussion
-
The "Programme Scope" experiment
- 5.1
- Current EU funding programmes put considerable emphasis on
tackling societal challenges through the encouragement of specific
technology themes, bringing researchers from across Europe together in
collaborative networks. Understanding how the network will react to
changes in this "thematic technology push" approach is crucial for an ex-ante
evaluation of networks built through collaborative research at a
European level. The first pair of experiments, A
and B (cf. Table 6)
were designed to establish the impact of changing the number of
technology themes supported by FP funding. Specifically, they looked at
what happened if the number of thematic areas was increased or reduced
by one. Intuitively, changing the number of knowledge fields should
alter the overall transfer of knowledge with the network, because the
likelihood of agents with similar knowledge meeting within the network
will vary with the number of knowledge fields included.
Table 7:. Results - Programme Scope Scenario (all variable acronyms are listed and defined in Tables 1–5 of the Appendix).
Note: The (•) means that the effect is intendedCAPTION GOES HERE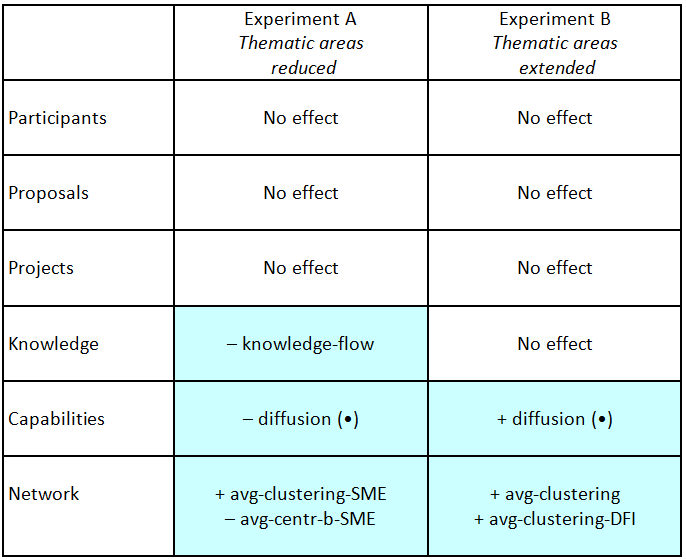
- 5.2
- Surprisingly the simulations showed that neither broadening nor narrowing the scope of the Calls made a discernible difference on the composition or structure of the observed networks. Minor changes in the membership of the networks were observed, however, with intriguing consequences. Narrowing the scope encouraged greater clustering of SMEs, a network structure supportive of exploitation activities. Broadening the scope, however, encouraged greater clustering of large diversified firms (LDFs), which, by connecting different knowledge niches, tends to support innovation.
- 5.3
- The implication is that new thematic areas could be
integrated (or existing areas deleted) without any significant effect
on existing networks. So the decision to add or remove thematic areas –
within the parameters modelled – can be driven solely by political
considerations. It is a decision on the direction and desirable focus
of research. Given that the intended changes remain within a
non-critical corridor, it is not likely that the inclusion or exclusion
of themes will cause problems for the achievement of targets relating
to the density and size of the networks.
The "Hub and Spokes" experiment
- 5.4
- An obvious policy instrument is to change the amount of funding – either per Call or per project. This echoes question 5 of the public consultation on Horizon 2020: "What should be the balance between smaller, targeted projects and larger, strategic ones?" (Green Paper on a Common Strategic Framework for EU Research and Innovation Funding: Analysis of public consultation 2011: p. 8). One of the suggestions was that funding opportunities should allow for smaller projects and consortia because these encourage more innovation.
- 5.5
- Four experiments, C, D, E and F, were conducted (see Table 6). C and D focused on the effect of the number of capabilities required by a proposal submitted in response to a Call (in other words, the required size of the responding consortium). E and F focused on the effect of varying funding levels per project.
- 5.6
- Experiment C focused on the effect of reducing the consortium size. It found striking increases in the number of participants in the network, the number of proposals delivered and the number of projects eventually supported by the Commission. Because smaller consortia limit the capacity of consortia to respond to Calls, and because agents regard EU funding as important, they make more proposals to increase their chances of funding. Accordingly, decreasing consortia size but maintaining overall funding allows a greater number of projects to be supported. The study found evidence that knowledge flows within the networks increased, while the network structures became more egalitarian.
- 5.7
- Experiment D focused on a policy encouraging larger consortia. The effects of this were to decrease the number of members in the network, the number of proposals submitted, and the number eventually supported. It is clear that this has negative effects on the egalitarian relationships found in experiment C (which disappear) and also on the knowledge flows and overall diffusion of skills within the network. Encouraging larger consortia tends to favour LDFs and Research Institutions (RES) over SMEs, which are likely to move to the network periphery.
- 5.8
- Experiments E and F
deal with the effects of varying funding levels per project. Experiment
E simulated an increase in monthly budget per project, while experiment
F introduced a smaller monthly budget. The effects of increasing the
budget were disappointing. Far from encouraging activity, an increased
spend actually has no effect on the number of participants and the
number of proposals. Knowledge flows within the networks decrease, as
with a smaller number of projects there is less scope for knowledge
transfer.
Table 8:. Results - Hubs and Spokes Scenario (all variable acronyms are listed and defined in Tables 1–5 of the Appendix).
Note: The (•) means that the effect is intended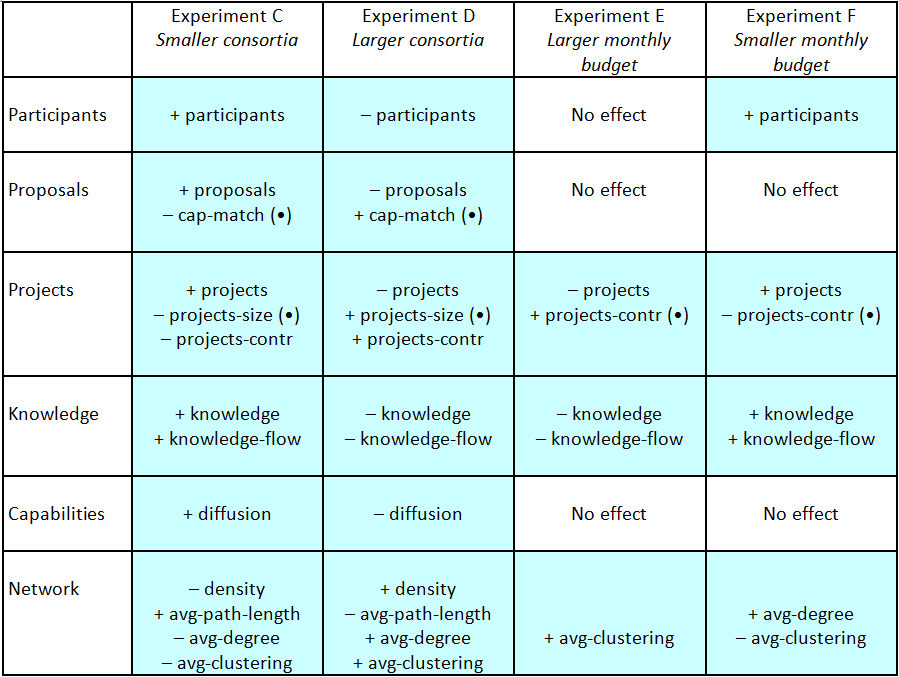
- 5.9
- In summary, the results show that smaller consortia sizes
and (to a lesser extent) lower monthly funding rates had a beneficial
effect on the formation of research networks. While larger projects
with extremely high funding may be required for other reasons, they do
not seem to be supportive of the network-related goals. Of course,
other aims in the underlying research policy might require designs
favouring larger projects.
The "Elite or Selectivity" experiment
- 5.10
- Rather than changing the funds available per participant,
the funds per Call can be varied, leaving the average funding per
project participant unchanged. Experiment G
increased the available Programme funding by 10% and experiment H
decreased it by the same amount.
Table 9. Results - Elite or Selectivity Scenario (all variable acronyms are listed and defined in Tables 1–5 of the Appendix).
Note: The (•) means that the effect is intended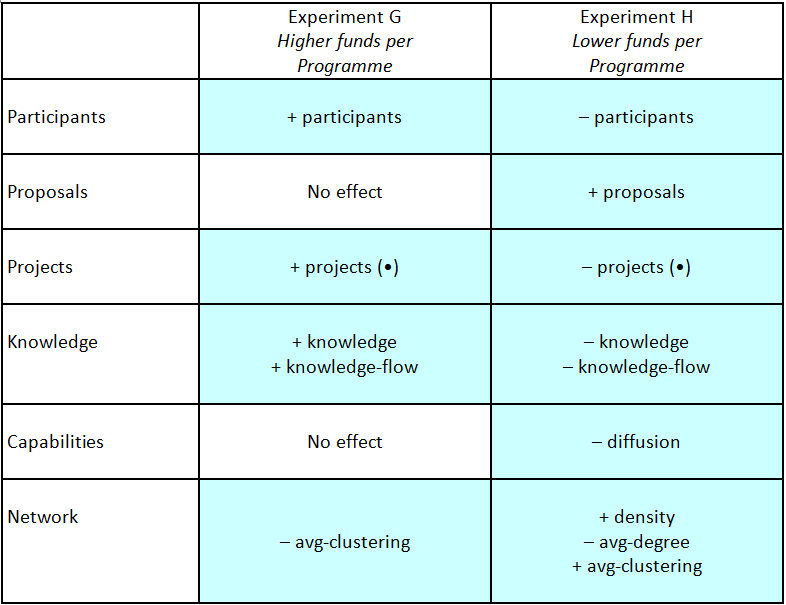
- 5.11
- Unsurprisingly, we found that decreasing funding leads to
more competition for the smaller number of available projects. A larger
number of proposals are submitted, but a smaller number of consortia
are successful. This can be interpreted from the evaluator's side as
being more selective and demanding a higher quality of project
proposals. Compare this with an increase in funding, which leads to
more projects being funded, more knowledge flows between actors, and
stronger connections between consortia.
The "Specialisation" experiment
- 5.12
- SMEs play a crucial role in the development of new products and services because they are usually more flexible and agile than larger organisations. Considerable thought has been given by the Commission about how to make it more likely that SMEs will successfully join research networks. The final experiments consider how networks will be affected as a result of changed SME participation. In the Green Paper consultation process for Horizon 2020, respondents particularly emphasised the need to improve the opportunities for SMEs with innovation ambitions (Green Paper on a Common Strategic Framework for EU Research and Innovation Funding: Analysis of public consultation 2011: p. 10f). We constructed two experiments to assess the effects of increased SME participation in the networks.
- 5.13
- Experiment I considers the effect of
having a larger number of SMEs participating in the programme.
Experiment J changes the orientation of the
evaluation criteria used to judge proposals so as to favour more
applied work (which should favour SMEs).
Table 10. Results - Specialisation Scenario (all variable acronyms are listed and defined in Tables 1–5 of the Appendix).
Note: The (•) means that the effect is intended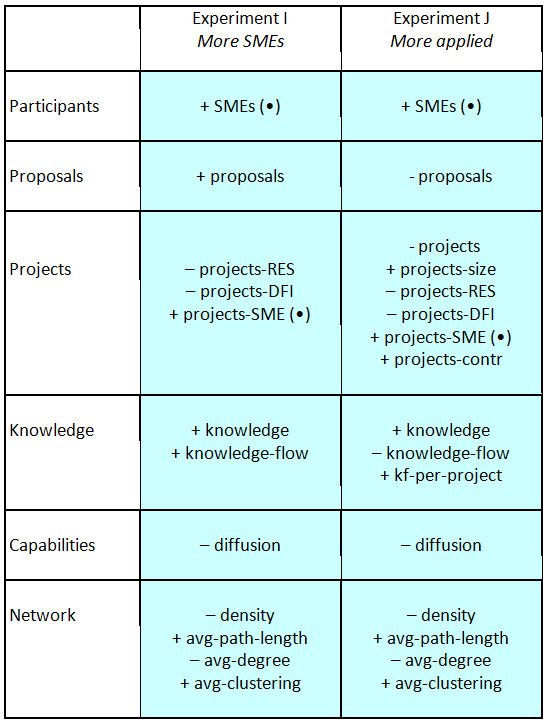
- 5.14
- As might be expected, there are more SMEs in the final network if there are more SMEs at the starting phase. However, there are also more proposals submitted, because it is easier for consortia to meet eligibility criteria – which often require SME participation. Overall there are not significantly more or less projects than in the Baseline Scenario, but there are significant differences in the consortium structures: with fewer research institutions and fewer large companies but more SMEs.
- 5.15
- Proposals involving SMEs, with their specialist knowledge, are more likely to be successful in this experiment, and as specialists they tend to edge out the universities and larger companies with their more generalized knowledge bases. The conclusion is that encouraging more SMEs to pitch for projects under FP Calls would in itself be a sufficient trigger to increase FP participation by SMEs. Also, policy changes to a more applied research direction would be helpful in encouraging more SME participation.
Conclusions
- 6.1
- To what degree can policy decisions be made on the basis of these conclusions, i.e. how accurate is the model? The model was calibrated from the Calls 1–6 that have occurred in FP7. The model used empirical information on the number of participants and the number of funded projects, together with data on project size (as measured by participant numbers), duration and average funding. Analysis of this information produced data on the functioning of, and relationships within, actual collaborative networks within the context of the Framework. Using these data in the model, we were able to achieve a good match with the empirical data from EU-funded ICT networks in FP7: the model accurately reflected what actually happened. The fact that the simulation experiments using the empirical data closely match what happened gives us more confidence that the model can be used as a test bed for potential policy choices.
- 6.2
- The Final Report of the commissioned tender study was presented to the EC with a list of policy recommendations (Ahrweiler et al. 2012). It was discussed at a study workshop with the EC policymakers of DG INFSO and was accepted by the EC Cabinet soon afterwards. With this, INFSO-SKIN has contributed to show that ABM is appropriate to assist policymakers in their decision processes in terms of consensual quality assessment by the "user community view" (cf. Ahrweiler & Gilbert 2005).
Acknowledgements
- This research was financed by a tender grant of the DG Information Society and Media of the European Commission (DG INFSO). The authors are especially grateful for access to the DG INFSO database on FP7 held by the Evaluation Unit, which commissioned the study.
Notes
-
1SKIN
stands for "Simulating Knowledge
Dynamics in Innovation Networks".
Information about the SKIN simulation platform can be found at https://github.com/InnovationNetworks/skin.
2The model and some accompanying information can be downloaded from the SKIN website at https://github.com/InnovationNetworks/skin/tree/master/INFSO-SKIN. The data described in this paper and used for calibration is, regrettably, not provided there because the originators, DG INFSO, were not willing to make the database generally available.
Appendix
-
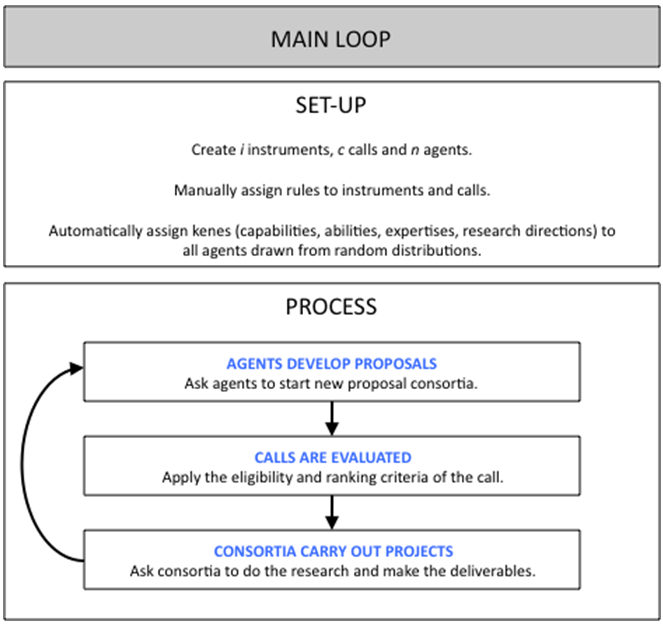
Figure A1. Overview of the simulation model 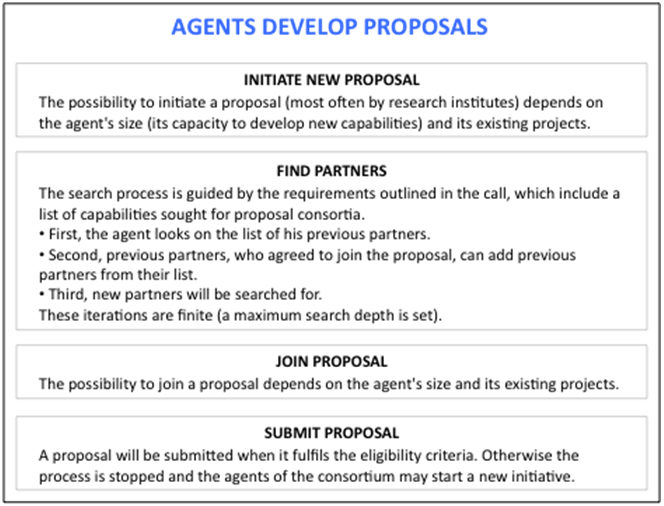
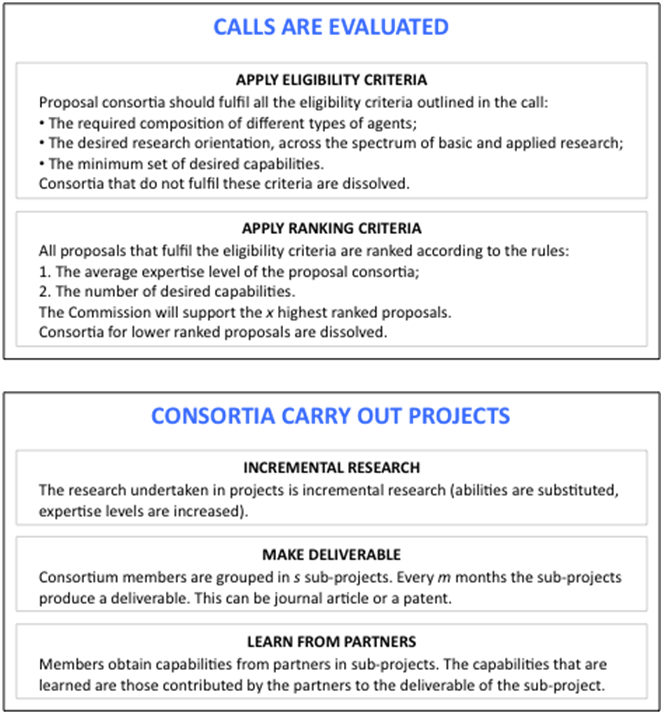
Figure A2. Overview of the rules used in model's main processes Table A1: Parameters for defining the Instruments Min-number-of-partners The minimum number of partners in project consortia Max-number-of-partners The maximum number of partners in project consortia Composition The types of partners in project consortia Duration The duration of projects in months Table A2: Parameters for defining the Calls Call-type the type of Instrument that the Call is associated with (i.e. the type of Projects that the Call is for) Call-publication-date the publication date of the Call Call-deadline the deadline of the Call Call-size the number of Projects that will be funded Call-orientation the desired orientation of the research consortia, within the spectrum of basic research and applied research Call-capabilities a list of desired capabilities outlined in the Call Call-capability-match the required match between the capabilities contributed by project partners and the capabilities outlined in the Call Table A3: Measures calculated on the collaboration network Number-of-nodes The number of nodes (agents) Number-of-edges The number of edges (representing collaborations between agents) Network-density The proportion of edges in the network relative to the total number possible (sparse versus dense networks) Number-of-components The number of components (i.e. portions of the network in which all agents are connected, directly or indirectly, by at least one link) Size-of-largest-component The size of the largest ('giant') component Average-degree The average number of connections a node has to other nodes Diameter The maximal distance between any two nodes in the network Average-path-length The average number of steps along the shortest paths for all possible pairs of network nodes Clustering-coefficient The degree to which nodes in the network tend to cluster together ('cliquishness') Table A4: Statistics on the participants Participation-in-proposals-distribution frequency distribution of the number of Proposals that agents are currently in Participation-in-projects-distribution frequency distribution of the number of Projects that agents are currently in Degree-distribution frequency distribution of the number of partners (or previous partners) that agents currently have in their list Table A5: Statistics on the project consortia Projects-count the number of projects supported by the Commission, totalled over all the 6 Calls Projects-with-SME-% The percentage of projects with 1 or more SME partner Projects-size-statistics the average, median, min and max size of project consortia, as well as the % of 'small' project consortia (less than 5 partners) and the % of 'big' consortia (more than 20 partners)
References
-
AHRWEILER, P., de Jong, S. & Windrum. P. (2002). Evaluating Innovation Networks. I Pyka, A. & Kueppers, G. (Eds.). Innovation Networks – Theory and Practice. Cheltenham: Edward Elgar, 197-214.
AHRWEILER, P., Gilbert, N. and Pyka, A. (2012) Final Report: Using Network Analysis to monitor and track Effect resulting from Changes in Policy Intervention and Instruments. SMART 2010/0025. European Commission, DG Information Society & Media.AHRWEILER, P., Pyka, A. & Gilbert, N. (2011) A New Model for University-Industry Links in Knowledge-Based Economies. Journal of Product Innovation Management, 28(2): 218–235.
AHRWEILER, P. & Gilbert, N. (2005) 'Caffe Nero: the Evaluation of Social Simulation'. Journal of Artificial Societies and Social Simulation, 8(4), 14. <https://www.jasss.org/8/4/14.html>BOZEMAN, B., & Lee, S. (2005) The Impact of Research Collaboration on Scientific Productivity. Social Science Studies, 35(5), 673-702.
BRAUN, D., & Guston, D.H. (2003) Principal-agent theory and research policy: an introduction. Science and Public Policy 30/5.BULMER, S. (2007) Policy Transfer in European Union Governance: Regulating the Utilities. Routledge, Abingdon.
CLAPHAM, W.B., Pestel, R.F., & Arnaszus, H. (1980) On the scenario approach to simulation modeling for complex policy assessment and design. IIASA Research Report RR-80-3,February 1980. Reprinted from Policy Sciences 1, 1979, pp. 157– 177.
DAVIES, H. T. O., Nutley, S. M., & Smith, P. C. (2000) What works? Evidence-based Policy and Practice in Public Services. Cambridge.
DINAR A., Albiac, J., Sanchez-Soriano J. (2008) Game Theory and Policy Making in Natural Resources and the Environment. New York: Routledge Press.
EIJFFINGER, S. C. W., & de Haan, J. (2000) European Monetary and Fiscal Policy. Oxford University Press, Oxford.
EUROPEAN COMMISSION (2011) Green Paper on a common strategic framework for EU research and innovation funding: Analysis of public consultation 2011. Report published by the Directorate-General for Research and Innovation (2011), ISBN 978-92-79-20325-1.
FAGIOLO, G., & Pyka, A. (2007) Agent-based modelling: a methodology for a neo-Schumpeterian modelling, in: Hanusch, H., Pyka, A. (Eds) The Elgar Companion on Neo-Schumpeterian Economics. Edward Elgar, Cheltenham, pp. 467–492.
FOSS, N., & Klein, P. (2007) Organizational Governance. Copenhagen Business School Working Papers. Copenhagen.
FUKUYAMA, F. (2004) State Building. Governance and World Order in the Twenty-First Century. Ithaca.
GILBERT, N., Ahrweiler, P., & Pyka, A. (2010). Learning in innovation networks: some simulation experiments, in: Ahrweiler, P. (ed) Innovation in Complex Social Systems. London: Routledge, pp. 235–249.
GILBERT, N., Pyka, A., & Ahrweiler, P. (Eds.) (2014) Simulating Knowledge Dynamics in Innovation Networks.Heidelberg: Springer.
GILBERT, N., Pyka, A., & Ahrweiler, P. (2001) Innovation networks - A simulation approach. Journal of Artificial Societies and Social Simulation 4(3)8. https://www.jasss.org/4/3/8.html> GILBERT, N., Pyka, A., & Ahrweiler, P. (2002) Simulating Innovation Networks. In: Pyka, A. and Kueppers, G. (Eds.). Innovation Networks – Theory and Practice. Cheltenham: Edward Elgar, 169-196JOHN, P. (1998) Analysing Public Policy. London.
KINGDON, J. W. (1984) Agendas, Alternatives, and Public Policies. Little, Brown, Boston.
KNIGHT, H. F. (1921) Risk, Uncertainty and Profit. Chicago.
KRESS, G. J., Snyder, J. (1994) Forecasting and Market Analysis Techniques: A practical Approach. Quorum Books, Westport, Connecticut, London.
LOVERIDGE, D. (2007) Foresight. The Art and Science of Anticipating the Future. Routledge, New York.
MAKRIDAKIS, S., Wheelwright, S., & Hyndman, R. J. (1998) Forecasting: Methods and Applications. John Wiley & Sons, New York.
PAWSON, R. (2005) Evidence-based Policy: A Realist Perspective. London.
PRASAD, M. (2006) The Politics of Free Markets: The Rise of Neo-Liberal Economic Policies in Britain, France, Germany, and the United States. Chicago.
PYKA, A. & Kueppers, G. (Eds) (2002). Innovation Networks: Theory and Practice. Cheltenham: Edward Elgar.
PYKA, A. & Saviotti, P. P. (Eds) (2002). Innovation Networks in the Biotechnology-based Sectors. In Pyka A. & Kueppers, G. (Eds), Innovation Networks: Theory and Practice. Cheltenham: Edward Elgar, 75–107.
RESCHER, N. (1998). Predicting the Future: An Introduction to the Theory of Forecasting. State University of New York Press, New York.
ROBINSON, S. (2004) Simulation. The practice of model development and use. Wiley.
SABATIER, P. A. (2007) Theories of the Policy Process (2nd edition). Westview Press, Boulder, CO.
SCHOLZ, R., Nokkala, T., Ahrweiler, P., Pyka, A., & Gilbert, N. (2010) The agent-based Nemo Model (SKEIN) – Simulating European Framework Programmes, in: Ahrweiler, P. (Ed) Innovation in Complex Social Systems, Routledge, London, pp. 300–314.
VAUX, J. & Gilbert, N. (2002) Innovation Networks by Design. In Pyka, A., & Kueppers, G. (Eds.), SInnovation Networks – Theory and Practice. Cheltenham: Edward Elgar, 55-74.
WATTS, C. & Gilbert, N. (2014) Simulating Innovation. Computer-based Tools for Re-Thinking Innovation. London: Edward Elgar.
WEBER, M. (2002) Innovation networks and the transformation of large socio-technical systems: the case of combined heat and power technology, in: Pyka, A., Kueppers, G. (Eds) Innovation Networks - Theory and Practice. Edward Elgar, Cheltenham, pp. 133–165.
WINDRUM, P. (2002) The role of knowledge-intensive business services (KIBS) in e-commerce. In Pyka, A., Kueppers, G. (Eds.) Innovation Networks - Theory and Practice. Edward Elgar, Cheltenham, pp. 108–132.