
 Abstract
- Insulating existing buildings offers great potential for reducing greenhouse gas emissions and meeting Germany’s climate protection targets. Previous research suggests that, since homeowners’ decision-making processes are inadequately understood as yet, today’s incentives aiming at increasing insulation activity lead to unsatisfactory results. We developed an agent-based model to foster the understanding of homeowners’ decision-making processes regarding insulation and to explore how situational factors, such as the structural condition of houses and social interaction, influence their insulation activity. Simulation experiments allow us furthermore to study the influence of socio-spatial structures such as residential segregation and population density on the diffusion of renovation behavior among homeowners. Based on the insights gained, we derive recommendations for designing innovative policy instruments. We conclude that the success of particular policy instruments aiming at increasing homeowners’ insulation activity in a specific region depends on the socio-spatial structure at hand, and that reducing financial constraints only has a relatively low potential for increasing Germany’s insulation rate. Policy instruments should also target the fact that specific renovation occasions are used to undertake additional insulation activities, e.g. by incentivizing lenders and craftsmen to advise homeowners to have insulation installed.
- Keywords:
- Spatial Agent-Based Model, Decision-Making Process, Homeowners, Thermal Insulation, Situational Factors, Social Interaction
Introduction
- 1.1
- Buildings account for more than 40 per cent of total final energy consumption and greenhouse gas emissions in the European Union (EU) (IEA 2013). Recent estimates suggest that existing buildings in the EU have an energy-saving potential of up to 80 per cent (Lechtenböhmer & Schüring 2011). Detached and terraced residential buildings, the most common types for owner-occupier households, offer the greatest potential for reducing energy use (Weiß & Dunkelberg 2010). Owner-occupier households in detached and terraced residential buildings, i.e. households who own the detached or terraced residential building in which they also live, are hereinafter referred to as "homeowners".
- 1.2
- The most effective measure for reducing the energy consumed by existing buildings is to install or upgrade (thermal) insulation (Balaras et al. 2007; Enkvist et al. 2007). Empirical research shows that the total benefits of insulating existing buildings usually outweigh their costs (Chapman et al. 2009; Jakob 2006). Thus, for many homeowners, it pays to invest in insulation measures due to the reduction in energy costs amassed over their lifetime (Nauclér & Enkvist 2009; von Weizsäcker 2010). Nevertheless, homeowners appear to be reluctant to take advantage of these opportunities in most European countries, including Germany (Jakob 2007; Organ et al. 2013; Tommerup & Svendsen 2006; Zundel & Stieß 2011). A number of studies claim that an increase in insulation activity is required in order to achieve Germany's climate protection targets (Kirchner & Matthes 2009; Schlesinger et al. 2010). Results show that the number of households having insulation installed could be doubled in Germany compared to current levels, and would still pay off in economic terms (Kleemann et al. 2005). Even then, yet more households could have insulation installed, which would pay off, because there is a considerable insulation backlog (share of building components with overaged or nonexistent insulation) (Diefenbach et al. 2010).
- 1.3
- Existing policy instruments to increase insulation activity
typically target the economic viability of insulation (Friege & Chappin 2014a).
This is reasonable insofar as a homeowner's decision to insulate is
indeed influenced by the economic viability of insulation. Other
reasons, both those in favor and those against insulation, were
identified in an earlier work by bibliographic analysis (Friege & Chappin 2014a)
(see Table 1). Our analysis
showed that one important reason for the poor success rate of existing
policies is that the influence of noneconomic motivations and barriers
is underestimated.
Table 1: Main economic and noneconomic motivations and barriers influencing homeowners' decisions to insulate. Adapted from Friege and Chappin (2014a). 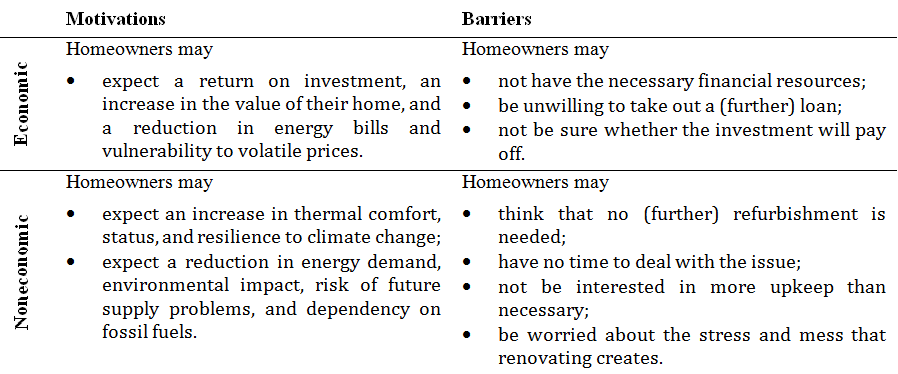
- 1.4
- Motivations and barriers to installing insulation differ among homeowners and are affected by situational factors and social interaction. For example, face-to-face interaction between homeowners and personal information can alter their expectations regarding the consequences of installing insulation (Zundel & Stieß 2011). Relevant situational factors can be the homeowner's socio-demographic situation or the structural condition of the house.
- 1.5
- We argue that a better understanding of the effects arising
from these factors can create a better understanding of homeowners'
decision-making concerning insulation. This increase in knowledge could
help policy-makers to design innovative policy instruments for
increasing insulation activity. This leads us to pose the following
research questions:
- In what ways do situational factors and social interaction influence the insulation activity of heterogeneous homeowners?
- How should policy instruments aiming at increasing homeowners' insulation activity be designed?
- 1.6
- Research shows that agent-based modeling is particularly suitable for exploring dynamics of real-world systems which involve the interaction of individual entities (Bonabeau 2002; Gu et al. 2015; Putra et al. 2015; Rand et al. 2015). Since homeowners' insulation activity is, inter alia, influenced by social interaction (Ball et al. 1999; Xu et al. 2014), we develop an agent-based model for answering the questions posed above. In the third section we further introduce the methodology and describe the model. The model consists of autonomous interacting household agents going through multi-stage decision-making processes on whether or not to insulate their homes. Since social interaction affects the agents' decision-making, the model includes a social network with a composition that considers the agents' heterogeneity and spatial proximity.
- 1.7
- We then present the results of the simulation experiments conducted to explore the influence of situational factors and social interaction on homeowners' insulation activity. The paper ends with a discussion and a conclusion. In the next section, we present the theoretical framework that serves as a basis for the model and that we developed based on behavioral theories and literature on insulation decisions.
The
theoretical framework
- 2.1
- In this section we present the theoretical framework
developed to capture the centerpiece of the simulation model,
homeowners' decision-making processes on whether or not to insulate
their homes. The framework, depicted in Figure 1,
shows that homeowners decide in favor of insulating their property
(renovation activity) if situational factors trigger a renovation
occasion, and if attitude and the perceived value of information result
in positive perceived utility towards installing insulation. The
elements of the framework will be further developed and descriped in
greater detail below, based on behavioral theories and literature on
renovation decisions.
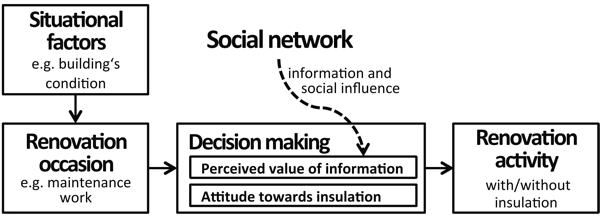
Figure 1. Theoretical framework for homeowners' decision-making processes on whether or not to insulate their homes. - 2.2
- Homeowners' decision-making on insulation is mainly triggered by situational factors such as the condition of the building or the homeowner's socio-demographic situation. Situational factors trigger the main renovation occasions, namely maintenance work, attic extension, and house purchase (Stieß & Dunkelberg 2012). Initially, these occasions lead to renovation measures that do not improve the insulation of the house, such as renewing the roof or the facade[1]. However, insulation is usually combined with such measures. Thus, renovation occasions represent a significant opportunity to install insulation (Wilson et al. 2013). Combining roof renewal with roof insulation or facade renewal with wall insulation is also less expensive than implementing the measures separately (Stolte 2011). Incorporating such a concept of facilitating conditions to model consumer action is in accordance with proposals by Ölander et al. (1995), who state that the opportunity to carry out an intention is a precondition for the performance of the specific behavior.
- 2.3
- If a renovation occasion occurs, attitude and the perceived value of information (see below) influence the homeowner's decision to combine standard renovation measures with insulation. Various theories contend that the attitude towards a particular behavior influences a person's decision-making (Fishbein & Ajzen 1975; Guagnano et al. 1995; Ölander et al. 1995). Since empirical studies exploring homeowners' decision-making regarding installing insulation in their homes suggest the same findings (Stieß & Dunkelberg 2012; Wilson et al. 2013), we incorporated the 'attitude' concept into our framework.
- 2.4
- Social interaction becomes relevant for homeowners' decision-making because the installation of insulation requires specialized information and skills, and homeowners "are not usually trained in construction and technology and thus must find ways to cope with the need for expert knowledge" (Stieß & Dunkelberg 2012, p. 252). Stieß and Dunkelberg (2012) found that homeowners' main and most important source of information on insulation is their own social network (Stieß & Dunkelberg 2012). This view is supported by McMichael and Shipworth (2013), who suggest that information received on energy-reducing innovations has a stronger impact on the decision to adopt such measures if verified by personal contacts (McMichael & Shipworth 2013). In his theory of 'social impact', Latane (1981) showed that the perceived value of information received through social networks differs depending on the effectiveness of communication, the closeness in time and space, and the number of people in the social network. By incorporating the concept of the perceived value of information into our framework, we take into account the influence of social interaction on homeowners' decisions to insulate.
- 2.5
- If attitude and the perceived value of information result in positive perceived utility towards installing insulation, we assume that homeowners decide in its favor. This assumption is consistent with the provisions of different integrative theories of consumer behavior. In accordance with Stern (2000), homeowners' decision-making on insulation is a "function of the organism and its environment". As suggested by Ölander et al. (1995), the target behavior requires task knowledge, the opportunity, and a sufficient amount of motivation to be executed. The motivation – opportunity – ability (MOA) framework from Ölander et al. (1995) only differs in so far from our approach that they incorporate both habit and task knowledge in their 'ability' concept. Because installing insulation is not a habitual behavior (Bartiaux et al. 2011), the habit component was not used in our framework.
The
agent-based model
- 3.1
- The theoretical framework shows that homeowners' decision-making concerning insulation is triggered by situational factors and influenced by social interaction. We use the technique of agent-based modeling (ABM) to explore how situational factors and social interaction influence homeowners' insulation activity.
- 3.2
- Several scientists have successfully used ABM to model systems comprising autonomous interacting entities such as, in our case, homeowners (An 2012; Bonabeau 2002). The studies show that ABM enables emergent phenomena to be captured, in our case homeowners' insulation activity arising from their interaction. Homeowners mutually influence each other's decisions due to social interaction. Thus, homeowners' insulation activity cannot be explained by analyzing their decision-making individually or by analyzing the aggregation of their individual states. In addition, the agent-based approach enables homeowners' multistage decision-making processes to be modeled influenced by their individual situation. We thus consider ABM to be suitable for exploring homeowners' insulation activity.
- 3.3
- First, we describe the homeowners' characteristics, which
serve as input for the ABM as depicted in Figure 2.
Additional input are a number of parameters such as the assumed
population density. The influence of population density on homeowners'
insulation activity and the development of the condition of a building
is explored in the simulation experiments. We then describe the main
model procedures: the initialization, which includes creating the
spatial structure and establishing the social network, and the actual
simulation of homeowners' decision-making processes. Finally, we
describe the different insulation activity indicators used later to
present the results of the simulation experiments.
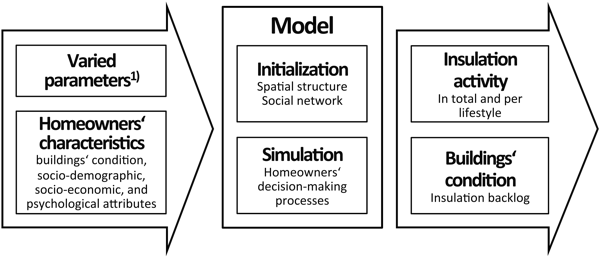
Figure 2. Overview of model input, processes and output. 1) Parameters used to vary basic assumptions such as the population density or residential segregation in the simulation experiments. - 3.4
- The model code and an 'ODD' protocol (Grimm
et al. 2010) can be
retrieved from www.openabm.org/model/4419.
The model is implemented in NetLogo v.5.1.0 (Wilensky
1999).
Homeowners' characteristics
- 3.5
- The agents in the model are owner-occupier households with decision-making power regarding investments in renovation. They are represented as homeowners in the model containing several social and technical characteristics. Relevant technical characteristics are: the type and age of their house; the age and lifetime of insulation, roofing, wall paint, exterior rendering, and the heating system. The lifetime of modeled building components are normally distributed (see Appendix B, Table 8). The age of the building components is calculated as the difference between the house age and a multiple of the components' lifetime[2].
- 3.6
- To capture homeowners' socio-demographic and psychological
heterogeneity, we draw on Otte's lifestyle typology for Germany (Otte 2008). The typology is
conceptualized along two dimensions and comprises nine different
lifestyles (see Table 2). The
hierarchical dimension 'level of living' relates to individuals'
economic and cultural resources. The temporal dimension
'modernity/biographical perspective' relates to individuals' values
(traditional vs. modern) and biographical perspective of living.
Homeowners of the different lifestyles differ regarding their attitude
towards insulation, age and income. Homeowners' attitudes towards
insulation, expressed in quantitative terms (from −0.5 very negative to
+0.5 very positive) per lifestyle, was estimated by the authors based
on the study "potentials for sustainable living in Germany" (Rückert-John et al. 2013).
The study describes the attitude adopted by the prevailing lifestyles
towards climate and environmental protection activities such as
installing insulation. The study additionally provides information on
the homeowners' age and household net income distribution per lifestyle
as presented in Table 2. For
the shares of homeowners per lifestyle we use data collected in the
city of Essen (Linnebach et al.
2014). It was not possible to use the national survey because
it provides only data on the shares per lifestyle of the whole
population. Since the population group 'homeowners' have, on average, a
higher 'level of living', their distribution among lifestyles does not
match the rest of the population.
Table 2: Otte's lifestyle typology, horizontal: modernity/biographical perspective, vertical: level of living. The numbers in the square brackets indicate: the share of homeowners of the different lifestyles in per cent, their age in years, their net income in euros per month, and their attitude towards insulation ranging from −0.5 very negative to +0.5 very positive. The data was provided by Rückert-John et al. (2013) and Linnebach et al. (2014). 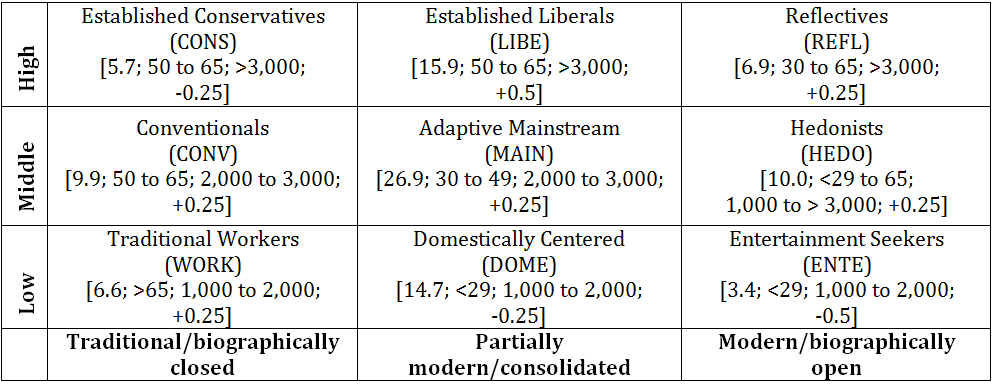
Socio-spatial structure
- 3.7
- For our model, we create an artificial socio-spatial
structure that resembles the building and social structure of
real-world urban areas. It consists of spatially distributed houses and
their homeowners located in the same position as their houses. Each
homeowner occupies one patch on a two-dimensional rectangular plane
with side lengths of 60 continuous units. One unit represents the
lateral length of one homeowner's property. Considering that properties
in western Germany have an average area of 610 square meters (statista 2009), the modeled
area corresponds to approximately 2.25 square kilometers. Parameter
\(D\) is used to define the population density, which is the number of
homeowners in relation to the total number of patches. Houses of a
similar construction year and type are typically located close to each
other (Ottens 2012). For
this reason, in the model houses are spatially clustered based on these
values. During the clustering process, houses are initially randomly
distributed over the grid. The following equation is then used to
calculate the probability (\(P_C\)) that a house will remain at the
chosen location. These steps are repeated until all houses are set.
Throughout the initializations of the simulation experiments, they
follow the same course of action.
$$ P_C = \frac{N_C}{N} $$ (1) - 3.8
- NC is the number of houses built in the same construction
year category (see Table 3) in the direct
neighborhood; N is the total
number of houses in the direct neighborhood. Table 3
provides an
overview of the share of detached and terraced houses and their
insulation status by construction year category, as provided by the
'Institut Wohnen und Umwelt' (IWU) (Diefenbach
et al. 2010). In IWU's building typology, building phases of
similar construction methods are used to classify housing units of
different construction years into same construction year categories.
The typology is a standard to classify buildings in Germany and thus
ensures that our simulation results are comparable to other studies
focusing on building insulation. The share of houses with
'next-generation' insulating glazing (triple-glazed windows) was
virtually zero at the end of 2006 (VFF
& BF 2014).
Table 3: Share of detached and terraced housing units and insulated building components by construction year category in the German building stock (Diefenbach et al. 2010). Construction year <1918 1918-
19481949-
19571958-
19681969-
19781979-
19831984-
19941995-
20012002-
2006Housing units [%] 14.7 12.4 11.4 14.0 12.7 6.1 12.4 12.1 4.0 Wall insulated [%] 35.1 30.3 33.0 35.7 41.9 46.8 47.0 60.7 64.3 Roof insulated [%] 59.0 60.3 69.2 71.2 81.6 85.2 92.3 96.6 97.4 Floor insulated [%] 22.9 17.4 20.8 21.0 37.7 41.2 61.7 75.4 83.9
- 3.9
- The socio-spatial structure of an urban area is
additionally based on the preference of similar[3]
lifestyle groups for
the same residential areas. For example, upper class residential areas
are in higher demand among individuals with high economic and cultural
resources (dimension 'level of living'). This results in residential
segregation, the physical separation of groups into different parts of
the urban environment (Massey
& Denton 1988). The degree of residential segregation
can be captured by dissimilarity indices, which indicate the evenness
with which two groups of people are distributed across subareas of an
entity. During our model initialization, homeowners are initially
randomly distributed among the houses. Next, we use the following
equation to calculate lifestyle \(X\) homeowners' satisfaction with
their surroundings. The level of satisfaction (\(S_X\)) ranges from 0
(dissatisfaction) to 1 (maximum satisfaction).
$$ S_X = \left.\sum_{i=1}^{N_R} (1-I_{XY_i}) \right/N_R $$ (2) - 3.10
- \(N_R\) is the number of other homeowners in a given radius \(R\). A large radius leads to a high level of residential segregation, and vice versa (see Table 4). In order to facilitate interpretation of later simulations, we then refer to \(R\) as the 'level of residential segregation'. \(I_{XY}\) are dissimilarity indices between lifestyle \(X\) and lifestyle \(Y\) for which the data is provided by Otte (2008) (see Appendix B, Table 9). Once each homeowner's level of satisfaction has been calculated, those with a satisfaction level of 1 remain at their chosen location. The remaining homeowners first leave the grid and then randomly choose a new house. Each round, the level of satisfaction needed for homeowners to remain falls by 0.001. This procedure, inspired by the famous Schelling model, finishes as soon as all homeowners have found a satisfactory place to reside.
- 3.11
- Table 4 shows how the level of residential segregation and
the population density affects socio-spatial structures. In the left
panel, the level of residential segregation is lower than in the right
panel, visible in the stronger clustering of homeowners of identical
lifestyle groups, indicated by identical shades of color. The
population density is higher in the bottom panel than in the top one.
Table 4: Examples of socio-spatial structures of different levels of residential segregation (\(R\)) and population density (\(D\)). The different shades of color represent homeowners of different lifestyle groups. 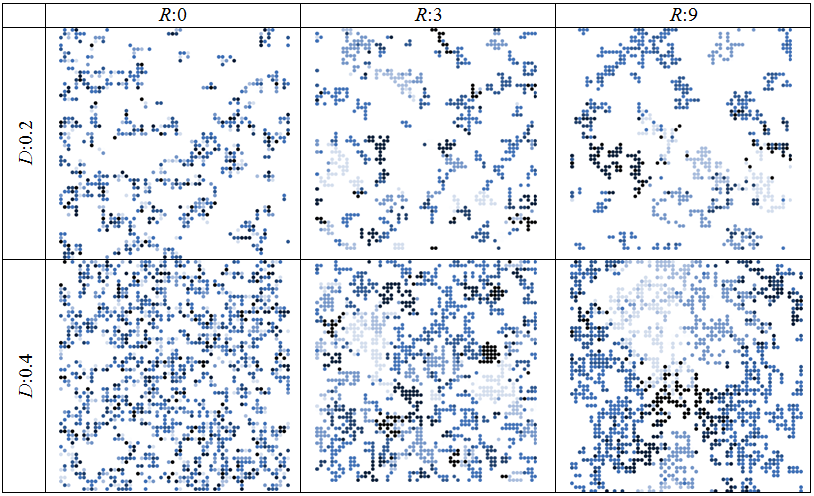
Social network
- 3.12
- Once the socio-spatial structure has been arranged, the
social network is established. The theoretical framework suggests that
network ties in the model need to represent a relationship where
homeowners influence each other's decision-making by sharing
information on renovation. Rogers (2010)
states that sharing information occurs most frequently among
homophilous individuals. He defines homophily as "the degree to which
pairs of individuals who interact are similar in certain attributes,
such as beliefs, education, social status, and the like" (Rogers 2010, p. 18). Holzhauer
et al. (2013) show how
to consider homophily when generating social networks for agent-based
modeling. Their algorithm considers that the probability of linking
also depends on the geographical distance between potential partners.
We adapted the algorithm from Holzhauer et al. (2013)
to generate the social
network. Otte's lifestyle concept is used to capture the degree of
homophily between two individuals. Thus, the likelihood (\(P_{XY}\))
that a homeowner of lifestyle \(X\) links with another homeowner of
lifestyle \(Y\) is described as follows:
$$ P_{XY} = \frac{A_{XY}}{\Delta E^2} $$ (3) - 3.13
- \(A_{XY}\) is the likelihood that homeowners of lifestyles
\(X\) and \(Y\) will link if they come into contact with each other.
Values for \(A_{XY}\) are provided by Otte (2008)
(see Appendix B, Table 10).
Low values in Table 10 stand
for a low probability that two homeowners link if they come into
contact with each other, such as in the case of conservative and
entertainment seeking lifestyles. The empirically based likelihoods are
employed to consider that the effectiveness of communication depends on
who is communicating with each other. The probability that two
homeowners will come into contact with each other decreases
quadratically with the distance (\(\Delta E\)) between them. The
distance from one homeowner to another is measured from the center of
one property to another. For adjacent properties, this is the side
length of one patch corresponding to approximately 25 meters in the
real world. The average number of links per homeowner generated this
way is between two and four. This range is consistent with results of a
survey in which data was collected on the number of relationships in a
city through which households exchange their views and opinions on
heating-related topics (Jensen et
al. 2014).
Homeowners' decision-making processes
- 3.14
- The theoretical framework shows that two events are of
utmost importance when sketching the decision-making process of
homeowners with regard to insulating their houses. First, there has to
be an initiating occasion when homeowners start thinking about
renovating their property. Homeowners then have to decide what type of
renovation they wish to undertake. Table 5
provides an overview of the main elements of homeowners'
decision-making processes concerning renovation. The table shows that a
homeowner starts thinking about renovating, for example, if the
structural condition of the house requires maintenance such as painting
the facade. If the house does not have wall insulation, then painting
the facade is an ideal opportunity for simultaneously installing wall
insulation. We further consider that the decision regarding the type of
renovation to undertake is delayed by financial constraints (Wilson et al. 2013).
Table 5: Inventory of situational factors, occasions and renovation activities. 1) Rather than standard glazing When to start thinking about renovating Deciding about which type of renovation to undertake
Situational factors
Occasions Standard renovation Combinable insulation Structural
condition of house
Financial constraints
Maintenance
Standard glazing
Insulating glazing1) Exterior rendering Wall insulation
Facade painting Roof renewal Roof insulation Heating system renewal
and queuing standard
renovationsQueuing (combinable)
insulationAttic extension
Roof renewal
Roof insulation
Socio-
demographic
situation
House purchase
Queuing standard
renovations
Queuing (combinable) insulation
Basement extension
Floor insulation
- 3.15
- We now describe how the two events 'When to start thinking
about renovating' and 'Deciding about which type of renovation to
undertake' were implemented into the model. In the model, a
decision-making process can be triggered in each tick, which represents
one month.
When to start thinking about renovating
- 3.16
- Homeowners start to think about renovating their property when a renovation occasion occurs. Stieß and Dunkelberg (2012) list three main occasions: 1) purchase of a building, 2) extensions/alterations and 3) maintenance/repair. According to Stieß and Dunkelberg (2012), such particular situations are associated with the condition of a building and the homeowner's socio-demographic situation/phase of life. Data on average occupancy periods was used to estimate the distribution of points in the homeowners' lifetime when they purchase new buildings (DCLG 2010). Homeowners contemplate extending the attic if more space is required due to an addition to the family, which is affected by the homeowners' age. It is assumed that a basement extension is only considered if no other measures are carried out after the house purchase. Maintenance/repair is required when the building components reach the end of their lifetime. For this purpose the advancing age of buildings components over time is considered by the model.
- 3.17
- We assume that renovation occasions always lead to the
associated renovation activities. In particular, financial constraints
do not fully hamper renovation activities, but merely delay them. Thus,
the period between thinking about renovating and undertaking the
measures is prolonged due to financial constraints (Wilson et al. 2013). The
following equation is used to determine the period between these two
events, measured in years (\(T_h\)):
$$ T_f[a] = F \cdot T_a[a] \cdot \frac{I_a[\,\,\mathrm{C\!\!\!\!\!\!\!=}\, /a]}{I_h[\,\,\mathrm{C\!\!\!\!\!\!\!=}\, /a]} $$ (4) - 3.18
- The average length of time taken by homeowners o think
about renovating before taking action (\(T_a\)) was estimated to be 0.5
years, based on findings by Wilson et al. (2013).
\(I_h\) is each homeowner's net income, and \(I_a\) is the average net
income of all homeowners (approximately € 39,600 per year). The impact
of financial constraints on the period between thinking about
renovating and taking action is varied by applying parameter \(F\).
Deciding about which type of renovation to undertake
- 3.19
- In this step, homeowners decide whether or not to insulate their houses as presented in Table 5. A precondition that insulation measures are considered is that either the lifetime of existing insulation has expired or no insulation has yet been installed. The decision then depends on 1) the perceived value of information and 2) homeowners' attitudes towards insulation. A homeowner will therefore decide to have insulation installed if its perceived utility becomes positive. Perceived utility is defined by the sum of the homeowner's individual attitude towards insulation and the perceived value of information.
- 3.20
- The perceived value of information received through social
networks depends on the effectiveness of communication, the closeness
in time and space, and the number of people in the social network (Latane 1981). The factors
'closeness in space' and 'effective communication' are already taken
into account in the algorithm used to establish the social network.
Thus, the composition of the social network considers the geographical
distance between homeowners and network ties represent relationships
where homeowners can influence each other's decision-making. The
remaining two factors, 'closeness in time' and 'number of people in the
social network', were incorporated in a calculation of the perceived
value of information (\(I_h\)) (see Equation 5).
$$ I_h = \frac{W}{N} \cdot \sum_{i=1}^N \frac{F_i[a]}{T_i[a]} \cdot N^{0.6} $$ (5) - 3.21
- The time that has elapsed since network contacts last
renovated (\(T_i\)) is used to capture 'closeness in time'. Thus, the
perceived value of information received through individual network
contacts decreases with the time that has elapsed since they last
renovated. Further, we adopt Latane's (1981)
finding that the perceived value of information provided by individual
contacts decreases in line with an increasing total number of network
contacts (\(N\)) by employing an exponent of 0.6. In the absence of
more accurate data, the specific value of 0.6 was estimated by the
authors based on experimental findings from Latane (1981). \(F_i\) is −1 if the
network contact's perceived utility is negative and +1 if the network
contact's perceived utility is positive. In this way, we consider that
the information received can be in favor of or against having
insulation installed. \(W\) is a weighting factor for information
received, used later in the simulation experiments. For \(W\) to equal
one, the homeowner's perceived value of information attains a value of
2.3 if four out of four network contacts had insulation installed
within the last year. Typically, values range between −1 and +1.
Insulation activity indicators
- 3.22
- The annual insulation rate (\(I_{1a}\)) is a widely used
dimension to track insulation activity (Lechtenböhmer
& Schüring 2011; Olonscheck
et al. 2011; Weiss et al.
2012). It is calculated as follows (Diefenbach
et al. 2010):
$$ I_{1a} = (25\% \cdot N_{ro,ins} + 50\% \cdot N_{wa,ins} + 12\% \cdot N_{fl,ins} + 13\% \cdot N_{wi,ins})/N_h $$ (6) - 3.23
- \(N_{ro,ins}\), \(N_{wa,ins}\), \(N_{fl,ins}\),
\(N_{wi,ins}\) is the number of houses where roof, wall and floor
insulation and insulating glazing were installed over a one-year
period. \(N_h\) is the total number of houses. Diefenbach et al. (2010) set the weightings of
the measures (percentages in the equation) according to their
contribution to resulting energy savings. The annual insulation rate is
our main indicator for tracking homeowners' insulation activity. It is
calculated considering all homeowners in the model. We also capture
lifestyle-specific insulation rates (\(I_{1a,s}\)). Further, we track
the development of the insulation condition of buildings by means of
the insulation backlog (share of building components with outdated or
nonexistent insulation). The insulation backlog (\(B\)) is calculated
as follows:
$$ B = (25\%\cdot N_{ro,ba} + 50\%\cdot N_{wa,ba} + 12\%\cdot N_{fl,ba} + 13\%\cdot N_{wi,ba})/N_h $$ (7) - 3.24
- \(N_{ro,ba}\), \(N_{wa,ba}\), \(N_{fl,ba}\), \(N_{wi,ba}\) is the number of houses where the roof, wall and floor insulation and insulating glazing is outdated or nonexistent. The weightings are identical to those used to calculate the insulation rate. The insulation backlog represents the remaining energy-saving potential that can be achieved by installing insulation. An insulation backlog of 30 per cent, for example, means that only two-thirds of the present energy-saving potential that can be achieved by installing insulation is exhausted.
Experimental
design and model results
- 4.1
- During the simulation experiments we explored how
homeowners' insulation activity varies between socio-spatial
structures. Further, we explored homeowners' insulation activity over
time. In order to ensure that the analysis was comprehensive, we
selected parameters for variation that influence the main elements of
homeowners' decision-making processes, identified by developing the
theoretical framework of the model. In the following, we introduce the
setting of the experiments including their setup, execution and design,
and provide an overview of the experiments conducted. Subsequently, we
present and discuss the results of the simulation experiments.
Experimental design
-
Setup and execution
- 4.2
- The simulation experiments were conducted as follows: during model initialization, 1) an artificial socio-spatial structure was created, 2) a social network was established, and 3) a preparatory simulation phase was executed. This preparatory simulation phase was necessary because agents' perceived utility is mutually dependent and cannot be consistently defined up-front. The formation of perceived utility resulted in a significant fluctuation of homeowners' insulation activity during the first steps of the model. We therefore ran the model until the distribution of homeowners' perceived utility to have insulation installed had settled. After this preparatory simulation phase, the homeowners' socio-technical attributes were set back to the base year, while retaining the distribution of perceived utility.
- 4.3
- The simulation spanned ten years, with 120 time steps, each
representing a month. Although insulation is a long-term investment, we
argue that the simulated period of ten years is sufficient. In order to
explore homeowners' present insulation activity, therefore, it was not
necessary to look far into the future. However, the period had to be
long enough to ensure that a statistically relevant number of
renovations were conducted by homeowners from each lifestyle group.
This condition had to be met in all simulation experiments. A period of
five years was found to be too short due to the delaying effect that
financial constraints have on homeowners' insulation activity, explored
in one of the simulation experiments. More than 50 per cent of
homeowners renovated at least once over a ten-year period. This
includes standard renovation measures such as renewing the roof or the
facade, and partial insulation measures such as insulating the wall or
the floor only.
Experiments
- 4.4
- In order to determine suitable parameter ranges and
parameter combinations for our experiments, we used Latin Hypercube
Sampling (LHS), "a statistical technique that guarantees uniform
sampling with the desired granularity of the scenario space given in a
Y dimensional parameter space and with a limit of X experiments" (van Dam et al. 2012, p. 110). For
our purpose, LHS considers the five global parameters and finds where
in the parameter space the predifined number of 1,000 experiments
should be performed to get the most representative subset of the space.
In line with suggestions by Werker and Brenner (2004),
we specified wide parameter ranges for LHS:
- The 'population density' (\(D\)) was varied from 20 per cent (rural area) to 40 per cent (urban area). In the densely populated city of Munich, for instance, the area taken up by buildings and (related) open spaces makes up 44 per cent of the whole area (Kizlauskas 2011).
- The 'level of residential segregation' (\(R\)) was varied from 0 (no residential segregation) to 10 (high level of residential segregation). When \(R\) is 10, there is virtually no mixing between homeowners of different lifestyles (see Table 4).
- The 'average attitude towards insulation' (\(A\)) was varied from −0.5 to +0.5. The simulation results (see Fig. 3) show that there is virtually no insulation activity below an average attitude of −0.4. Above +0.4, the range of possible results remained unchanged.
- The parameter 'weighting of information received' (W) was varied from 0 (information received has no impact on the decision to insulate) to 10. At a value of 10, homeowners' perceived value of information typically ranged from −10 to +10. Since the second parameter that influences the decision to insulate – the attitude towards insulation – ranged from −1 to +1 (taking into account the variation of the average attitude), giving \(W\) a value of 10 significantly enhanced the assumed impact of the information received about the decision whether or not to insulate.
- The 'impact of financial constraints' (\(F\)) on the length of time between thinking about renovating and taking action was varied from 0 (no impact) to 10. Giving \(F\) a value of 10 delayed homeowners' decisions to renovate by five years on average.
- 4.5
- In order to explore the influence that different parameter
combinations have on homeowners' insulation activity, we ran
simulations, tracked the annual insulation rate, and calculated its
average over ten years (\(I_{10a}\)). The use of a ten-year average for
the insulation rate was found to be sufficient for exploring the
parameter space. Homeowners' insulation activity over time was explored
in the context of the more detailed analysis. As with the other
simulation experiments, the simulation was repeated 50 times for each
combination of parameter settings so as to be able to analyze the
variety of outcomes. For the analysis, we determine the median[4] of the 50 different
outcomes. By determining the median outcome of experiments with ten
repetitions, we found that they differed too much to be able to draw
statistically verified conclusions. In contrast, the median outcome of
experiments with 100 repetitions was found to be similar. Figure 3 shows the simulation results of
applying LHS.
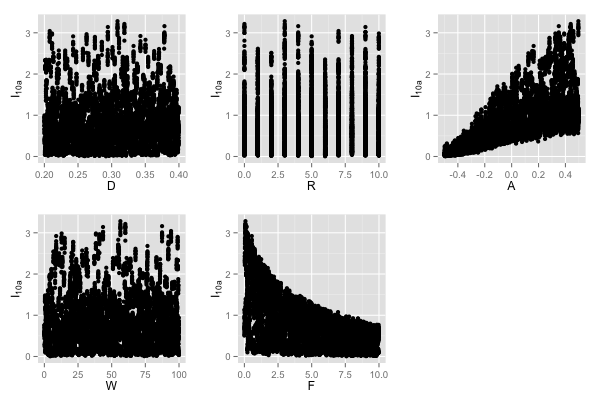
Figure 3. Simulation results of applying the Latin Hypercube Sample (LHS). The vertical axis represents the ten-year average of the median of insulation rates (I10a) depending on variations of the different parameters. - 4.6
- The simulation results of applying LHS were used to design the experiments as described below. An overview of the design of the experiments is given in Table 6. The preliminary results revealed a correlation[5] between insulation activity and average attitude (\(A\)). In addition, the same average attitude can lead to different results (range of over 2 percentage points). Consequently, the average attitude was varied throughout the experiments. Figure 3 shows that the impact of financial constraints (\(F\)) can limit the average insulation rate. In the first experiment (1), we explored the role of financial constraints in more detail by capturing the development of the annual insulation rate (\(I_{1a}\)) over time while varying the impact of financial constraints. Since we expected the insulation backlog (\(B\)) to be responsible for the partly high ten-year average insulation rate of over 3 per cent, its development was also captured. We adopted this approach because we expected the delay effects of financial constraints to become most visible when seen from a temporal perspective. In the second experiment (2), we explored whether homeowners' insulation activity varies between different socio-spatial structures. In our model, the socio-spatial structures varied in terms of 'population density' (\(P\)) and the 'level of residential segregation' (\(R\)).
- 4.7
- We then refined the analysis and additionally investigated
insulation activity among homeowners of different lifestyles (2.1) and
the influence of different levels of social impact affected by the
'weighting of information received' (\(W\)) (2.2). In order to make it
easier to analyze the results of the second simulation experiment, we
determined the ten-year average of the median of the insulation rates
captured (\(I_{10a}\), \(I_{10a,s}\)).
Table 6: Design of simulation experiments. Simulation experiments Parameters varied Indicators captured (1) Insulation activity over time \(A,\) \(F\) \(I_{1a}\), \(B\) (2) Insulation activity in different socio-spatial structures \(A,\) \(D\), \(R\) \(I_{10a}\) (2.1) Lifestyle groups \(A,\) \(D\), \(R\) \(I_{10a,s}\) (2.2) Social impact \(A,\) \(D\), \(R\), \(W\) \(I_{10a}\) Insulation activity over time
- 4.8
- We explored insulation activity over time in order to
examine the effect of financial constraints on homeowners' insulation
activity and to determine whether the insulation backlog (\(B\)) is the
factor that led to the partly high ten-year average insulation rate of
over 3 per cent. Figure 4 shows
the development of the annual insulation rate and the insulation
backlog over time. The impact of financial constraints (\(F\)) was
varied from 0.1 to 10. The average attitude (\(A\)) was varied from
−0.3 to +0.3, depicted by the color of the lines.
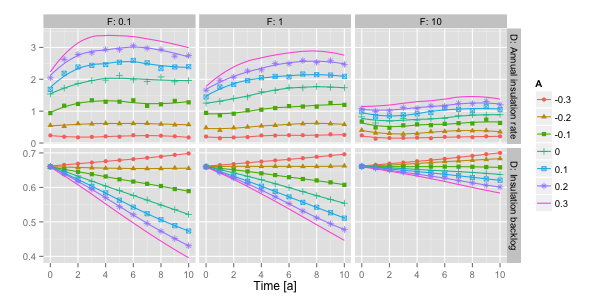
Figure 4. Insulation backlog and annual insulation rate over a ten-year period for different levels of average attitude (A) and varying impact of financial constraints (F). - 4.9
- The simulation results show that a considerably high insulation rate is possible by reducing the insulation backlog. The fact that a large portion of insulation installed will reach its respective lifetime over the next few years (see Fig. 5) caused an increase in the insulation rate during the first years of the simulation period in all cases. The simulations further show that changing the impact of financial constraints has a greater effect at high levels of average attitude, which result in a high share of decisions in favor of insulation. Here, reducing the influence of financial constraints led to more insulation measures being undertaken in a shorter period of time. Accordingly, this resulted in a faster depletion of the insulation backlog.
- 4.10
- However, the simulation results show that reducing or
increasing the impact of financial constraints at a low insulation rate
of about 1 per cent (with an average attitude of about −0.1), the
current rate in Germany, has only a minor impact on homeowners'
insulation activity.
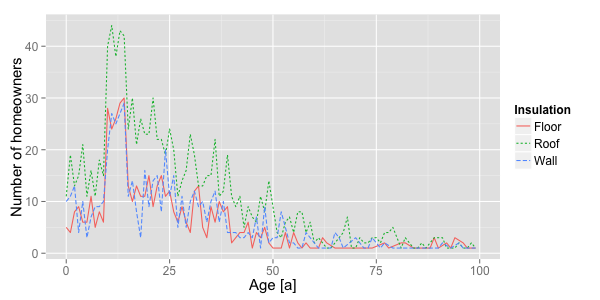
Figure 5. Exemplary age distribution of insulation installed by 1,440 homeowners (D:0.4) at the start of the simulation. Insulation activity in different socio-spatial structures
- 4.11
- In the second experiment, we recorded the ten-year average
of the median of insulation rates in different socio-spatial structures
and the values of average attitude (\(A\)), as presented in Figure 6.
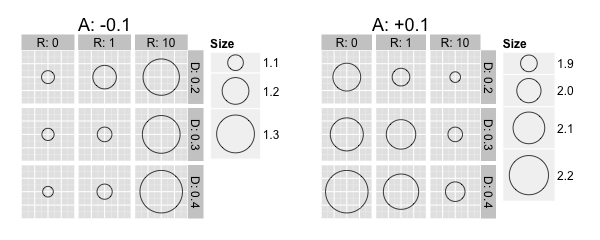
Figure 6. Insulation activity in socio-spatial structures. The size of the dots represents the ten-year average of the median of insulations rates (\(I_{10a}\)). - 4.12
- The simulation results show that socio-spatial structures influence homeowners' insulation activity. We found that a low level of residential segregation (low value for \(R\)) facilitated the diffusion of the dominant renovation behavior. The dominant renovation behavior was defined as the kind of decision (in favor of or against insulation) taken by the majority of homeowners. With an average attitude of +0.1, the dominant renovation behavior was to decide in favor of having insulation installed. This behavior was reinforced at a low level of residential segregation, as is apparent in the figure from the comparatively high levels of insulation activity. Here, the ten-year average of the median of insulation rates (\(I_{10a}\)) is around 1 per cent at a low level of residential segregation (\(R\):0) but reaches 1.3 per cent at high level of residential segregation (\(R\):10). With an average attitude of −0.1, the dominant renovation behavior was to reject the idea of having insulation installed. This behavior was reinforced at a low level of residential segregation, as is apparent in the figure from the comparatively low levels of insulation activity. At a high level of residential segregation, a reinforcement of the dominant (negative) renovation behavior was almost absent. We argue that this is because a high level of residential segregation leads to the formation of clusters of homeowners with a similar attitude, which are less prone to the impact of network contacts with opposing attitudes. This results in a greater heterogeneity of renovation behavior in the modeled environment.
- 4.13
- A high population density (high value for \(D\)) leads to a
network structure where the average number of contacts per homeowner is
higher than in the case of a low population density. As a result,
homeowners who live in areas with a high population density are
influenced by social interaction to a greater extent (cf. Equation 5).
In addition, the high network density facilitates the diffusion of the
dominant renovation behavior. As a consequence, we noticed that
increasing population densities led to increasing levels of insulation
activity in line with increased average attitude. This phenomena became
more apparent in Video 1 in
Appendix A by varying the average attitude
in single steps (+0.1 per step) from −0.4 to +0.4. With an average
attitude of −0.4, the highest level of insulation activity was obtained
with a low population density of 0.2; with an average attitude of +0.4,
it was obtained with a high population density of 0.4.
Lifestyle groups
- 4.14
- In order to analyze the effect of socio-spatial structures
on homeowners' insulation activity in greater detail, we further
recorded lifestyle-specific insulation rates. Figure 7
presents the results of the simulations we ran.
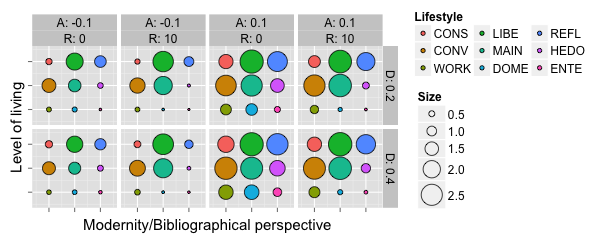
Figure 7. Diffusion of insulation activity among lifestyles. The size of the colored dots represents the ten-year average of the median of lifestyle-specific insulation rates (\(I_{10a,s}\)). The dots are shown in the same order as the legend sequence. For an explanation of the abbreviations of the nine different lifestyles, see Table 2. - 4.15
- By determining standard deviations between the nine
lifestyle-specific insulation rates for the same parameter
combinations, we found that they decrease as the level of residential
segregation decreases (lower values for \(R\)). This confirmed the
previous finding that a low level of residential segregation
facilitates the diffusion of the dominant renovation behavior between
homeowners of different lifestyles, and vice versa. A low level of
residential segregation enables lifestyles such as Established
Conservatives, Traditional Workers, Domestically Centered, Hedonists,
and Entertainment Seekers to build network contacts to lifestyles with
a more positive attitude towards insulation such as Conventionals,
Established Liberals, Adaptive Mainstream, and Reflectives.
Consequently, in cases of a positive average attitude, more homeowners
decide to have insulation installed. If the average attitude is
negative, the same effect leads to a lower level of insulation
activity. The simulation results further indicate that a higher
population density induces a greater diffusion of the dominant
renovation behavior. This phenomena became more apparent in Video 2 in
Appendix A by varying the average attitude in single steps (+0.1 per
step) from −0.4 to +0.4.
Social impact
- 4.16
- Within the different socio-spatial structures, we further
distinguished between different 'weightings of information received'
(\(W\)) in order to investigate the effect they have on homeowners'
insulation activity. In the simulation experiments, we varied the
average attitude (\(A\)) in single steps (+0.1 per step) from −0.4 to
+0.4 and parameter \(W\) within a range from 0 to 10 (0,1,10) (see Video 3 in Appendix A).
Figure 8
shows the simulation results for an average attitude of −0.2 and −0.3,
which are of particular interest for our analysis.
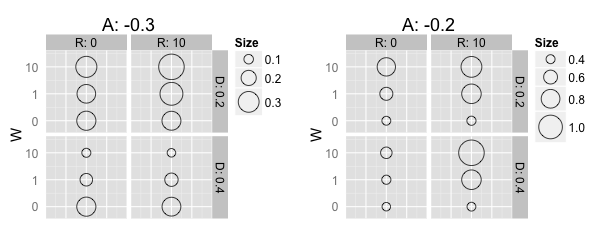
Figure 8. Importance of social interaction. The size and color of the dots represent the ten-year average of the median of insulations rates (\(I_{10a}\)). - 4.17
- High values for \(W\) were found to enforce the particular effects that socio-spatial structures have on homeowners' insulation activity. A high weighting of information received led to a stronger separation between adopters and rejecters of insulation. If the specific socio-spatial structure had a positive effect on homeowners' insulation activity, e.g. with a high residential segregation and a negative average attitude, the effect was enforced by a stronger separation between adopters and rejecters of insulation (see Table 7). Thus, additional contacts within adopters' networks are also convinced into insulating their homes.
- 4.18
- The enforcing effect of \(W\) enabled us to identify the point from which an effect on insulation activity emerges from specific socio-spatial structures. The 'neutral point', where \(W\) had virtually no influence on homeowners' insulation activity, was found to be between parameter combinations \(A\):−0.2, \(R\):0, \(D\):0.4 and \(A\):−0.3, \(R\):0, \(D\):0.2. In all of the other parameter combinations, \(W\) either led to a decrease (e.g. at \(A\):−0.3, \(R\):0, \(D\):0.4) or an increase (e.g. at \(A\):−0.2, \(R\):10, \(D\):0.4) in homeowners' insulation activity.
- 4.19
- The fact that the insulation rate in Germany is above the
point where socio-spatial structures have no influence on homeowners'
insulation activity (at the 'neutral point', the insulation rate is in
the range of 0.3 and 0.4 per cent) indicates that the conditions for a
diffusion
of insulation activity may vary substantially between regions with
different socio-spatial structures.
Table 7: Exemplary illustration of homeowners' perceived utility of having insulation installed for different 'weightings of information received' (\(W\)) (left \(W\):0, right \(W\):10) indicated by different shades of color. The darker (brighter) the dots, the higher (lower) the homeowners' perceived utility. In this example, the share of homeowners with a perceived utility greater than zero is 31 per cent (43 per cent) for \(W\):0 (\(W\):10). 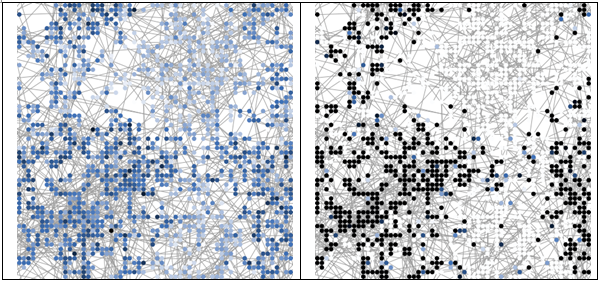
Discussion
and conclusion
- 5.1
- In this paper, we developed a theoretical framework to capture homeowners' decision-making processes with regard to having their houses insulated, and translated it into an agent-based model (ABM) to explore how situational factors and social interaction influence their insulation activity.
- 5.2
- In this section, we discuss the validity of the model and,
based on the simulation results, provide recommendations for designing
innovative policy instruments that acknowledge the important role
played by the aforementioned factors in homeowners' renovation
decisions. Further, we propose avenues for future research.
Model validity
- 5.3
- At an early stage of its development, the model was
presented and discussed at the SSC 2014 in Barcelona (Friege & Chappin 2014b).
In addition, the structural design of the model and the consistency of
the preliminary simulation results were validated at a workshop with
building insulation and consumer behavior experts. The design of the
model was based on insights gained from a bibliographic analysis (Friege & Chappin 2014a),
empirical findings on homeowners' decision-making concerning
insulation, and insights from consumer behavior literature. In order to
ensure a realistic representation of real-world conditions, we used
empirical data on the structural condition of houses in Germany and
homeowners' socio-demographic situation. Uncertain parameters were
varied in simulation experiments to evaluate the impact they have on
the results. For a number of parameter combinations, the model
reproduced Germany's present annual insulation rate of about 1 per
cent, leading us to place even greater confidence in the overall
validity of the model.
Situational factors
- 5.4
- Situational factors play an important role in homeowners' insulation activity, because they trigger renovation occasions, which were identified as a requirement for homeowners to undertake standard renovation measures and consider insulating their homes. Consequently, homeowners' insulation activity is potentially higher in areas with many buildings in need of renovation and insulation, an active housing market (short occupancy periods), and a low level of financial constraints (e.g. due to a high average income). Out of these situational factors, policies may address the impact of financial constraints, e.g. by offering subsidies for renovation, as is the case in existing policy instruments. However, our simulations indicate that reducing financial constraints only has a small potential to increase Germany's insulation rate above its current level of 1 per cent, although Germany's insulation backlog would allow an insulation rate of up to 3 per cent for a limited period of time.
- 5.5
- In order to increase the number of households having
insulation installed, additional instruments are required to encourage
homeowners to include insulation in the renovation process. Such
instruments should focus on the times when occasions occur and should
raise awareness of the benefits of insulating homes. This could be
achieved, for example, by incentivizing lenders and craftsmen to advise
homeowners on having insulation installed.
Social interaction
- 5.6
- The simulation experiments show that the socio-spatial structure is relevant for the diversity of insulation activities among homeowners of different lifestyles. We found that a low level of residential segregation facilitates the diffusion of the dominant renovation behavior, i.e. the decision (in favor of or against insulation) made by the majority of homeowners is reinforced. Such reinforcement is virtually absent at high levels of residential segregation. These findings are consistent with the work by Choi et al. (2010), who compared the diffusion of innovations in a highly cliquish network and a network with more random bridges (Choi et al. 2010). Further, high population densities also facilitate the diffusion of the dominant renovation behavior. The degree of influence of social interaction on homeowners' individual decision-making determines how strong these effects of socio-spatial structures are on the diffusion of the dominant renovation behavior.
- 5.7
- In conclusion, the success of policy instruments aiming at
increasing homeowners' insulation activity in a specific region may be
highly dependent on the existing socio-spatial structure. Thus, we
recommend considering the local situation before carrying out
information campaigns, on-site consultation of homeowners, or other
spatially delimited measures. Since social network contacts have a
strong influence on homeowners' decision-making with regard to
insulation, harnessing social networks to promote the installation of
insulation is a promising option for increasing homeowners' insulation
activity. Relevant measures could include money-back vouchers for
adopters, which they pass on to other homeowners or open house events
for neighbors of homeowners who recently had their houses insulated.
Future research
- 5.8
- The results of the simulation experiments enable general recommendations to be derived for the design of innovative policy instruments. However, the results indicate that homeowners' insulation activity depends largely on their attitude towards insulation and the impact of social interaction on their decision to insulate, which were varied throughout the experiments due to insufficient data. In order to adequately evaluate the effectiveness of specific policy instruments aiming at increasing homeowners' insulation activity using agent-based modeling, therefore, the distribution of homeowners' attitudes towards insulation and the impact social interaction has on the individual's decision to insulate must be calibrated by conducting empirical research. Due to our finding that local socio-spatial structures can influence homeowners' insulation activity, we further recommend implementing more specific socio-spatial structures when aiming to evaluate specific policy instruments.
- 5.9
- Finally, we hope that our work leads to a better understanding of homeowners' decision-making regarding having their houses insulated, and that it encourages the development of more effective policies aiming at stimulating insulation activity, as required to meet climate protection targets.
Acknowledgements
- This work was supported by the Heinrich-Böll-Stiftung, the Wuppertal Institute for Climate, Environment and Energy, and Germany's Federal Ministry of Education and Research.
Notes
- 1The
term 'standard renovation measure' is later used to refer to such
measures that do not improve the insulation of the house.
2If, for example, the house age is 110 years and a component's lifetime is 50 years, the age of the component is assumed to be 110 minus two times 50 years.
3Here, similarity means close to each other in Otte's two-dimensional lifestyle typology.
4We use the median rather than the average to account for a distribution of the simulation results that is not necessarily symmetrical.
5\(\mathrm{corr}(A,I_{10a})=0.70\), \(p\)-value < 2.2e–16
Appendix
A: Supplementary results
-
Video 1. Insulation activity among socio-spatial structures. The size and color of the dots represent the median of the average insulation rate over a ten-year period (\(I_{10a}\)). When playing the video, the average attitude (\(A\)) is varied from −0.4 to 0.4
Video 2. Diffusion of renovation behavior among lifestyles. The size of the dots represents the median of the lifestyle-specific insulation rate over a ten-year period (\(I_{10a,s}\)). When playing the video, the average attitude (\(A\)) is varied from −0.4 to 0.4.
Video 3. Importance of social interaction. The size and color of the dots represent the median of the average insulation rate over a ten-year period (\(I_{10a}\)). When playing the video, the average attitude (\(A\)) is varied from −0.4 to 0.4.
Appendix
B: Supplementary data
-
Table 8: Lifetime of building elements. 1) With more than 95 per cent of the values within the lifetime boundaries provided by Agethen et al. (2008). Building elements Lifetime [a] Distribution1) Roof insulation 30-50 N(40,5) Wall insulation 30-50 N(40,5) Floor insulation 30-50 N(40,5) Roofing 40-60 N(50,5) Windows2) 20-40 N(30,5) Heating system 15-25 N(20,2.5) Exterior rendering 35-65 N(50,7.5) Facade painting 10-20 N(15,2.5) Table 9: Dissimilarity indices (\(I_{XY}\)) for the different lifestyles provided by Otte (2008). For an explanation of the abbreviations of the nine different lifestyles, see Table 2. [%] CONS CONV WORK LIBE MAIN DOME REFL HEDO ENTE CONS 0 13 15 9 13 20 12 15 22 CONV 13 0 12 10 10 14 23 20 20 WORK 15 12 0 13 8 12 20 11 8 LIBE 9 10 13 0 6 19 13 12 20 MAIN 13 10 8 6 0 19 19 13 14 DOME 20 14 12 19 19 0 24 15 12 REFL 12 23 20 13 19 24 0 14 26 HEDO 15 20 11 12 13 15 14 0 12 ENTE 22 20 8 20 14 12 26 12 0 Table 10: Values \(A_{XY}\) used to generate the social network provided by Otte (2008). For an explanation of the abbreviations of the nine different lifestyles, see Table 2. [%] CONS CONV WORK LIBE MAIN DOME REFL HEDO ENTE CONS 23 3 10 26 8 3 21 5 3 CONV 13 18 13 17 27 4 4 4 1 WORK 0 24 24 4 16 22 0 4 7 LIBE 11 8 2 23 18 4 17 14 2 MAIN 4 11 5 11 26 11 9 17 6 DOME 1 14 16 5 17 25 1 10 11 REFL 6 1 0 15 11 4 28 31 4 HEDO 2 4 2 7 20 7 11 34 15 ENTE 0 1 3 1 16 21 7 23 28
References
- AGETHEN, U.,
Frahm, K. J.,
Renz, K., & Thees, E. P. (2008). Lebensdauer von Bauteilen,
Zeitwerte. Bund Technischer Experten e. V., Arbeitsblatt der
BTE-Arbeitsgruppe Lebensdauer von Bauteilen, Zeitwerte. Stand, 14,
2008.
AN, L. (2012). Modeling human decisions in coupled human and natural systems: review of agent-based models. Ecological Modelling, 229, 25–36.
BALARAS, C. A., Gaglia, A. G., Georgopoulou, E., Mirasgedis, S., Sarafidis, Y., & Lalas, D. P. (2007). European residential buildings and empirical assessment of the Hellenic building stock, energy consumption, emissions and potential energy savings. Building and Environment, 42(3), 1298–1314.
BALL, R., Cullen, R., & Gan, C. (1999). The diffusion of energy efficiency innovations among residential energy consumers. New Zealand Economic Papers, 33(1), 115–135.
BARTIAUX, F., Gram-Hanssen, K., Fonseca, P., Ozolina, L., & Christensen, T. H. (2011). A practice-theory based analysis of energy renovations in four European countries. eceee 2011 summer study.
BONABEAU, E. (2002). Agent-based modeling: Methods and techniques for simulating human systems. PNAS, 99, 3.
CHAPMAN, R., Howden-Chapman, P., Viggers, H., O'dea, D., & Kennedy, M. (2009). Retrofitting houses with insulation: a cost–benefit analysis of a randomised community trial. Journal of epidemiology and community health, 63(4), 271–277.
CHOI, H., Kim, S.-H., & Lee, J. (2010). Role of network structure and network effects in diffusion of innovations. Industrial Marketing Management, 39(1), 170–177.
DCLG (2010). Housing and Planning Statistics 2010, from the Department for Communities and Local Government: www.gov.uk.
DIEFENBACH, N., Cischinsky, H., Rodenfels, M., & Clausnitzer, K.-D. (2010). Datenbasis Gebäudebestand. Datenerhebung zur energetischen Qualität und zu den Modernisierungstrends im deutschen Wohngebäudebestand. IWU, Darmstadt, 9.
ENKVIST, P., Nauclér, T., & Rosander, J. (2007). A cost curve for greenhouse gas reduction. McKinsey Quarterly, 1, 34.
FISHBEIN, M., & Ajzen, I. (1975). Belief, attitude, intention and behavior: An introduction to theory and research.
FRIEGE, J., & Chappin, E. (2014a). Modelling decisions on energy-efficient renovations: A review. Renewable and Sustainable Energy Reviews, 39, 196–208.
FRIEGE, J., & Chappin, E. J. (2014b). Simulating the influence of socio-spatial structures on energy-efficient renovations. Social Simulation Conference, Barcelona, Spain, 10.
GRIMM, V., Berger, U., DeAngelis, D. L., Polhill, J. G., Giske, J., & Railsback, S. F. (2010). The ODD protocol: A review and first update. Ecological Modelling, 221(23), 2760–2768, from http://www.scopus.com/inward/record.url?eid=2-s2.0-77957301158&partnerID=40&md5=14fa1b66a95b6fe93f099ff2d4e2f3a7
GUAGNANO, G. A., Stern, P. C., & Dietz, T. (1995). Influences on Attitude-Behavior Relationships: A Natural Experiment with Curbside Recycling. Environment and behavior, 27(5), 699–718.
GU, X., Blackmore, K., Cornforth, D., & Nesbitt, K. (2015). Modelling Academics as Agents: An Implementation of an Agent-Based Strategic Publication Model. Journal of Artificial Societies and Social Simulation, 18(2), 10.
HOLZHAUER, S., Krebs, F., & Ernst, A. (2013). Considering baseline homophily when generating spatial social networks for agent-based modelling. Computational and Mathematical Organization Theory, 1–23.
IEA (2013). Transition to Sustainable Buildings: Strategies and Opportunities to 2050, from www.iea.org
JAKOB, M. (2006). Marginal costs and co-benefits of energy efficiency investments: The case of the Swiss residential sector. Energy policy, 34(2), 172–187.
JAKOB, M. (2007). The drivers of and barrriers to energy efficiency in renovation decisions of single-family home-owners (CEPE Working Paper No. 56).
JENSEN, T., Chappin, E. J. L., & Holtz, G. (2014). Agent-based assessment framework for behavior-changing feedback devices: combined spreading of devices and energy conservation behavior in domestic heating. Technological Forecasting and Social Change, 98, 105–119.
KIRCHNER, A., & Matthes, F. C. (2009). Modell Deutschland Klimaschutz bis 2050: Vom Ziel her denken.
KIZLAUSKAS, S. (2011). Bodennutzungsflächen in München: Trends und Kennzahlen. Münchner Statistik, (1).
KLEEMANN, M., Hansen, P., & Vilz, A. (2005). Evaluierung der CO2-Minderungsmaßnahmen im Gebäudebereich: Forschungszentrum, Zentralbibliothek.
LATANE, B. (1981). The psychology of social impact. American Psychologist, 36(4), 343.
LECHTENBÖHMER, S., & Schüring, A. (2011). The potential for large-scale savings from insulating residential buildings in the EU. Energy Efficiency, 4(2), 257–270.
LINNEBACH, P., Wachsmann, J., & Behr, F. (2014). Potenziale für energieeffizientes Modernisieren in Essen: Ergebnisse einer Bevölkerungsumfrage.
MASSEY, D. S., & Denton, N. A. (1988). The dimensions of residential segregation. Social forces, 67(2), 281–315.
MCMICHAEL, M., & Shipworth, D. (2013). The value of social networks in the diffusion of energy-efficiency innovations in UK households. Energy Policy, 53, 159–168.
NAUCLÉR, T., & Enkvist, P.-A. (2009). Pathways to a Low-Carbon Economy: Version 2 of the Global Greenhouse Gas Abatement Cost Curve. Reprinted by permission: McKinsey & Company, from www.mckinsey.com/insights.
ÖLANDER, F., & Thøgersen, J. (1995). Understanding of consumer behaviour as a prerequisite for environmental protection. Journal of Consumer Policy, 18(4), 345–385.
OLONSCHECK, M., Holsten, A., & Kropp, J. P. (2011). Heating and cooling energy demand and related emissions of the German residential building stock under climate change. Energy Policy, 39(9), 4795–4806.
ORGAN, S., Proverbs, D., & Squires, G. (2013). Motivations for energy efficiency refurbishment in owner-occupied housing. Structural Survey, 31(2), 101–120.
OTTE, G. (2008). Sozialstrukturanalysen mit Lebensstilen. Eine Studie zur theoretischen und methodischen Neuorientierung der Lebensstilforschung. Wiesbaden.
OTTENS, S. M. (2012). Interactive BAG viewer, from http://bag.edugis.nl.
PUTRA, H. C., Zhang, H., & Andrews, C. (2015). Modeling Real Estate Market Responses to Climate Change in the Coastal Zone. Journal of Artificial Societies and Social Simulation, 18(2), 18.
RAND, W., Herrmann, J., Schein, B., & Vodopivec, N. (2015). An Agent-Based Model of Urgent Diffusion in Social Media. Journal of Artificial Societies and Social Simulation, 18(2).
ROGERS, E. M. (2010). Diffusion of innovations: Simon and Schuster.
RÜCKERT-JOHN, J., Bormann, I., & John, R. (2013). Umweltbewusstsein in Deutschland 2012: Ergebnisse einer repräsentativen Bevölkerungsumfrage.
SCHLESINGER, D. M., Prognos AG, Dietmar, P. D., EWI, & Lutz, D. C., GWS (2010). Energieszenarien für ein Energiekonzept der Bundesregierung. Basel/Köln/Osnabrück: Prognos AG, EWI - Energiewirtschaftliches Institut an der Universität zu Köln, Gesellschaft für Wirtschaftliche Strukturforschung (GWS).
STATISTA (2009). Immobilien: Durchschnittliche Grundstücksfläche in Westdeutschland und Ostdeutschland im Jahr 2009, from http://de.statista.com/statistik/daten/studie/73152/umfrage/immobilien-durchschnittliche-grundstuecksflaeche-2009/. Archived at: www.webcitation.org/6YZ45kq65.
STERN, P. C. (2000). Towards a Coherent Theory of Environmentally Significant Behavior, 56(3), 407–424.
STIEß, I., & Dunkelberg, E. (2012). Objectives, barriers and occasions for energy efficient refurbishment by private homeowners. Journal of Cleaner Production.
STOLTE, C. (2011). Dena-Sanierungsstudie: Begleitforschung zum dena-Projekt" Niedrigenergiehaus im Bestand"-Dena-Sanierungsstudie.-2. Wirtschaftlichkeit energetischer Modernisierung in selbstgenutzten Wohngebäuden: Bericht 2011.
TOMMERUP, H., & Svendsen, S. (2006). Energy savings in Danish residential building stock. Energy and Buildings, 38(6), 618–626.
VFF, & BF (2014). Mehr Energie sparen mit neuen Fenstern. Frankfurt a. M.
VAN DAM, Koen H., Igor Nikolic, & Zofia Lukszo (2012). Agent-based modelling of socio-technical systems. Vol. 9. Springer Science & Business Media.
VON WEIZSÄCKER, E. U. (2010). Faktor Fünf: Die Formel für nachhaltiges Wachstum.
WEIß, J., & Dunkelberg, E. (2010). Erschließbare Energieeinsparpotenziale im Ein- und Zweifamilienhausbestand. Berlin: Institut für ökologische Wirtschaftsforschung.
WEISS, J., Dunkelberg, E., & Vogelpohl, T. (2012). Improving policy instruments to better tap into homeowner refurbishment potential: Lessons learned from a case study in Germany. Energy Policy, 44, 406–415.
WERKER, C., & Brenner, T. (2004). Empirical calibration of simulation models. Papers on Economics and Evolution.
WILENSKY, U. (1999). NetLogo. Center for Connected Learning and Computer-Based Modeling, Northwestern University. Evanston, IL, from http://ccl.northwestern.edu/netlogo/hubnet.html.
WILSON, C., Chryssochoidis, G., & Pettifor, H. (2013). Understanding Homeowners' Renovation Decisions: Findings of the VERD Project.
XU, X., Taylor, J. E., & Pisello, A. L. (2014). Network synergy effect: establishing a synergy between building network and peer network energy conservation effects. Energy and Buildings, 68, 312–320.
ZUNDEL, S., & Stieß, I. (2011). Beyond profitability of energy-saving measures—attitudes towards energy saving. Journal of Consumer Policy, 34(1), 91–105.