Can Ethnic Tolerance Curb Self-Reinforcing School Segregation? A Theoretical Agent Based Model

and
aSorbonne Université - GEMASS - University of Trento, France; bDepartment of Sociology, ICS, University of Groningen, Netherlands
Journal of Artificial
Societies and Social Simulation 24 (2) 2![]()
![]()
<https://www.jasss.org/24/2/2.html>
DOI: 10.18564/jasss.4544
Received: 10-Aug-2020 Accepted: 15-Feb-2021 Published: 31-Mar-2021
Abstract
Schelling and Sakoda prominently proposed computational models suggesting that strong ethnic residential segregation can be the unintended outcome of a self-reinforcing dynamic driven by choices of individuals with rather tolerant ethnic preferences. There are only few attempts to apply this view to school choice, another important arena in which ethnic segregation occurs. In the current paper, we explore with an agent-based theoretical model similar to those proposed for residential segregation, how ethnic tolerance among parents can affect the level of school segregation. More specifically, we ask whether and under which conditions school segregation could be reduced if more parents hold tolerant ethnic preferences. We move beyond earlier models of school segregation in three ways. First, we model individual school choices using a random utility discrete choice approach. Second, we vary the pattern of ethnic segregation in the residential context of school choices systematically, comparing residential maps in which segregation is unrelated to parents’ level of tolerance to residential maps reflecting their ethnic preferences. Third, we introduce heterogeneity in tolerance levels among parents belonging to the same group. Our simulation experiments suggest that ethnic school segregation can be a very robust phenomenon, occurring even when about half of the population prefers segregated to mixed schools. However, we also identify a “sweet spot” in the parameter space in which a larger proportion of tolerant parents makes the biggest difference. This is the case when parents have moderate preferences for nearby schools and there is only little residential segregation. Further experimentation unraveled the underlying mechanisms.Introduction
School segregation is a threat to integration in multicultural societies. The clustering of different ethnicities in different schools is a persistent phenomenon in many countries (Bakker et al. 2011). It contributes to the widening of educational, occupational, and earnings inequalities between ethnic groups (Ashenfelter et al. 2006; Johnson 2011; Reardon & Owens 2014). Furthermore, schools have a key role to play in forming young generations’ attitudes toward diversity. Indeed, in the wake of Allport (1954), a large stream of research has demonstrated that under favorable conditions, inter-ethnic contacts can reduce ethnic prejudices (Dovidio et al. 2017; Powers & Ellison 1995). Intergroup contacts are even more important during youth, when children’s and adolescent’s attitudes are still forming (Wölfer et al. 2016). Therefore, early positive inter-ethnic contacts are crucial to form the attitudes next generations of citizens’ will hold on diversity. However, school segregation strongly limits opportunities for inter-ethnic contacts in the first place.
While school segregation can have highly undesirable societal consequences, there still is much to be learned about the social mechanisms causing it. Interestingly, a recent sociological literature review on school segregation (Reardon & Owens 2014) shows that the overwhelming majority of studies have assessed its consequences for educational inequality rather than its causes. Some studies, however, do address the issue by either documenting micro-level parental preferences for school characteristics through surveys or interviews (Borghans et al. 2015; Burgess et al. 2007; Karsten et al. 2003), or by looking at the relationships between school and residential segregation at the macro level (Frankenberg 2013; Johnston et al. 2006). Yet, what is largely absent is the connection between micro-level parental choice behavior and macro-level school segregation patterns. One reason why such work is much needed in our view is that, as a recent review of the field highlights, school segregation outcomes can strongly differ between different spatial and institutional contexts (Boterman et al. 2019). Our paper contributes to a small but growing agent-based literature stream addressing how interdependent parental school choices aggregate to produce school segregation in different social and spatial contexts, and under which conditions school segregation could be curbed.
A better understanding of the mechanisms driving segregation is particularly relevant because of the large-scale increase of ethnic diversity many societies are currently experiencing. Some even see a “diversity explosion” among the millennial generation (Frey 2018b, 2018a; Tasan-Kok et al. 2014; Vertovec 2009), raising hopes of more ethnic integration and of the erosion of ethnic boundaries in the foreseeable future. Notably, these new generations are populated by a growing number of “mixed-race” households (Ellis et al. 2007, 2012), and “mixed-race” individuals (Clark & Maas 2009), with strong preference for multicultural neighborhoods (Clark et al. 2018). A very recent study specifically analyzing residential choices of the millennials in the USA (Clark & Brazil 2018) shows considerable individual variation among ethnical groups, but also lower propensity to remain in ethnically homogenous neighborhoods dominated by co-ethnics. In Europe, surveys show that large fractions of natives are relatively tolerant towards ethnic minorities (Andersson et al. 2017).
The rise of diversity is accompanied by considerable transformation in residential segregation patterns. In the USA, Glaeser & Vigdor (2012) announced “the end of the segregated century”, and highlighted that entirely white neighborhoods almost completely disappeared. Others (Alba & Romalewski 2013) have a more nuanced view but many analysts converge to the idea that neighborhoods are becoming increasingly ethnically diverse (Farrell & Lee 2011; Hall et al. 2016; Lee et al. 2012). The emergence of ethnically mixed neighborhood is, according to Clark (2015), the major change in residential ethnic segregation of the past decades.
Increasing ethnic tolerance among significant fractions of the population can be expected to also have profound impact on school segregation. However, formal modelling work raises doubts as to whether, and if so, to what degree more tolerance among parents can really change the strong self-reinforcing tendencies of segregation which Schelling’s and Sakoda’s (Hegselmann 2017; Sakoda 1971; Schelling 1971) famous models prominently uncovered. Schelling’s model in particular is one of the best-known examples of a process of social self-organization in which multiple interdependent individual actions generate an aggregate outcome which individuals neither intend nor desire to bring about. It demonstrated how neighborhoods can end up strongly segregated due to “preference dynamics” (Clark & Fossett 2008), even when individuals have largely tolerant ethnic preferences. Follow-up literature has found this result to be robust across a wide range of variations of the model (Clark & Fossett 2008; Fossett 2006; van de Rijt et al. 2009). Recent work (Stoica & Flache 2014) demonstrated how the argument of preference dynamics also extends to the emergence of unintended school segregation. Yet, this work gives little insight into the role of increasing variation in ethnic tolerance as we currently witness in modern societies.
Could higher levels of ethnic tolerance change the seemingly inevitable process through which segregated neighborhoods and schools arise under preference dynamics? Schelling himself pointed to the opposite possibility. Heterogeneity in preferences may be a crucial factor to destabilize ethnically mixed neighborhoods. This idea was elaborated in the “bounded neighborhood model” or “tipping model” (Schelling 1971), in which cascades that lead to the unravelling of integrated neighborhoods are triggered by a few highly intolerant agents who are dissatisfied with the local ethnic mix and therefore move out first, followed by slightly less intolerant individuals, and so on (Skvoretz 2006). Extending this argument to schools, one might expect that heterogeneity in tolerance will destabilize ethnically diverse schools, because of the behavior of intolerant parents.
However, recent work that explicitly included heterogeneous ethnic preferences in agent-based models of residential Schelling-type dynamics, suggests that the implications of heterogeneous preferences may be less straightforward (Fossett 2006; Hatna & Benenson 2015; Xie & Zhou 2012). Xie & Zhou (2012) extended the Schelling-type model with heterogeneous preference distributions. They found segregation levels to be even lower than they would be under homogeneous preferences, because tolerant agents self-sort into relatively mixed neighborhoods, filling the vacancies left behind by intolerant agents who moved out. Extending this argument to schools, one could expect some mixed schools and some others segregated.
Thus, the literature points to conflicting intuitions as to the consequences of tolerance heterogeneity among parents for school segregation. Deciding which intuition is more plausible becomes even more complicated because preference dynamics in school choice are not just a mirror image of those postulated by models of residential segregation. Building upon empirical work on school choice preferences (Borghans et al. 2015; Burgess et al. 2005; Karsten et al. 2003), Stoica & Flache (2014) integrated a new element relevant for school segregation: individuals’ preferences for geographical proximity of schools. They assumed that – ceteris paribus - parents favor nearby schools over distant schools. This could curb school segregation by keeping intolerant parents from abandoning ethnically diverse schools in their neighborhood. But it could conversely foster segregation by keeping tolerant parents living in segregated neighborhood from sending their children to mixed schools further away from home. One might expect complex interplays between heterogeneity in parents’ ethnic tolerance, residential segregation patterns and the strength of parents’ preference for nearby schools.
To clarify which intuition might turn out to be true, and under which conditions, we develop a new model of school choices that moves beyond the previous work in three important ways. First, following recent work on residential segregation dynamics (Hatna & Benenson 2015; Xie & Zhou 2012), we take into account that there is heterogeneity among parents in the degree to which they are ethnically tolerant. Simulations reveal that the introduction of a substantial proportion of tolerant parents in a population can crucially affect which pattern of school segregation eventually emerges. Second, we consider variation in the residential structures that form the context of school choice. Finally, we drop the assumption inherited from Schelling and Sakoda and used in most modelling work, that actors’ satisfaction with a school or residential location is fully determined by its characteristics. Instead, our new model links up with recent advances in models of residential segregation (Bruch & Mare 2006; van de Rijt et al. 2009) and uses a random utility specification of choice behavior where the probability of selecting a school is positively associated with the potential satisfaction of an agent (McFadden 1973; for an empirical modelling application see: Borghans et al. 2015), while random deviations due to unobserved heterogeneity are also considered.
The paper is organized as follows: Section 2 details the three principal modeling assumptions we make; Section 3 describes our formal model; Section 4 shows results of our simulation experiments; Section 5 discusses implications of our results and possible avenues for future research.
Towards a More Realistic Model of School Segregation Dynamics: Heterogeneity in Tolerance, Complex Residential Distributions and Random Choice Behavior
In this section, we discuss the possible impacts of heterogeneity in parents’ tolerance levels (Sub-Section 2.1), variation in residential segregation patterns (Sub-Section 2.2) and non-deterministic choice preferences (Sub-Section 2.3) on school segregation dynamics. We then develop a strategy to model how a large proportion of tolerant parents in the population interacts with residential segregation patterns and parents’ preferences for nearby schools on the level of school segregation.
Heterogeneity of ethnic preferences: Empirical evidence and theoretical consequences
The integration of heterogeneous ethnic preferences into our model was motivated by empirical research showing considerable heterogeneity in school choice preferences not only between but also within different ethnic and social groups (Borghans et al. 2015; Hastings et al. 2006). While these studies measure heterogeneity not explicitly for ethnic preferences but focused rather on distance preferences, preferences for high school quality, or for a particular school denomination, heterogeneity in ethnic preferences has for example been demonstrated by factorial survey studies of parents’ resistance against schools with varying proportions of outgroup members (Billingham & Hunt 2016; Coenders et al. 2004; Goyette et al. 2012).
An additional reason why ethnic preferences should be assumed to be heterogeneous is that parents’ preferences for school ethnic composition are likely to mirror preferences for neighbourhood ethnic composition. Using increasingly sophisticated measurement instruments, studies of residential ethnic preferences clearly provide evidence of heterogeneity. For example, based on data from the Multi-City Study of Urban Inequality, Xie & Zhou (2012) find that respondents can be classified into six different categories with significant differences with respect to the proportion of outgroups they considered acceptable in a neighbourhood (see also: W. A. Clark & Brazil (2018; Clark & Fossett 2008; Farley et al. 1978; Ibraimovic & Masiero 2014)). Therefore, similarly to recent modelling work (Hatna & Benenson 2015; Xie & Zhou 2012) on residential segregation, we systematically explore in this paper under what conditions heterogeneity in ethnic preferences affects the self-sorting of tolerant parents into integrated schools.
Importance of the residential context
Previous modelling work has also left unexplored how the residential context of school choice has had an impact on emergent ethnic school segregation. For example, whether a preference for nearby schools fosters ethnic school integration and curbs self-reinforcing school segregation, may critically depend on residential segregation. Preferences for nearby schools would reduce school segregation in a residentially integrated context, as schools’ ethnic compositions tend to reflect the composition of neighbourhoods if most parents prefer nearby schools (Stoica & Flache 2014). Yet, real world cities are far from being perfectly integrated (Farley & Taeuber 1974; Frankenberg 2013; Johnston et al. 2006; Ong & Rickles 2004; Reardon & Yun 2005).
The consequences of the degree of residential segregation could however be less straightforward at a local level. Let us consider schools that are situated close to boundaries between ethnically homogeneous residential clusters, geographically close to the homes of parents from both sides of an ethnic frontier. These schools would therefore initially be highly integrated. This points to the possibility that strong distance preferences may also foster school integration in some specific schools in a residentially segregated world, because ethnically intolerant parents could be reluctant to bear the cost of sending their children to more segregated but more distant schools. The interaction of distance preferences and heterogeneity in tolerance might also explain the emergence of a mix of segregated and integrated schools similar to the mixed residential patterns observed in many real-world cities.
In short, while intolerant parents would try to get away from integrated schools and be willing to choose more distant segregated schools, tolerant parents may be willing to bridge larger distances to find ethnically integrated schools. This suggests a potential for a complex interplay between two interdependent yet different forms of segregation: schools can be segregated by ethnicity or by tolerance. Segregation by tolerance occurs if tolerant and intolerant parents tend to send their children to different schools. In our model, ethnically segregated schools would be populated by more intolerant parents, while more tolerant parents would choose ethnically integrated schools. Our simulation experiments will explore how this possibility of simultaneous segregation forms interact with the residential map in a city.
Probabilistic school choice
Most formalizations of Schelling-type segregation dynamics assume that individuals will never abandon a residential neighbourhood or school as long as its ethnic composition remains satisfactory in the light of their preferences (Hatna & Benenson 2015; Stoica & Flache 2014). As a consequence, such models can generate “frozen states”, such as stable ethnically integrated schools or neighbourhoods, which would collapse under more realistic assumptions allowing occasional random moves or “erroneous” individual choices. In line with recent modeling work on residential segregation (Bruch & Mare 2006; van de Rijt et al. 2009; Zhang 2004) we adopt a random utility model, in which the satisfaction given by a school is positively associated with the probability of selecting it. Yet, parents do not always opt for the most satisfactory option. Substantively, this randomness can be interpreted as resulting from heterogeneity in unobserved factors other than distance and ethnic mix which affect parents’ evaluation of a school, but also to some dissonance between preferred and actual school or neighbourhood (Schwanen & Mokhtarian 2004).
The Model
We propose a model that uses largely the same Schelling-Sakoda type framework for generating both the residential segregation pattern and the pattern of school choices parents make. Sub-Section 3.1 explains the resulting two-step procedure, Sub-Section 3.2 elaborates the decision-making model, Sub-Section 3.3 describes how residential maps are generated and where schools are located, and Sub-Section 3.4 formalizes the outcome measures quantifying emergent segregation.
General logic of the simulations: A two steps procedure
We proceed in our simulations in two steps. In the first step, a residential map with varying degree of segregation is generated using a Schelling-type algorithm. At the end of this step, parents stop moving for the rest of the simulation. In the second step, we first generate schools at random positions (on the residential map generated in the first step), and then assign parents to the closest school from their fixed residential location, corresponding to a Voronoi diagram (Flache & Hegselmann 2001; Okabe et al. 1992). This creates schools with initial ethnic compositions that are representative of their neighbourhood. From this initial situation, the school choice process starts: parents evaluate the attractiveness of available schools based both on their distance, and on their ethnic composition.
Our model examines “post-residential” school choice (Hastings et al. 2006), neglecting the complication that residential choice could also be influenced by school choice. Given there are hardly any models in the literature so far that bridge the dynamics of residential segregation and school segregation, we believe this simplification is necessary. We also believe it is warranted as a first approximation, because residential choice is subject to many more constraints than school choice, including housing prices, distance to work, the composition of the neighbourhood, and the need to satisfy all members of a household simultaneously (Kim et al. 2005; Schwanen & Mokhtarian 2004). Thus, we make the simplifying assumption that once parents have chosen a house, they select between available schools rather than changing their dwelling.
In what follows, the school choice model is described first, as it is the main model in our study. The choice model used to generate the residential maps is derived as a simplified form of the school choice model (see also Appendix A).
From utility to school choice: Decision making process of parents
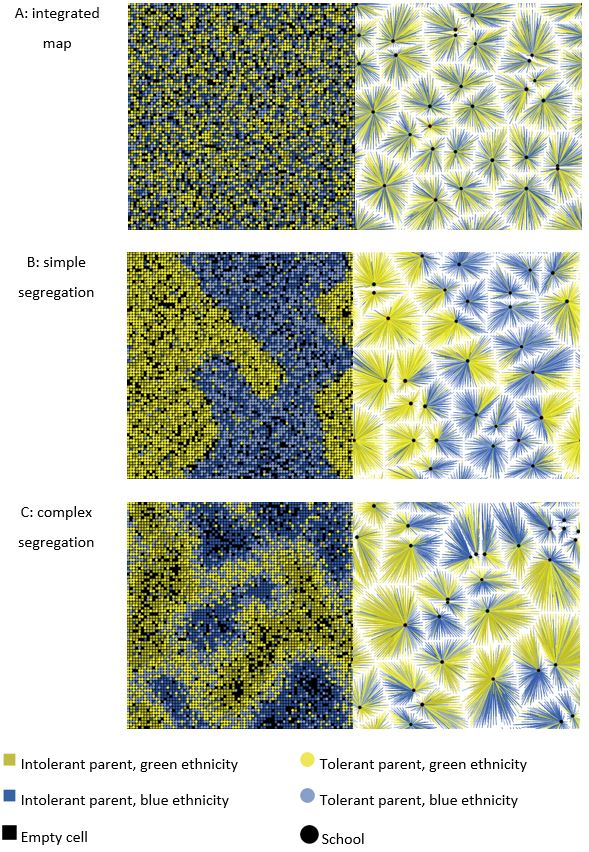
We use a two-dimensional grid with 6400 cells (\(80 \times 80\)) embedded on a torus. 90% of the cells (5760) are populated by one “household” which is the decision-making unit modelled. Households have a fixed residential location and a fixed ethnicity \(e \in \{1,2\}\). Once agents have been assigned to residential locations, 30 schools are randomly placed on the map. For simplicity, each household is assumed to have only one child. Figure 1 depicts three examples of residential maps and corresponding school assignment graphs. The household’s school choice is represented as a tie between a household and a school in a bipartite graph, with households and schools as the two types of nodes (right panel). A school choice decision can either be maintaining the already existing tie, i.e. staying, or erasing it and replacing it by another, i.e. changing. Every household is linked to exactly one school at any point in time. Initially all schools have free capacity to receive new pupil, but all schools also have the same maximum capacity equal to 403 pupils (7% of the total population). If a school has reached its maximum capacity, parents can no longer select it until one pupil leaves. This maximum capacity parameter is of importance in real-world settings. For example, Kessel & Olme (2018) show that the rule determining admission in schools that face higher demand than seats can impact segregation levels. Further below, we present some simulation results exploring the effects of variation in the assumption about maximum capacity.
For simplicity, we assume that the population of households consists of two ethnic groups of equal sizes. We checked the sensitivity of our results to this choice in Appendix E, Figure 18 where we adopted the more realistic 75-25% division. Diversity in ethnic preferences is introduced by dividing both ethnic groups into two different categories, tolerant and intolerant agents. For tolerant agents, the ideal school comprises a significant share of outgroup members, whereas intolerant agents prefer schools with very few or even no outgroup members, distance being equal.
Parents’ decisions concern the choice of their child’s school. Each household derives a utility value from sending their child to a particular school that depends on its ethnic composition, and the Euclidian distance between the household’s and the school’s locations.
Formally, the utility \(U\) of school \(s\) for agent \(i\) of ethnic group \(e\), is given by the following Cobb-Douglas function:
| \[ U_{is} (x_{es}, D_{is}) = V(x_{es})^{\alpha} D_{is}^{1-\alpha}\] | \[(1)\] |
Ethnic satisfaction \(V\) depends on \(x_{es}\) which represents the proportion of children of the same ethnicity \(e\) as agent \(i\) in school \(s\), where \(x_{1s} = 1-x_{2s}\). Following Zhang (2004), we adopt a functional form that allows to express a preference for more diverse schools (and neighborhoods) over more ethnically homogeneous ones. Technically, \(V\) is modelled as a single peaked step-wise linear function in \(x_{es}\). The ethnic satisfaction \(V\) of school s for an agent of ethnicity e is given by Equation 2:
| \[ V(x_{es}) = \begin{cases} \frac{x_{es}}{x_{0}}, & \text{if } x_{es} \leq x_{0} \\ M + \frac{(1-x_{es})(1-M)}{(1-x_{0})}, & \text{if } x_{es} > x_{0} \end{cases}\] | \[(2)\] |
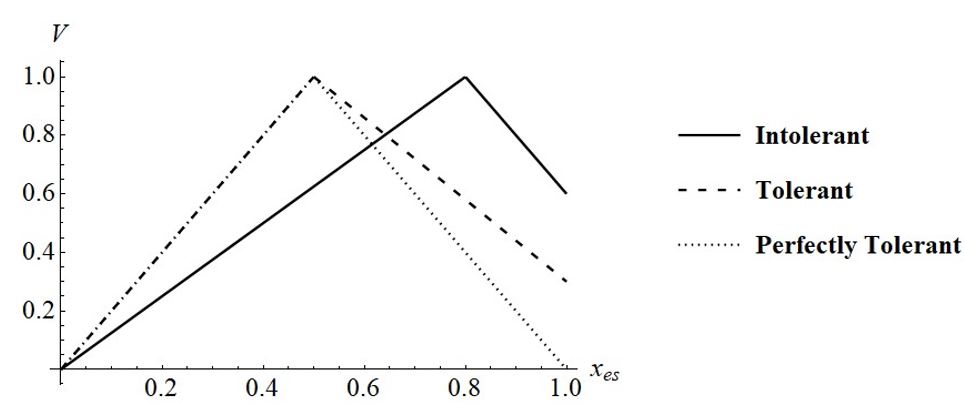
Throughout our simulation experiments, we distinguish two levels of tolerance. We model intolerant agents with \(x_{0} = 0.8\) and \(M=0.6\), and tolerant agents with \(x_{0} = 0.5\) and \(M=0.3\), with single-peaked preference functions as depicted in Figure 2. Reflecting empirical studies of residential ethnic preferences (e.g. Clark & Fossett 2008), this parametrization expresses the assumption that even intolerant agents prefer the presence of a small outgroup minority instead of perfect segregation. Similarly, while tolerant agents reach their maximum utility with perfect integration, they still have a relative preference for in-group members. For instance, they prefer 75% in-group members over 25%. Notice that both tolerant and intolerant parents still prefer schools with 100% co-ethnics to schools without any co-ethnics (M > 0). While this is empirically plausible, we also want to assess how this assumption affects model dynamics, using the limiting case of perfectly tolerant parents (\(x_{0} = 0.5\), \(M=0\)) (see Figure 2).
The other term of the utility function \(U\), i.e. the benefit agent \(i\) derives from proximity of a school \(s\) \(D_{is}\), is given by Equation 3, drawing on the formalization used by Stoica & Flache (2014).
| \[ D_{is} = \frac{dist_{max}-dist_{is}}{dist_{max}}\] | \[(3)\] |
Dynamics of school choice are structured as follows. In every round (or time-step) of the simulation, 250 agents (approximately 4% of the population) are randomly selected and decide in random sequence whether they stay in their school or choose a new one.1 Each agent computes the utility \(U\) (Equation 1) associated with all schools having at least one empty spot, plus her current school. We use probabilistic multinomial choice to model school choice (Bruch & Mare 2006; van de Rijt et al. 2009; Zhang 2004). Equation 4 formalizes the probability of a specific school \(s\) to be chosen by agent \(i\) within the set of available schools \(S\) in the next time step \(t+1\).
| \[ p_{ist+1} = \frac{e^{\beta U(x_{es}, D_{is})}}{\sum_{s=1}^{S} e^{\beta U(x_{es}, D_{is})}}\] | \[(4)\] |
Furthermore, we let the school choice model run 140 rounds in each simulation run, giving on average every agent 6.08 opportunities to change school choice. As we will show below, in some conditions this is not long enough for the dynamics to approach a stable state. However, it seems highly implausible that pupil would change a school more than six times in their school career. We were therefore interested in the dynamics that unfold within this time frame but also explored dynamics for a much longer time frame in specific cases.
Map generator methods
To generate initial residential maps, we use a variant of a Schelling-Sakoda type algorithm very similar to our school-choice model. Details are given in Appendix A. The residential segregation dynamic starts from a perfectly integrated map obtained by randomly allocating households to locations. We let the residential model run for different periods of time in order to create a continuum of maps. More precisely, we increment the number of rounds in steps of 1, going from 0 to 70, with one round corresponding to 250 agents taking a residential decision. The more chances agents get to relocate, the closer levels of residential segregation match the equilibrium segregation pattern corresponding to their preferences.
Tolerant parents could affect school segregation in two ways: they could reduce school segregation via more integrative school choices given their residential locations (“direct effect”), but they could also reduce residential segregation via more integrative residential choices, which in turn could lower residential segregation and hence school segregation through the preference for nearby schools (“indirect effect”). Here, we describe two methods to generate different types of residential maps aiming to disentangle these “direct” and “indirect effects” of tolerant parents on school segregation.
Map generator method 1: “Simple segregation” continuum
The first method assures that heterogeneity in ethnic preferences only affects school segregation through its “direct” effect via school choices. For this, we artificially make tolerant parents behaving as if they were intolerant when taking residential decisions. We generate a continuum of maps that goes from non-segregated maps - that we call “integrated” maps (see Figure 1, panel A) to highly “segregated” maps, in which there are sharp boundaries between the two ethnic groups (see Figure 1, panel B). We label the residential pattern this method produces “simple segregation” because there is no segregation by tolerance even if there is ethnic segregation.
Map generator method 2: “Complex segregation” continuum
In the second map generating method, tolerant parents behave in accordance with their ethnic preferences. This generates maps with both highly ethnically homogenous clusters and ethnically diverse areas together with segregation by tolerance (see Figure 1, panel C). Because these two forms of segregation co-exist in the same map, we label this phenomenon “complex segregation.”2
Notice that we started from “integrated” maps generated by assigning households uniformly randomly to locations on the map in both methods. However, the two methods generate qualitatively different residential patterns when segregation increases (see Figure 1). As we let parents take more residential decisions, we got closer to the ideal-typical “simple segregation” pattern with the first method, while with the second method, we approximated the ideal-typical “complex segregation” pattern.
Segregation indices
The key question we were interested in was how a large proportion of tolerant parents in the population impacts the degree of school segregation, under different conditions of residential segregation and distance preferences. We therefore needed to quantitatively measure residential and school segregation both by ethnicity and by tolerance. For this purpose, we adopted the dissimilarity index (Massey & Denton 1988). Equation 5 shows the general form of the index we use.
| \[ Dissimilarity = \frac{1}{2}\sum_{j = 1}^{N}|\frac{e_{1s}}{E_{1}}-\frac{e_{2s}}{E_{2}}|\] | \[(5)\] |
Results
Our main interest was to understand how a large proportion of tolerant parents affected school segregation in interaction with the variation in residential segregation and with the strength of parents’ preference for nearest schools. Our strategy was thus to define a baseline scenario in which we fix all other parameters of the model (see Table 1). We either used these values in all the results, or explicitly signalled changes in parameters’ values.
In the baseline scenario, tolerant and intolerant parents clearly differ in the degree to which they prefer ethnically mixed schools or neighbourhoods, yet not extremely. All other parameters were chosen to represent a setting that can be deemed as prototypical for a small ethnically heterogeneous community with relatively small schools all of which are in reach for all households, but at varying travel distances. However, we also modified some of these assumptions in robustness tests (see Appendix E).
| Parameters common to both residential and school models: | |
|---|---|
| Number of parents-children (50% blue ethnicity, 50% yellow)* | 5760 |
| Percentage of tolerant parents+ | \([0, 50]\) |
| \(x_{0}\) intolerant parents* | 0.8 |
| \(M\) intolerant parents* | 0.6 |
| \(x_{0}\) tolerant parents | 0.5 |
| \(M\) tolerant parents* | 0.3 |
| \(\beta\)* | 12 |
| Percentage of empty cells | 10 |
| Number of parents taking a decision per round* | 250 |
| Parameters specific to the school model: | |
| Number of schools* (\(S\)) | 30 |
| Number of rounds- | |
| 6.08 decisions per parents on average). | |
| School maximum capacity- | 403 (i.e. 7% of the population) |
| \(\alpha\)+ | \([0:1]\) increment by 0.1 |
| Parameters specific to the residential model (see Appendix A for details): | |
| Number cells evaluated including current | 9 |
| Radius of the neighborhood | 6 |
| Number of rounds method 1+ | \([0:70]\) increment by 1 |
| Number of rounds method 2+ | |
| \([60:90]\) increment by 3 |
Here, we first present simulation experiments that use the first method for generating the residential map. In these experiments, diversity in tolerance affects school segregation only through parents’ school choices. In a second set of experiments, we relaxed this assumption and use method 2 to generate maps that display “complex segregation”.
Experiments with method 1 residential segregation
Baseline experiment: All parents are equally intolerant
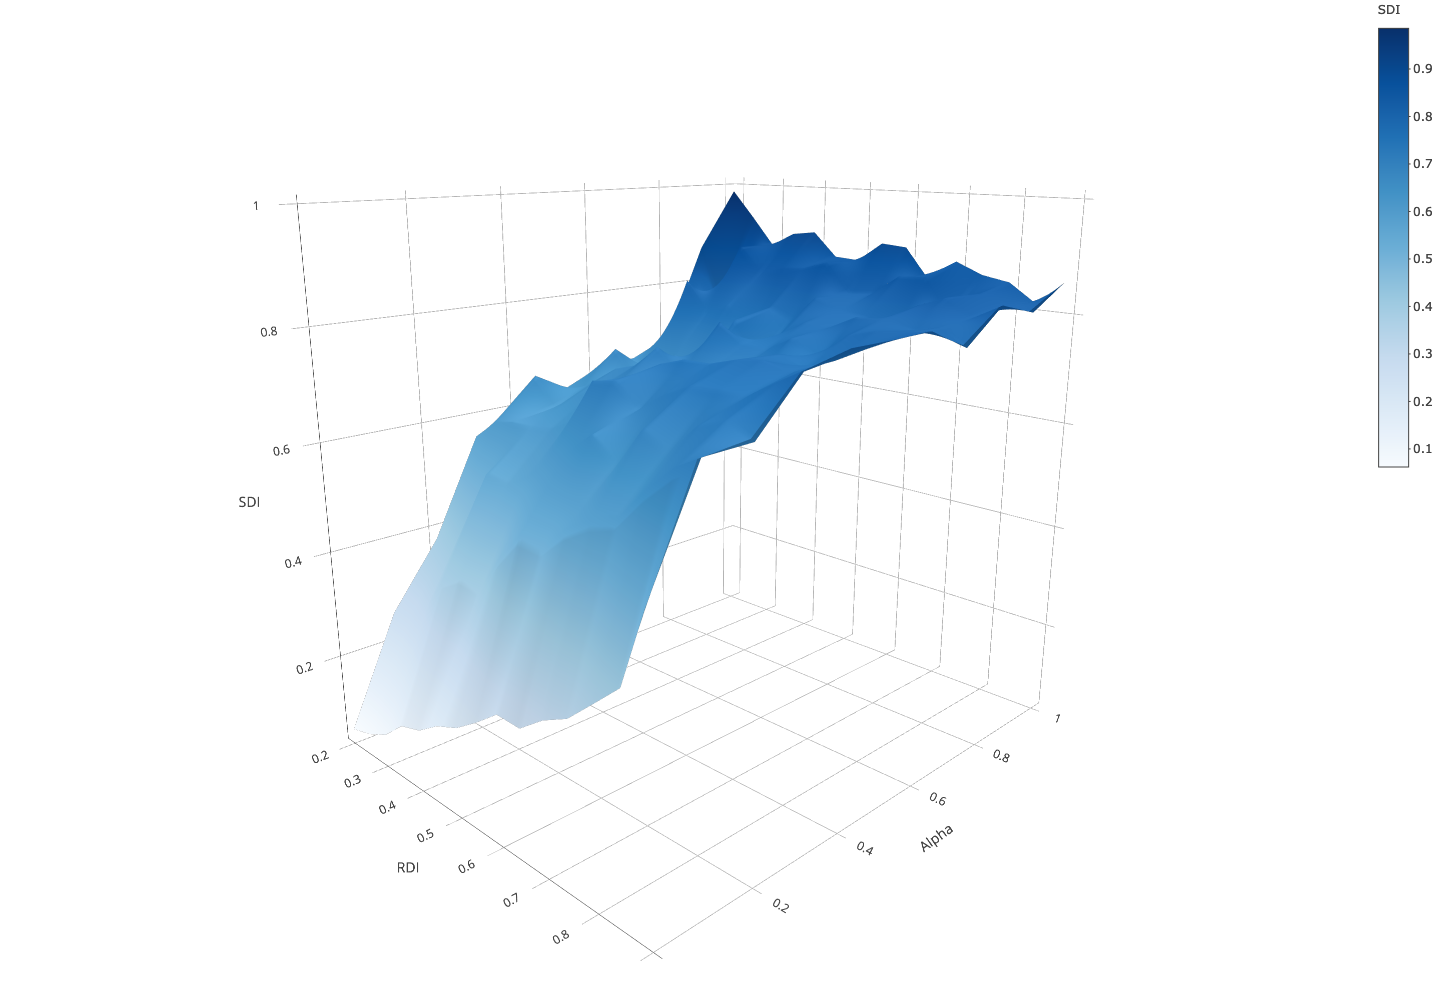
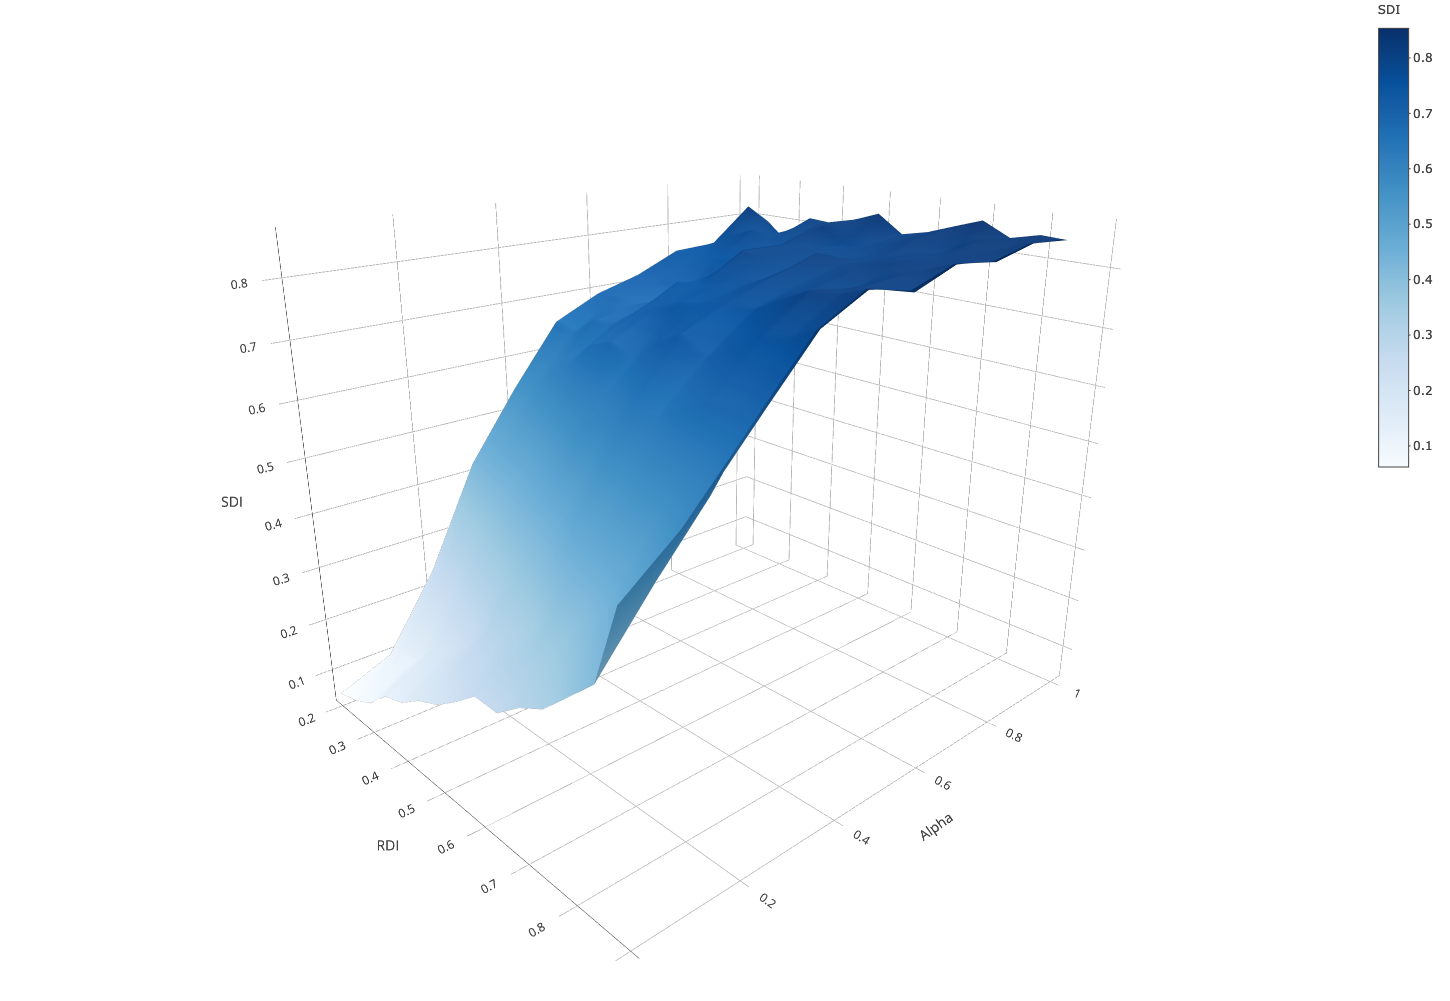
As a baseline for comparison, we start without any tolerant parent. Figure 3 shows how residential segregation is associated with school segregation for varying weight of parents’ ethnic preference \(\alpha\).
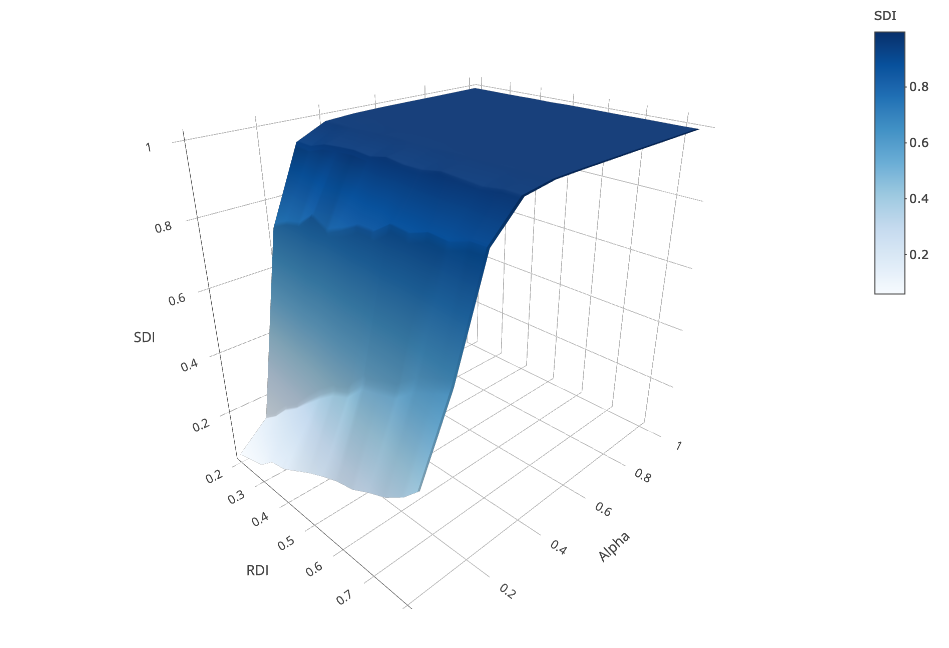
As Figure 3 shows, in the scenario where agents evaluate schools only in terms of distance (\(\alpha = 0\))3 school segregation increases linearly with residential segregation. The reason is that schools’ ethnic compositions mirror their catchment areas’ compositions. Agents rarely change schools because the least distant school they initially attend maximizes their utility. Moves are only due to randomness.
This close link between residential segregation and school segregation starts to change as soon as agents consider the ethnic mix in schools (\(\alpha > 0\)). From \(\alpha = 0.1\) on, higher \(RDI\) is associated with higher \(SDI\). When \(\alpha = 0.2\), there is a take-off where the model generates noticeably higher levels of school segregation, so that even for low \(RDI_{s}\), schools end up being highly segregated. The surface gets almost perfectly flat for \(\alpha \geq 0.3\), which indicates that the moderating effect of low residential segregation on school segregation almost completely disappears when preferences for nearby schools weaken. Here, school segregation exhibits the self-reinforcing dynamic well known from the Schelling-Sakoda model: high levels of school segregation emerge although parents’ preferences could be satisfied with more diverse schools.
To sum up, when all agents are intolerant, self-reinforcing school segregation is curbed by distance preferences. This reflects insights from earlier research (Stoica & Flache 2014). However, using an otherwise comparable model with deterministic preference functions, Stoica & Flache (2014) found that initially integrated compositions remained stable at considerably higher levels of \(\alpha\). The reason is that our multinomial choice model generates more school changes which more easily trigger the preference dynamics leading to self-reinforcing segregation.
Introducing heterogeneity in ethnic preferences: 50% of tolerant agents
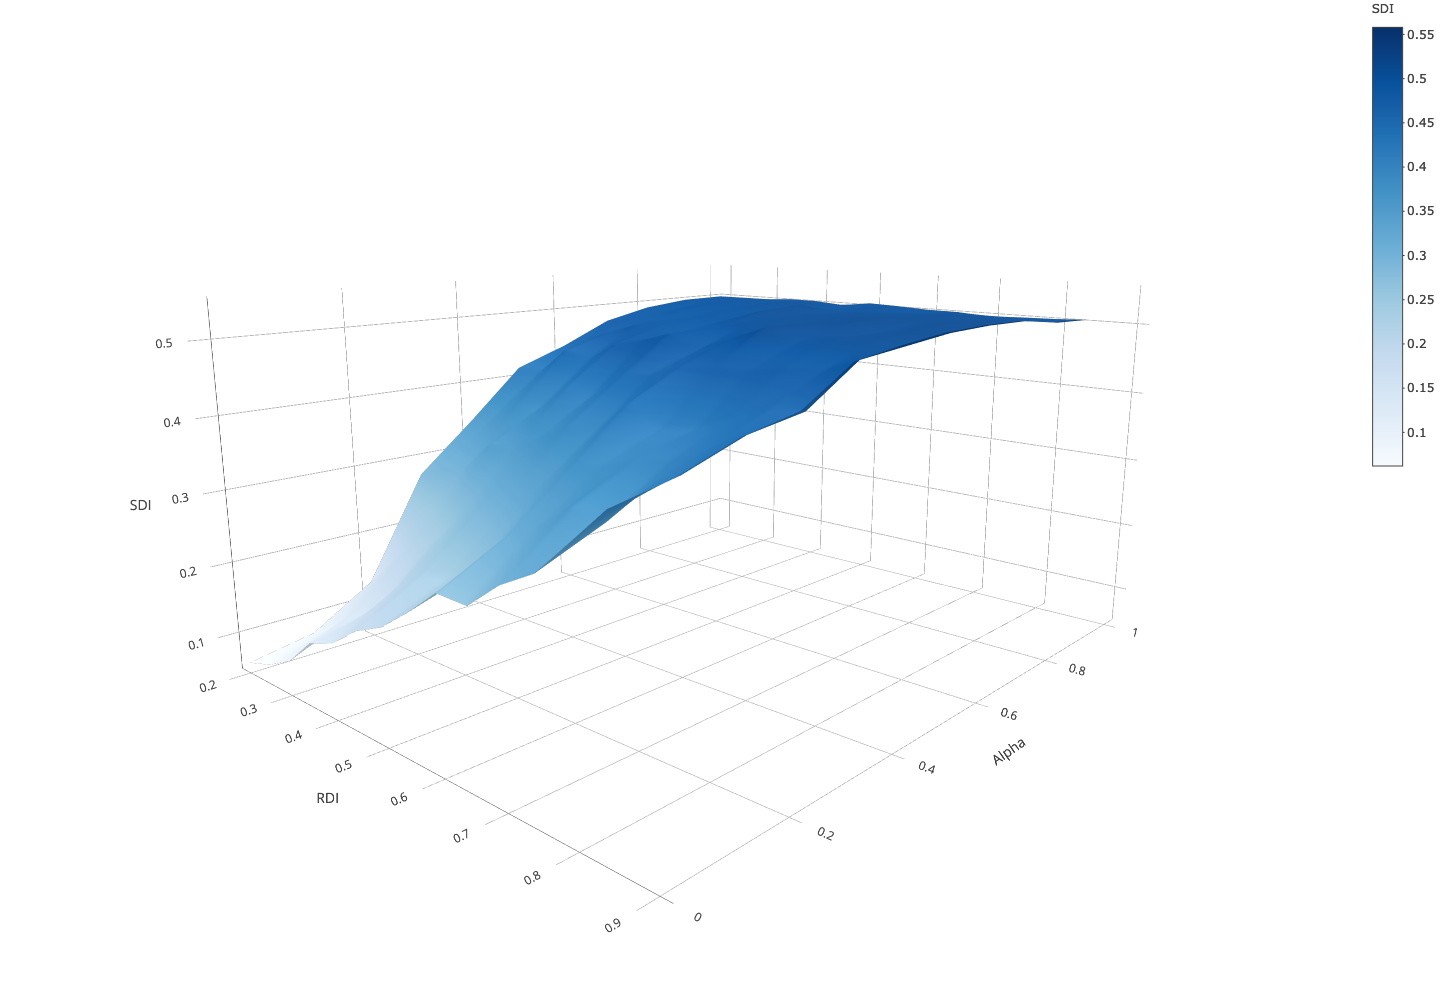
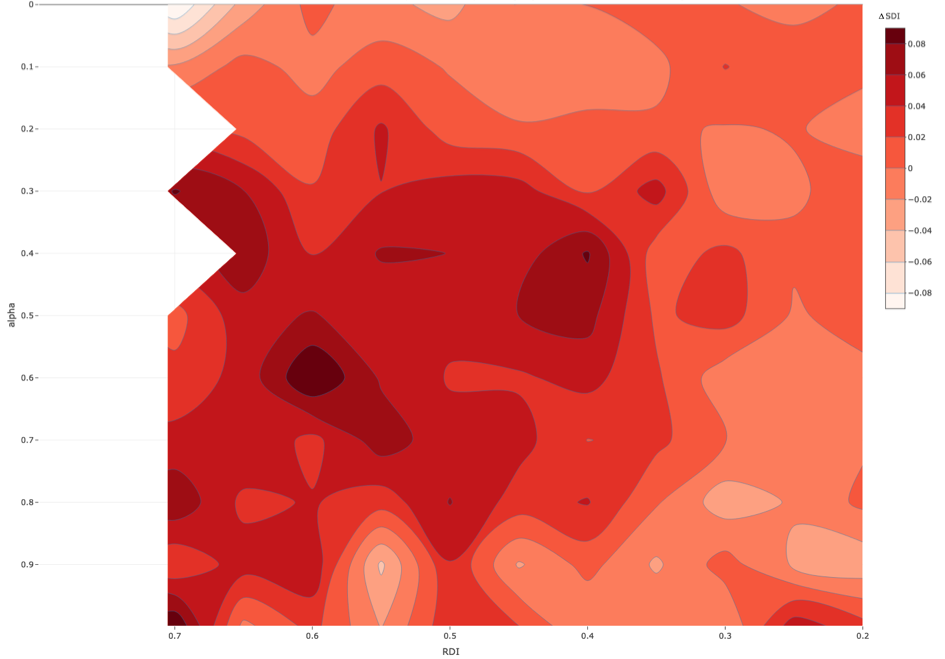
In this sub-section, we assume that in both ethnic groups 50% of the population was tolerant and compared results with what we obtained with 0% tolerant parents. We analyzed the difference that tolerant agents make on school segregation. Figure 4 replicates the results of Figure 3 with 50% tolerant parents, and Figure 5 charts the difference in \(SDI\) between 0% and 50% of tolerant parents across experimental conditions (5a: 3-D plot, 5b: contour lines plot).
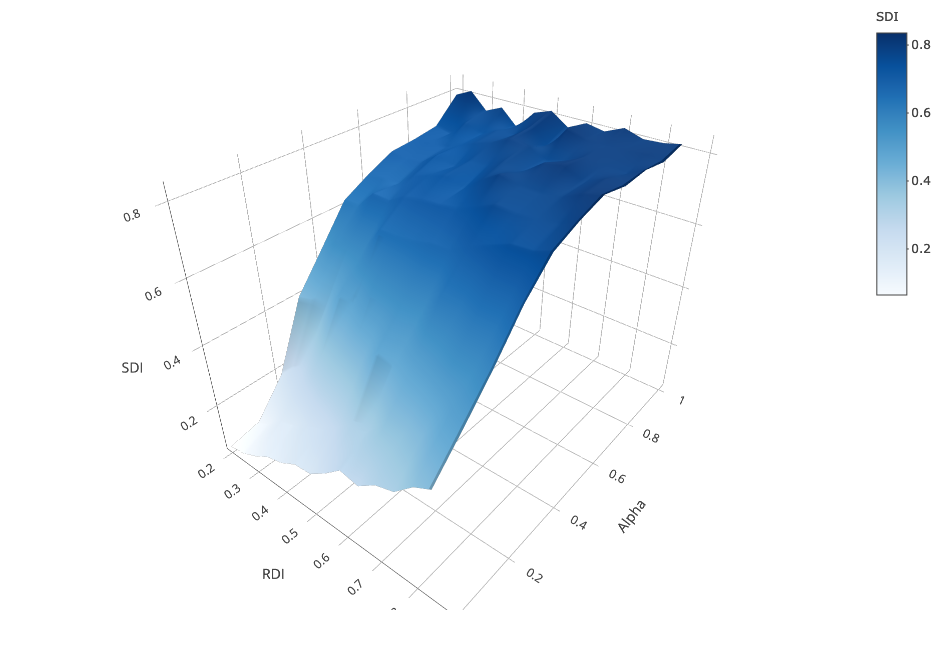
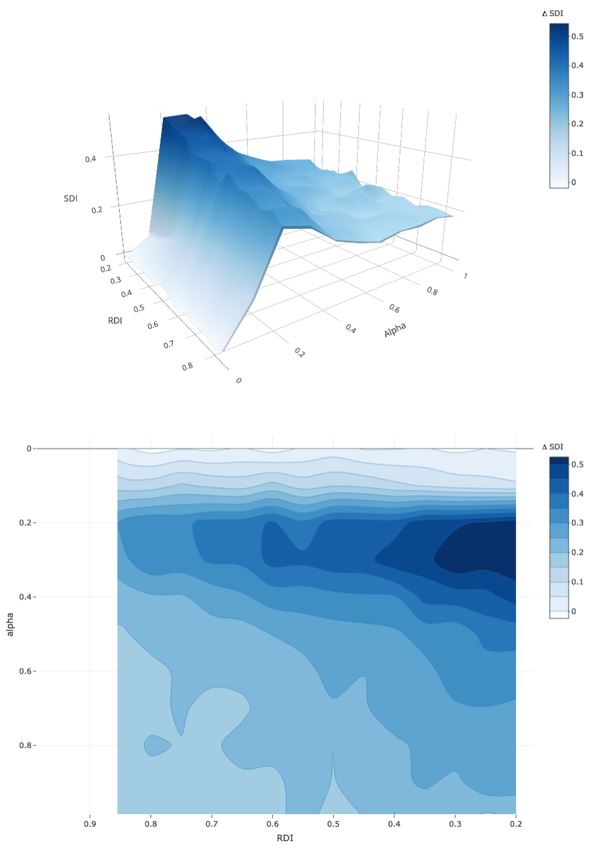
Comparison with the baseline condition without tolerant agents shows two major results. First, we also observe the desegregating effect of distance preference on school segregation: the stronger the preference for nearby schools (lower \(\alpha\)), the lower the school segregation for all levels of residential segregation, ceteris paribus. Second, for all values of \(\alpha > 0\), tolerant parents decrease school segregation.
We discerned two patterns. First, we found that the presence of tolerant parents reduces school segregation most only when the weight of distance preferences is neither too strong nor too weak. With strong preferences for nearby schools (\(\alpha < 0.2\)) parents heavily prefer nearby schools, almost regardless of their ethnic tolerance. At the other extreme, with weak distance preferences (\(\alpha > 0.6\)), tolerant parents only moderately dampen the self-reinforcing dynamics of school segregation similarly to the scenario with no tolerant parents. The second pattern is that the degree to which tolerant parents reduce school segregation also depends on the level of residential segregation. Across all conditions, but most visibly for \(0.2 \leq \alpha \leq 0.6\), the lower the \(RDI\), the more tolerant parents reduce \(SDI\). Overall, the “sweet spot” in the parameter space where tolerant parents reduce school segregation most is characterised by moderate preferences for nearby schools and high residential integration.
Two modelling assumptions were particularly important to understand these results, both representing aspects of school choice dynamics in the real world. The first is that even tolerant parents are only ‘moderately tolerant’. The second important assumption is that schools have a maximum capacity to receive new pupils.
As Figure 2 shows, the preference curves of tolerant and intolerant agents are not perfectly symmetrical. Tolerant parents favor perfectly integrated schools in our model, but when faced with the choice between being in a clear minority position or a clear majority position, they prefer the latter.4 To see how this asymmetry contributes to generate the inverted U-shaped effect that tolerant parents have on school segregation (see Figure 5), consider first an illustrative scenario in which the residential map is strongly integrated and parents are indifferent regarding home-school distance (\(RDI < 0.25\) and \(\alpha = 1\)). At the outset, all schools are highly integrated in this situation, with approximately a 50/50 mix of ethnicities. With 50% tolerant parents, only the intolerant half of the population is clearly dissatisfied. They initially find no alternative schools clearly more attractive than their current one. Yet, due to small random variation in the initial composition of schools, intolerant parents can slightly improve their utility by migrating to schools with a somewhat higher proportion of in-group members. This increases the chances that further intolerant parents of the same ethnicity follow, gradually ‘tipping’ their target schools towards hosting a majority of the initially overrepresented group.
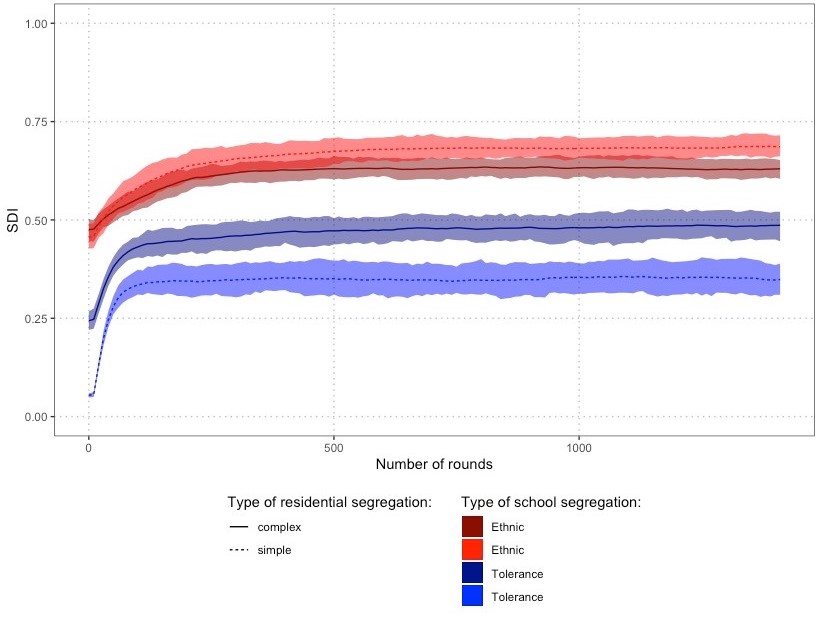
As this process happens simultaneously in all schools, the intolerant half of the population begins to segregate into ethnically increasingly homogenous schools due to self-reinforcing preference dynamics like those known from the Schelling-Sakoda model. At the same time, in this phase of the dynamics, tolerant parents stay behind in the mixed schools they were satisfied with from the beginning, or they move out of emergent ethnically tipping schools into free locations in integrated schools abandoned by intolerant parents. This causes increasing segregation by tolerance as well as by ethnicity. Figure 6 plots the evolution of ethnic and tolerance segregations in schools over an illustrative run in this condition. In the first 50 rounds both indices quickly increase, which indicates that tolerant parents cluster into integrated schools, while intolerant parents tend to separate both from the ethnic out-group and from tolerant parents in their ethnic in-group (upper panel). In comparison, the lower panel shows how ceteris-paribus, without tolerant parents, ethnic segregation rapidly reaches maximum segregation.
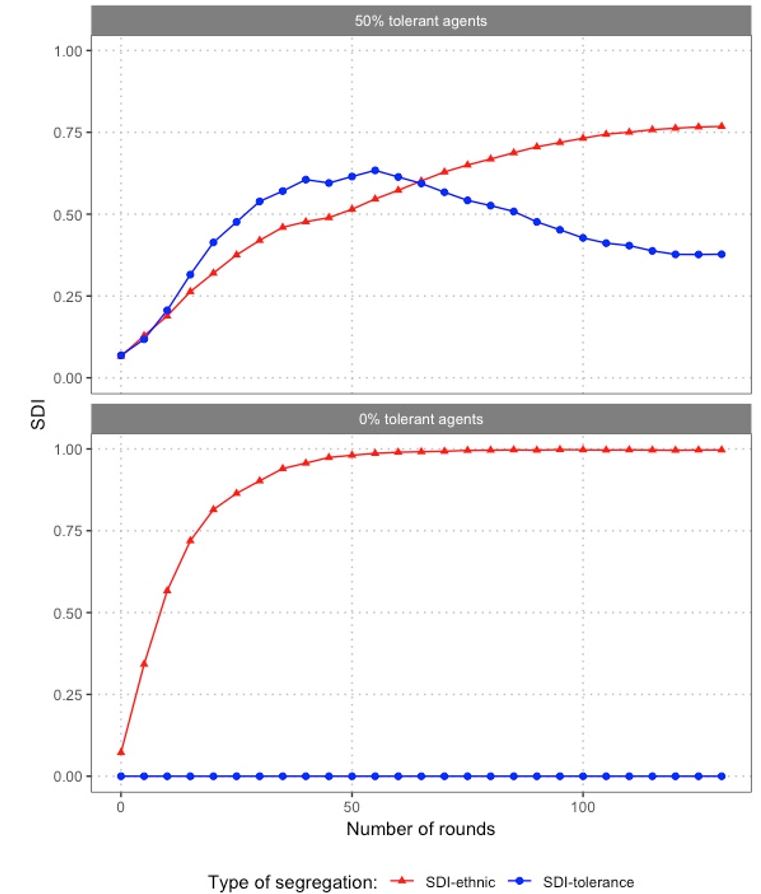
Yet, the mixed schools populated by tolerant parents are not stable. After about 60 rounds, tolerance segregation plummets while ethnic segregation continues to rise. The key reason for this unravelling of integrated schools is the asymmetric ethnic preference of tolerant parents. While tolerant parents favour schools with a 50/50 mix, random movements as well as the uncoordinated outflow of intolerant parents entail random variation of the ethnic school composition around this optimal point. Consequently, tolerant parents of the ethnic group that happens to become a minority in their school, face the choice between their current school and alternative schools in which their group is overrepresented, and tend to prefer the latter.
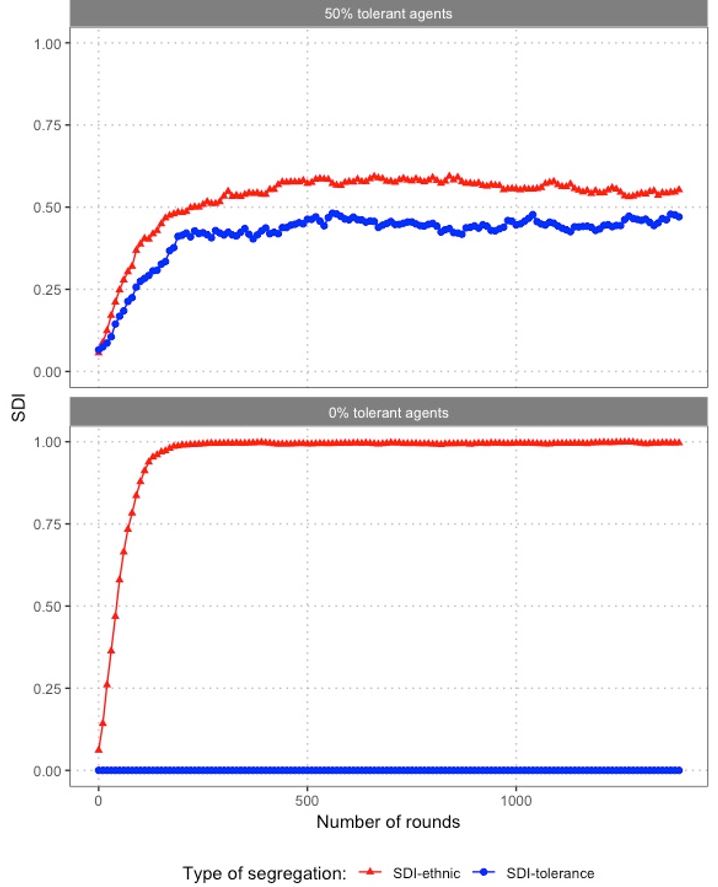
We suspected this progressive tipping of integrated schools had no reason to stop at 140 rounds, since it mainly depends on randomness, that is, on a few parents of one group who consecutively move out of an integrated school, gradually shifting the ratio away from the 50-50 mix, which locally triggers a segregating cascade. To further test this possibility, we ran additional 50 replications of 1400 rounds each. Confirming our intuition, simulations revealed that a second phase of a self-reinforcing preference dynamic was eventually triggered, this time among tolerant parents. In this phase, ethnic segregation of schools increases to a level that eventually approximates that of a world without tolerant agents, while segregation by tolerance erratically declines each time a mixed school tips. On average \(SDI\) reached 0.86 which indicates that without preference for nearby schools, in the longer run, the desegregating effect of tolerant parents is considerably lower than suggested by Figure 5. Interestingly, this reflects results of recent empirical research showing the existence of tipping behavior of schools (Caetano & Maheshri 2007; Spaiser et al. 2018). Appendix B displays the results of one illustrative run over 1400 rounds, showing the progressive unravelling of initially integrated schools.
The asymmetric ethnic preferences of tolerant parents made integrated schools unstable in our illustrative scenario without a preference for nearby schools. With stronger preference for nearby schools, dynamics change fundamentally. We ran 50 replications of 1400 rounds, with low \(RDI\) and \(\alpha = 0.3\) with and without tolerant parents. We found \(SDI\)-ethnic=0.58 (\(sd = 0.04\)) with tolerant parents, and \(SDI\)-ethnic=0.98 (\(sd = 0.004\)) without tolerant parents. Figure 7 plots two illustrative runs for each condition.
Together with Figure 5, these results suggest that in residentially integrated settings, the combination of moderate distance preferences and the presence of tolerant parents can reduce school segregation. Relocating from an initial school is costlier if there is a preference for nearby schools, thus parents are only likely to do so if they find an alternative school that is considerably more attractive to them in terms of ethnic composition. In integrated maps, such schools are rare in the initial situation. Moreover, even when some mixed schools tip, it requires much stronger random fluctuations for the remaining ones to also tip. The reason is that the tolerant parents, who had previously placed their children in the schools that eventually tipped, increase the demand for the remaining ones, such that it becomes increasingly less likely that any slight deviation from the 50-50 mix will trigger a cascade that destabilizes the mixed schools. As Figure 7 shows, this effect of the costs of choosing distant schools is just enough to dampen ethnic preference dynamics but some movement still occurred primarily by dissatisfied intolerant parents, so that ethnic and tolerance segregations increased above their initial level before stabilizing.
Figure 5 shows that the desegregating effect of tolerant parents is only moderate when residential segregation is high, for all levels of preferences for nearby schools. The reason is that in highly segregated residential maps, the potential dynamic of segregation by tolerance is limited by the asymmetric ethnic preferences of tolerant parents, in combination with two further factors: first, the number of schools that are ‘candidate’ to being mixed and second, their limited capacities to host pupils.
In a residentially segregated map, only those schools located close to boundaries between residential ethnic clusters are initially mixed. While intolerant parents of both ethnicities will tend to keep away from these schools, tolerant parents on both sides of the borders will rather be attracted by them. Yet, once these schools are filled, tolerant parents who cannot find a place in such schools must choose between less satisfactory options. Due to their asymmetric ethnic preferences, they prefer to stay in ethnically homogenous schools of their own group over schools where they would be in a clear minority. This process is further amplified by the fact that many tolerant parents reside inside of ethnic clusters. For them, mixed schools on the boundaries between clusters are prohibitively distant. We ran simulations with schools having no limited capacity and/or where tolerant parents were perfectly tolerant (\(M = 0\)), all of which confirmed our analyses about the role of these factors (see Appendix C, and E, Figure 15). As a further test, we also analyzed how residential segregation and preference for nearby schools affected school segregation by tolerance. We found that a weaker preference for nearby schools simultaneously increases segregation by ethnicity and reduces segregation by tolerance in schools (see Appendix D). This confirms our interpretation of the internal dynamics of the model.
To sum up, in residentially segregated maps, tolerant parents have less possibilities to choose integrated schools. This explains why in Figure 5 the effect of tolerant parents is stronger in residentially integrated settings for all values of \(\alpha\). Moreover, asymmetric ethnic preferences and limited school capacity are additional factors that moderate the effects of tolerant parents on school segregation, particularly in residentially segregated settings.
From “simple” to “complex” segregation
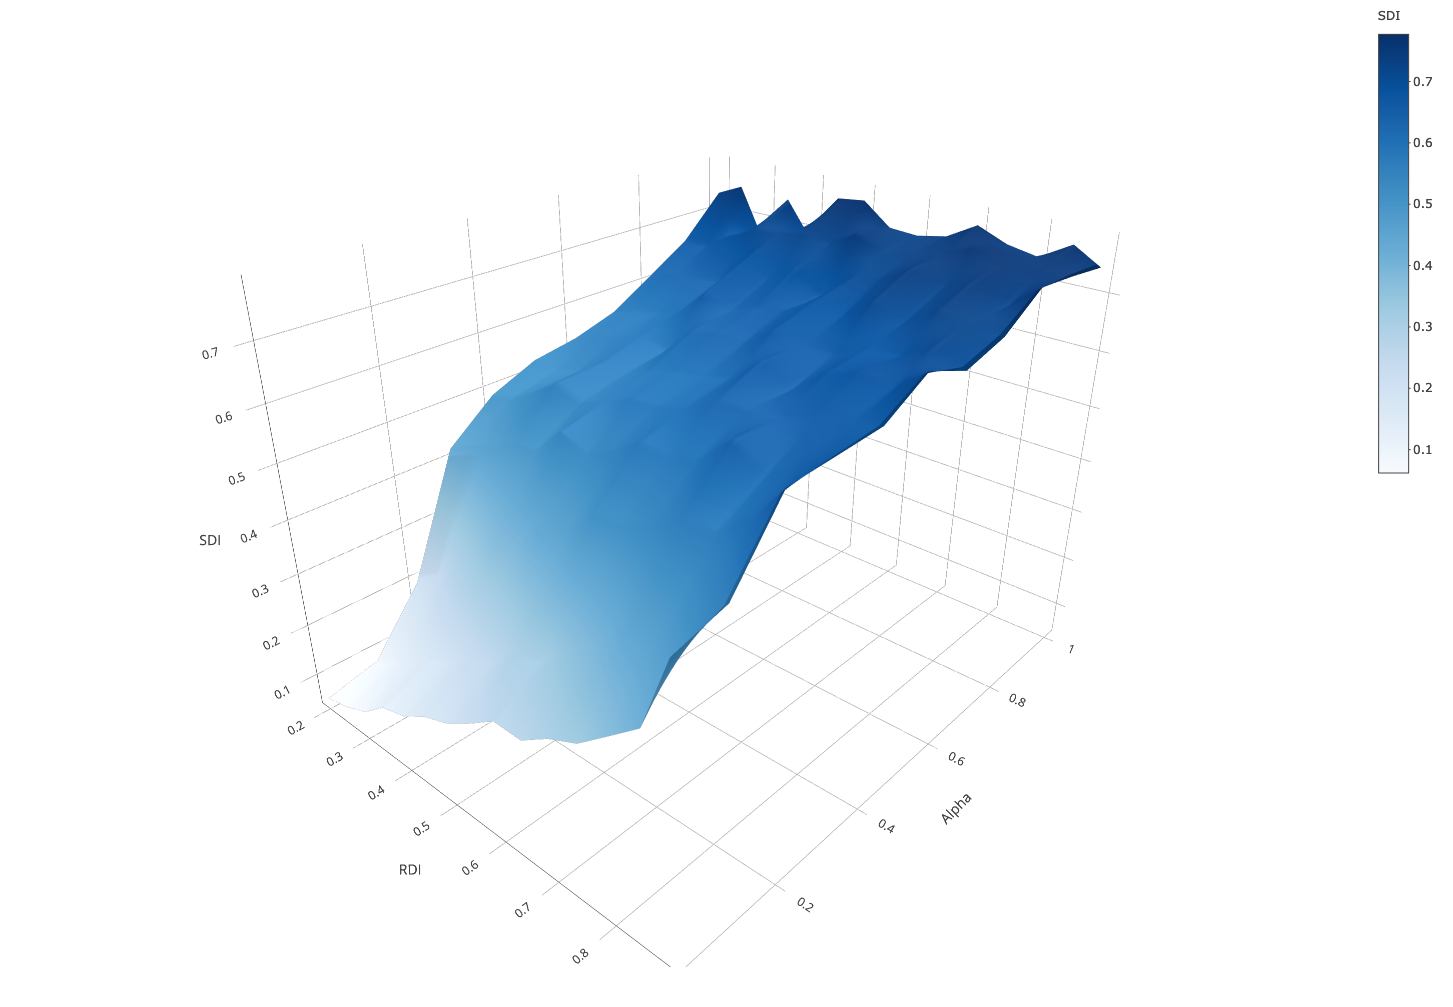
In this sub-section, we examine how tolerant parents affect school segregation when parents’ residential location is linked to the preferences that underlie their school choices. We use map generator method 2, creating a continuum of increasingly segregated maps going from “integrated” to “complex segregation” (see Figure 1, panel C). In “complex segregation”, tolerant parents tend to reside in ethnically diverse areas, while less tolerant parents choose homogeneous neighborhoods. Figure 8 is a replication of Figure 5 using this second continuum of residential maps. It shows the extent to which the presence of 50% of tolerant parents reduces \(SDI\) across experimental conditions, compared to 0% tolerant parents.
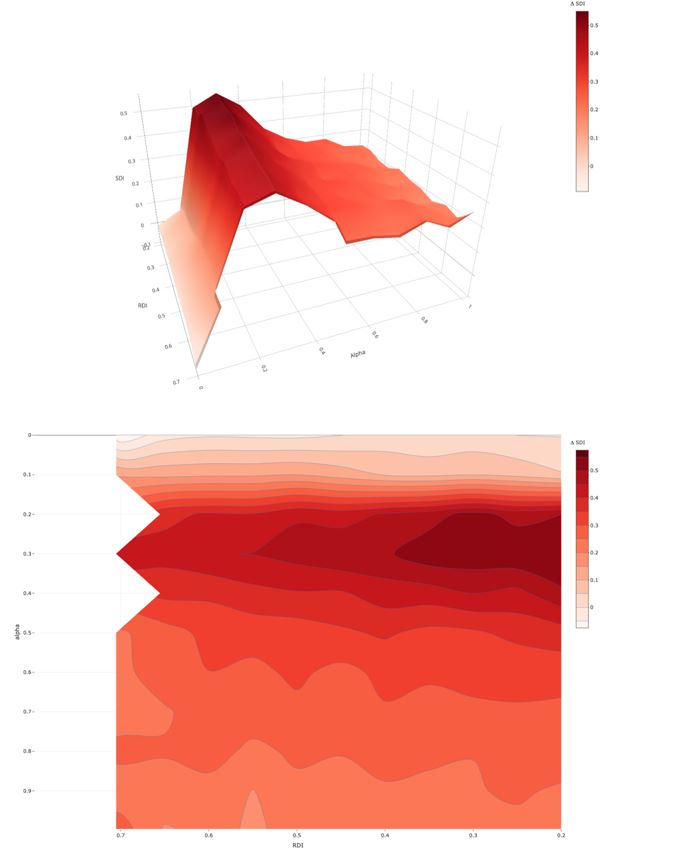
Figure 8 shows that the main results we obtained with map generator method 1 are largely replicated with method 2. The inverted U-shaped effect of the distance preference on how tolerant parents affect school segregation is conserved. In the region \(\alpha \geq 0.3\), \(RDI > 0.4\), we observe even lower ethnic school segregation in “complex” maps than in “simple” maps. This suggests that, if anything, the inverted U-shaped effect is more pronounced with complex maps.
However, there are also some noticeable differences between the results we obtained for the two map generator methods. In the previous section, we observed that tolerant parents had a lower desegregating effect when residential segregation is high. To illustrate, under method 1, at \(\alpha = 0.3\), the reduction of SDI due to the introduction of 50% tolerant parents (\(\Delta SDI\)) was almost halved when we moved from the lowest to the highest \(RDI\). Instead, for similar conditions under method 2 \(\Delta SDI\) declines only by about 25%. Notice that for high \(RDI\) the two methods cannot be directly compared because method 2 hardly generates \(RDI > 0.7\). Yet, we can conclude that tolerant parents reduce school segregation more robustly in complex maps if residential segregation increases. Intuitively, the reason is that with complex maps, also mixed schools initially are primarily populated by tolerant parents leaving nearby, who are less likely than intolerant parents to leave these schools. Appendix F explains the underlying mechanism in more details.
Finally, we checked whether complex segregation patterns make the effect of tolerant parents more stable in the long run. In the previous section, we found that in some conditions, mixed schools which initially formed due to school choices made by tolerant parents turned out to be unstable in the long run. This could be different with “complex” maps, because schools located in ethnically diverse areas populated by tolerant parents are more stable from the outset. Therefore, distance preference should even reinforce the attractiveness of mixed schools in the eyes of tolerant parents. This was confirmed by additional analyses we conducted: complex segregation leads to more stable mixed schools in the long run (see Appendix F, Figure 20).
Discussion
In this paper, we addressed the question whether and how a large fraction of tolerant parents could reduce school segregation. We developed a new model of school choice that allowed to assess the potential for self-reinforcing preference dynamics in school segregation similar to those identified by the Schelling-Sakoda model of residential segregation. For this, we modelled school choice based on a preference for ethnic composition of schools as well as a preference for nearby schools, following Stoica & Flache (2014).
Our main result indicated that even in the presence of a large proportion of highly tolerant parents, school segregation is likely to arise. Only when all parents have a rather strong preference for nearby schools, do tolerant parents significantly reduce school segregation, through the emergence of mixed schools, a result which is consistent with empirical research (Böhlmark et al. 2015). Yet, we identified that even under these conditions, the mixed schools were fragile and could tip in the longer run. These phenomena depend on the residential pattern and the location of schools. In particular, lower levels of residential segregation are more favourable to the emergence of mixed schools. Moreover, we found that “complex” residential segregation could make mixed schools more robust to random fluctuations. This occurs because in complex maps, mixed schools are already located in ethnically diverse areas populated by tolerant parents who find these schools attractive.
We conducted robustness checks to assess whether these conclusions crucially depended on some of our modelling assumptions. We reduced the role of randomness in parental choices (Appendix E, Figure 13), increased the number of schools (Appendix E, Figure 14), and increased the in-group preference of intolerant parents (Appendix E, Figure 16). None of these changes led to qualitatively different results. However, one of our modelling assumptions revealed to be of particular importance: the slight in-group preference of tolerant parents. When making tolerant parents “perfectly tolerant”, we found that their desegregating school choices perfectly compensated the actions of intolerant parents even in highly segregated maps (Appendix E, Figure 15) . Finally, we found that a more realistic minority-majority setting (25-75%) did not fundamentally change our results (Appendix E, Figure 18 and the subsequent comments).
A number of questions remain open for future research. We do not know how robust our findings would be when more realistic population settings are considered, especially with a larger number of ethnic groups. Ethnic preferences of minorities in particular, would be harder to satisfy in integrated schools if they resemble the preference for a near-majority in-group representation found by empirical studies of residential ethnic preferences (Clark & Fossett 2008). A more realistic model would also consider “generations” of pupils who successively enter schools instead of the same households repeatedly taking decisions. Next generations of households with children, would find schools with the ethnic mixes left by the previous generations.
We believe that our model encapsulates the main feature of this dynamic, parents’ decisions are affected by the school compositions generated by earlier choices of other parents, but future research should carefully explore the consequences of our simplification relative to assuming a more realistic cohort structure. Relaxing this simplification would also help clarifying the meaning of a time step in our model relative to its real-world counterpart. In its current form, the most straightforward interpretation of a time step is an academic year, because it is the moment where a significant portion of parents simultaneously choose a school for their children. If this is the case one should recall that 140 rounds as in our main simulations, already represents a very long-term horizon. Yet as illustrated by Figure 10 (Appendix B), the school tipping phenomenon can occur relatively rapidly (about 6 or 7 years).
Another simplification we adopted in this paper was that variation in ethnic preferences was the same in all ethnic groups, with 50% tolerant parents in both groups. But the distribution of ethnic tolerance may also vary between ethnic groups. Indeed, empirical research found that natives have different preferences and/or information than immigrants (Kristen 2003), even though a preference for the in-group seems to be common across all groups. This might become even more complex if one relaxes the assumption that preferences for nearby schools are similar for all ethnic groups. Indeed, it seems that depending on their socio-economic background parents are unequally able and/or willing to send their children to more distant schools (Andersson et al. 2012; Butler et al. 2007). In other words, ethnicity could correlate with tolerance levels and with a preference for nearby schools. If mainly parents of one ethnic group prefer mixed schools, the degree to which such schools can remain ethnically mixed might be strongly constrained, specifically, if the other group is more willing to pick more distant schools. Our model also assumes that preferences are time-constant. However, inter-ethnic contacts can increase prejudice towards outgroups, if the right conditions are not met and may decrease those prejudices if they are. Therefore, we would expect time-varying preferences influenced by inter-ethnic contacts to make school diversity even more difficult to reach, if not complemented by other policies that promote positive inter-ethnic contacts within schools.
While we leave these possible extensions of our model to future research, we believe they all point to changes which may further limit the extent to which the presence of tolerant parents can curb self-reinforcing school segregation. At first glance, this suggests that our main finding might turn out to be robust: even if a considerable proportion of the population of parents hold very tolerant ethnic preferences, there still is a strong potential for unintended preference dynamics to generate substantial levels of school segregation.
However, the existence of the sweet spot leaves room for optimism and for policy makers. Indeed, residentially segregated urban areas, in which parents prefer nearby schools is not so uncommon.5 Because the presence of a large proportion of tolerant parents alone is not enough to robustly desegregate schools, our analyses suggest that policy makers wishing to reduce school segregation should consider lowering the barriers for desegregating school choices by tolerant parents. One suggestion implied by our model is that extension of the capacity of schools in ethnically diverse neighbourhoods relative to the size of schools in ethnically homogenous neighbourhoods might help. This would allow more tolerant parents living in mixed neighbourhoods to find a school fitting their preferences. However, one should be careful not to make too many intolerant parents unsatisfied, whose actions could then destabilize mixed schools. Along these lines, another possibility is to create schools in these specific regions, something we did not explore because our model assumes a fixed number of schools.
A second policy lever could be to play on any school characteristic that parents consider when they choose a school, but that is not perfectly correlated with school’s ethnic mix.6 Indeed, our model only considered home-to-school distance, but any other school characteristic might produce the same curbing effect. The most obvious example of such other characteristics is school quality. In the real world, perceived school quality is an important factor for parental choice. For example, ethnic majority parents often tend to see a large proportion of ethnic minority pupils as a signal of bad school quality. Even some minority parents might have prejudice towards their own group, because they perceive a large representation of an ethnic minority in a school as a sign of poor school quality. If this were the case, the cascading dynamic towards more segregated schools would likely be reinforced. In such a situation, increasing (or, better publicizing) mixed-schools’ educational quality could help curb school segregation, thereby de-correlating school quality (perceived or real) from the presence of ethnic minorities. If mixed schools were perceived as “good schools”, this would reinforce their desirability and help stabilizing them.
A third policy lever relates to another aspect not considered in our model: the selection of students by schools. If schools select their students based on their educational performance and student’s educational performance is correlated with ethnicity, then this would impede the proliferation of mixed schools. In such a context, and with the objective of diminishing school segregation, this would suggest limiting the capacities of schools to select their students based on educational performance.
It is worth noting that our model mainly applies to situations where school choice is not geographically constrained, such as in the Netherlands. Yet, even in countries like France where children’s school is assigned on the basis of the residential location, parents can always turn to private schools. Our model suggests that the less constrained are the parental choices, the higher the school segregation, which is consistent with empirical evidence (Böhlmark et al. 2015).
Another policy lever could therefore be to constrain as much as possible parents to send children to the closest school from home. However, one should be cautious with this interpretation on the sole basis of our model. Our model only captures “post-residential” school choices (Hastings et al. 2006), assuming that the choice of residential locations is not affected by parents’ expectations about the schools available in the proximity of a location. Yet, empirical studies found that especially ethnic majority parents consider schools when choosing their neighborhood (Bayoh et al. 2006; Frankenberg 2009), and tend to leave when they are too dissatisfied – the so-called “white flight” phenomenon (Fairlie & Resch 2002; Rangvid 2007; Renzulli & Evans 2005). Therefore, a school choice system that imposes too much constraints could unintendedly foster residential segregation and at the same time fail to reduce school segregation, resonating debates about the unintended consequences of school desegregation policies in the U.S. in the 1960s and 1970s (Logan et al. 2008). Subtler and more locally targeted policies might help to anticipate when schools tend to tip, and when targeted interventions are needed.
Our findings would suggest that even in a world with increasing proportions of ethnically tolerant parents it remains a formidable challenge to design school choice policies that preclude levels of school segregation most parents neither intend nor desire to bring about. We believe that computational models of the complexities of school choice dynamics have an important part to play in generating the insights needed to address this challenge. We conclude by reminding that, as we mentioned at the outset, mixed schools are only a condition for positive inter-ethnic contacts to even be possible. Any effort to desegregate schools should be complemented by policies to favor positive inter-ethnic contacts within mixed schools. Otherwise, the positive effects of diminishing between school segregation could be offset by an increase in within school segregation. Recent advances in the availability of longitudinal data and corresponding statistical methods have allowed to model empirically interdependent changes of network relations and attitudes, including attitudes towards ethnic outgroups, in multi-ethnic schools (Leszczensky & S. 2019; Stark et al. 2015; Tibor et al. 2020). We believe that combining insights from this work with those of our present study can help to pave the way towards integration of the dynamics of intra-school networks with those of between-school segregation in future social simulation studies giving a more complete model of ethnic segregation among adolescents.
Model Documentation
The model was originally coded in Netlogo 6.0.4. A version of the model (Netlogo 6.1) is accessible online at: https://www.comses.net/codebase-release/217c636c-5b35-443f-9c51-89c8e19697bd/. The data were analysed using R, and the plots were made with packages “ggplot2” and “plotly”.Acknowledgments
We would like to thank the members of the Norms and Network Cluster (NNC) at the Department of Sociology of the University of Groningen, as well as the participants of a presentation of an earlier version of this paper in the lecture series of the Institute for Advanced Studies (IAS), University of Amsterdam, for helpful comments. We also would like to thank three anonymous reviewers for their constructive and helpful feedback. A previous version of the paper has been presented at INAS 2017 in Oslo. Special thanks to Caroline Vincensini and Elodie Béthoux (ENS Paris-Saclay) and Gianluca Manzo (CNRS-GEMASS) for their help in organizing the visiting period which made this work possible. The second author acknowledges that this study is part of the research program Sustainable Cooperation – Roadmaps to Resilient Societies (SCOOP) funded by NWO and the Dutch Ministry of Education, Culture and Science (OCW) in its 2017 Gravitation Program (grant number 024.003.025). Usual disclaimers apply.Appendix
A: Residential Model
To generate the residential maps over which the school choice model is launched, we use a slightly modified version of the school choice algorithm, in which agents relocate according to their ethnic preferences only. In other words, distance plays no role, or more formally in Equation 1: \(\alpha = 1\). We thus have:
| \[p_{ijt+1} = \frac{e^{\beta V(x_{ejt})}}{\sum_{j=1}^{K} e^{\beta V(x_{ejt})}} \] | \[(6)\] |
For each cell evaluated, agents compute \(x_{ejt}\) for the neighbourhood composed by all cells in a diamond-shaped area. These are the 112 cells that can be reached by at most 6 steps vertically or horizontally across cell boundaries (radius 6).
One advantage of the discrete choice approach we adopted here is that it is better able to model diversity in (ethnic) preferences than the threshold models used by Schelling and much of the follow-up literature. Even though it is possible to model diversity in tolerance with threshold functions by varying threshold levels in the population (Hatna & Benenson 2015; Paolillo & Lorenz 2018), this results in more tolerant agents moving less than others. Without random noise, that is, agents moving at random with a certain probability at each tick, the cascading dynamic of movements typical of Schelling residential segregation’s models would never be triggered, because “tolerant” agents would not move, and the model could get stuck in its initial conditions or “frozen states” could emerge which are unstable against small random deviations. Indeed, with thresholds, whatever the functional form of the utility function, everything that is above the threshold is equally satisfying and everything below it is equally dissatisfying.
Thus, the agents’ decisions do not smoothly reflect their preferences: the agents do not look for better situations than what they already have if they are “satisfied” already. Since we wish to model tolerant preferences, not only as a smaller need for similar people, but also as a light aversion for too much similarity, we use the combination of single-peaked utility functions (Zhang 2004), and a random-utility model.

The two map generator methods only differ with respect to the functional form given to the ethnic satisfaction function \(V\). In map generator method 2, we use the same parametrization as in the school choice model, while in map generator method 1 all parents have the ethnic satisfaction function \(V\) of intolerant parents \(x_{0}=0.8\) and \(M = 0.6\). In this case, half of the parents “become” tolerant in the school choice model only, that is once the residential locations has been chosen and is fixed.
Appendix B: The Tipping of Schools in the Long Run
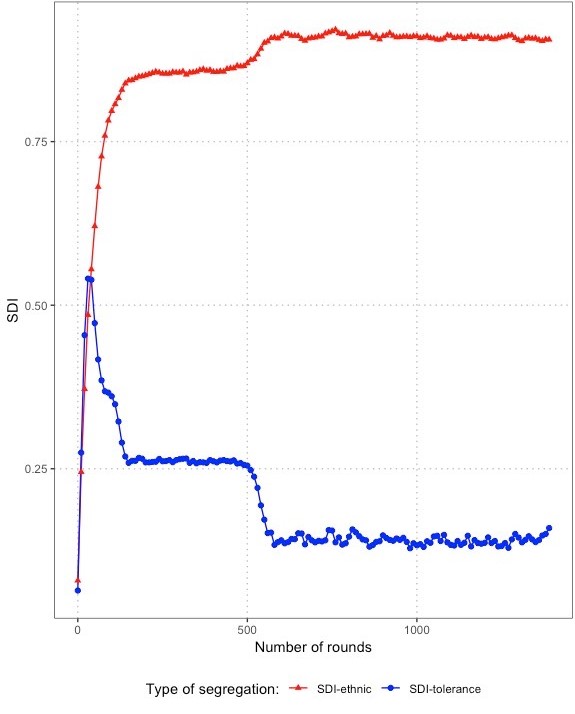
Figure 10 illustrates the instability of integrated schools without distance preference in the longer run (same parametrization as in Figure 6, but 1400 rounds). It can be clearly seen that after about 500 rounds, an integrated school tips, which instantaneously reduces segregation by tolerance and increases ethnic segregation even though the run had been stable for more than 300 rounds.
Appendix C: Long Run Dynamics for Different Conditions
We simulated scenarios in which we assumed an unlimited number of students per school, and set \(M=0\) for tolerant parents, making their preference function symmetric (see also Appendix E, Figure 15). Figure 11 shows a comparison of illustrative runs with and without these modifications for the setting of a highly segregated residential map and a moderate distance preference of \(\alpha = 0.4\), with a 50% share of tolerant agents.
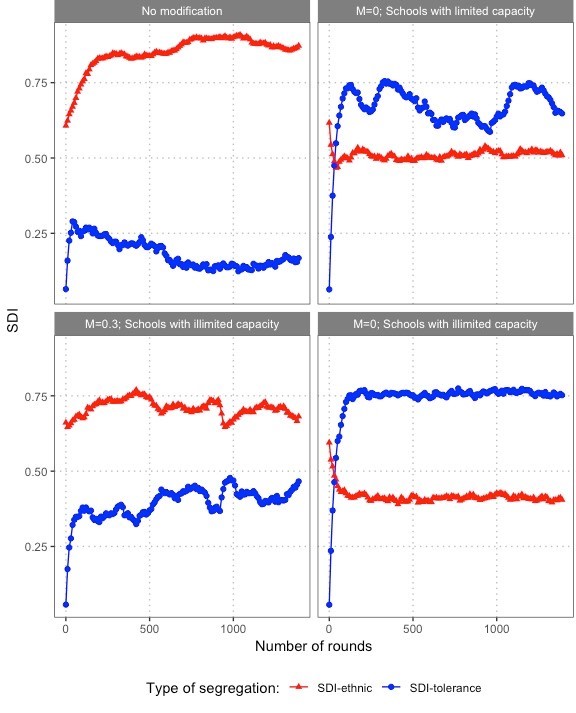
Figure 11 further confirms our explanation. We see significantly higher levels of segregation by tolerance in schools for all modified parametrizations. The modifications reduce at the same time ethnic school segregation because segregation by tolerance prevents mixed schools from unravelling due to preference cascades among tolerant agents.
Appendix D: Results for Segregation by Tolerance in Schools
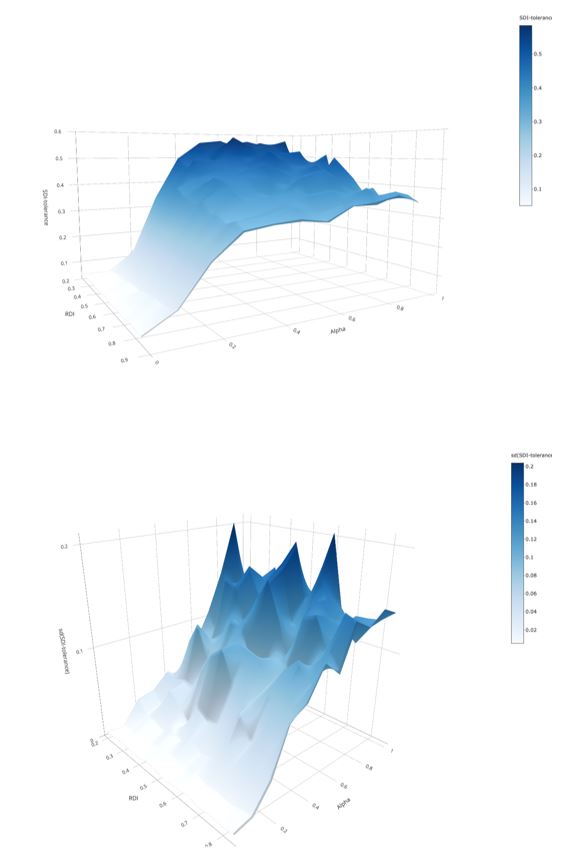
Figure 12 charts the combined effects of distance preference and residential segregation on school segregation by tolerance. To preview, a weaker preference for nearby schools simultaneously increases segregation by ethnicity, and reduces segregation by tolerance in schools.
The second result shown in 12 is considerable variance between runs with similar parametrization as parents’ preference for nearby schools (\(\alpha\)) becomes weaker. With a weak distance preference, the movements of intolerant parents lead initially to strong segregation of schools by tolerance, but beyond some tipping point several of the remaining mixed schools also tend to unravel and become ethnically more homogenous.7 When exactly the tipping point occurs depends on when each mixed school will tip, which in turn depends on a number of random factors such as the sequence in which agents are activated, or the distance between schools. This explains the variation in tolerance segregation depicted in the lower panel of Figure 9. Tolerance segregation is high in realizations that have not yet reached the point where many schools have tipped when the simulation ends. Instead, it is considerably lower when dynamics have passed this point. In some cases, integrated schools even unravel entirely into segregated schools. Overall, the weaker the distance preference the higher the standard deviation of tolerance segregation between replications, reflecting more instability of the tolerance segregation that develops early on in the process. How stable is this result in the longer run? In long-term simulations (rounds=1400) we find that for \(\alpha = 1\), \(SDI\)-tolerance diminishes to 0.27 for \(RDI = 0.25\) and the standard deviation equals 0.15. For \(RDI = 0.67\) we find that \(SDI-tolerance = 0.24\) and \(std = 0.12\) after 1400 rounds.
Appendix E: Robustness Checks with “Simple” Segregation
In the results presented in this appendix we varied some of parameters held constant in the main analyses. Since for \(\alpha = 0\) (parents only consider the distance between home and school) there is no change across experimental conditions, we did not run new simulations for these points of the parameter space in the robustness checks presented in this appendix. Instead, we used the same values as in the main analyses of the article (except for Figure 18, which corresponds to a 75-25 majority-minority scenario). All figures in this appendix are made using map generator method 1 because in the main analyses we focused on this scenario where the effect of tolerance heterogeneity can only pass through the school choices. Results of this appendix should be compared to Figure 3 in the main analyses.
Overall, the qualitative patterns are the same compared to Figure 3. When significant differences were found, we commented on these bellow.
The higher \(\beta\), which leaves less room for randomness in parent’s choices, does not qualitatively change the relationships between our variables of interest.
Adding 10 more schools does not seem to affect our results in the short run.
When parents are perfectly tolerant, we see that they perfectly compensate the segregating force of intolerant parents. We see no conditions under which ethnic segregation exceeds \(SDI = 0.5\).
When intolerant parents are maximally intolerant \(x_{0} = 1\), our results are not affected in the short run.
In Figure 17, the number of agents selected per round was set to 960 agents (1/6 of the population). This corresponds to a scenario where a round resembles one generation of parents renewing their decisions. To make these results comparable with the main results, we stopped our simulations after 36 rounds in the school segregation model (\(36 \times 960 \approx 35000\) decisions). To generate a fined-grained variation of residential maps with different levels of \(RDI\), we therefore kept the number of agents selected per round in the residential model constant (250).
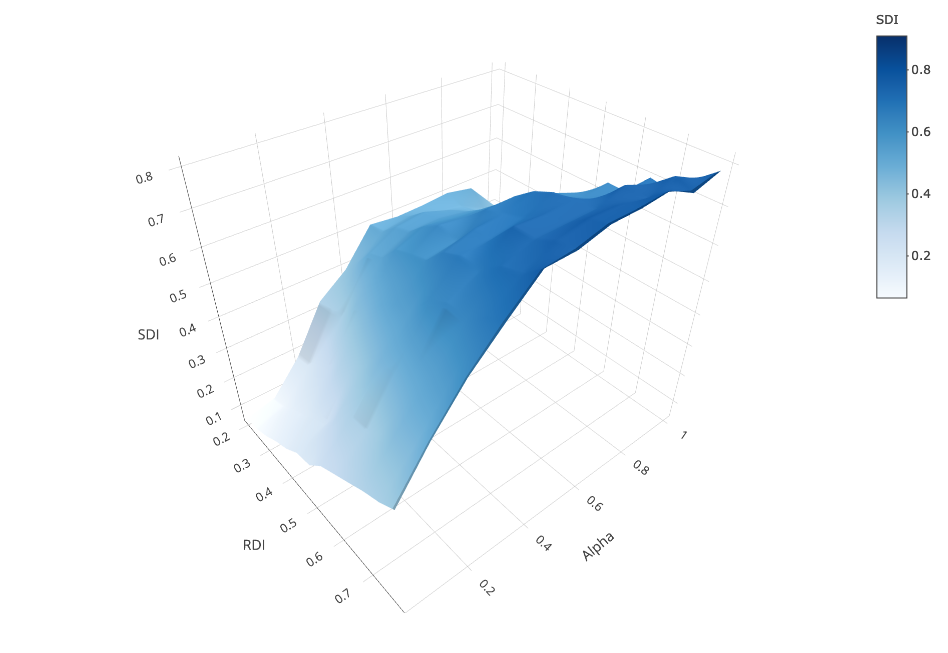
Figure 18 displays the outcome of our model when there is a clear majority-minority 75-25% in the population. We see that the qualitative patterns are the same. The main quantitative changes happen for low levels of residential segregation where school segregation is significantly lower than in the 50-50 scenario in particular for high values of \(\alpha\). What changes here are the conditions for intolerant minority parents to cluster into segregated schools: when residential segregation is low, it is very difficult for the small minority intolerant parents to find schools in which they can cluster. When a school starts to segregate with a concentration of minority parents, this tendency is counteracted by the choices of tolerant majority parents, who are much more numerous, and prevent this school from tipping. In additional simulations, we find this result not to hold in the long run: even for low residential segregation and high values of \(\alpha\), \(SDI \geq 0.6\). However, this remains significantly lower than for residentially segregated worlds. In these scenarios, a few schools have initially a high proportion of minority pupil. These schools are attractive for minority intolerant parents from the outset and remain so, because - as explained in the core of the paper, it is very unlikely for a segregated school to desegregate. We thus find that residential segregation exacerbates school segregation dynamics also in the minority-majority scenario.
Appendix F
In this Appendix, we analyse whether the desegregating effect of tolerant parents on school segregation is different with “complex” rather than “simple” segregation.
Firstly, in Figure 19 we compare the \(SDI\) our model generates between “complex” and “simple” maps in the short run.
No neat pattern emerges out of Figure 19, meaning that the difference between the effect of tolerant agents on school segregation between “complex” and “simple” maps is not strong. If anything, the figure indicates that the difference is a bit higher if residential segregation is relatively strong. However, one should notice that heterogeneity in ethnic preferences does not only reduce school segregation for similar levels of residential segregation, but it also significantly reduces residential segregation in the first place (see below). Thus, the main difference between the two methods for generating maps in the short run, is through the indirect effect tolerant parents have on school segregation.
Yet we were also curious whether complex segregation made the desegregating effect of tolerant parents more stable in the long run. We simulated 100 runs of 1400 rounds with each of the two map generator methods for a scenario where a clear difference between segregation dynamics in the two types of maps can be expected to be arise.
To find out, we chose moderate strength of preferences for nearby schools, \(\alpha = 0.3\), because this is the point where the desegregating effect of tolerant parents is the strongest. Further we selected a relatively high degree of ethnic residential segregation, \(RDI = 0.67\), because here differences between maps with tolerant parents selected into mixed neighbourhoods and maps with ethnic clustering unrelated to tolerance preferences can be expected to show up clearly. In fact, \(RDI = 0.67\), is almost the maximum residential segregation we can obtain for “complex” maps with 50% tolerant agents. Figure 20 plots the results of this experiment. “Complex” segregation slightly reduces ethnic segregation in schools (after 1400 rounds: \(\Delta SDI = - 0.056\), i.e. 8.2% decrease) compared to “simple” segregation with the same level of \(RDI\). We also observe a substantial rise in segregation by tolerance in schools. The reason is that in “complex” segregation, tolerant parents are already clustered in the same areas. The distance preference reinforces the attractiveness of ethnically diverse schools located in these areas. This is less the case in “simple” segregation, where there is no sorting of tolerant parents into the same spatial regions.
Additionally, one can see that the dispersion between runs remains important, even in the long run. This is likely due to different factors. In particular, we believe two aspects play a role here: the relative position of the schools and the order in which agents are activated during the run in particular at the beginning. Discovering how exactly each of these factors would relate to the variation around the mean between different runs under the same conditions would require further investigations beyond the scope of this paper.
Finally, the average dynamics appear to be different across the two types of maps. While on the “simple” maps ethnic segregation keeps increasing gradually throughout the 1400 rounds of our simulation, it seems to have stabilized after about 500 rounds on the complex maps. Conversely, tolerance segregation is still increasing slightly on the complex maps after 1400 rounds but seems to have stablized on the simple maps. This is further in line with the intuition that the self-sorting of tolerant agents into mixed residential areas sustains mixed schools in those areas in the long-run, while mixed schools tend to slowly unravel on simple maps.
Appendix G: Explanatory Note on the Construction of the 3D Plots
For each of the 3D figures in the paper, we have 71 (number of rounds the residential segregation process was run) \(\times\) 11 (number of values for \(\alpha\)) \(\times\) 3 (number of replications) =2343 data points. The number of rounds in the residential model were used to create variation of \(RDI\), which means that two residential maps generated with similar numbers of rounds have values of \(RDI\) which are likely to be very similar. We then collapsed all data points falling within the bounds of intervals of length 0.05. Because \(0.2 \leq RDI \leq 0.85\), the 3d plots represent at maximum \(14 \times 11 = 154\) points, and therefore on average \(2343/154 \approx 15.21\) independent simulation runs per point represented in the 3d plot.
Notes
The choice of this number is the result of a balance between computational speed, and the need to have a fine-grained variation of residential segregation across conditions. We checked the sensitivity of our results to this choice in Appendix E, Figure 17, by taking 960 agents per round (\(\frac{1}{6}\) of the population), and we did not find noticeable differences in the outcomes.↩︎
Because including tolerant parents’ preferences in the residential decision tends to reduce residential segregation levels, we slightly change the way we generate the continuum of maps for the purposes of method 2. In order to reach high levels of residential segregation with method 2, instead of incrementing number of rounds by steps of 1 from 0 to 70 (as in method 1), we increment number of rounds by steps of 1 from 0 to 59, and by steps of 3, from 60 to 90.↩︎
It is interesting to note that even for very high levels of residential segregation (\(RDI = 0,85\)), when (\(\alpha = 0\)) school segregation remains moderate (\(SDI = 0,42\)). Two phenomena explain this outcome. Firstly, schools are positioned at random on the map, which leads some of them to be located close to frontiers between residentially segregated areas. Their catchment areas contain children from both sides of the residential ethnic border, therefore their ethnic composition is relatively integrated, especially for the bigger ones. This brings down the overall initial level of school segregation. Secondly, detailed analyses of simulation runs revealed that for highly residentially segregated maps, the level of school segregation further decreases over time in a simulation run. Recall that for \(\alpha = 0\), tolerant and intolerant parents are equivalent because they only minimize distance from home to school. However, this minimization is not perfect as \(\beta = 12\) allows for some randomness in decisions, weakening the association between residential map characteristics and school segregation. If agents’ choices would perfectly reflect their preferences – in this case staying in the closest school from their home – the level of school segregation would be higher. For example, for \(\beta = 100\)and \(RDI = 0,85\), we obtain \(SDI=0,55\) (instead of 0,42 for \(\beta = 12\)), all other things being equal.↩︎
Technically, the slope of satisfaction with the ethnic composition is steeper in deviations from the 50% optimal mix on the left part of the optimal point (\(x \leq x_{0}\)), than on the right side (\(x > x_{0}\))↩︎
We thank one anonymous reviewer for this suggestion.↩︎
We thank one anonymous reviewer for this suggestion.↩︎
We used the word tipping both at a global level, i.e. the simulation run tips, and at a local level, i.e. a specific school tips. However, the former was just the aggregated consequence of an accumulation of the latter.↩︎
References
ALBA, R., & Romalewski, S. (2013). The end of segregation? Hardly. A more nuanced view from the New York metropolitan region. Center for Urban Research. CUR research initiatives.
ALLPORT, G. W. (1954). The Nature of Prejudice. Reading, MA: Addison-Wesley.
ANDERSSON, E., Malmberg, B., & Östh, J. (2012). Travel-to-school distances in Sweden 2000–2006: Changing school geography with equality implications. Journal of Transport Geography, 23, 35–43. [doi:10.1016/j.jtrangeo.2012.03.022]
ANDERSSON, R., Brattbakk, I., & Vaattovaara, M. (2017). Natives’ opinions on ethnic residential segregation and neighbourhood diversity in Helsinki, Oslo and Stockholm. Housing Studies, 32(4), 491–516. [doi:10.1080/02673037.2016.1219332]
ASHENFELTER, O., Collins, W. J., & Yoon, A. (2006). Evaluating the role of Brown v. Board of education in school equalization, desegregation, and the income of African Americans. American Law and Economics Review, 8(2), 213–248. [doi:10.1093/aler/ahl001]
BAKKER, J., Denessen, E., Peters, D., & Walraven, G. (2011) (Eds.). International Perspectives on Countering School Segregation. Antwerpen-Apeldoom: Garant.
BAYOH, I., Irwin, E. G., & Haab, T. (2006). Determinants of residential location choice: How important are local public goods in attracting homeowners to central city locations? Journal of Regional Science, 46(1), 97–120. [doi:10.1111/j.0022-4146.2006.00434.x]
BILLINGHAM, C. M., & Hunt, M. O. (2016). School racial composition and parental choice: New evidence on the preferences of white parents in the United States. Sociology of Education, 89(2), 99–117. [doi:10.1177/0038040716635718]
BORGHANS, L., Golsteyn, B. H. H., & Zölitz, U. (2015). Parental preferences for primary school characteristics. The B.E. Journal of Economic Analysis & Policy, 15(1). [doi:10.1515/bejeap-2014-0032]
BOTERMAN, W., Musterd, S., Pacchi, C., & Ranci, C. (2019). School segregation in contemporary cities: Socio-spatial dynamics, institutional context and urban outcomes. Urban Studies, 56(15), 3055–3073. [doi:10.1177/0042098019868377]
BÖHLMARK, A., Holmlund, H., & Lindahl, M. (2015). School choice and segregation: Evidence from Sweden. Working Paper, No. 2015:8, Institute for Evaluation of Labour Market and Education Policy (IFAU), Uppsala.
BRUCH, E. E., & Mare, R. D. (2006). Neighborhood choice and neighborhood change. American Journal of Sociology, 112(3), 667–709. [doi:10.1086/507856]
BURGESS, S., McConnell, B., Propper, C., & Wilson, D. (2007). 'The impact of school choice on sorting by ability and socioeconomic factors in English secondary education.' In L. Woessmann & P. E. Peterson (Eds.), Schools and the Equal Opportunity Problem (Vol. 273). Cambridge, MA: The MIT Press.
BURGESS, S., Wilson, D., & Lupton, R. (2005). Parallel lives? Ethnic segregation in schools and neighbourhoods. Urban Studies, 42(7), 1027–1056. [doi:10.1080/00420980500120741]
BUTLER, T., Hamnett, C., Ramsden, M., & Webber, R. (2007). The best, the worst and the average: Secondary school choice and education performance in East London. Journal of Education Policy, 22(1), 7–29. [doi:10.1080/02680930601065718]
CAETANO, G., & Maheshri, V. (2007). School segregation and the identification of tipping behavior. Journal of Public Economics, 22, 115–135. [doi:10.1016/j.jpubeco.2017.02.009]
CLARK, W. A. (2015). Residential Segregation: Recent Ttrends. Amsterdam: Elsevier.
CLARK, W. A., Andersson, E. K., & Malmberg, B. (2018). What can we learn about changing ethnic diversity from the distributions of mixed-race individuals? Urban Geography, 39(2), 263–281. [doi:10.1080/02723638.2017.1308183]
CLARK, W. A., & Brazil, N. (2018). Neighborhood selections by young adults: Evidence from a panel of US adolescents. Journal of Urban Affairs, 41(7), 981–998. [doi:10.1080/07352166.2019.1569466]
CLARK, W. A., & Maas, R. (2009). The geography of a mixed‐Race society. Growth and Change, 40(4), 565–593. [doi:10.1111/j.1468-2257.2009.00501.x]
CLARK, W. A. V., & Fossett, M. (2008). Understanding the social context of the Schelling segregation model. Proceedings of the National Academy of Sciences, 105(11), 4109–4114. [doi:10.1073/pnas.0708155105]
COENDERS, M. T. A., Lubbers, M., & Scheepers, P. L. H. (2004). Weerstand tegen scholen met allochtone kinderen: De etnische tolerantie van hoger opgeleiden op de proef gesteld [Resistance against schools with allochthonous pupils: A test of the ethnic tolerance of the higher educated].
DOVIDIO, J. F., Love, A., Schellhaas, F. M., & Hewstone, M. (2017). Reducing intergroup bias through intergroup contact: Twenty years of progress and future directions. Group Processes & Intergroup Relations, 20(5), 606–620. [doi:10.1177/1368430217712052]
ELLIS, M., Holloway, S. R., Wright, R., & East, M. (2007). The effects of mixed-race households on residential segregation. Urban Geography, 28(6), 554–577. [doi:10.2747/0272-3638.28.6.554]
ELLIS, M., Holloway, S. R., Wright, R., & Fowler, C. S. (2012). Agents of change: Mixed-race households and the dynamics of neighborhood segregation in the United States. Annals of the Association of American Geographers, 102(3), 549–570. [doi:10.1080/00045608.2011.627057]
FAIRLIE, R. W., & Resch, A. M. (2002). Is there “White Flight” into private schools? Evidence from the National Educational Longitudinal Survey. The Review of Economics and Statistics, 84(1), 21–33. [doi:10.1162/003465302317331892]
FARLEY, R., Schuman, H., Bianchi, S., Colasanto, D., & Hatchett, S. (1978). “Chocolate city, vanilla suburbs”: Will the trend toward racially separate communities continue? Social Science Research, 7(4), 319–344. [doi:10.1016/0049-089x(78)90017-0]
FARLEY, R., & Taeuber, A. F. (1974). Racial segregation in the public schools. American Journal of Sociology, 79(4), 888–905. [doi:10.1086/225631]
FARRELL, C. R., & Lee, B. A. (2011). Racial diversity and change in metropolitan neighborhoods. Social Science Research, 40(4), 1108–1123. [doi:10.1016/j.ssresearch.2011.04.003]
FLACHE, A., & Hegselmann, R. (2001). Do irregular grids make a difference? Relaxing the spatial regularity assumption in cellular models of social dynamics. Journal of Artificial Societies and Social Simulation, 4(4), 6: https://www.jasss.org/4/4/6.html.
FOSSETT, M. (2006). Ethnic preferences, social distance dynamics, and residential segregation: Theoretical explorations using simulation analysis. The Journal of Mathematical Sociology, 30(3–4), 185–273. [doi:10.1080/00222500500544052]
FRANKENBERG, E. (2009). 'The impact of school segregation on residential housing patterns: Mobile, Alabama, and Charlotte, North Carolina.' In G. Orfield & J. C. Boger (Eds.), School Resegregation: Must the South Turn Back? (pp. 164–184). Chapel Hill: University of North Carolina Press.
FRANKENBERG, E. (2013). The role of residential segregation in contemporary school segregation. Education and Urban Society, 45(5), 548–570. [doi:10.1177/0013124513486288]
FREY, W. H. (2018a). Diversity Explosion: How New Racial Demographics Are Remaking Americas. Washington, DC. Brookings Institution Press.
FREY, W. H. (2018b). The Millennial Generation: A Demographic Bridge to America’s Diverse Future. Washington, DC. Brookings Institution Press.
GLAESER, E., & Vigdor, J. (2012). The end of the segregated century: Racial separation in America’s neighborhoods, 1890–2010. Manhattan Institute for Policy Research, January 2012, No. 66.
GOYETTE, K. A., Farrie, D., & Freely, J. (2012). This School’s gone downhill: Racial change and perceived school quality among whites. Social Problems, 59(2), 155–176.
HALL, M., Tach, L., & Lee, B. A. (2016). Trajectories of ethnoracial diversity in American communities, 1980–2010. Population and Development Review, 42(2), 271–297. [doi:10.1111/j.1728-4457.2016.00125.x]
HASTINGS, J. S., Kane, T. J., & Staiger, D. O. (2006). Preferences and heterogeneous treatment effects in a public school choice lottery. No 12145, NBER Working Papers from National Bureau of Economic Research, Inc. [doi:10.3386/w12145]
HATNA, E., & Benenson, I. (2015). Combining segregation and integration: Schelling model dynamics for heterogeneous population. Journal of Artificial Societies and Social Simulation, 18(4), 15: https://www.jasss.org/18/4/15.html. [doi:10.18564/jasss.2824]
HEGSELMANN, R. (2017). Thomas C. Schelling and James M. Sakoda: The intellectual, technical, and social history of a model. Journal of Artificial Societies and Social Simulation, 20(3), 15: https://www.jasss.org/20/3/15.html. [doi:10.18564/jasss.3511]
IBRAIMOVIC, T., & Masiero, L. (2014). Do birds of a feather flock together? The impact of ethnic segregation preferences on neighbourhood choice. Urban Studies, 51(4), 693–711. [doi:10.1177/0042098013493026]
JOHNSON, R. C. (2011). Long-run impacts of school desegregation and school quality on adult attainments. NBER Working Paper No. 16664. [doi:10.3386/w16664]
JOHNSTON, R., Burgess, S., Wilson, D., & Harris, R. (2006). School and residential ethnic segregation: An analysis of variations across England’s local education authorities. Regional Studies, 40(9), 973–990. [doi:10.1080/00343400601047390]
KARSTEN, S., Ledoux, G., Roeleveld, J., Felix, C., & Elshof, D. (2003). School choice and ethnic segregation. Educational Policy, 17(4), 452–477. [doi:10.1177/0895904803254963]
KESSEL, D., & Olme, E. (2018). School choice priority structures and school segregation. ISEAK Working Paper 2020/1.
KIM, J. H., Pagliara, F., & Preston, J. (2005). The intention to move and residential location choice behaviour. Urban Studies, 42(9), 1621–1636. [doi:10.1080/00420980500185611]
KRISTEN, C. (2003). School choice and ethnic school segregation: Primary school selection in Germany. Waxmann Verlag.
LEE, B. A., Iceland, J., & Sharp, G. (2012). Racial and ethnic diversity goes local: Charting change in American communities over three decades.
LESZCZENSKY, L., & S., P. (2019). What drives ethnic homophily? A relational approach on how ethnic identification moderates preferences for same-ethnic friends. American Sociological Review, 84(2), 394–419. [doi:10.1177/0003122419846849]
LOGAN, J. R., Oakley, D., & Stowell, J. (2008). School segregation in metropolitan regions, 1970–2000: The impacts of policy choices on public education. American Journal of Sociology, 113(6), 1611–1644. [doi:10.1086/587150]
MASSEY, D. S., & Denton, N. A. (1988). The dimensions of residential segregation. Social Forces, 67(2), 281. [doi:10.2307/2579183]
MCFADDEN, D. (1973). 'Conditional logit analysis of qualitative choice behavior.' In P. Zarembka (Ed.), Frontiers in Econometrics (pp. 105–142). Academic Press.
OKABE, A., Boots, B. N., & Sugihara, K. (1992). Spatial Tessellations: Concepts and Applications of Voronoi Giagrams. Hoboken, NJ: John Wiley & Sons.
ONG, P. M., & Rickles, J. (2004). The continued nexus between school and residential segregation. Asian LJ, 11.
PAOLILLO, R., & Lorenz, J. (2018). How different homophily preferences mitigate and spur ethnic and value segregation: Schelling’s model extended. Advances in Complex Systems, 21(06n07), 1850026. [doi:10.1142/s0219525918500261]
POWERS, D. A., & Ellison, C. G. (1995). Interracial contact and black racial attitudes: The contact hypothesis and selectivity bias. Social Forces, 74(1), 205–226. [doi:10.1093/sf/74.1.205]
RANGVID, B. S. (2007). Living and learning separately? Ethnic segregation of school children in Copenhagen. Urban Studies, 44(7), 1329–1354. [doi:10.1080/00420980701302338]
REARDON, S. F., & Owens, A. (2014). 60 years after Brown: Trends and consequences of school segregation. Annual Review of Sociology, 40, 199–218. [doi:10.1146/annurev-soc-071913-043152]
REARDON, S. F., & Yun, J. T. (2005). Integrating Neighborhoods, Segregating Schools: The Retreat from School Desegregation in the South, 1990-2000. Chapel Hill: University of North Carolina Press.
RENZULLI, L. A., & Evans, L. (2005). School choice, charter schools, and white flight. Social Problems, 52(3), 398–418. [doi:10.1525/sp.2005.52.3.398]
SAKODA, J. M. (1971). The checkerboard model of social interaction. The Journal of Mathematical Sociology, 1(1), 119–132.
SCHELLING, T. C. (1971). Dynamic models of segregation. The Journal of Mathematical Sociology, 1(2), 143–186.
SCHWANEN, T., & Mokhtarian, P. L. (2004). The extent and determinants of dissonance between actual and preferred residential neighborhood type. Environment and Planning B: Planning and Design, 31(5), 759–784. [doi:10.1068/b3039]
SKVORETZ, J. (2006). Introduction to special edition on “Ethnic Preferences, Social Distance Dynamics, and Residential Segregation: Theoretical Explanations Using Simulation Analysis” by Mark Fossett. The Journal of Mathematical Sociology, 30(3–4), 181–184. [doi:10.1080/00222500500543153]
SPAISER, V., Hedström, P., Ranganathan, S., Jansson, K., Nordvik, M. K., & Sumpter, D. J. T. (2018). Identifying complex dynamics in social systems: A new methodological approach applied to study school segregation. Sociological Methods & Research, 47(2), 103–135. [doi:10.1177/0049124116626174]
STARK, T. H., Mäs, M., & Flache, A. (2015). Liking and disliking minority-group classmates: Explaining the mixed findings for the influence of ethnic classroom composition on interethnic attitudes. Social Science Research, 50, 164–176. [doi:10.1016/j.ssresearch.2014.11.008]
STOICA, V. I., & Flache, A. (2014). From Schelling to schools: A comparison of a model of residential segregation with a model of school segregation. Journal of Artificial Societies and Social Simulation, 17(1), 5: https://www.jasss.org/17/1/5.html. [doi:10.18564/jasss.2342]
TASAN-KOK, T., Van Kempen, R., Mike, R., & Bolt, G. (2014). Towards hyper-diversified European cities: A critical literature review. Utrecht University.
TIBOR, Z., Stark, T., & Flache, A. (2020). Who is most influential? Adolescents’ intergroup attitudes and peer influence within a social network. Group Processes & Intergroup Relations, 23(5).
VAN de Rijt, A. , Siegel, D., & Macy, M. (2009). Neighborhood chance and neighborhood change: A comment on Bruch and Mare. American Journal of Sociology, 114(4), 1166–1180. [doi:10.1086/588795]
VERTOVEC, S. (2009). Super-diversity and its implications. Ethnic and Racial Studies, 30(6), 1024–1054. [doi:10.1080/01419870701599465]
WÖLFER, R., Schmid, K., Hewstone, M., & Zalk, M. van. (2016). Developmental dynamics of intergroup contact and intergroup attitudes: Long-Term effects in adolescence and early adulthood. Child Development, 87(5), 1466–1478.
XIE, Y., & Zhou, X. (2012). Modeling individual-level heterogeneity in racial residential segregation. Proceedings of the National Academy of Sciences, 109(29), 11646–11651. [doi:10.1073/pnas.1202218109]
ZHANG, J. (2004). Residential segregation in an all-integrationist world. Journal of Economic Behavior & Organization, 54(4), 533–550. [doi:10.1016/j.jebo.2003.03.005]