Agent-Based Modelling of Future Dairy and Plant-Based Milk Consumption for UK Climate Targets

, ,
and
aImperial College London, United Kingdom; bEnergy Planning Program, Universidade Federal do Rio de Janeiro, Brazil
Journal of Artificial
Societies and Social Simulation 25 (2) 3
<https://www.jasss.org/25/2/3.html>
DOI: 10.18564/jasss.4801
Received: 31-Dec-2021 Accepted: 22-Feb-2022 Published: 31-Mar-2022
Abstract
A reduction in the production and consumption of meat and dairy across much of the world is critical for climate change mitigation, the alleviation of ecological stress, and improved health. We update an agent-based model (ABM) of historic UK milk consumption and apply it to scenarios of dairy reduction and adoption of plant-based milk (PBM) out to 2050. The updated model is comprised of a cognitive function, where agents perceive the physical, health and environmental characteristics of milk choice, which is modified by habit and social influence. We use European Social Survey 2018 and British Social Attitudes 2008 survey data to empirically inform the model. Taking a backcasting approach, we calibrate parameters against published UK dairy reduction targets (2030 and 2050), and test how different price relationships, and characterisations of environmental concern, may affect simulated milk consumption from 2020 to 2050. Scenarios for core targets (20% less dairy by 2030 and 35% by 2050) largely produced plausible consumption trajectories. However, at current pricing of dairy and PBM, simulated consumption was mostly unable to deliver on desired core targets, but this improved markedly with dairy prices set to organic levels. The influence of changing environmental concern on milk choice resulted in higher levels of dairy milk reduction. When modelled as transient, intense shocks to public concern, consumption patterns did not fundamentally change. However, small, incremental but permanent changes to concern did produce structural changes to consumption patterns, with dairy falling below plant-based alternatives at around 2030. This study is the first to apply an ABM in the context of scenarios for dairy reduction and PBM adoption in service to UK climate-related consumption targets. It can serve as valuable bottom-up, alternative, evidence on the feasibility of dietary shift targets, and poses policy implications for how to address impediments to behavioural change.Introduction
The global food system is at the intersection of several connected crises, imposing a severe planetary burden that necessitates transformational change across all aspects of production and consumption. One key component of this is the need for dietary reduction of meat and dairy across much of the world. The latter is the focus of this study, and is responsible for around 1.7 Gt \(CO_{2}\)eq (GDP 2018), as well as stress on water, land, and ecosystem pollution (Mekonnen & Hoekstra 2012; Poore & Nemecek 2018). However, there is heterogeneity in the overall scale of impact of dairy milk at regional, national, and farm level, depending on factors such as geography, farming and production method (Guerci et al. 2013a; b; Poore & Nemecek 2018). Further, globally some malnourished and food insecure populations would see important nutritional benefit in increasing the amount of animal derived foods they consume (Mbow et al. 2019). While recognising this impact variability, there is clear evidence that lower consumption of meat and dairy for many populations will deliver improvements across a host of key sustainability dimensions (Poore & Nemecek 2018; Springmann et al. 2016).
The Climate Change Committee (CCC), the UK’s legally designated, independent public body that act as climate change advisors to the government, recently published a set of targets to shift toward more sustainable diets (Climate Change Committee, 2020). Their central targets call for a 20% reduction in meat and dairy consumption by 2030, rising to 35% by 2050. A further scenario was considered that elevated this latter target to 50% by 2050. Here, the CCC assume that decreases in dairy consumption is met by an increase in plant alternatives (that we take to be plant-based milks (PBM) in the study). These core targets are largely in-line with outcomes from the UK’s Climate Assembly, a citizen engagement initiative that acts as a forum for everyday people to discuss, critique and share ideas on achieving the UK’s ‘net zero by 2050’. Here, participants came to a general consensus of a 20%-40% reduction in meat and dairy by 2050 (Climate Assembly UK, 2020). However, civil society and activist groups have gone further, with the Eating Better alliance arguing for UK meat and dairy consumption to fall by 50% by 2030 (Eating Better, 2019).
This represents a fairly wide variability of potential future paths (20%-50% reduction by 2030, 35%-50% by 2050). Central to these differences in ambition is the interconnected and multi-faceted nature of food and food choice. Food choices are repeat, regular, contextual and complex decisions and are influenced by a host of different factors (Chen & Antonelli 2020; Monteleone et al. 2017; Sobal & Bisogni 2009). These influences are diverse in impact, scale of operation, and their ‘visible proximity’ to individuals. A definitive taxonomy is difficult, however, one recent review of extant literature in the space categorises food choice influence into one of three areas; food-related features, individual differences, and society-related features (Chen & Antonelli 2020). Some have critiqued the use of ‘choice’ in the context of food consumer behaviour (Smeaton et al. 2010), and there is a well understood and growing evidence base on the activities and impact of powerful actors (corporate or otherwise) on food systems and ultimately individual ‘choice’ (Clapp & Scrinis 2016; Lauber et al. 2021; Swinburn 2019; Tempels et al. 2017). Indeed, a sympathetic reading of the UK government’s decision not to include any recommended climate-related dietary targets in its Net Zero Strategy, may reflect the perceived difficulty in effectively navigating these influences.
Given the contested nature of these target options, and the fundamental dynamics and influences at play, it is important to understand how future dairy and plant-based milk consumption curves may evolve, and under what conditions. To date, many major modelling efforts on climate mitigation have not sought to capture, or explicitly considered, the bottom-up dynamics of dietary change. Agent-based modelling (ABM) is one approach that can yield useful insights on phenomena characterised by many different, autonomous, interacting entities, whose collective micro decision-making can lead to emergent macro-level trends. In this sense, ABMs are well suited to investigate individual food preferences and influences, and how these may generate societal-wide dietary shifts (for example of dairy to plant-based milk).
This study aims to narrow the research gap by developing and applying an ABM of milk choice for scenarios of future UK dairy milk reduction, and a concomitant increase in plant-based alternatives. The UK is selected as a country for investigation as it remains a sizeable dairy consumer, and has a number of published country specific dairy reduction targets. We take three CCC targets (20% less dairy by 2030, 35% by 2050, 50% by 2050) and the 50% by 2030 target from civil society, and construct and calibrate several different scenarios to investigate how simulations compare against these desired consumption levels. Within this, we test how different representations of price dynamics and agent environmental concern may impact the overall success or failure to achieve target levels. We consider a representation of current dairy milk-PBM pricing and the case if all dairy milk was priced at organic levels. Change to environmental concern is characterised by two different mechanisms, a stochastic temporary concern ‘shock’, and a continuous incremental gain in public concern. These mechanisms affect the possibility of agents being triggered to shift how much weight they ascribe to environmental impact.
Specifically, we ask: to what extent do model scenarios of UK future milk consumption from 2020 to 2050 deliver on desired target levels, and are their trajectories plausible? Within this, we ask a secondary question: how do different price dynamics and environmental concern affect simulation outcomes and what are the implications for achieving reduction targets?
Background: Agent-Based Modelling of Food Choice
Agent-based modelling (ABM) is an approach that seeks to understand a phenomenon or area of interest by focusing on individual decision-making and behaviour, rather than aggregate groups. ABMs can capture heterogeneity and incorporate diverse empirical data, for example in attitudes, preferences, biases, habits and demographics across populations. It is distinguished from similar techniques, such as microsimulation, by the possibility of social interaction between agents. A key feature of ABMs is the possibility for emergent macro-level outcomes that cannot be predicted or constructed simply by the individual parts of the simulation. This makes them well-suited to explore macro-level paths for future (more) sustainable diets, by investigating individual food choice and consumption behaviour.
ABMs have been employed to investigate healthy diets (Auchincloss et al. 2011; Zhang et al. 2014, 2021), sustainable food (Lloyd & Chalabi 2021; Namany et al. 2020), and have gained traction as a tool in wider public health research (see Tracy et al. (2018) for review). For the most part, these investigations have focused either on individual dietary behaviour, or on the sustainability determinants of food systems at the supply level. Fewer have combined these avenues to explore sustainable diets, although this is now receiving greater interest, with studies that for example have assessed meat consumption behaviour of UK consumers (Scalco et al. 2019), and looked at the impact of global trade and climate change of food and nutrition (Ge et al. 2021).
We use a previously developed ABM of food choice that has been used to investigate and reproduce historic UK milk consumption trends (Gibson et al. 2021). Here, we update the model and apply it to a forward-looking analysis of UK dairy and plant-based milk consumption. This ABM uses the conception of food choice influences from Chen & Antonelli (2020) incorporating aspects from each of food-related features, individual differences, and society-related features. Specifically, price (Andreyeva et al. 2010; Annunziata & Scarpato 2014; Baudry et al. 2017; Hoek et al. 2017), health (Kang et al. 2015; Verain et al. 2017), environmental/sustainability concerns (Ricci et al. 2018; Verain et al. 2015, 2016, 2017), habit (van’t Riet et al. 2011), and social influence (Cruwys et al. 2015; Higgs & Thomas 2016; Pachucki et al. 2011). Drawing on and operationalising empirical survey data, agents differ in the basic values they hold and the relative importance they ascribe to these different food choice influences.
Model Description
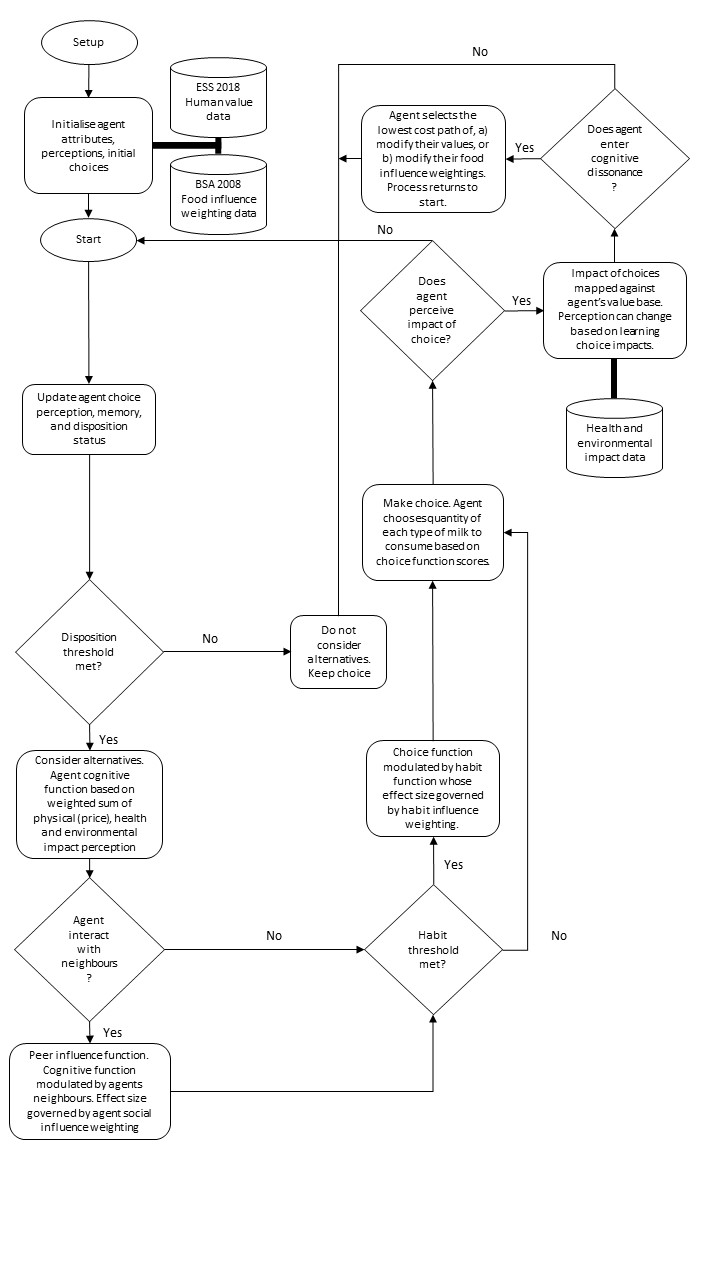
The core agent-based model that we update and apply in this study was developed in Gibson et al. (2021) using the ODD (Overview, Design concepts, Details) protocol, a de-facto standard for documenting agent-based models (Grimm et al. 2006, 2010, 2020). Here, we focus on the aspects of model development and other specific elements of relevance, but provide additional details in Appendix B. The framework for agent decision-making is given in Figure 1.
Overview
Purpose
The model’s overall objective is to produce consumption trajectories from 2020 out to 2050 for dairy and plant-based milks (PBM). It does this by modelling individual-level preferences and food influences (informed by both theoretical grounding and empirical data) across physical, health and environmental perceptions, habit, social influence and the active evaluation of prior-choice. These future consumption curves (reported in average ml of milk per person per week) are directed, through parameter calibration via optimisation, to try and meet dairy reduction targets posed by UK bodies for 2030 and 2050. Specifically, the study performs simulation experiments to assess and compare six different milk consumption scenarios that are distinguished by differing model assumptions and target level.
Agents, state variables, scale
Agents represent consumers that each have a disposition to consider (or not) their milk consumption choices. Agents construct a cognitive choice function for dairy and PBM, comprised of the perceived physical (modelled as price), health and environmental characterises of each choice. These are computed at each time step of the simulation, and are modified by other food influences (habit, social influence) and choice evaluation, each governed by individual sub-models. The relative importance that agents ascribe to the physical, health, environmental, habit and social influences is determined by empirical data operationalised from the British Social Attitudes (BSA) 2008 survey (National Centre for Social Research 2010). The use of survey data to construct agent characteristics is a common approach in agent-based modelling. For example, Scalco et al. (2019) also use BSA data in their study of UK meat consumption, and Khademi et al. (2018) use the California Health Interview Survey to inform their ABM of health-eating in Los Angeles. Upon an agent becoming ‘disposed’, the quantity of each milk option is apportioned according to the relative size of each total choice function.
Agents have an existing choice mirroring the average consumption levels of dairy and plant-based milks in 2019, and form a social network. Social influence is stochastic, occurring as a function of interaction probability, modulated by the relative importance an agent places on social influence in food, derived from the BSA 2008 survey data.
Process overview and scheduling
At each model run, 1,000 agents are created (see Figures 7- 9 in Appendix A for an exploration of different agent population size and resampling of agent attributes from survey data), initialised with an incumbent choice, reflecting the consumption split between dairy milk and PBM in 2019, and randomly linked with other agents in a network (see social influence sub model). Agents construct a choice function based on perceived information about milk characteristics, employing memory effects to draw on information perceived in previous time steps. Other food influence factors; habit, social influence, and the evaluation of choice, all impact the final choice functions. The quantity of each type of milk consumed is calculated at each time-step (annually from 2020 to 2050), based on total choice function scores (see next section for details).
Design concepts
Basic principles
The basic structure of agent decision-making is given by the process flow diagram in Figure 1. In brief: agents perceive physical, health and environmental characteristics of each milk choice; agents are then triggered (or not) to enter a state of disposition to consider their milk options; a quantified choice function is calculated for each option, comprised of the perceived characteristics and modified by habit and social influence; agents may evaluate their choice and inform future decisions based on internal consistency between the impact of their choices and the human values they hold.
The key functions that act upon agent choice are described in the sub-model section. Table 1 gives the parameters that operate within the model, a more detailed description of which is provided in Appendix A (Table 4).
| Parameter | Sub-model | Dynamic | Range |
|---|---|---|---|
| 1. Memory length | Cognitive perception | No | [1,10] |
| 2. Habit threshold | Habit | No | [1,10] |
| 3. Probability of interacting | Social influence | No | [0,1] |
| 4. Initial habit of incumbent | Habit | No | [0,10] |
| 5. Social blindness | Evaluation | No | [0,1] |
| 6. Post-choice justification | Evaluation | No | [0,1] |
| 7. Cognitive dissonance threshold | Evaluation | No | [0,1] |
| 8. No. of neighbours | Social influence | No | [2,10] |
| 9. Perception of health impact of PBM | Cognitive perception | Yes | [1,3] |
| 10. Perception of environmental impact of PBM | Cognitive perception | Yes | [1,3] |
| 11. Gradient of probability disposition | Disposition | No | [14,16] |
| 12. Perception of health impact of dairy | Cognitive perception | Yes | [1,3] |
| 13. Perception of environmental impact of dairy | Cognitive perception | Yes | [1,3] |
At each time-step, the milk consumption of agents that are ‘disposed’ to consider their choices is given by the relative proportion of each option’s choice function of the total summed choice function, multiplied by the total milk consumption. For instance, if dairy and PBM have the same choice function value, an agent will consume 50% of the total available milk (expressed as ml per person per week) for each choice. Agents that are not in a state of disposition at a given time-step repeat their previous choice and milk consumption.
In the model, total average weekly consumption was maintained at 2019 levels over the simulation period out to 2050. This was because we were primarily concerned with product substitution rather than absolute decrease in consumption. However, this is a clear motivation for future work, and as a starting point, Figure 6 in Appendix A shows a simple extension to the scenario analysis by considering future non-constant (declining) total consumption.
Details
Implementation and initialization
The model is implemented in NetLogo 6.0.4 (Wilensky 1999), a copy of which, along with associated Python code, is available at https://www.comses.net/codebase-release/1bcb23b1-92b3-4974-bdef-11abeed3e6d3/.
Input data
Agents are initialised with basic human values (universalism and security values; Schwartz 2018, 2006, 2012) using data operationalised from UK specific responses (\(n=2,167\)) of the 2018 European Social Survey (ESS) (Norwegian Centre for Research Data 2018). The survey questions associated with these values are reproduced in Table 6 of Appendix A. Survey responses were on a six-point scale of ‘Very much like me’ to ‘Not like me at all’ and also included an additional three coding options of ‘Refusal’, ‘Don’t know’, and ‘No answer’. Specifically, we take cross-tabulated data of the two relevant question responses, weighted to account for differences in selection probability from the sampling design, and obtain the proportions that cover each of the 36 possible response combinations. A random sample of these responses is taken, equal to the number of agents modelled. Here, this was typically 1,000, which was tested with resampling and different agent population size – see Appendix A. The sample is loaded into the model and each agent is assigned a universalism and security attribute accordingly. A uniform probability distribution determines the specific number that this takes, with the six-point response scale converted into six equal sized bins between 0 and 1. E.g., an agent with a ‘Very much like me’ response will have an equal probability of scoring between 0.833 and 1.000, and so on.
Agents are also assigned a weighting for each of the main food influence categories in the model (physical, health, habit, social, environmental). These weightings are operationalised from British Social Attitude (BSA) 2008 survey data which included a series of questions on food influences, and assigned directly to agents at individual level. BSA 2008 contains 4,486 survey responses across a number of social attitude and demographic dimensions. This study was interested in the section on food influence, which contained 19 direct influences (and options for ‘other’, ‘someone else decides’ and ‘no particular’ influence). Responses were recorded as either 1 (having an influence), 0 (not having an influence), or -2 (did not answer). After removing null responses (-2 values), 2,238 responses remained, of which 1,000 were randomly sampled for inclusion in the model to directly represent agent influences (as with ESS, multiple samples were tested at 1,000 and different samples sizes were drawn - see Appendix A). The 19 different influences were assigned to one of five most closely aligned categories (physical, habit, health, social, environmental), and then each category was scaled, so that categories had the same total representation, summed and converted into a proportion of the total summed influence. The mean weights across the sample were: physical = 0.344, habit = 0.214, health = 0.204, social = 0.123, environmental = 0.116. See Table 5 in Appendix A for details of the BSA survey questions.
Sub-models
Disposition
Gibson et al. (2021) compare two mechanisms of disposition, a threshold-based, and a probability-based approach. From that study, it was found that the latter performed better in reproducing observed macro level data of historic milk consumption. And so, here, we opt to employ the same probability-based disposition approach, which itself was influenced by previous studies modelling agent disposition dynamics in social networks (Galán et al. 2012; Wang et al. 2017). The probability to become disposed to consider milk choice options is based on how alike an agent’s neighbour choices are, and uses information entropy to calculate maximum and minimum ‘alikeness’. Equation 1 expresses this disposition function:
| \[ p(disposition) = \frac{1}{1+exp(-k(\frac{h}{h_{max}}-0.5))}\] | \[(1)\] |
| \[ h = -(\frac{f_{dairy}}{f_{all}}) log_{2}(\frac{f_{dairy}}{f_{all}}) + (-(\frac{f_{PBM}}{f_{all}}) log_{2}(\frac{f_{PBM}}{f_{all}}))\] | \[(2)\] |
Cognitive perception
The cognitive perception sub-model represents how information regarding different milk choice characteristics are perceived by agents. Central to this are the calibrated health and environmental perception parameters, the value of which is varied to reflect its non-constant nature. I.e. perception of something can change with time, space, context, and of course different individuals. Values are drawn from a normal distribution, where the means of these distributions are determined by the perception parameters, with standard deviation of 0.1. A normal, rather than say a uniform, distribution is chosen as it gives a higher and symmetric probability of producing a value close to the calibrated mean, while still allowing the chance of values to deviate strongly from this.
For scenarios that consider current and organic pricing, means are taken directly from a fixed value representing the relative price relationship between dairy and PBM. Price data on PBM and organic dairy was collected online (in November 2021 via manual means) from publicly available data from three major UK supermarkets (Tesco, Sainsbury’s, Morrisons). Average prices for conventional dairy milk were calculated from UK Family Food Survey 2017/18 data. Mean values were; 164p/l for PBM, 106p/l for organic dairy, and 60p/l for conventional dairy. Note, prices for PBM and organic milk were simple averages and not weighted by product volume sold.
These prices were operationalised so as to enable adequate inclusion in the cognitive function. Here, a larger price is a negative characteristic, and the model treats overall choice as a positive sum of all the different influences. The PBM price was set at 1 (most expensive, therefore lowest score) and the price multiplier between PBM and current conventional milk or organic milk was assigned to these options accordingly. This resulted in a value of 2.72 for current conventional milk, and 1.55 for organic milk. That is to say, PBM is 2.72 times more expensive than conventional milk, but this is represented as a positive ‘bonus’ for dairy. This may not be the optimal approach if we were concerned with more granular realism, but for the purposes of this study, this abstraction was deemed a reasonable proxy.
The cognitive choice function (Equation 3) is comprised of the three modelled milk characteristics, weighted by the relative importance placed on it (out of the five influence categories assessed).
| \[ f(cog.) = \beta_{phy} (physical) + \beta_{hel} (health) + \beta_{env} (environmental)\] | \[(3)\] |
Environmental concern
In this function, exogenous changes to agent environmental-based choice influence are modelled. It consists of two variables: a probability of occurrence, and a magnitude of effect. The two different approaches that scenarios S5 and S6 test are constructed from YouGov weekly/monthly public concern issue tracker data (YouGov 2021). Here, we approximate the longitudinal change in UK public environmental concern (given as a % of people that rank ‘environment’ as a top issue) as the size of potential percentage change in environmental weighting of milk choice influence (\(\beta_{env}\) from Equation 3). This percentage change in weighting is added to an agent’s existing environmental weight, and subtracted from its physical (price) weight (\(\beta_{phy}\)). This ensures that the total influence weighting remains equal to 1, with the model controlling for any weight values that would be outside of the 0 to 1 range.
In the case of scenario S5, the probability of a shock occurring was based on the instances of clear and discrete concern spikes that have occurred over the data range (2010-2021). Over this 12-year period, three such instances occurred, that coincided with the severe UK flooding of 2014, Extinction Rebellion protests in 2019, and the start of COP26 in November 2021. From this, concern shocks were approximated as having a 3/12 or 25% chance of occurring on any given time-step in the model. The size of this effect was given by the average percentage change in concern between the start of a year and the point at which a spike occurred, which was calculated at 15%. If a concern shock occurs, the new agent influence weights feed through the model and agents make choices based on these updated values. At the end of the decision-making process and time-step (year), this effect is reversed to mimic the temporary nature of such concern shocks.
Scenario S6 follows a similar procedure, however, the probability is set a 1, to reflect the continuous nature of increasing concern. The size of this effect was modelled as the total annualized observed change in concern from 2010 to December 2021 (latest tracker data). To account for unequal distribution of tracker data, an effective daily value was calculated that was then annualized to give 1.65%.
Habit
In the model from Gibson et al. (2021), habit was treated as a multiplier to subsequent choice function scores that had repeatedly returned the highest value of the options available. That is, if a choice function of a given milk option consistently scored higher than the other option, eventually the habit bonus would trigger, further entrenching this option. We take the same form of this habit function, i.e., the empirical function of habit formulation from Lally et al. (2010) however, in this study it was applied slightly differently. Here, it was additive rather than a multiplier, to ensure internal consistency with how the other four influence categories are modelled (physical, health, environmental and social). That is, a mixed additive and multiplicative weight and influence construct could yield disproportionate weight effects to their values. For instance, if one weight is added but another multiplied, this could increase or decrease their relative contribution, deviating from their assigned proportions. And so, to avoid this we followed a wholly additive approach. Further, its total impact is modulated by the weighting a given agent ascribes to the influence of habit on food choice. This is detailed by the following equation:
| \[ f(habit) = \beta_{hab}(peak \; habit - exp(-0.042(consecutive \; choices - habit \; threshold)))\] | \[(4)\] |
Social influence
This sub-model represents the process of how agents influence, and are influenced by, other agents in their network (modelled as a small-world network Watts & Strogatz 1998), referred to here as an agent’s neighbours. Note, this does not represent ‘neighbours’ in the strict geographical sense, but is inclusive of broad social interaction (e.g. family, friends, within households, local environment). The total number of nodes on the network is equal to the agent population. Each agent is initially connected to a number of neighbours set by the ‘network-parameter’, which can take an even integer value between 2 and 10. The rewiring probability is set at 0.1. Social networks also exhibit scale-free characteristics, and so a small-world scale-free network would perhaps give a more realistic representation. However, this network type is not available among the core set of NetLogo network extensions, which we acknowledge as a limitation of the study.
This study adapts the original formalism of social influence employed by Gibson et al. (2021). As with the original model, an agent has a probability of interacting, where influence is modelled as the mean set of choice functions across its neighbour network. However, instead of a free parameter that was termed ‘social susceptibility’, the extent of this neighbour influence is governed by the weighting an agent ascribes to social food influence (operationalised from BSA 2008 survey data). This is represented by the following equation:
| \[ f(social) = \beta_{soc}f(cog.)_{mean \; neighbour}\] | \[(5)\] |
Total choice function
The total choice function for each option is then given by the weighted sum of each influence component, expressed by the following equation:
| \[\begin{aligned} \begin{split} f(total) = & f(cog.) + f(habit) + f(social) \\ = & \beta_{phy}(physical) + \beta_{hel}(health) + \beta_{env}(environmental) \\ + & \beta_{hab}(peak \; habit - exp(-0.042(consecutive \; choices - habit \; threshold))) \\ + & \beta_{soc} f(cog.)_{mean \; neighbour} \end{split}\end{aligned}\] | \[(6)\] |
Evaluation
Agents have the opportunity to evaluate, learn from, and inform their future milk choices. This function remains largely intact from Gibson et al. (2021), employing a conceptualisation of cognitive dissonance between an agent’s human values (from ESS 2018 survey data) and the impact of their milk choice behaviour (see Table 2). The minor update in this study is that agents now also look to minimise or escape a state of cognitive dissonance by altering the weight (10% per time-step) they ascribe to health and environmental components versus physical (price) aspects. This is an effort to further draw on the empirical data from BSA 2008.
| Milk (per litre) | Sugar (g) | Sat. Fat. (g) | Protein (g) | GHG (kg\(CO_{2}\)eq) | Land Use (\(m^{2}\)) | Water Use (L) |
|---|---|---|---|---|---|---|
| Dairy milk | 50.32 | 9.78 | 36.81 | 1.12 | 9.00 | 628.00 |
| Plant-based milk | 31.99 | 1.96 | 13.75 | 0.85 | 0.64 | 174.73 |
Simulation Experiments, Calibration and Analysis
Scenarios and simulation experiments
The overall objective was to assess, through two sets of simulation experiments, the feasibility of possible UK milk consumption trajectories out to 2050 under different scenarios and target levels. A backcasting-type approach was followed, whereby scenario parameters were calibrated (see next section) to try and produce ‘desired’ dairy reduction targets posed by the UK’s CCC and Eating Better alliance. The first set of experiments explored rising dairy milk prices, the second looked at how increasing environmental concern may reduce dairy milk and increase PBM. Specifically, six scenarios (see Table 2) were constructed that looked at: a) different price combinations (current and organic dairy pricing); and b) different mechanisms of changing the influence of environmental concern in food choice. These scenarios were considered under different levels of target ambition (the CCC’s core targets of 20% less dairy by 2030 and 35% by 2050; and extension targets of 50% by 2050, along with the Eating Better alliance’s more ambitious 50% by 2030).
The six different scenarios are as follows: S1, which most closely resembles a baseline, looks at a current price relationship between dairy and PBM, with targets of 20% less dairy by 2030 and 35% by 2050; S2 instead considers rising dairy prices set at average organic levels, again with targets of 20% less dairy by 2030 and 35% by 2050; S3 and S4 repeat these price relationships but look at the more ambitious targets of 50% by 2030 and 50% by 2050. These four scenarios do not explicitly consider significant changes to the environmental concern basis of agent food choice, beyond the modelling of influence weights and individual values endogenous to the ABM. That is, the ABM represents the relative influence of different food choice aspects as heterogenous weightings drawn from survey data. These weightings can then dynamically change based on an agent’s individual values and the choices they make.
However, in scenarios S5 and S6, this agent-focused individual-level function remains, but an exogenous ‘societal-wide’ factor to change environmental concern is introduced and tested. In scenario S5, this is represented by a stochastic intense ‘shock’ that temporally shifts agent’s choice influence weighting toward environmental concern. Scenario S6 has a different representation, looking at a smaller, incremental but sustained, increase toward greater environmentally weighted influence. More details are given in the Model Description and ‘Environmental concern’ sub-model sections. All scenarios and model runs had the same initial conditions of 1,000 agents, average dairy milk of 1395.80ml and PBM of 68.92ml per person per week, which ran at yearly intervals from 2020 to 2050. Parameter values and ranges are those given in Table 1 of the Model Description section.
| Scenario | Pricing | Environmental concern | Target |
|---|---|---|---|
| S1 | Current | Endogenous, individual agent values | CCC core: 20% less dairy by 2030 and 35% less dairy by 2050 |
| S2 | Organic | Endogenous, individual agent values | CCC core: 20% less dairy by 2030 and 35% less dairy by 2050 |
| S3 | Current | Endogenous, individual agent values | Eat Better: 50% by 2030 or CCC extension: 50% by 2050 |
| S4 | Organic | Endogenous, individual agent values | Eat Better: 50% by 2030 or CCC extension: 50% by 2050 |
| S5 | Current | Exogenous, stochastic ‘shock’ and decay of concern | CCC core: 20% less dairy by 2030 and 35% less dairy by 2050 |
| S6 | Current | Exogenous, sustained and incremental increase to concern | CCC core: 20% less dairy by 2030 and 35% less dairy by 2050 |
Calibration and uncertainty analysis
Calibration was performed for each scenario over the bounded range of parameters (see Table 1). The optimisation exercise tried to minimise the absolute difference between the simulated consumption levels from scenario outputs with that inferred by the target level at 2030 or 2050. That is, a set of model parameters were calibrated at the micro level to give macro level consumption outputs that tried to meet UK dairy reduction targets. The general computational technique follows that employed in Gibson et al. (2021), and is summarised briefly here. An optimisation exercise based on an evolutionary algorithm (EA) (Python’s DEAP package) first generated a population of parameter sets (\(n=75\)), sampled using a uniform distribution over each parameter’s bounded range. The EA then started an ‘evolutionary loop’ on this population, producing children (\(n=75\)), evaluating the fitness of both population and children, and then selecting (\(n=75\)) the most fit candidates to become the population of the next generation. The loop ran for 20 generations. The fitness criteria were the minimisation of the absolute difference between the simulation output and target consumption level at 2030 and 2050. Given the bi-objective nature of the optimisation, the EA produced a pareto-front of \(n\) candidate parameter sets for further evaluation. Owing to time and resource constraints, we did not conduct hyperparameter optimisation or ‘tuning’ of the EA process (i.e. through grid search or even another genetic algorithm). Initial conditions were set at 1,000 agents, with a starting average dairy milk consumption of 1395.80ml and PBM consumption of 68.92ml per person per week, which ran at yearly intervals from 2020 to 2050.
From these results, uncertainty analysis was conducted to simulate model outputs (milk consumption curves). Saltelli sampling was used to generate parameter values over a 2% range of the calibrated parameter sets for each scenario. Sample size was given by the expression \(n(2p +2)\), where \(n\) is the baseline sample and \(p\) the number of model parameters. Following the general sample size adopted in Gibson et al. (2021) we sample and run each parameter set 308 times. To assess the appropriateness of this value, i.e. is it under, over, or adequately specified, we calculate the required sample size using a confidence interval approach set out by Byrne (2013). Here, sample size is given by the expression \((z_{\frac{\alpha}{2}}*CV/w)^{2}\) where \(z_{\frac{\alpha}{2}}\), the standard normal, is 2.576 for 99% confidence, CV is the coefficient of variation, and w is the target confidence interval width expressed as a proportion of the mean, and set at 0.015. This expression is applied at each time-step from 2020 to 2050 for both dairy and plant-based milk simulation output. Calculated sample sizes were as follows: dairy (\(mean = 62\), \(max = 101\)), plant-based (\(mean = 307\), \(max = 470\)). From this, the initial sample size of 308 is deemed a reasonable number, being comparable to the mean across plant-based simulation results, and significantly larger than the requirements for dairy. Each of these sample parameter sets were run by the model from 2020 to 2050, and the outputs and performance compared against target levels.
Sensitivity analysis
Temporal global variance-based sensitivity analysis (TGVSA) was performed on the most representative (closet to the mean) PBM model run for each scenarios S1-S4. Scenarios S5 and S6 used the calibrated parameters from S1 and were not considered in the sensitivity analysis. Sample size (\(n=1,064\)) followed the minimum threshold set out in Gan et al. (2014), drawn over a 2% range of the central value. Continuous TGVSA was computationally prohibitive, and so six time-step instances (2025, 2030, 2035, 2040, 2045, 250) were selected. Python’s SALib package (Herman & Usher 2017) was used to conduct Sobol analysis with Saltelli sampling to assess the relative contribution of each parameter to total sample variance. Variance based sensitivity methods such as this can in principle fully decompose output variance due to model parameters and all combinations of interaction. However, quantifying specific higher order sensitivity indices (e.g., second and third) is computationally expensive and researchers typically limit analysis to a quantification of first-order (S) and total-order (ST) (Saltelli et al. 2010). ST can be thought of giving an aggregate of all variance, and if S is known, then a synthetic value of all higher-order effects (interactions) can be calculated. Further, this approach is capable of dealing with non-linearity, which is common to these types of models.
Other experimental designs for global sensitivity analysis of multiple parameters are available (e.g., linear models, fractional factorial, Latin Hypercube Sampling (LHS)). Linear models and fractional factorial methods are not generally appropriate for models with nonlinear effects (Saltelli et al. 2008). LHS would have been a possible approach, but we opt for the extended Sobol’ due to its coverage of the parameter space (for S and ST) in as fewest samples as possible. In this sense it has been regarded as superior to LHS (Kucherenko et al. 2015; Ligmann-Zielinska et al. 2014; Walzberg et al. 2021). Results of the analysis are shown in Figure 5 in Appendix A.
Results
Calibration
Thirteen parameters were calibrated against objective functions that looked to minimise the absolute difference between reduction target and simulated milk consumption level for the given target year. That is, each parameter was not individually calibrated but rather, calibration was performed on the model output resulting from parameter values. An optimization approach via evolutionary algorithm was employed to conduct the calibration exercise. Table 3 shows a summary of the calibration results for each scenario and the number of parameter sets produced.
| Parameter | S1, S5, S6 (n=8) | S2 (n=15) | S3 (n=1) | S4 (n=1) |
| 1. Memory length | 4.87 (1.07) |
5.72 (1.99) |
a 8.03 b 7.90 |
a 9.69 b.7.06 |
| 2. Habit threshold | 5.81 (1.99) |
4.08 (1.69) |
a 5.48 b 7.64 |
a 9.64 b 9.19 |
| 3. Probability of interacting | 0.33 (0.04) |
0.31 (0.26) |
a 0.77 b 0.17 |
a 0.93 b 0.95 |
| 4. Initial habit of incumbent | 6.70 (1.59) |
3.47 (3.50) |
a 8.64 b 4.09 |
a 3.76 b 8.49 |
| 5. Social blindness | 0.98 (0.02) |
0.62 (0.16) |
a 0.73 b 0.92 |
a 0.58b b 0.93 |
| 6. Post-choice justification | 0.56 (0.20) |
0.50 (0.31) |
a 0.94 b 0.37 |
a 0.46 b 1.00 |
| 7. Cognitive dissonance threshold | 0.48 (0.31) |
0.36 (0.14) |
a 0.50 b 0.64 |
a 0.84 b 0.48 |
| 8. No. of neighbours | 9.29 (0.24) |
7.67 (2.49) |
a 4.91 b 8.23 |
a 4.13 b 7.79 |
| 9. Perception of health impact of PBM | 2.50 (0.34) |
1.45 (0.29) |
a 2.961 b 2.941 |
a 2.981 b 2.981 |
| 10. Perception of environmental impact of PBM | 2.47 (0.10) |
1.77 (0.39) |
a 2.982 b 2.872 |
a 2.642 b 2.932 |
| 11. Gradient of probability disposition | 14.65 (0.27) |
14.60 (0.29) |
a 14.20 b 14.73 |
a 14.49 b 14.18 |
| 12. Perception of health impact of dairy | 2.58 (0.25) |
2.05 (0.63) |
a 1.882 b 1.091 |
a 1.142 b 1.571 |
| 13. Perception of environmental impact of dairy | 2.62 (0.03) |
2.36 (0.46) |
a 1.882 b 1.062 |
a 1.022 b 1.372 |
Scenarios S5 and S6 used the calibration results from S1 (Table 2). Mean values and standard deviation (in parenthesis) of calibrated parameter sets are shown for the bi-objective (multi-target) optimisation scenarios (S1,S2,S5,S6). Under S3-S4, ‘a’ is the result of the 2030 target and ‘b’ refers to the 2050 objective target level.
Comparing parameters 9,10 and 12,13 for scenarios S3-S4 (highlighted 1 and 2 in the table), shows that calibrating for a 50% consumption reduction level generally produced a highly favourable perception of PBM relative to dairy for health and environmental impact. Care must be taken when interpreting these calibration results. Summarising multiple different parameter sets has its limitations in that mean values within, and across, scenarios are not directly comparable due to heterogeneity across sets and some parameter dependence. Further, as with many agent-based models, the interactions between parameters are often more influential than the parameter values themselves.
Simulation Experiments
Increasing dairy milk price
Figure 2 shows simulated dairy milk (navy lines) and PBM (pink lines) consumption from 2020 to 2050 for each parameter set of each scenario. Historic consumption is plotted from 2010 to 2019. Target levels are shown for a 20% reduction by 2030 (solid black line), 35% reduction by 2050 (dashed black line), and 50% reduction level (dash-dot black line). For scenarios S3 and S4 (bottom row), both the 2030 (navy and pink) and 2050 (dark and light grey) target results are shown. The left-hand side shows results of milk pricing represented at current levels, the right-hand side considers if all dairy were priced organically and PBM remained constant.
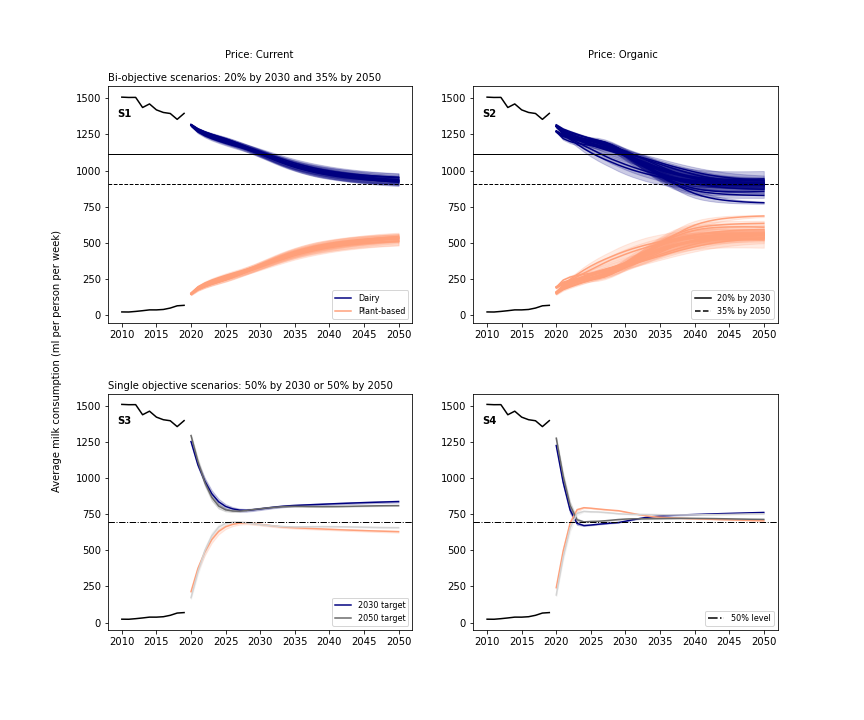
Overall, the calibration-optimisation exercises succeeded in generating parameter sets that were able to produce model runs in the region of the desired target level. Figure 3 explores this in more detail. Scenarios S1-S2 show consumption patterns that offer reasonable trajectories for dairy milk reduction (with concomitant increases in PBM). This contrasts with the results of S3-S4 which display a rapid decrease in dairy (and rise in PBM), and then a plateau from around 2025 onwards. The rate of change produced by these results to achieve either the 50% by 2030 or 2050 target would appear implausible, though not impossible.
Figure 3 shows a one-dimensional heatmap of the distribution of scenario runs that surpassed or failed their respective target. The central red line indicates this target (the ‘zero’ line) for each of the four scenarios in this simulation experiment. To the left of the red line are scenario runs that ‘surpassed’ the dairy reduction target (i.e., resulted in a consumption level below that of the target for the given year). To the right are scenario runs that ‘failed’ to meet the target (i.e., resulted in a consumption level above that of the target for a given year). The percentage and absolute number of scenario simulation runs that met the target are shown for each heatmap. Note, scenarios have different total numbers of runs as the target optimisation calibration analysis produced multiple candidate parameter sets. Figure 3a shows this for one ‘half’ of the bi-objective target exercise – 20% reduction in dairy by 2030. Figure 3b shows the other ‘half’ of this – 35% reduction by 2050. Figure 3c shows the results of a more ambitious 50% reduction by 2030, and Figure 3d shows this same target level for 2050. For Figures 3c and 3d, single target optimisation calibration was conducted, producing a single parameter set. As a result, they have fewer total runs.
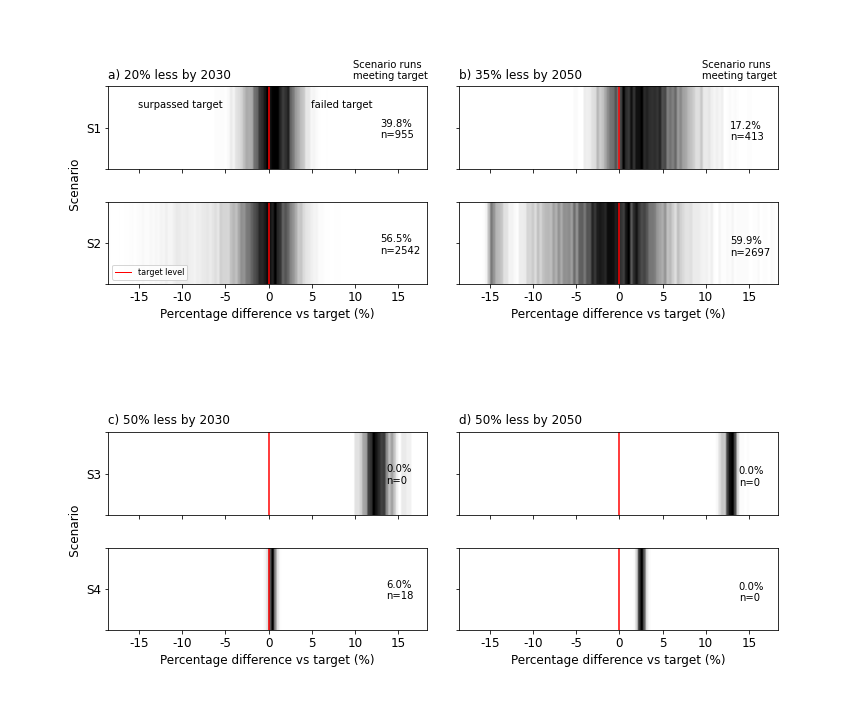
Scenario S2, where relative pricing was fixed at organic dairy to PBM levels (106p/l for organic vs 60p/l for conventional and 164p/l for PBM), produced significantly higher proportion of successful runs than S1 (current conventional pricing). Here, the rise in average dairy pricing lead to an increase in ‘successful’ runs of 39.8% to 56.5% for 2030 and 17.2% to 59.9% for 2050. Scenarios (S3-S4) that looked at more ambitious targets (50% by 2030 or 2050) mostly failed to meet or surpass the reduction level. Scenario S3 (current pricing) in particular did not produce a set of calibrated parameters that would give the required target level. However, S4 was close to this threshold, an expected result given this was the output of a single-objective optimisation exercise.
Shifting environmental concern
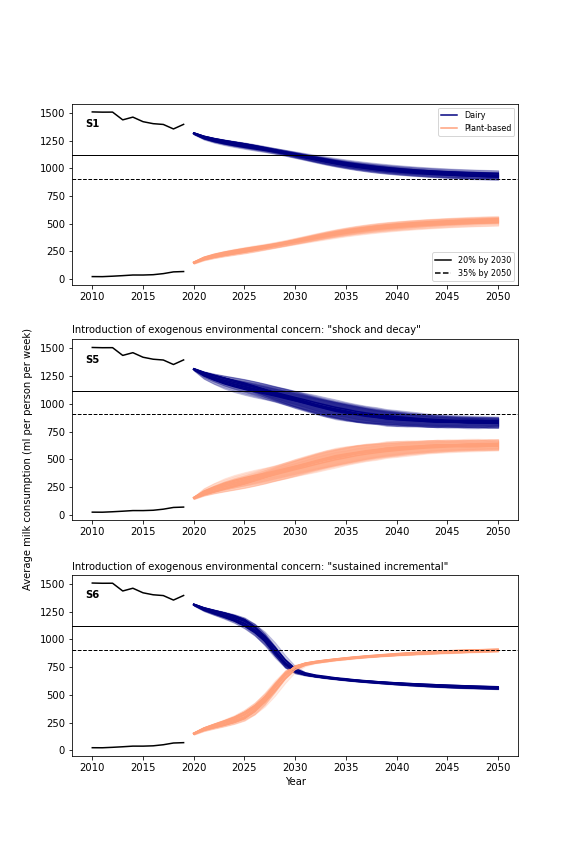
Figure 4 shows the output of scenarios that explored two different mechanisms of change to the environmental weighting of milk choice. Scenario S1 (same as in Figure 2) is given for comparison. Scenario S5 and S6 take the same calibrated parameter sets as S1 and simulate consumption curves to test the impact of each of these mechanisms. The first, S5, modelled temporary random environmental concern shocks, while S6 modelled a sustained, incremental and permanent shift toward greater environmental based milk choice influence.
Compared with S1, simulation outputs for S5 and S6 resulted in a larger decrease in dairy milk consumption (and higher uptake of plant-based milk). However, when comparing S5 and S6, the latter shows a markedly different output, with PBM surpassing dairy milk consumption at around 2030 and 100% of model runs hitting 2030 and 2050 targets from the CCC.
Discussion
Overall, scenarios produced plausible consumption trajectories for the core Climate Change Committee target dairy reduction levels of 20% by 2030 and 35% by 2050. Both sets of experiments, rising dairy milk prices (to organic levels) relative to plant-based alternatives, and changes to environmental concern, resulted in larger decreases in dairy consumption than the baseline scenario S1. Within this, the largest impact on simulated consumption trajectories was found with the introduction of small, but permanent, incremental increases to agent environmental concern, and the impact this had on influencing milk choice. Meeting extension targets of 50% dairy reduction by 2030 or 2050 (S3 and S4) appeared more difficult to achieve, with simulation trajectories that, on the face of it, would seem challenging to reproduce in the real-world.
Scenario S1, which most closely resembles a current baseline, did not produce a majority of runs that met 2030 and 2050 targets (just 39.8% and 17.2% respectively). As a reminder, scenario S1 contained the core ABM decision-making and influence functions that govern model milk choice. These consist of: cognitive perception of impact, social influence, habit, and choice evaluation, i.e. internal individual-agent factors that determine consumption options and the observed calibrated substitution curves. S1 did not include the two external factors tested in the experiments. In other words, absent of the explicit price changes and environmental-concern shifting interventions tested by this study, model simulations did not overwhelmingly deliver the CCC’s base case dairy reduction targets. However, all things being equal, representing all dairy milk at average organic prices (S2) showed a marked increase in successful model runs hitting, or surpassing, target levels. In this scenario, 56.5% of runs met a 20% reduction by 2030 target, and 59.9% met the 2050 target (35% reduction). Clearly, the wider land and sustainability impacts of shifting UK milk to 100% organic has not been explored here, however, we use ‘organic pricing’ as an indicator of the more reflective actual costs of dairy milk (in the absence of robust, but emerging, true cost accounting). An implication for policy should be to consider how pricing structures can be used to motivate reduction of dairy consumption and uptake of PBM.
Scenarios (S3 and S4) were largely unable to produce a set of simulations that met the more ambitious targets of 50% by either 2030 or 2050. This was particularly the case of S3, which could have implications for the feasibility of achieving deep shifts to sustainable diets in the absence of clear interventions. While scenario S4 also largely failed to meet the stated targets, it was, however, far closer, and these results demand more considered interpretation. Unlike scenarios S1 and S2 that conducted bi-objective optimisation, this set of scenarios produced a single set of parameters and therefore had less heterogeneity and uncertainty to explore. It is entirely possible that calibrating via single-objective optimisation could produce a lower (even more ambitious) target. If the metric for performance is relaxed, we see that almost all of these runs are less than 3% short of their target level.
Scenarios S5 and S6 looked at how the introduction of random temporary shocks, or, smaller but sustained increases to agent environmental concern, may impact milk choice and consumption. Shocks to environmental concern with the UK public have occurred in response to severe discrete weather events, as was the case for the 2014 floods, or more recently, due to increased societal visibility and attention to climate change (Extinction Rebellion (XR) and COP26). However, environmental concern receded rapidly post-flood in 2014, and concern just after COP26 had a 10% negative swing after reaching historic highs of 40%. The spike caused by XR protests did not fully revert to pre-protest levels until the onset of COVID-19 in early 2020, where health issues overwhelmingly topped the data. In general, UK public environmental concern remained stable at around 10% from 2010 to 2018. From October 2018 (perhaps a response to the IPCC’s SR15 being released) to date, concern has trended upwards, and is now at around 30%.
In modelling these different observed public concern phenomena, via agent milk choice influence, we show that both produced larger declines in dairy milk consumption than the S1 base scenario. However, even with a significant and rapid rise in concern, the transient nature of shocks did not fundamentally alter the emergent consumption pattern. In contrast, small, incremental but permanent increases to concern produced markedly different consumption profiles, with dairy and PBM curves actually crossing over in 2030 before plateauing from 2040. While recognising that transformative change toward sustainable food systems requires fundamental, structural, measures that go beyond individual behaviour, there are nevertheless implications here for a shift toward more sustainable diets. One way to engender sustained and increasing change is a self-sustaining environmental information ecosystem where policy, responsible media, communities, and everyday lived experience act to mutually reinforce meaningful concern among the public.
Continuous improvement of both ABM modelling efforts and studies is key to the wider development of the ABM community, and its contribution to science, policy and practice. Giabbanelli et al. (2021) conduct a review of ABMs on obesity, and offer a checklist with which to appraise their quality. The checklist covers five dimensions (data, parameters, sensitivity, validation, documentation and reproducibility) that cover a total of 29 items. The authors construct three tiers (T1 - best, T2, T3 - worst) based on how a given study performs against each of these items.
Overall, the model scored mostly T1s, but had two T2s (recent data, free parameters) and two T3s (model design sensitivity analysis, comparing outputs of validation) (see Table 6 in Appendix A for results). The four items that score less than T1 are briefly discussed. Recent data – BSA survey data is from 2008, which would qualify as T3, however, ESS, price and impact data are all from the last 5 years which would qualify as T1, and so, we score this element as T2. Free parameters – all parameters are detailed, but the study has not attempted to minimized the number of free parameters. Model design sensitivity analysis – sensitivity to model design is an important aspect of model investigation and analysis. Although we do not conduct such an analysis here, we do acknowledge that the model would benefit from this kind of robustness analysis and signpost this as an important avenue of future work. Comparing outputs of validation – it is challenging to validate against data given a forward-looking scenario-based study, however, the base model on which the ABM is developed was validated against historic observed data. Some of these limitations are discussed in more detail in the following section.
Limitations and future research
Here, some study limitations, as well as opportunities for future research, are briefly described. A central interest of the study was to analyse possible influences and dynamics for the reduction in dairy milk by substitution for plant-based alternatives. Although overall milk consumption has declined for several years, in the model, total average weekly consumption was maintained exogenously at 2019 levels over the simulation period out to 2050. Future research could look to incorporate scenarios that looked at substitution along with declining consumption, and assess their interaction and relative impact on overall reduction trajectories (we give an initial exploration of this in Figure 6 in Appendix A).
The underlying data to construct PBM health and environmental impact is based on a weighted average of the market share of the three most widely consumed plant-based milks in 2019; soya (38%), almond (42%) and oat (20%) (Kantar 2019). The model does not account for a changing market share (e.g., increase in oat milk) or the emergence of new entrants (e.g. potato milk). Future research could look to disaggregate these different plant-based alternatives and include them as distinct options (with their own health, environmental and physical characteristics) in the ABM.
Data used to give some empirical grounding to agent influence weightings was from 2008. To the authors knowledge, this is still the latest and most comprehensive set of survey data for UK public food influences, however, at over a decade old, it is likely that these influences have at least in part shifted. This is somewhat mitigated by a model structure that allows agents to change their influence weights in response to cognitive dissonance or external triggers. However, given the increasing focus on food systems, diets and sustainability, it would be beneficial for an updated survey to be included in the next iteration of British Social Attitudes, or similar large-scale survey.
Finally, although building on an existing ABM calibrated to historic consumption of UK whole and semi/skimmed milk, this model is still by necessity only one representation of food consumption influence. Future research and modelling efforts should assess, with rigorous robustness analysis, model choices and structure.
Conclusion
Dietary shift toward lower meat and dairy consumption is a critical lever to mitigate climate change and address wider socio-ecological challenges. Recognising this, various UK bodies (e.g., the Climate Change Committee) have posed dairy reduction targets for 2030 and 2050. This study updated and applied an existing ABM of UK milk choice to analyse scenarios for dairy consumption reduction targets, with concomitant increases in plant-based milks.
Specifically: it enhanced empirical grounding with the introduction and operationalisation of food influence food survey data from British Social Attitudes 2008; incorporated a set of plant-based impact data; developed different representative price relationships between dairy and PBM; and modelled different mechanisms for changes to agent environmental concern and milk choice influence.
Taking a backcasting approach, it aimed to generate and compare several different sets of parameter values and model runs, calibrated, via optimisation, to try and produce target levels of reduced dairy consumption. Two sets of simulation experiments were conducted to assess, through the lens of agent-based modelling, the feasibility of possible milk consumption trajectories out to 2050 under a) different price combinations (current and organic), b) different mechanisms for changing environmental concern (exogenous 'shock and decay', exogenous 'sustained incremental'). These simulation experiments were conducted against different levels of target ambition (UK Climate Change Committee’s (CCC) core targets of 20% less dairy by 2030 and 35% by 2050; and extension targets of 50% by 2050, along with the Eating Better alliance’s more ambitious 50% by 2030).
Key results showed that most model runs from scenarios with a dairy-PBM price relationship at today’s levels, failed to deliver the core consumption targets (60% for 2030 and over 80% for 2050. However, if all dairy milk were to be priced organically, this situation improves markedly with only around 40% of scenario model runs not meeting core 2030 and 2050 targets. Although both simulation experiments that explored environmental concern and milk choice showed larger decreases in dairy milk consumption, they produced two very different sets of results. Temporary concern ‘shocks’ did not structurally change consumption patterns, however, the introduction of small, but permanent, incremental gains to environmental concern and agent milk choice influence, actually resulted in dairy declining and falling beneath plant-based milks at around 2030.
For the more ambitious 50% targets, scenarios using a representation of today’s price relationship did not produce a single successful model run. However, organic pricing was able to almost universally achieve the 50% target level within a reasonable band of tolerance. The study highlighted several areas for future research and data needs, including: more recent, frequent, and accessible empirical data on food influences; and ABM development of specific plant-based alternatives e.g. oat, soya, almond.
This paper presented the first attempt at applying an agent-based model of food influence to future scenarios and trajectories of UK dairy and plant-based milk consumption, to achieve climate-related dietary reduction targets. From a policy perspective, successful scenarios for core CCC targets displayed plausible trajectories, and in this sense, offer supportive evidence by way of the feasibility of modelled rates-of-change. However, current price relationships between dairy and PBM may pose a barrier to achieving desired targets, and policy should consider measures to redress the imbalance of milk ‘price’ vs its social, economic and environmental ‘cost’. To support widespread adoption of sustainable diets, the UK public should experience deliberative and meaningful environmental-related information and interaction to help engender sustained positive changes to environmental concern.
Acknowledgements
The authors gratefully acknowledge the support of the Opportunities for Climate Mitigation and Sustainable Development (OPTIMISM) project NE/S012834/1.Appendix
Appendix A
Supporting tables
| Parameter | Description |
|---|---|
| 1. Memory length | The size of an agent’s memory that it can recall previous information. Cognitive perception is based on averaging |
| 2. Habit threshold | The number of consecutive choices that return the same majority milk type consumption needed before the effects of habit take place. |
| 3. Probability of interacting | The probability of an agent interacting (exchanging information on milk choice function scores) with other agents in its network. |
| 4. Initial habit of incumbent | The initial number of consecutive choices that have returned the same majority milk type. |
| 5. Social blindness | The probability that an agent has the ability to perceive the impact of its choice and therefore the option of evaluating it. |
| 6. Post-choice justification | The threshold beyond which an agent will simply justify the discrepancy between its values and behaviour (milk choice impacts), rather than act to resolve it. |
| 7. Cognitive dissonance threshold | The threshold below which any discrepancy between an agent’s values and its behaviour (milk choice impacts) will not trigger a state of cognitive dissonance. |
| 8. No. of neighbours | The number of neighbours in an agent’s network. |
| 9. Perception of health impact of PBM | The perception of the health impact of PBM. |
| 10. Perception of environmental impact of PBM | The perception of environmental impact of PBM. |
| 11. Gradient of probability disposition | The slope of the function that determines how quickly the probability of being disposed to consider choice of milk as a function of the informational entropy of milk choices in an agent’s neighbour network. |
| 12. Perception of health impact of dairy | The perception of the health impact of dairy milk. |
| 13. Perception of environmental impact of dairy | The perception of the environmental impact of dairy milk. |
| Question | Survey | Model use | |
|---|---|---|---|
| She/he strongly believes that people should care for nature. Looking after the environment is important to her/him. | European Social Survey, 2018 | This question relates to the ‘universalism’ value and responses inform the environmental value position of agents used in evaluation sub-model. | |
| It is important to him/her to live in secure surroundings. She/he avoids anything that might endanger his safety. | European Social Survey, 2018 | This question relates to the ‘security’ value which contains the health dimension. Note, the expanded 40 item PVQ includes a direct question on health, ‘She/he tries hard to avoid getting sick. Staying healthy is very important to her/him’, but in the absence of this data in the ESS, we opt for the most relevant security value question. | |
| Influence | Category | Influence | Category |
|---|---|---|---|
| Quality/freshness | Physical | What family eat | Social |
| Taste | Physical | Recommendations | Social |
| Presentation etc. | Physical | Organically produced | Environmental |
| Availability | Physical | Animal welfare | Environmental |
| Price/value/special offers | Physical | Impact/fair trade/local | Environmental |
| Healthy/low fat | Health | Impact on landscape | Environmental |
| Vegetarian/special habits | Health | Packaging amount | Environmental |
| Additives/E-numbers | Health | Other | None |
| Habit/routine | Habit | Someone else decides | None |
| Try new/different | Habit | No particular | None |
| Know how to cook/prepare | Habit | ||
| Convenient to prepare | Habit | ||
| Evaluation Category | Evaluation Item | Score | |
|---|---|---|---|
| Data | Temporal Resolution | T1 | |
| Runs | T1 | ||
| Spatial Resolution | N/A | ||
| Fidelity | T1 | ||
| Recent Data | T2 | ||
| Data Access | T1 | ||
| Parameters | Free | T2 | |
| Agent Heterogeneity | T1 | ||
| Sensitivity Analysis | Parametric Sensitivity | T1 | |
| Model Sensitivity | T3 | ||
| Validation | Output Validation | T3 | |
| Documentation and Reproducibility | (made up of 18 items) | T1 | |
Further calibration details
The calibration exercises used an (single and bi-objective) evolutionary algorithm (EA) implemented in Python (Van Rossum & Drake 2009). The NetLogo model and Python were linked via the NL4PY package (Gunaratne 2018), which allows the remote control, execution, and analysis of the model from within a Python environment (in our case Jupyter). The DEAP Python package was used to execute the EA (Fortin et al. 2012). Specifically, we employed the “Mu Plus Lambda” algorithm, using a simulated binary crossover, polynomial bounded mutation and the NSGA-II selection algorithm. Candidate parameter sets were drawn from a uniform distribution over upper and lower bounds and an initial population of 75 individual sets were created, with the algorithm running over 20 generations.
Additional results
Figure 5 shows sensitivity analysis for scenarios within the milk pricing simulation experiment (S1-S4). Temporal (5-year time step, 2025-2050) variance-based global sensitivity analysis was conducted for simulated PBM consumption. Sensitivities are a sum of first order values and those due to interactions between parameters. Across all values, the mean proportion of sensitivity due to interactions was 75%, with 25% due to parameters.
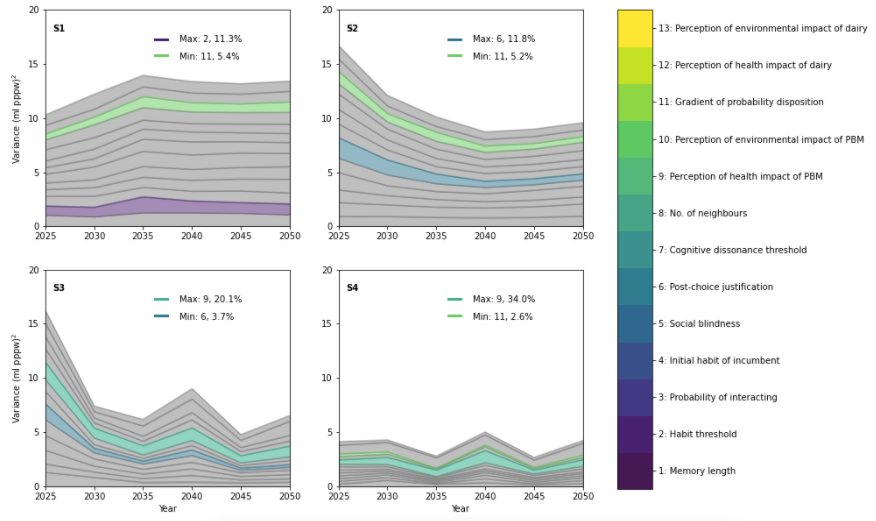
Overall, scenarios S1 and S4 were relatively stable but S2 and S3 decreased over time. Further, S3 and S4 (note, results are for a 50% reduction by 2050 not 2030 target) show comparatively lower total variance, an unsurprising result, given the single, rather than bi-objective optimisation. In general, across scenarios, parameter sensitivity was fairly equal with no dominance of one parameter over another. For scenarios S1-S2, maximum sensitives were around the 11%-12% range, and minimum were around 5%. For scenarios S3-S4, maximum sensitivity proportions were higher (within overall less variance) at 20%-34% of variance. The most common parameter for minimum sensitivity was no. 11 (Gradient of probability distribution), occurring for three scenarios (S1, S2, S4). The most common parameter for maximum sensitivity was no. 9 (Perception of health impact of PBM), occurring for scenarios S3 and S4.
Figure 6 shows a scenario exploration that considers a declining, rather than largely constant, total average milk consumption. Declining milk consumption is modelled as an annual decrease from 2019 levels, based on average rates of decline from 2004 to 2019. By visual inspection, scenario S7 has a greater proportion of dairy (navy lines) model runs hitting the 2050 target level (35% reduction) than scenario S1, although over a larger spread. For scenarios S2 and S8, that both consider dairy milk price rising to organic levels, there does not appear to be a marked difference in the proportion of successful runs (i.e., hitting the 2050 target). Declining consumption leads to lower adoption and consumption of plant-based milks, as a sizeable portion of the target is instead met with reduced demand. Indicatively, approximately 50% of the target level is due to less overall consumption and 50% due to substitution to plant-based alternatives.
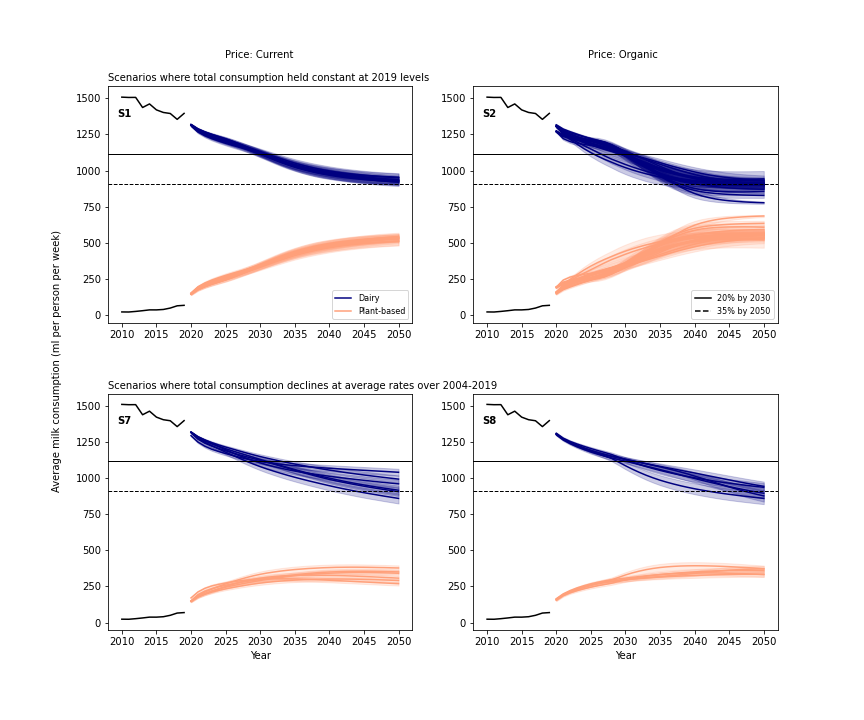
Figure 7 shows the result of resampling different sets of 1,000 responses from both the ESS and BSA. Scenario S1 is selected for the resampling analysis, based on a single parameter set of the eight sets produced from calibration. This parameter set was selected on the basis of producing simulations runs that had the smallest mean summed absolute difference with the arithmetic mean of all the simulation runs of all the calibrated parameter sets.
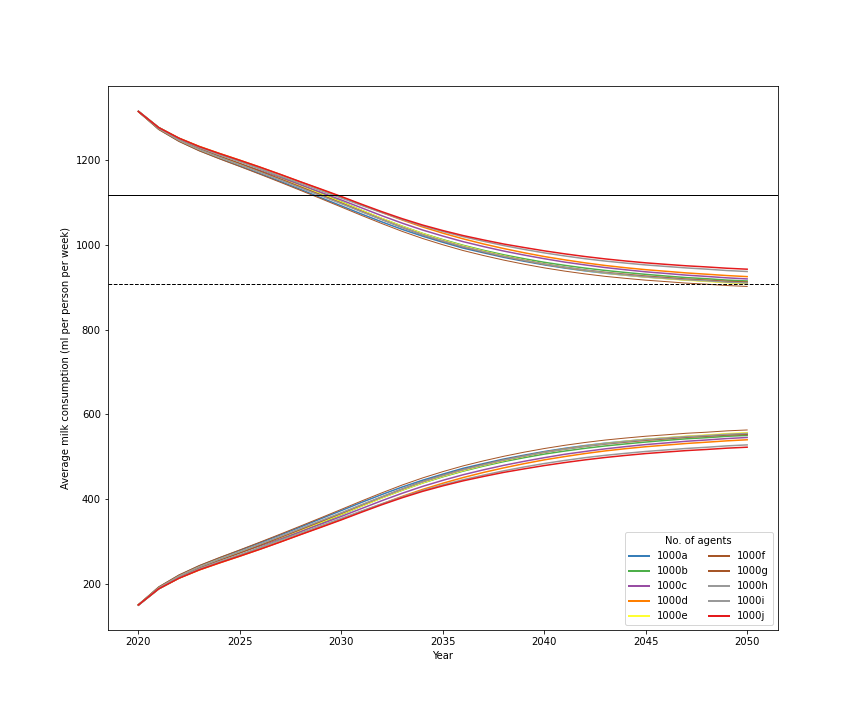
The means and distribution of these results were compared at the point of the final time-step (2050). A one-way ANOVA test confirmed that the means were significantly different (\(F(9,3070) = 107.12\), \(p<0.001\)). Post-hoc analysis to understand which groups were significantly different was conducted via Tukey’s Honestly Significant Differences (HSD) (\(\alpha=0.05\)). Figure 8 shows a summary of this analysis. Of the 45 combinations, 12 (27%) confidence intervals crossed zero, i.e. these pairs may have equal means. The other 33 combinations of means show statistically significant differences at the 95% confidence level.

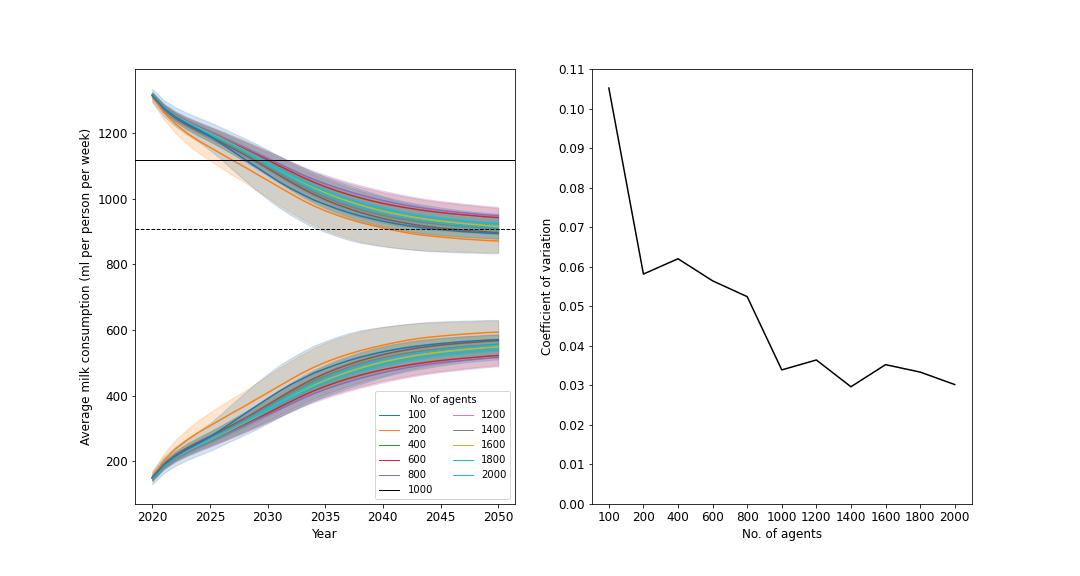
Figure 9a (left-hand side) shows the output of simulations for scenario S1 under different agent population sizes. Eleven different populations were tested (100, 200, 400, 600, 800, 1000, 1200, 1400, 1600, 1800, 2000), and the distributions of simulation outputs were analysed for stability. That is, we assessed at what point the change in variance from simulation runs under different sized populations slowed or stopped. This assessment is based on calculating the coefficient of variation (CV) for simulation means and standard deviation at the final time-step (2050) for each different population size. Figure 9b (right-hand side) shows that CV decreases as population size increases up to 1,000 agents, thereafter, CV remains relatively stable at around 0.03.
Appendix B
Model description – Additional details
Emergence
The key results of modelled outputs that emerge from the behaviours and interactions of individuals are the macro-level average consumption of milk choice among the simulated population, the trajectories of these curves, and their proximity to delivering on dairy reduction target levels.
Interaction
Individuals interact with other individuals through a social network (small-world structure) where information exchange occurs. The mechanism by which information exchange occurs is not explicitly modelled, rather, this is governed by a probability of interaction and a social influence weighting
Stochasticity
Information on health and environmental impacts of different milk choice options that agents perceive is randomly drawn from a normal distribution with mean values. In the environmental concern simulation experiment, the occurrence of a public concern ‘shock’ is governed by a probability informed by observed data. Further, stochasticity is reflected in the logistic function of neighbour milk choice information entropy and probability of an agent becoming disposed to consider their alternatives.
Heterogeneity
Heterogeneity is represented by the assignment of state variables among the agents. Principally, agents have different milk choice influence weightings operationalised from British Social Attitude 2008 survey data, and different basic human values assigned according to the distribution of UK results data from the European Social Survey 2018.
Observation (incl. Emergence)
At each time step, the component choice functions and decision-making function for each choice and each agent is collected.
Sub-models – Additional details
Cognitive perception
Memory effects are included, with agents able to store a limited amount of averaged information from a set number of previous time-steps. At each new time-step, new information is added to a rolling average of previous time-steps and information is removed beyond a threshold governed by the memory length parameter. The upper and lower memory bounds (1, 10) follow the El Farol NetLogo model by Rand & Wilensky (2007).
Evaluation
Agents have the possibility to evaluate the choices they make. Evaluation offers a mechanism for agents learn from prior experience and use this to inform future decisions. Cognitive dissonance in food choice is one theory of evaluation (see Ong et al. 2017 for review), and we model this through a conceptualisation of tension between an agent’s human values and their milk choice behaviour. Here we use the theory of basic human values to assign two values (security and universalism) to each agent, reflecting, broadly, their position on health and their position on the environment. High importance for universalism values are associated with a deeper concern and action toward environmental issues (Schultz et al. 2005; Schwartz 2012). Within Schwartz’s theory of basic human values, health is orientated to the security value (Schwartz 2012). The European Social Survey (ESS) includes questions from Schwartz basic human values. We take UK responses for universalism and security questions and operationalise them to give a distribution of values relating to the environment and health.
Each milk choice has an associated health and environmental impact. At each time step, the aggregate impact of the choices is calculated and then compared against the agent’s values on a relative basis. If this relative impact is within a given proximity to their value position, determined by the ‘cognitive dissonance threshold’ parameter, no feedback is sent. However, if the difference is sufficiently large, the agent enters a state of cognitive dissonance whereby their actions are incongruent with the values they hold. Here, agents pursue the least costly path to try and escape this uncomfortable state. They will either reconsider their behaviour (next choice) and become spontaneously disposed and alter the weight ($\(10% per time-step) they ascribe to health or environmental components versus physical (price) aspects, or they will alter their value base slightly (\)$% per time-step) to better fit the choices they make. If the difference between impact and value base is too large, given by the ‘justification’ parameter, agents simply rationalise this dissonance and once again no feedback occurs.
References
ANDREYEVA, T., Long, M. W., & Brownell, K. D. (2010). The impact of food prices on consumption: A systematic review of research on the price elasticity of demand for food. American Journal of Public Health, 100(2), 216–222.
ANNUNZIATA, A., & Scarpato, D. (2014). Factors affecting consumer attitudes towards food products with sustainable attributes. Agricultural Economics, 60(8), 353–363.
AUCHINCLOSS, A. H., Riolo, R. L., Brown, D. G., Cook, J., & Roux, A. V. D. (2011). An agent-Based model of income inequalities in diet in the context of residential segregation. American Journal of Preventive Medicine, 40(3), 303–311.
BAUDRY, J., Péneau, S., Allès, B., Touvier, M., Hercberg, S., Galan, P., Amiot, M. J., Lairon, D., Méjean, C., & Kesse-Guyot, E. (2017). Food choice motives when purchasing in organic and conventional consumer clusters: Focus on sustainable concerns (the NutriNet-Santé cohort study). Nutrients, 9(2), 88.
BYRNE, M. D. (2013). How many times should a stochastic model be run? An approach based on confidence intervals. Proceedings of the 12th International conference on cognitive modeling, Ottawa. Retrieved from: https://iccm-conference.neocities.org/2013/proceedings/papers/0083/paper0083.pdf.
CHEN, P. J., & Antonelli, M. (2020). Conceptual models of food choice: Influential factors related to foods, individual differences, and society. Foods, 9(12), 1898.
CLAPP, J., & Scrinis, G. (2016). Big food, nutritionism, and corporate power. Globalizations, 14(4), 578–595.
CLUNE, S., Crossin, E., & Verghese, K. (2017). Systematic review of greenhouse gas emissions for different fresh food categories. Journal of Cleaner Production, 140, 766–783.
CRUWYS, T., Bevelander, K. E., & Hermans, R. C. J. (2015). Social modeling of eating: A review of when and why social influence affects food intake and choice. Appetite, 86, 3–18.
FORTIN, F. A., De Rainville, F. M., Gardner, M. A., Parizeau, M., & Gagné, C. (2012). DEAP: Evolutionary algorithms made easy. Journal of Machine Learning Research, 13, 2171–2175.
GALÁN, J. M., López-Paredes, A., & Del Olmo, R. (2012). An agent-based model for domestic water management in Valladolid metropolitan area. Water Resources Research, 45(5).
GAN, Y., Duan, Q., Gong, W., Tong, C., Sun, Y., Chu, W., Ye, A., Miao, C., & Di, Z. (2014). A comprehensive evaluation of various sensitivity analysis methods: A case study with a hydrological model. Environmental Modelling & Software, 51, 269–285.
GDP, F. &. (2018). Climate change and the global dairy cattle sector – The role of the dairy sector in a low-carbon future. Rome. Available at: https://www.fao.org/3/CA2929EN/ca2929en.pdf.
GE, J., Polhill, J. G., MacDiarmid, J. I., Fitton, N., Smith, P., Clark, H., Dawson, T., & Aphale, M. (2021). Food and nutrition security under global trade: A relation-driven agent-based global trade model. Royal Society Open Science, 8(1), 356–368.
GIABBANELLI, P. J., Tison, B., & Keith, J. (2021). The application of modeling and simulation to public health: Assessing the quality of agent-Based models for obesity. Simulation Modelling Practice and Theory, 108, 102268.
GIBSON, M., Slade, R., Pereira, J. P., & Rogelj, J. (2021). Comparing mechanisms of food choice in an agent-Based model of milk consumption and substitution in the UK. Journal of Artificial Societies and Social Simulation, 24(3), 9: https://www.jasss.org/24/3/9.html.
GRIMM, V., Berger, U., Bastiansen, F., Eliassen, S., Ginot, V., Giske, J., Goss-Custard, J., Grand, T., Heinz, S. K., Huse, G., Huth, A., Jepsen, J. U., Jørgensen, C., Mooij, W. M., Müller, B., Pe’er, G., Piou, C., Railsback, S. F., Robbins, A. W., … DeAngelis, D. L. (2006). A standard protocol for describing individual-based and agent-based models. Ecological Modelling, 198(1–2), 115–126.
GRIMM, V., Berger, U., DeAngelis, D. L., Polhill, J. G., Giske, J., & Railsback, S. F. (2010). The ODD protocol: A review and first update. Ecological Modelling, 221(23), 2760–2768.
GRIMM, V., Railsback, S. F., Vincenot, C. E., Berger, U., Gallagher, C., DeAngelis, D. L., Edmonds, B., Ge, J., Giske, J., & Groeneveld, J. (2020). The ODD protocol for describing agent-based and other simulation models: A second update to improve clarity, replication, and structural realism. Journal of Artificial Societies and Social Simulation, 23(2), 7: https://www.jasss.org/23/2/7.html.
GUERCI, M., Bava, L., Zucali, M., Sandrucci, A., Penati, C., & Tamburini, A. (2013). Effect of farming strategies on environmental impact of intensive dairy farms in Italy. Journal of Dairy Research, 80(3), 300–308.
GUERCI, M., Knudsen, M. T., Bava, L., Zucali, M., Schönbach, P., & Kristensen, T. (2013). Parameters affecting the environmental impact of a range of dairy farming systems in Denmark, Germany and Italy. Journal of Cleaner Production, 54, 133–141.
GUNARATNE, C. (2018). NL4Py. Complex Adaptive Systems Lab, University of Central Florida, Orlando, FL. Retrieved from: https://github.com/chathika/NL4Py.
HERMAN, J., & Usher, W. (2017). SALib: An open-source Python library for sensitivity analysis. The Journal of Open Source Software, 2(9), 97.
HIGGS, S., & Thomas, J. (2016). Social influences on eating. Current Opinion in Behavioral Sciences, 9, 1–6.
HOEK, A. C., Pearson, D., James, S. W., Lawrence, M. A., & Friel, S. (2017). Healthy and environmentally sustainable food choices: Consumer responses to point-of-purchase actions. Food Quality and Preference, 58, 94–106.
KANG, J., Jun, J., & Arendt, S. W. (2015). Understanding customers’ healthy food choices at casual dining restaurants: Using the Value–Attitude–Behavior model. International Journal of Hospitality Management, 48, 12–21.
KANTAR. (2019). Cow’s milk still a firm favourite. AHDB. Available at: https://ahdb.org.uk/news/consumer-insight-liquid-milk-market-performance.
KHADEMI, A., Zhang, D., Giabbanelli, P. J., Timmons, S., Luo, C., & Shi, L. (2018). An agent-Based model of healthy eating with applications to hypertension. Smart Innovation, Systems and Technologies, 93, 43–58.
KUCHERENKO, S., Albrecht, D., & Saltelli, A. (2015). Exploring multi-dimensional spaces: A comparison of Latin Hypercube and Quasi Monte Carlo sampling techniques. arXiv Preprint. Available at: https://arxiv.org/abs/1505.02350.
LALLY, P., Van Jaarsveld, C. H. M., Potts, H. W. W., & Wardle, J. (2010). How are habits formed: Modelling habit formation in the real world. European Journal of Social Psychology, 40(6), 998–1009.
LAUBER, K., Rutter, H., & Gilmore, A. B. (2021). Big food and the World Health Organization: A qualitative study of industry attempts to influence global-level non-communicable disease policy. BMJ Global Health, 6(6), e005216.
LIGMANN-ZIELINSKA, A., Kramer, D. B., Cheruvelil, K. S., & Soranno, P. A. (2014). Using uncertainty and sensitivity analyses in socioecological agent-Based models to improve their analytical performance and policy relevance. PLoS ONE, 9(10), e109779.
LLOYD, S. J., & Chalabi, Z. (2021). Climate change, hunger and rural health through the lens of farming styles: An agent-based model to assess the potential role of peasant farming. PLoS ONE, 16(2), e0246788.
MBOW, C., Rosenzweig, C., Barioni, L. G., Benton, T. G., Herrero, M., Krishnapillai, M., Liwenga, E., Pradhan, P., Rivera-Ferre, M. G., Sapkota, T., Tubiello, F., Xu, Y., Amanullah, A., Benkeblia, N., Challinor, A. J., & Porter, J. R. (2019). Food security. Climate Change and Land: an IPCC special report on climate change, desertification, land degradation, sustainable land management, food security, and greenhouse gas fluxes in terrestrial ecosystems. Available at: https://www.ipcc.ch/srccl/authors/.
MEKONNEN, M. M., & Hoekstra, A. Y. (2012). A global assessment of the water footprint of farm animal products. Ecosystems, 15(3), 401–415.
MONTELEONE, E., Spinelli, S., Dinnella, C., Endrizzi, I., Laureati, M., Pagliarini, E., Sinesio, F., Gasperi, F., Torri, L., Aprea, E., Bailetti, L. I., Bendini, A., Braghieri, A., Cattaneo, C., Cliceri, D., Condelli, N., Cravero, M. C., Del Caro, A., Di Monaco, R., … Tesini, F. (2017). Exploring influences on food choice in a large population sample: The Italian taste project. Food Quality and Preference, 59, 123–140.
NAMANY, S., Govindan, R., Alfagih, L., McKay, G., & Al-Ansari, T. (2020). Sustainable food security decision-making: An agent-based modelling approach. Journal of Cleaner Production, 255, 120296.
NATIONAL Centre for Social Research. (2010). British social attitudes survey. Available at: https://beta.ukdataservice.ac.uk/datacatalogue/studies/study?id=6390.
NORWEGIAN Centre for Research Data. (2018). ESS Round 9: European Social Survey Round 9 Data. Available at: https://doi.org/10.21338/NSD-ESS9-2018
ONG, A. S.-J., Frewer, L., & Chan, M.-Y. (2017). Cognitive dissonance in food and nutrition – A review. Critical Reviews in Food Science and Nutrition, 57(11), 2330–2342.
PACHUCKI, M. A., Jacques, P. F., & Christakis, N. A. (2011). Social network concordance in food choice among spouses, friends, and siblings. American Journal of Public Health, 101(11), 2170–2177.
POORE, J., & Nemecek, T. (2018). Reducing food’s environmental impacts through producers and consumers. Science, 360(6392), 987–992.
RAND, W., & Wilensky, U. (2007). NetLogo El Farol model. Available at: https://ccl.northwestern.edu/netlogo/models/ElFarol.
RICCI, E. C., Banterle, A., & Stranieri, S. (2018). Trust to go green: An exploration of consumer intentions for eco-friendly convenience food. Ecological Economics, 148, 54–65.
RÖÖS, E., Garnett, T., Watz, V., & Sjörs, C. (2018). The role of dairy and plant based dairy alternatives in sustainable diets. Available at: https://pub.epsilon.slu.se/16016/1/roos_e_et_al_190304.pdf.
SALTELLI, A., Annoni, P., Azzini, I., Campolongo, F., Ratto, M., & Tarantola, S. (2010). Variance based sensitivity analysis of model output. Design and estimator for the total sensitivity index. Computer Physics Communications, 181(2), 259–270.
SALTELLI, A., Ratto, M., Andres, T., Campolongo, F., & Cariboni, J. (2008). Global Sensitivity Analysis: The Primer. Hoboken, NJ: John Wiley & Sons.
SCALCO, A., Macdiarmid, J. I., Craig, T., Whybrow, S., & Horgan, G. W. (2019). An agent-based model to simulate meat consumption behaviour of consumers in Britain. Journal of Artificial Societies and Social Simulation, 22(4), 8: https://www.jasss.org/22/4/8.html.
SCHULTZ, P. W., Gouveia, V. V., Cameron, L. D., Tankha, G., Schmuck, P., & Franĕk, M. (2005). Values and their relationship to environmental concern and conservation behavior. Journal of Cross-Cultural Psychology, 36(4), 457–475.
SCHWARTZ, S. H. (2006). Basic human values: Theory, measurement, and applications. Revue Française de Sociologie, 47(4), 929–968.
SCHWARTZ, S. H. (2012). An overview of the Schwartz theory of basic values. Online Readings in Psychology and Culture, 2(1), 12–13.
SCHWARTZ, S. H. (2018). A proposal for measuring value orientations across nations.
SMEATON, D., Draper, A., Vowden, K., & Durante, L. (2010). Development work for wave 2 of the Food and You survey.
SOBAL, J., & Bisogni, C. A. (2009). Constructing food choice decisions. Annals of Behavioral Medicine: A Publication of the Society of Behavioral Medicine, 38(1), 37–46.
SPRINGMANN, M., Godfray, H. C. J., Rayner, M., & Scarborough, P. (2016). Analysis and valuation of the health and climate change cobenefits of dietary change. Proceedings of the National Academy of Sciences, 113(15), 4146–4151.
SWINBURN, B. (2019). Power dynamics in 21st-Century food systems. Nutrients, 11(10), 2544.
TEMPELS, T., Verweij, M., & Blok, V. (2017). Big food’s ambivalence: Seeking profit and responsibility for health. American Journal of Public Health, 107(3), 402.
TRACY, M., Cerdá, M., & Keyes, K. M. (2018). Agent-Based modeling in public health: Current applications and future directions. Annual Review of Public Health, 39, 77–94.
VANGA, S. K., & Raghavan, V. (2018). How well do plant based alternatives fare nutritionally compared to cow’s milk? Journal of Food Science and Technology, 55(1), 10–20.
VAN Rossum, G., & Drake, F. L. (2009). Python 3 Reference Manual.
VAN’T Riet, J., Sijtsema, S. J., Dagevos, H., & De Bruijn, G. J. (2011). The importance of habits in eating behaviour. An overview and recommendations for future research. Appetite, 57(3), 585–596.
VERAIN, M. C. D., Dagevos, H., & Antonides, G. (2015). Sustainable food consumption. Product choice or curtailment? Appetite, 91, 375–384.
VERAIN, M. C. D., Onwezen, M. C., Sijtsema, S. J., & Dagevos, H. (2016). The added value of sustainability motivations in understanding sustainable food choices. Applied Studies in Agribusiness and Commerce, 10(2–3), 67–76.
VERAIN, M. C. D., Sijtsema, S. J., Dagevos, H., & Antonides, G. (2017). Attribute segmentation and communication effects on healthy and sustainable consumer diet intentions. Sustainability, 9(5), 743.
WALZBERG, J., Carpenter, A., & Heath, G. A. (2021). Role of the social factors in success of solar photovoltaic reuse and recycle programmes. Nature Energy, 6(9), 913–924.
WANG, C., Tan, Z. X., Ye, Y., WANG, L., Cheong, K. H., & Xie, N. G. (2017). A rumor spreading model based on information entropy. Scientific Reports, 7(1), 1–14.
WATTS, D. J., & Strogatz, S. H. (1998). Collective dynamics of “small-world” networks. Nature, 393(6684), 440–442.
WILENSKY, U. (1999). NetLogo.
YOUGOV. (2021). Concern for environment reaches record high in YouGov top issues tracker.
ZHANG, D., Giabbanelli, P. J., Arah, O. A., & Zimmerman, F. J. (2014). Impact of different policies on unhealthy dietary behaviors in an urban adult population: An agent-based simulation model. American Journal of Public Health, 104(7), 1217–1222.
ZHANG, D., Thapa, J. J., Li, G., Son, H., Chen, Z., Mu, L., Li, Y., Liu, J., & Giabbanelli, P. J. (2021). Scaling up the SNAP-ED toolkit interventions to improve fruit and vegetable consumption across counties in Georgia: An agent-Based model.