An Agent-Based Model of the Interaction Between Inequality, Trust, and Communication in Common Pool Experiments

,
and
aSchool of Sustainability, Arizona State University, USA, United States; bUniversity of Louisville, United States; cSchool of Complex Adaptive Systems, Arizona State University, United States
Journal of Artificial
Societies and Social Simulation 25 (4) 3![]()
<https://www.jasss.org/25/4/3.html>
DOI: 10.18564/jasss.4922
Received: 20-Mar-2022 Accepted: 23-Aug-2022 Published: 31-Oct-2022
Abstract
An agent-based model is presented that aims to capture the involvement of inequality and trust in collective action in a classic commons dilemma before, during, and after communication. The model assumptions are based on the behavioral theory of collective action of Elinor Ostrom and the ‘humanistic rational choice theory’. The commons dilemma is represented as a spatially explicit renewable resource. Agent’s trust in others has an impact on the harvesting of shared resources, and trust is influenced by observed harvesting behavior and cheap talk. We calibrated the model using data from a prior set of lab experiments on inequality, trust, and communication. The best fit to the data consists of a population with a small share of altruistic and selfish agents and a majority of conditional cooperative agents sensitive to inequality and who would cooperate if others did. Communication increased trust explaining the better group performance when communication was introduced. The modeling results complement prior communication research and clarify the dynamics of reciprocal cooperation commonly observed in robust resource governance systems.Introduction
Overharvesting shared resources has been presented as the inevitable and canonical outcome of allowing groups to manage a valuable resource without external supervision and intervention by a government (Hardin 1968). However, from extensive comparative case study analysis and behavioral experiments in the lab, field, and cyberspace, we know that a tragedy of the commons is not inevitable. Some groups can learn to manage their shared resources successfully with minimal or no external interventions (Ostrom 1990). Comparative case study analysis provided insights into broad characteristics of the biophysical, social, and institutional context that correlate with effective self-governance of common-pool resources (Ostrom 1990). Experiments provided insights into relevant mechanisms that explain self-governance.
Generally speaking, effective enforcement systems do improve cooperation. Experimental behavioral research often finds that external enforcement or peer punishment improves cooperation in public good dilemma and common-pool resource experiments (Bochet et al. 2006; Ostrom et al. 1992; Yamagishi 1986). However, external enforcement and peer punishment are not always necessary and may backfire by undermining trust and internal motivations (Bowles 2008), or inciting retaliation (Balafoutas et al. 2014; Janssen et al. 2010). Communication, commonly referred to as “cheap talk”, which is communication without the ability to enforce promises, has surprisingly emerged as an important factor in improving cooperation (Balliet 2010; Brosig et al. 2003; DeCaro et al. 2021; Janssen et al. 2010; Ostrom et al. 1992).
Communication often improves cooperation, but there has not been a good explanation. Several potentially related mechanisms have been identified. Groups often form agreements and use communication to refine conservation strategies. They also share important technical information (e.g., resource dynamics) and attempt to hold one another accountable via informal social sanctions (e.g., shaming and praise; see Balliet 2010; DeCaro et al. 2021, for review). However, even with minimal option to share text messages, we still see a significant performance improvement (Janssen et al. 2014).
Building on her seminal work on societal self-governance, Ostrom (1998) provided an influential theoretical framework focused on dynamic processes of trust and reciprocity triggered by communication and democratic decision-making. Ostrom hypothesized that cooperative behavior is the outcome of the reinforcing interaction between the trust that individuals develop via communication, development of positive (i.e., trustworthy) reputations, and adherence to the reciprocity norm (i.e., cooperating with other cooperators). In this process, communication has the potential to overcome past inequities and distrust if group members honor their verbal agreements. Observing initial reciprocity after communication triggers a virtuous cycle of trust and reciprocal cooperation. However, perceptions and psychosocial processes are rarely measured in more traditional behavioral experiments and field studies, making it difficult to determine the central involvement of such trust perceptions and other social cognitions (Anderies et al. 2011).
DeCaro et al. (2021) recently addressed this informational gap by conducting a controlled laboratory experiment that specifically measured these perceptions before and after communication in 41 groups across three experimental phases. Participants’ overall trust perceptions, communication content, and democratic decision-making processes were correlated with groups’ overall cooperation. The results showed that democratic decision-making and perceived trust were, indeed, strongly associated with cooperation.
Specifically, communication improved trust and cooperation by satisfying fundamental needs for procedural justice, self-determination, security, and equity (i.e., equity aversion; c.f. Fehr & Schmidt 1999; Yang et al. 2016). This need satisfaction triggered acceptance of the group’s tentative conservation agreement, starting Ostrom’s virtuous cycle of trust and reciprocity. However, DeCaro et al. (2021) did not conduct a dynamic analysis of individual behavior or analyze the relationship between trust and inequality. Hence, it is unclear how these important factors may have interacted over time to produce the observed patterns of cooperation and resource sustainability dynamically. This information needs to be clarified to improve the understanding of a centrally important process in cooperative self-governance.
This paper aims to explore the relationship between communication, trust, and inequality by developing an agent-based model that could lead to virtuous cycles of trust and reciprocal cooperation. In doing so, we want to use actual measures of perceived trust, which has not been done in previous models of commons dilemmas. We, therefore, use the data from DeCaro et al. (2021) experiment to conduct this analysis. DeCaro et al.’s experiment provides a good basis for this since it was designed to assess perceptions associated with trust and reciprocal cooperation. It was directly informed by Ostrom (1998) behavioral approach to rational choice theory. In fact, it is a test of an extended version of Ostrom’s theory known as Humanistic Rational Choice Theory (DeCaro 2019).
In the rest of the paper, we will first summarize the experimental design and the main results of DeCaro et al. (2021) because this provides the theoretical and empirical bases for the modeling exercise. We then describe an agent-based model that aims to capture those results. Subsequently, the model is calibrated on empirical data, and we present a sensitivity analysis as an additional test of the model robustness. We conclude with implications for rational choice theory and future dynamic models of cooperation.
Experimental Materials and Methods
DeCaro et al. (2021) experiment was developed to test various aspects of Humanistic Rational Choice Theory (HRCT; DeCaro 2019), which seeks to clarify psychosocial processes involved in Ostrom (1998) behavioral theory of collective action. HRCT assumes that key factors such as communication, enforcement, and democratic decision-making influence cooperation by impacting fundamental needs and social cognition integral to trust formation and institutional acceptance. Communication provides the opportunity for individuals to satisfy these needs.
Our model is tailored exactly to the experimental environment participants encountered in DeCaro et al.’s experiment. We do not capture all agents’ perceptions, but we considered trust and inequality aversion, the two central elements identified by Ostrom (1998) and DeCaro (2019). Here, we describe the key features of the experimental environmental design. Note that our model does not capture how communication had an impact on trust among the participants of the original experiment. This implies that we cannot provide a full understanding as to how communication has a direct impact on cooperation. However, the statistical analysis provided in the Appendix can help to understand how psychological factors are correlated with communication outcomes.
The experiment included a group of four individuals who shared a resource. There were nine rounds in the experiments. The first three rounds were without communication. Then we collected data via a survey on how participants experienced the experiment. Subsequently, the group was allowed to communicate before each of the next three rounds. After round six, another survey was held. The last three rounds of the experiment were the same as the first three, without the ability to communicate.
A \(26 \times 26\) landscape created the common-pool resource dilemma with resource units accessible to four participants. Resource units were initially distributed randomly within the cells of the \(26 \times 26\) grid. The initial distribution was 169 units, 25% of the total grid. Empty cells replenished with a probability that depended on the number of adjacent resource units. More adjacent resource units yielded a higher regrowth probability. This represents a logistic growth model where the fastest regrowth occurs when each empty cell has four neighboring cells occupied by a resource unit in a checkerboard pattern.
Participants moved their avatars around the landscape by clicking on the arrow keys. To harvest a resource unit, they had to press the space bar if the avatar was on a cell with a resource unit. Participant identities were confidential and unknown to each other. However, participants could see each avatar on the screen in real-time and see each player’s score (number of tokens harvested) and the remaining time (each round was four minutes). Incentives were provided since each resource unit was worth $0.02. Participants typically earned between $10 and $25, dependent on the decision they and other participants made.
The experiment consisted of 9 four-minute rounds. The first three rounds were without communication. During the next three rounds, participants could exchange chat messages for 5 minutes before each round. Participants could also chat during each round. Beginning at the 7th round, communication was not allowed. Participants’ self-reported trust was measured after round 3 (no communication) and round 6 (communication). More details and social-psychological analysis of the experiment, as well as the experimental protocol, can be found in DeCaro et al. (2021).
Experimental Results
DeCaro et al. (2021) original analysis focused on aggregate, group-level processes and outcomes without examining individual behavior. However, the outcomes emerged from individuals’ interdependent decisions. We will now discuss various statistics of the experiment that informed the model development and model performance on the data. We report results during the 4 minutes of each round, which has informed the model development by representing simple decision rules of agents, aimed at describing how aggregate effects could occur. At the end of this section, we summarize five qualitative patterns identified as important by the model to be reproduced.
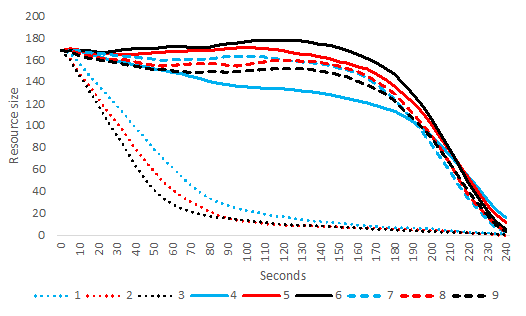
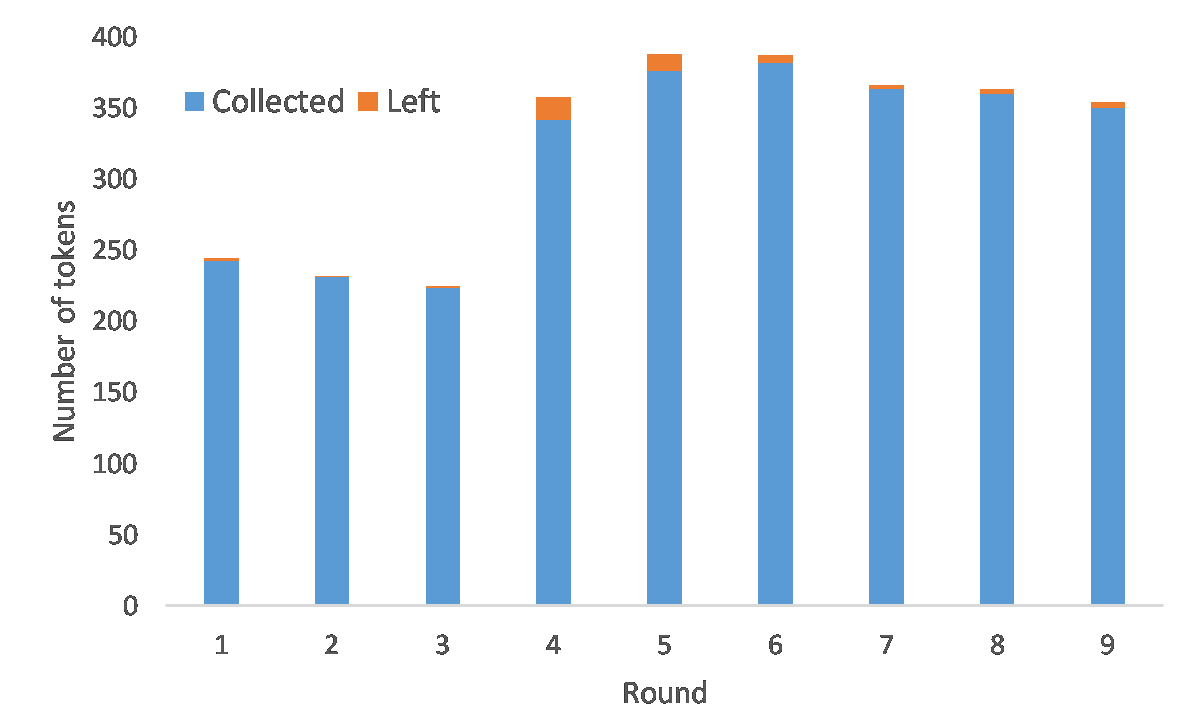
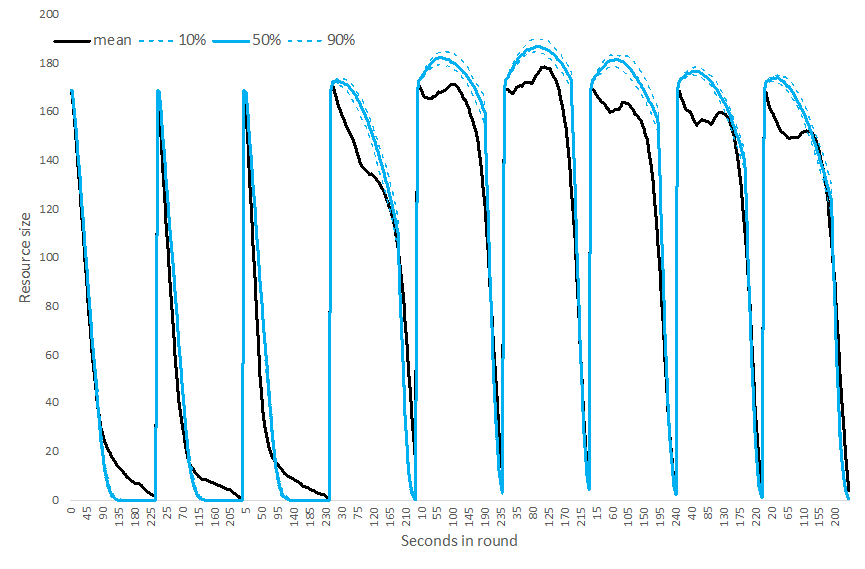
During the first three rounds (without communication), the resource size declined quickly, replicating the standard tragedy of the commons (Hardin 1968). This resource decline was faster with each subsequent round without communication. This is probably caused by observed inequality causing distrust and rivalry, escalating harvesting rates. When participants communicated, they, on average, started to stabilize the resource pool. This was mainly caused by moving their avatar more slowly, harvesting fewer tokens during the first 3 minutes, and harvesting quickly in the last minute (Figure 1, Figure 12). Performance improved each round; they communicated, reversing the trends seen in the first three rounds (Figure 2). The groups sometimes left some tokens behind if they started speeding up their harvesting rate too late. After communication stopped (beginning round 7), the average resource level started to decline again. Still, the resource supply remained quite high and did not reach previously low levels seen in the first three rounds. This pattern indicates that individuals continued to cooperate well, even after communication ceased.
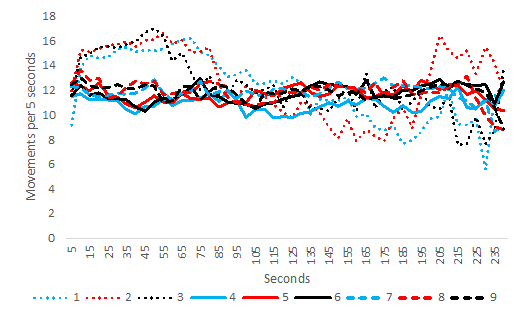
As previously mentioned, the rate of avatar movement during a round is related to how quickly individuals harvest and indicates cooperation levels. Generally, movement is slower when individuals cooperate, waiting for resource units to grow. We assessed this in the experiment data by counting each player’s avatar’s number of movements every 5 seconds. As we surmised, the rate of movement was indeed higher for rounds 1-3 compared to the later rounds (Figure 3). During the first three rounds (without communication), the avatars seem to be sprinting (racing one another) during the first 90 seconds. By comparison, after having communicated in rounds 4-6, this sprint did not happen in rounds 7-9 when communication was no longer possible. Communication in rounds 4-6 led to a long-term behavioral change. According to DeCaro et al. (2021) aggregate analyses, this long-term improvement occurred because democratically communicating groups increased their rule internalization and acceptance, promoting trust and voluntary compliance. When we created the agent-based model, it was important to replicate those movement rates to capture observed behavior adequately.
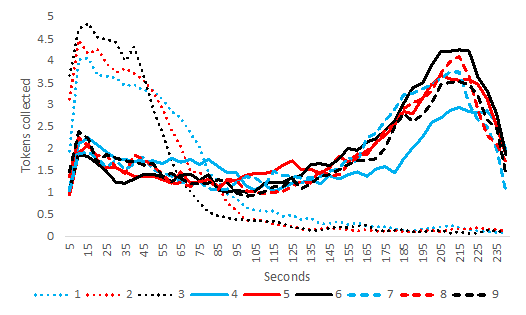
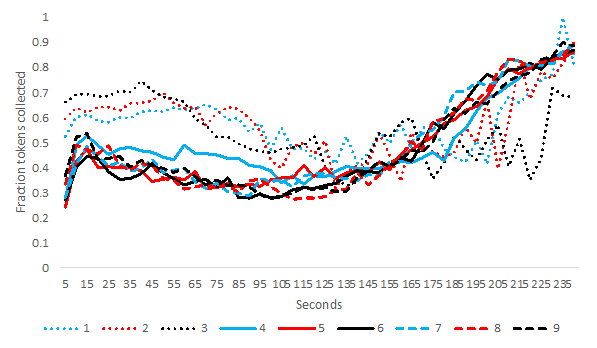
The harvesting rate (number of tokens collected per 5 seconds; Figure 4) and relative frequency that tokens on a cell are collected (Figure 5) are also important indicators of cooperation that have informed our model development. In rounds 1-3, the players started each round with a high harvesting rate until the resource was entirely depleted. However, when the players had communicated, we saw that the initial harvesting rate in rounds 4-9 was comparatively slow and peaked 20 to 30 seconds before the end of each round. This corresponds with the common strategy to conserve the resource until the round ends to increase overall harvests. During rounds 1-3, players harvested fewer units overall, and 74% of the harvest occurred during the first 60 seconds. In contrast, players harvested more tokens overall during rounds 4-9, with about 21% occurring in the first 60 seconds and 40% in the last 60 seconds. Thus, communication during rounds 4-6 led to long-term behavioral change in rounds 7-9.
As illustrated by the distribution of trust among participants in each group (Figure 6), most groups reported low trust levels immediately after the first three rounds (without communication). However, most groups reported high levels of trust after communicating during rounds 4-6. DeCaro et al. (2021) demonstrated that group trust emerged best when group members made decisions democratically (measured by counting how many group members openly endorsed each major group decision: e.g., conservation proposals and agreements).
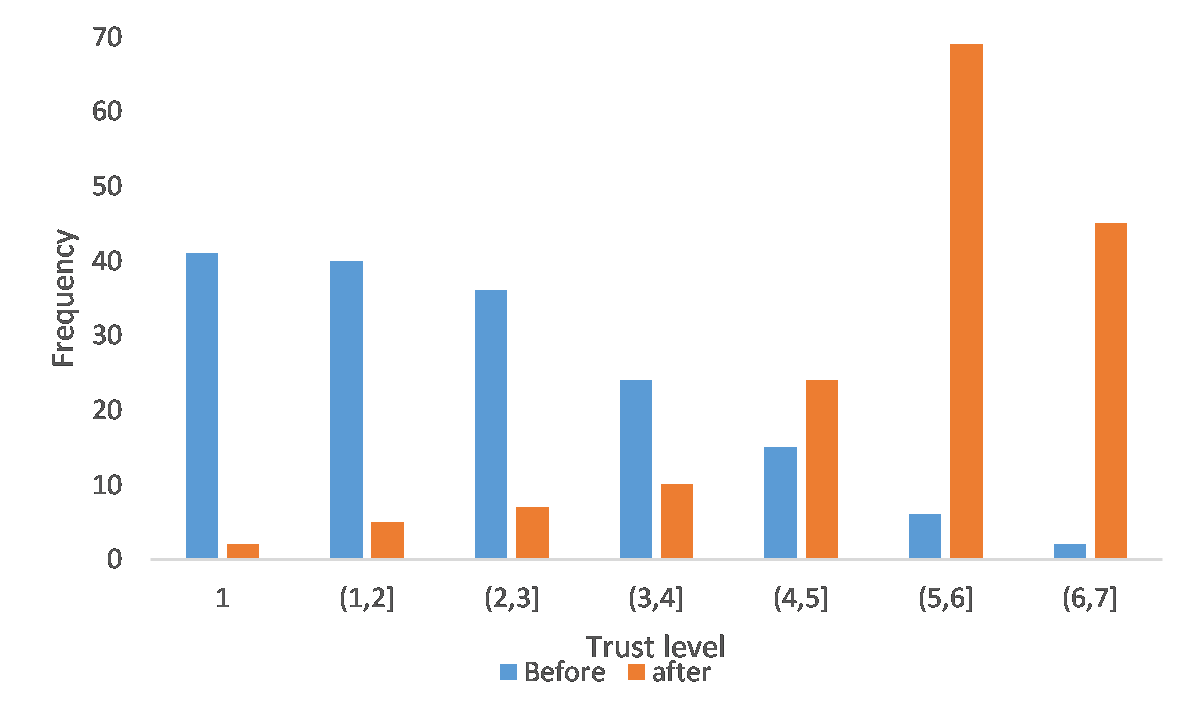
Trust is an important indicator in the model. DeCaro et al. (2021) did not relate trust levels to round-by-round cooperative behavior. Such information is needed to understand dynamic patterns of conditional cooperation (i.e., trust and reciprocity) across rounds. Therefore, we computed the observed trust levels before and after communication (Figure 6). We then used multi-level regression analyses to analyze these trust levels as a function of the relative share of tokens harvested by individuals compared to the rest of the group (relative harvest), the overall group harvest, and the overall degree of inequality. As shown in Figure 6, the frequency of high levels of trust increased after communication.
Our multi-level analysis (Table 1) revealed that when communication was not possible relative earnings (harvests) in round 1 significantly impacted individuals’ trust by the end of round 3 (Table 1). For example, a person who received a relatively small share of the tokens collected in round 1, due to aggressive harvesting by other group members reported lower trust in the other group members. Similarly, when communication ended, cooperative behavior during round 6 influenced trust formation prior to round 7. Specifically, three factors were important: if (a) an individual’s relative share of earnings (tokens harvested) was high, (b) the total harvest by the group was high, and (c) income inequality in the group was small during round 6, then trust was higher afterward. Thus, as proposed by Ostrom (1998), the potential to build trust by enabling group members to derive a fair and productive harvesting arrangement.
| Predictors | Predicted Trust after round 3 | Predicted Trust after round 3 | Predicted Trust after round 6 | |
|---|---|---|---|---|
| Constant | 1.569 (0.418) *** | 1.537 (0.428)*** | Constant | 4.194 (0.572)*** |
| Relative Harvest round 1 | 3.708 (1.193)*** | 4.648 (3.011) | Relative Harvest round 6 | -3.036 (2.848) |
| Total Group Harvest round 1 | -0.004 (0.011) | Total Group Harvest round 6 | 0.026 (0.006)*** | |
| Gini Coefficient (inequality) round 1 | 0.087 (1.553) | 0.218 (1.605) | Gini coefficient round 6 | -6.033 (2.200) *** |
| Number of observations | 164 | 164 | 163 | |
| Number of groups | 41 | 41 | 41 | |
| -Log Likelihood | 286.822 | 286.765 | 265.524 | |
| Variance components | ||||
| Individual level | 0.093 (0.136) | 0.098 (0.138) | 0.089 (0.112) | |
| Group level | 1.848 (0.236) | 1.843 (0.235) | 1.440 (0.185) | |
| \(\chi^{2}\) | 0.54 (\(p > 0.1\)) | 0.58 (\(p > 0.1\)) | 0.74 (\(p > 0.1\)) | |
To conclude, we have documented five important behavioral patterns from DeCaro et al. (2021) experiment that an agent-based model would need to replicate to describe well the behavioral dynamics in the common-pool resource dilemma:
- Lack of communication during rounds 1-3 yield rivalry and rapid overharvesting.
- Rounds 1-3 are, on average, harvested faster than rounds 4-9, and this harvesting rate escalates with each subsequent round 2 and 3 as unabated rivalry increases.
- Immediately after communication, round 4 yields a substantially higher level of individual and total earnings, with a correspondingly slower decline of the resource pool.
- Each subsequent round of communication (rounds 5 and 6) yields more restraint, with slower harvesting rates and even fewer harvests at the start of the round.
- When communication is no longer possible (rounds 7, 8, and 9), cooperation and resource stability stay high, with a small decline in restraint and harvest total.
These results suggest that communication combined with the observed behavior of others (rivalry vs. restraint) impacts participants’ trust, along with their harvesting behavior and speed. The following section presents a model to capture these major behavioral patterns.
Model Description
We propose a simple agent-based model, extending Janssen et al. (2009) previous no-communication model of cooperation in a commons dilemma by including trust formation effects. This model represents Ostrom (1998) core behavioral theory of conditional cooperation, linking trust and reciprocity with dynamic processes of communication and self-governance (see also DeCaro et al. 2021).
For simplicity, we did not include information about group communication’s content (i.e., what the participants communicated about). We acknowledge that there is variation in how communication content impacts a specific group’s performance (see DeCaro et al. 2021 for detailed analysis and discussion). For this demonstration, we focus on the dynamics of cooperation, driven by the overall (i.e., average) effects of communication and trust. Thus, in this model, the communication effect is the same for all groups to capture the mean of the observed harvesting activities, representing a typical group.
Our central goal in this modeling exercise was to emulate the moment-by-moment decisions and actions of the participant. Human participants could choose where (direction), when (timing), and how fast (speed) to move the avatar to harvest resource units. Therefore, the agents in our model are also designed to decide where, when and how fast to move and harvest. We exactly replicated the dynamics of the renewable, spatially explicit resource pool so that agents make these decisions in the same resource environment as participants. Thus, we simulated a \(26 \times 26\) landscape, where 169 cells (25%) initially contain a resource unit at the beginning of each simulated 4-minute round. The probability that an empty cell would grow a new resource unit was defined as \(\frac{p n_{t}}{N}\), where \(n_{t}\) is the number of neighboring cells containing a green token, and \(N = 8\) is the number of neighboring cells. Like the experimental software, \(p\) is also equal to 0.01. The experimental software checks 10 times per second whether an avatar will move or harvest a resource unit, and the model checks up to 10 times per second whether an agent decides to move or harvest.
Human participants clicked on one of the keys on their keyboard when making a movement decision or harvest decision, and these actions took time. Therefore, our agents’ decisions and actions should take some analogous time to execute in the simulation. As we will discuss below, the initial speed of movements is derived from an empirical distribution. The movement speed could be adjusted based on trust in other agents during the round. The decision whether to harvest or move is defined by parameters impacting the agent’s greediness and trust in other agents. At the start of rounds 4, 5, and 6, trust is increased due to cheap talk. Agents have parameters describing the impact of cheap talk on the change of trust levels.
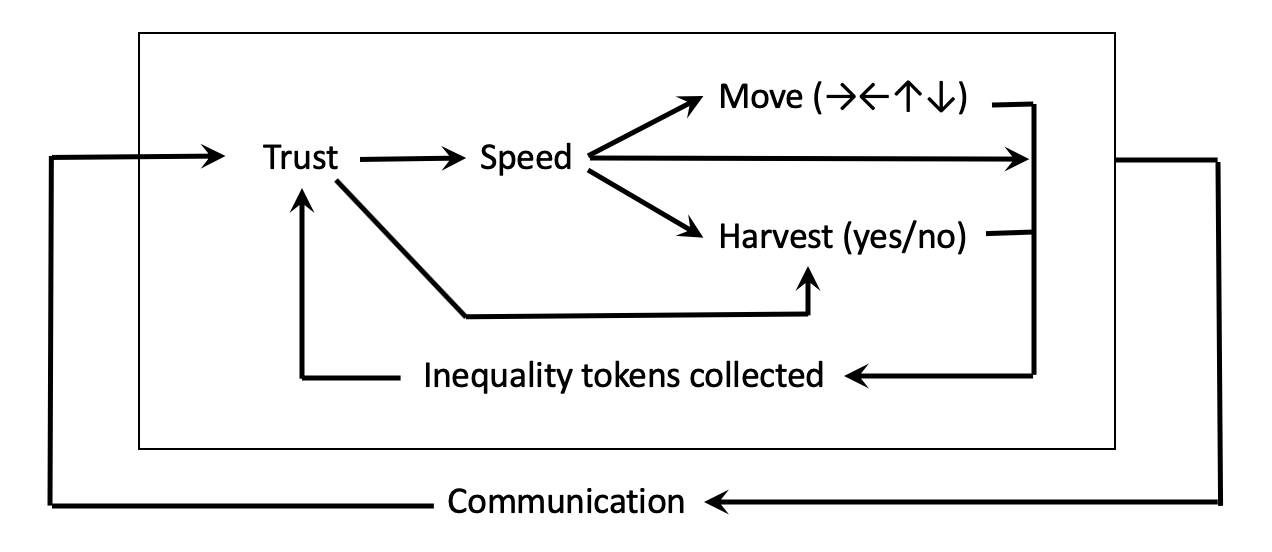
The proposed model, therefore, used the variable trust as a key component (Figure 7). Trust in others is, itself, impacted by the presence/absence of communication and the observed inequality of tokens harvested oneself (versus the harvest of all other agents in the group). If trust declines, the agent’s movement speed will increase, and the agents are more likely to harvest a token on a cell. Here, we do not aim to capture the diversity of spatial and temporal arrangements that groups devise during their communication (see DeCaro et al. 2021).
Base movement speed
The default movements of the agents are measured by the empirical data as three moves per second with a standard deviation of 0.65. For simplicity’s sake, we assume that this is normally distributed, which follows the observed distribution (see Figure 3) of speed between 5 and 65 seconds (but we ignored the first two seconds due to the start-up latency of human beings). A Shapiro-Wilk test supported the assumption of normality in the speed distribution.
Movement direction
Agents define their direction to reach the closest token. If more than one token is equally closest, then one of the tokens is drawn at random as the target.
Probability of harvesting a token
Human participants did not always harvest a token when available (Figure 5). Thus, when an agent moves to a patch with a token, there is a certain probability \(p_{h}^{*}\) to collect the token (where \(h\) stands for harvest). As mentioned earlier, we assume this probability is affected by the trust agents have in others. Furthermore, if trust increases, agents start to pursue group equality and long-term earnings (i.e., longer time horizons). However, if trust decreases, agents will act more selfishly, pursuing personal and short-term earnings (i.e., shorter time horizons). The harvesting rate is assumed to be dependent on the variable \(T\), which stands for an agent’s current level of Trust in other agents. Hence, the probability \(p_{h}^{*}\) that an agent harvests a token once it is on a patch with a token is defined as:
| \[ p_{h}^{*}=p_{h} (1 - \alpha_{h} T)\] | \[(1)\] |
Where \(p_{h}\) is the default probability of an agent to harvest a token when the agent does not trust other agents (\(T = 0\)). The parameter \(\alpha_{h}\) captures the degree to which the harvesting rate declines when agent trust increases. This assumption is based on the implications of Ostrom’s theoretical framework (Ostrom 1998).
To summarize what has been described so far, using pseudo code, the decisions of an agent each second are determined as follows:
    Repeat 10[
           With probability speed / 10 do
           [
              Define closest token
              Define heading up, down, right or left to move in the direction of the token
              Move one step forward
          ][
              If a token on a cell harvest with probability computed in Equation 1
           ]
          ]
Trust
Trust is updated once per second due to observed inequality. At the start of each round, after a communication period, trust gets a boost. The observed equality is captured by comparing the earnings \(x_{i}\) between the agent and the other agents. Prior theory debates how individuals are sensitive to inequalities (cf. Fehr & Schmidt 1999). The parameter \(\tau\) captures the sensitivity of an agent to the observed inequality (i.e., inequality aversion). Inequality is captured by the average absolute difference in earnings between agent i and other agents in the group. Trust can therefore change during the round when the agent observes the harvesting behavior of others. The boost from communication in rounds 4, 5, and 6 depends on the value \(\theta\). A higher value of \(\theta\) brings the value of \(T\) closer to 1, the maximum value of trust \(T\). Note that the component with \(\theta\) is only used in rounds 4, 5, and 6 when there was communication. We assumed for simplicity that each agent type we discuss in our model analysis has the same sensitivity to communication. This is obviously a major simplification but is needed since we do not model the communication content itself nor have a theoretical foundation on how changes in trust may differ among agents.
We assume now that we can represent trust can be defined using the following linear equation:
| \[ T_{t, i} = T_{t-1} - \frac{\tau}{N - 1} \sum_{j} \lvert x_{i} - x_{j} \rvert + \theta (1 - T_{t-1})\] | \[(2)\] |
In sum, trust levels are adjusted during the round based on observed inequality and get a boost with communication at the start of rounds.
Movement speed as a function of trust
Next, we explain how the model updates agents’ speed of movement and harvest as a function of trust within each round. We mimic the experimental software update rate by using the speed level as the number of times per second an agent may make a move. Speed, \(s_{t}\), is defined as the default level of speed \(s_{0}\) minus a relative slowdown due to trust, \(T\), in other agents. Hence if trust declines, agents speed up, leading to faster harvesting of the shared resource. The parameter \(\alpha_{s}\) is the sensitivity of speed (where s stands for speed) to changes in trust levels. For example, if \(T = 0\) (no trust), then \(s_{t} = s_{0}\). If trust is maximal, \(T = 1\), the speed is reduced to \(s_{t} = s_{0} (1 - \alpha_{s})\). The model calibration aims to reveal a possible value of the sensitivity parameter \(\alpha_{s}\).
| \[ s_{t} = s_{0} - \alpha_{s} T_{t} s_{0}\] | \[(3)\] |
Delayed harvesting
In addition to its effects on trust and the speed of movement, communication also contributed to coordination. As previously mentioned, after communicating, many groups delayed harvest until about 60 seconds before the end of each round (Figure 4). When the maximum harvest rate is triggered, agents attempt to harvest every token they can. To capture this behavior, we define parameter \(t_{c}\) as the coordinated time when agents start their maximum rate of harvest (where \(c\) stands for “crazy” because human participants often refer to this as “going crazy” at the end of the round).
Selective harvest strategy
Finally, communication may reduce rivalry, allowing agents to leave tokens alone to facilitate renewal. The optimal harvest strategy is to selectively harvest in a checkerboard pattern, leaving empty cells between individual tokens to form a checkerboard matrix. This pattern maximizes the number of resource units surrounding empty cells, thereby maximizing the renewal rate of the common-pool resource just like conventional logistic growth resources (see Janssen et al. 2010). To mimic this strategy in our agents, we ensured that the agents left a minimum number of adjacent cells, \(mn\), unharvested. A checkerboard pattern implies a minimum number of 4. We implemented this condition only during rounds 4-9 before the end-of-round “go crazy” time step \(t_{c}\). This implementation reflects the fact that most individuals in the experiment coordinated their actions during rounds 4-9 (during and after communication) and transitioning from a conservation strategy (e.g., checkerboard pattern) to a free harvesting period at the end of each round.
In total, the previous consideration resulted in eight model parameters to define agents’ decisions. These parameters are summarized in Table 2. Agents have an initial level of trust, \(T_{0}\), and trust is updated using \(\tau\) when observing inequality of harvested tokens, and cheap talk, \(\theta\) (Equation 2). The speed of the agents is influenced by trust in agents, and agents have an individual sensitivity \(\alpha_{s}\) for this (Equation 3). When the agent is on a cell with a token, it has a probability to harvest this token, \(p_{h}\), dependent on how sensitive \(\alpha_{h}\) this agent is to trust (Equation 1), and if the number of neighboring cells with tokens is more than \(mn\). After communication has happened, a time to go crazy at the end of the round \(t_{c}\), which reduces the inhibitions of the agent (always harvest tokens).
| Description | Range | |
|---|---|---|
| \(p_{h}\) | Initial harvest probability | [0,1] |
| \(\alpha_{h}\) | Adjustment rate harvest probability | [0,1] |
| \(\alpha_{s}\) | Adjustment rate speed | [0,1] |
| \(t_{c}\) | Time after which agents maximize harvesting | [0,240] |
| \(\tau\) | Sensitivity to the observed inequality | [0,001] |
| \(\theta\) | Adjustment communication round | [0,1] |
| \(T_{0}\) | Initial Trust | [0,1] |
| \(mn\) | Minimum number of neighboring tokens | [0,8] |
Parameter estimation
We aim to explain the observed patterns in the data. Based on Ostrom’s behavioral theory of collective action, we need to include variables like communication, trust, and inequality, aspects that were not considered in the 1980s and are still not part of the standard model of rational choice, one of the main communities studying social dilemmas. If we can explain the data without including trust, inequality, and communication, that would challenge the usefulness of Ostrom’s behavior theory.
Therefore, to evaluate the performance of a model, we will look at the number of the following two indicators,\(I_{i}\), averaged across all nine rounds:
| \[ I_{1} = \frac{1}{9} \sum_{r = 1}^{9} \frac{(\overline{O}_{r} - \lvert \overline{O}_{r} - \overline{X}_{r} \rvert)}{\overline{O}_{r}}\] | \[(4)\] |
| \[ I_{2} = \frac{1}{9} \sum_{r = 1}^{9} \sum_{t = 1}^{48} \frac{(\overline{P}_{r, t} - \lvert P_{r,t} - \overline{Y}_{r,t} \rvert)}{\overline{P}_{r, t}}\] | \[(5)\] |
The first index, \(I_{1}\) refers to the fit between the model simulations and the empirical data for tokens harvested. The index has a maximum value of 1 if there is a perfect fit. \(\overline{O}_{r}\) refers to the observed mean number of tokens harvested by one of the 41 experimental groups in round \(r\). \(\overline{X}_{r}\) refers to the mean number of tokens harvested by a group in round \(r\) in 41 simulations.
The second index, \(I_{2}\) refers to the fit when replicating the resource’s state, which was captured every 5 seconds. Therefore, \(\overline{P}_{r,t}\) is the mean observed level of tokens in the resource in round \(r\) for time stamp \(t\), and \(\overline{Y}_{r,t}\) is the simulated number of tokens in the resource in round \(r\) for timestamp \(t\).
The mean of \(I_{1}\) and \(I_{2}\) will be used to evaluate the fit between data and simulation using the genetic algorithm BehaviorSearch of the NetLogo platform (Stonedahl & Wilensky 2010). If \(I_{i}\) is smaller than 0, the difference between the empirical and simulated data is bigger than the absolute value of the empirical data, and thus more than a 100% error. We will use optimization, the genetic algorithm, to find parameter estimates to generate the best fit.
We need a sufficient number of simulations per parameter setting to ensure reliable estimates. Based on the standard deviation of 100 sample simulations of a set of 41 groups, about 30 simulations are required for a maximum error of 0.01 (fitness function between 0 and 1) with \(p < 0.05\). Note that this means that \(9 * 41 * 30 = 11070\) simulations of a four-minute round of harvesting tokens are done to calculate one evaluation (\(\frac{I_{1} + I_{2}}{2}\)) of the fit between simulated and observed data.
Model Results
In this section, we present the results of our model, replicating the five patterns observed in the data from DeCaro et al.’s experiment. We first present a benchmark exercise with which to compare those results.
Benchmark exercise
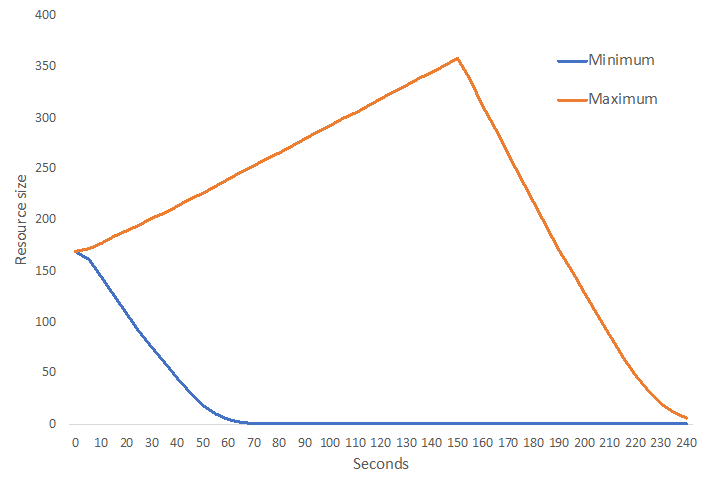
When interpreting a model of a commons dilemma experiment, it is informative to consider two benchmarks, a worst- and best-case scenario where agents are either unconditionally cooperative or selfish. Figure 8 illustrates these potential extremes for a representative round computed across 30 simulations of 41 experimental groups.
Unconditional cooperative agents start with high trust, ignore minor inequalities, and wait for 150 seconds before harvesting, coordinating their behavior (\(p_{h} = 0.4\); \(\alpha_{h} = 0\); \(\alpha_{s} = 0\); \(t_{c} = 150\); \(\tau = 0\); \(\theta = 1\); \(T_{o} = 1\)). Selfish agents start with no trust, do not respond to inequality, and start immediately harvesting the maximum speed (\(p_{h} = 1\); \(\alpha_{h} = 0\); \(\alpha_{s} = 0\); \(t_{c} = 0\); \(\tau = 0\); \(\theta = 0\); \(T_{o} = 0\)).
Groups consisting of unconditional cooperative agents achieve high levels of resource sustainability, collecting 421.5 tokens on average. In contrast, selfish agents rapidly deplete the resource within approximately 60 seconds and collect only 201.2 tokens on average.
Calibration and replication
We now present the calibration results, attempting to maximize the fit of the simulated and experimental data. We do a series of exercises with an increasing number of agent types. We start with calibrating the percentage of unconditionally cooperative agents versus selfish agents. We then continue with a second and third calibration, adding one type and two types of conditionally cooperative agents to evaluate potential improvement in the model’s explanatory performance.
We recognize that assuming representative agent types is very simplistic. However, even within one type of agent, agents can express different behaviors due to variations in opportunities (e.g., which tokens are available nearby) and observed inequalities among agents.
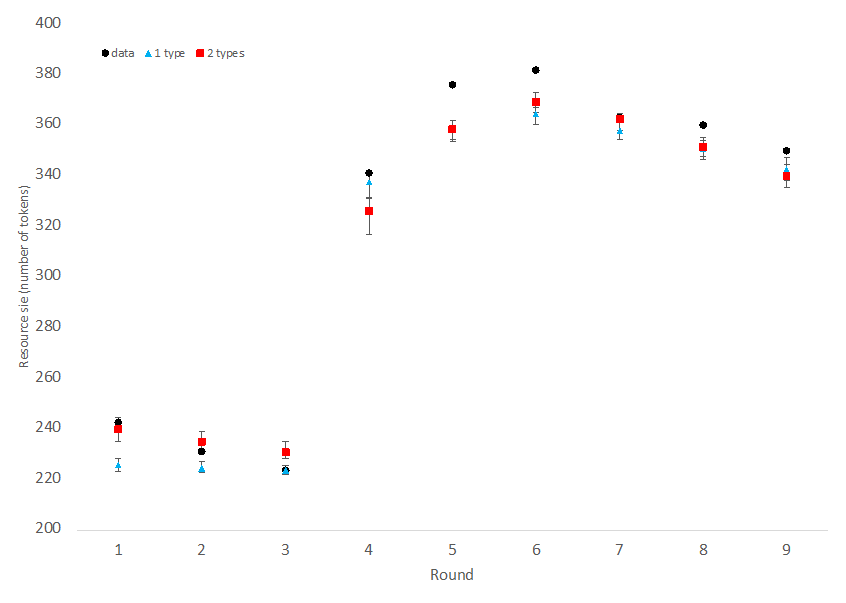
The results of the calibration are presented in Table 3. Suppose we consider only selfish and unconditional cooperative agents. In that case, a maximum fitness of 0.507 is derived if we use an agent population where 76% of the agents are selfish, and 24% are unconditionally cooperative. Model performance increased substantially when we added a third type of agent, a conditional cooperator. The fitness score is 0.842 when 75% of the agents are conditional cooperators, 16% of the agents are selfish, and 9% of the agents are unconditional cooperators. This distribution is consistent with empirical studies (e.g., Fischbacher et al. 2001). The model performance can be improved slightly, to 0.857, if we have two types of conditional cooperators. Type A conditional cooperator has low initial trust, while Type B conditional cooperator has high initial trust.
As a sensitivity test, we varied parameter values one parameter at a time for the basic model with one type of conditional cooperator (see the Appendix). We find that for parameters \(\alpha_{s}, T_{o}\), and the minimum number of neighboring cells with tokens, there is a wide range of values for which the fitness value remains close to the maximum value. However, for other parameters, the fit declines substantially. This analysis suggests a mixture of agents best explains the observations: mostly conditional cooperators with a small percentage of selfish or cooperative.
| Parameter | Description | Value Range | Selfish and Basic model | Model 1: Conditional Cooperator | Model 2: Type A+ | Model 2: Type B |
| \(p_{h}\) | Initial harvest probability | [0,1] | 0.38 | 0.82 | 0.86 | |
| \(\alpha_{h}\): | Adjustment rate harvest | [0,1] | 0.97 | 0.93 | 0.97 | |
| \(\alpha_{s}\) | Adjustment rate speed | [0,1] | 0.30 | 0.64 | 0.56 | |
| \(t_{c}\) | Timing of maximum harvesting rate | [0,240] | 176 | 194 | 181 | |
| \(\tau\) | Sensitivity to the observed inequality | [0,0.001] | 0.00009 | 0.00017 | 0.00004 | |
| \(\theta\) | Adjustment communication | [0,1] | 0.93 | 0.96 | 0.9 | |
| \(T_{0}\) | Initial trust | [0,1] | 0.35 | 0.08 | 0.85 | |
| \(mn\) | Minimum number of neighbor cells with tokens | [0, 8] | 3 | 6 | 3 | |
| % of agent types | ||||||
| Selfish | 76% | 16% | 6% | |||
| Altruist | 24% | 9% | 5% | |||
| Conditional A | 75% | 52% | ||||
| Conditional B | 37% | |||||
| Fitness | 0.507 | 0.842 | 0.857 | |||
Taking a closer look at the estimated parameter values and their influence on agents’ behavior helps to further clarify the interpretation of the models. First, when there was just one type of conditional cooperator in the model (Model 1), the agent had a low initial probability to harvest tokens (0.38), indicating a tendency to conserve the resource. The harvesting probability is reduced as a function of trust, simulating individual restraint (higher trust yields greater restraint), with adjustment rate \(\alpha_{h} = 0.97\)). Initial trust was low (0.35) but could be reduced more based on observed inequality, \(\tau = 0.00009\), while when communication was permitted, trust increased during each communication round (\(\theta = 0.93\)). Overall, this model provided a strong fit to the data.
As noted earlier, distinguishing between two different types of conditional cooperators (Model 2) further improves the model fit from 0.842 to 0.857. These agents mainly differed in their initial trust and sensitivity to observed inequality: one agent, type B, had higher initial trust and was less sensitive to inequality (high trust/inequity tolerant conditional cooperator) compared to the other agent, type A, which had lower initial trust and was more sensitive to inequity (low trust/inequity averse conditional cooperator). However, this model adds multiple parameters for only a slight improvement in model performance. Therefore, it may not be necessary to use Model 2 to explain the data.
When we evaluated the experimental data earlier, we identified 5 key qualitative data patterns that a good descriptive model should reproduce. Figures 9 and 10 demonstrate our most basic model’s performance (using Model 1) on these patterns. First, Figure 9 shows that, like the experimental participants, the agents in our model rapidly overharvested the resource in the first 3 rounds. Second, agents’ harvest rate increased during rounds 1-3, resulting in fewer total harvests. Third, communication prior to Round 4 leads to higher overall yields, as agents showed restraint allowing the resource pool to stabilize and replenish (Figures 9 and 10). Fourth, the overall harvests increased with each subsequent communication round (rounds 5, 6), as agents exhibited further restraint due to increased trust and observed reductions in inequality (Figure 10). Fifth, when communication ended (rounds 7-9), overall harvests (resource stability) remained high but slowly declined each round (Figure 10). Thus, Model 1 replicates well all five major behavioral patterns observed in DeCaro et al. (2021) data.
What does the model analysis reveal about the experimental data? Within our theoretical framework, we cannot explain the observed behavior without including the interaction between trust, inequality and communication. Our results indicate that observed behavior in DeCaro et al. (2021) demonstrative experiment can be explained well by groups consisting of majority conditional cooperative agents who respond positively to communication by increasing their trust and by delaying their maximum harvesting level until near the end of each round. Continued communication during rounds 4-6 continues to enhance agent’s trust. Observing that the other agents are sharing the available resource equitable also enhances trust. The accumulated trust ensures that the agents cooperate at a high level after communication ends, rounds 7-9. However, lack of communication means that the trust-enhancing opportunities of communication can no longer be directly maintained. Therefore, agents become more reliant on observed behavior in the final rounds of the experiment. Trust erodes somewhat in rounds 7-9 due to some observed inequality of harvesting, and this leads to a slow decline in cooperation and resource sustainability. This finding suggests that groups need a continued period communication to maintain trust and therefore likely will not continue to cooperate ad-infinitum without such communication. This finding also implies that Hardin (1968) worst-case scenario of the tragedy of the commons, at best, pertains to conditions without communication (rounds 1-3). Agent’s observed behavior is better aligned with Ostrom (1998) description of stakeholders as conditional cooperators, driven by trust and reciprocity (DeCaro 2019).
Robustness test: Generalization to a different environment
Finally, as an additional test of model robustness, we use Model 1 to explore an alternative experimental configuration. This is an out-of-sample test where we used Model 1 to reproduce qualitative findings from similar behavioral experiments. Janssen et al. (2014) ran a set of experiments where visibility of the resource and other players was restricted. Participants could only see within a 5-cell radius surrounding their avatar, requiring them to move around to observe the resource and other players’ behavior. In this setup, it is difficult for players to observe other players’ behavior. Therefore, their trust may be less sensitive to inequality because they observe inequality less frequently.
To test this assumption, we set agents to have a limited vision. We hypothesized that this would mean that agents would rarely observe direct information about others’ behavior, potentially affecting their trust. We assumed that trust would not be reduced as quickly due to observed inequality and that this would lead to greater restraint (i.e., resource conservation), resulting in higher total harvests. We also expected agents to coordinate less efficiently because they have limited vision (information) to observe the resource and other’s actions. Experiments reported by Janssen et al. (2014) demonstrate that participants typically start harvesting earlier to get a competitive advantage against the other group member in the second part of the round.
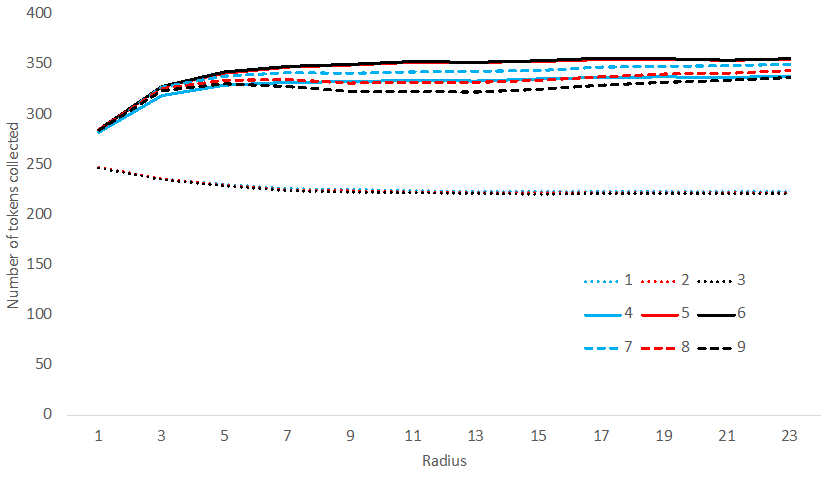
We performed simulations of Model 1, using different radii for additional diagnostic feedback. As shown in Figure 11, limited vision increases the number of tokens agents collected in rounds before communication, decreasing overall group harvests. In contrast, a limited vision has negligible effects on cooperation in rounds with communication: number of tokens collected decreases (as seen in DeCaro et al. 2021), resulting in overall higher group harvests.
The qualitative findings of this robustness test are similar to those found in experiments with radius 5 (Janssen et al. 2014), further affirming the plausibility of the single-conditional cooperator model we developed. Thus, it may be that not observing inequality of harvesting (due to limited visibility) lead to more sustainable use of the resource in rounds 1-3, while it reduces the possibility of high performance when agents can coordinate their performance in rounds 4-6.
Conclusions
We presented an agent-based model of a spatially-explicit common-pool resource dilemma to account for observed behavior in behavioral experiments (DeCaro et al. 2021). The model was informed by Ostrom (1998) and DeCaro (2019) behavioral theories, which describe how communication facilitates trust formation and reciprocal cooperation. The model was unique because it used participants’ self-reported trust before and after communication to emulate dynamic changes to trust during different moments in the experiment, as agents’ reacted to ongoing communication and observed levels of in/equality. Trust levels subsequently influenced simulated in-game harvesting behavior, reproducing major behavioral patterns and resource management outcomes observed in the original data.
The best explanation of the data used a mixture of agent types, broadly resembling distributions commonly seen in other experimental studies. Specifically, 75% of the agents were conditional cooperators, with a moderate level of initial trust that improved with communication and decreased with observed inequality. The other agents were unconditional cooperators (9%) and selfish agents (16%). Overall, the best fitting model accounted for five major qualitative patterns observed in the experimental data, providing a good description of the data. Our model also generalized well to another test environment where visibility was restricted.
What do these results tell us about the interaction of inequality, trust, and communication? The observed outcomes cannot be explained without including inequality, trust, and communication in agents’ decision-making, thus confirming Ostrom’s behavior theory of collective action. However, this does not mean that each agent has to consider these factors. Indeed, the heterogeneity of agent types is key to reproducing observed patterns. However, although communication is assumed to increase trust among conditional cooperative agents, our findings cannot fully capture the effect of communication on outcomes such as trust in other types of agents. More research will be needed to provide a comprehensive picture of the impact of communication on trust among various types of agents and on heterogeneous population.
This project has important theoretical implications. Agents were designed to adhere to behavioral principles proposed by Ostrom (1998) theory of collective action and Humanistic Rational Choice Theory (HRCT; DeCaro 2019). According to Ostrom (1998), self-interested agents require trust to coordinate. DeCaro et al. (2021) show that open, democratic communication and decision-making enable this trust to emerge, specifically by satisfying fundamental needs for procedural justice, self-determination, security, and equity. When group members’ only means of controlling behavior is communication, they rely on social sanctions such as praise and shame to enforce cooperative agreements. This contradicts historically accepted assumptions that communication is mere “cheap talk” unable to enhance security without tangible punishments (cf. Ostrom et al. 1992). The current study supports a view of humans as capable to cooperatively self-govern, with sufficient opportunity to communicate and monitor each other’s behavior (cf. Ostrom et al. 1992).
In conclusion, our calibrated model on spatially explicit commons dilemmas confirms the empirically observed diversity of agent types (Fischbacher et al. 2001) and that trust, inequality, and communication are important driving factors (Ostrom 1998). Future research should continue exploring ways to examine and represent these behavioral and institutional foundations of cooperative self-governance in subsequent experimental tests and agent-based models.
Acknowledgments
This work was supported by the National Science Foundation Grant No. 1658608. Any opinions, findings, conclusions, or recommendations expressed in this material are those of the author(s) and do not necessarily reflect the views of the National Science Foundation.Model Documentation
The model is implemented in NetLogo 6.2, and the code is available at: https://www.comses.net/codebases/61faf9c9-3e93-44af-be74-2a60e8b3360e/releases/1.0.0/.Appendix: Additional Analysis
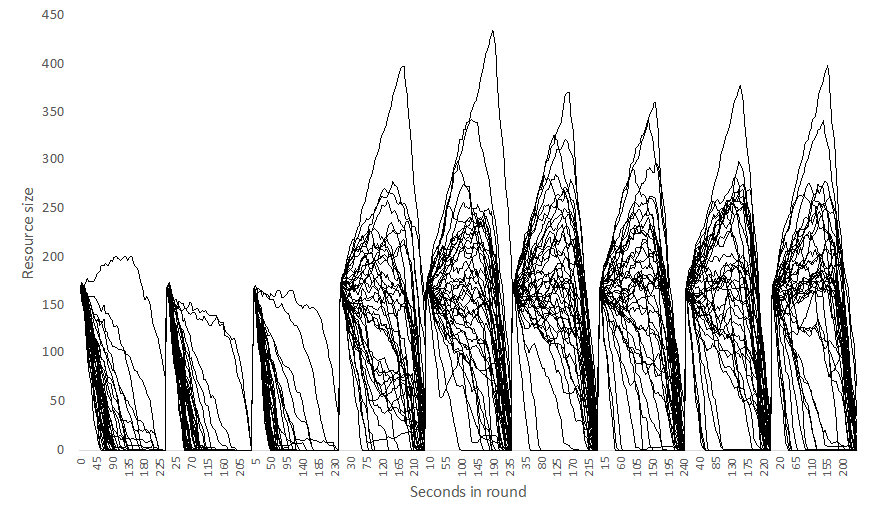
In Figure 12, we show the time series of the resource level of each of the 41 groups. This shows the wide spread of group behaviors and the qualitative change after round 3 when participants could communicate.
Next, we show that participants’ behavior within a round is correlated. We measure the number of movements between 5.00 and 35.00 seconds. We ignore the first 5 seconds because participants do not start immediately (reaction time) when the round begins, and after 35 seconds, a resource can be depleted quite a bit. Hence the 30-second interval used is pretty comparable.
The correlations in Table 4 show that the number of movements is not correlated in rounds 1 to 3. Participants go their own way and do not adjust their speed quickly in the rounds without communication. After communication, the speed becomes more correlated over the rounds, which drops a bit again when communication is not allowed anymore. The number of harvested tokens starts to become correlated in round 2, which indicates that after the first rounds, participants who did not harvest many tokens will increase their harvesting rate, so they fall less behind the participants who harvested a lot already in round 1.
| Movements | Harvested tokens | |
|---|---|---|
| Round 1 | -0.0420 | 0.1416 |
| Round 2 | 0.0760 | 0.2212 |
| Round 3 | 0.0135 | 0.4329 |
| Round 4 | 0.5652 | 0.3892 |
| Round 5 | 0.6745 | 0.5367 |
| Round 6 | 0.7222 | 0.7283 |
| Round 7 | 0.6820 | 0.7764 |
| Round 8 | 0.7017 | 0.8300 |
| Round 9 | 0.6418 | 0.8493 |
Is there a correlation between trust and the tokens harvested by a group? In Table 5, we see the average trust of a group after round 3 is somewhat correlated with the total harvest of a group in rounds 2 and 3. Hence groups with lower mutual trust led to lower harvest returns. Trust in round 3 negatively correlates with the tokens harvested in round 4. This suggests that groups with low mutual trust reverse course and substantially increase their harvest. The trust level measured after round 3 is not correlated with the number of tokens harvested in rounds 5-9. This means that communication had a significant impact on trust. The trust after communication, measured after round 6, is strongly correlated with the group’s performance in rounds 4-9. This shows that the communication in round 4 already had a major impact. Since trust is likely a combination of observed behavior and communication, it is no surprise that the highest correlation is in round 7, just after we measured the trust levels.
| Trust after round 3 | Trust after round 6 | |
|---|---|---|
| Round 1 | 0.0337 | 0.0970 |
| Round 2 | 0.2747 | 0.0503 |
| Round 3 | 0.3301 | -0.0820 |
| Round 4 | -0.2805 | 0.3636 |
| Round 5 | -0.1905 | 0.5585 |
| Round 6 | 0.0164 | 0.5781 |
| Round 7 | -0.0356 | 0.6571 |
| Round 8 | -0.1211 | 0.6233 |
| Round 9 | -0.0658 | 0.5819 |
In Figure 9, in the main article, we show the results of the best fit for the model with one type of conditional cooperative agent. In Figure 13, we show similar results for the version of the model with 2 types of conditional cooperative agents.
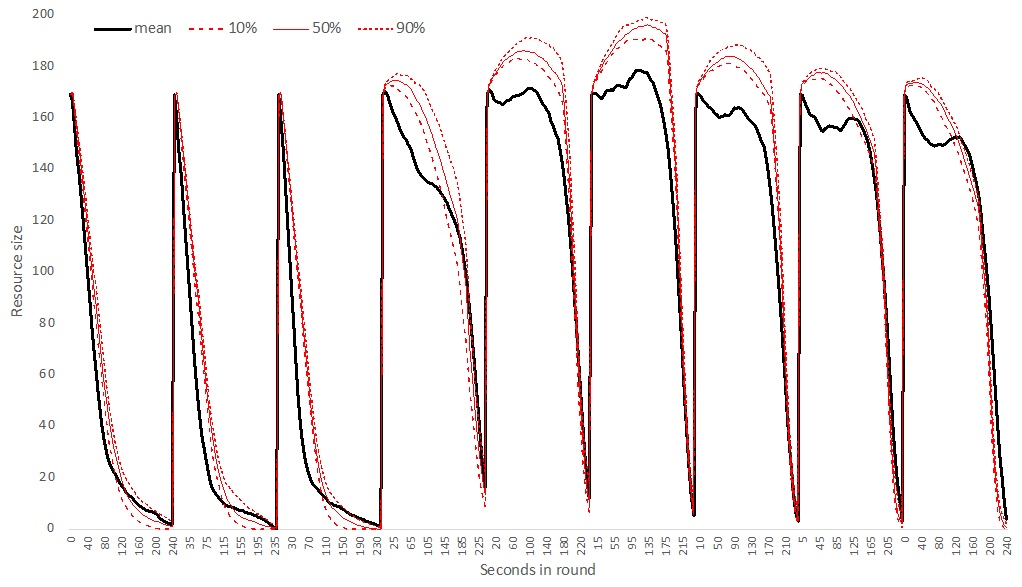
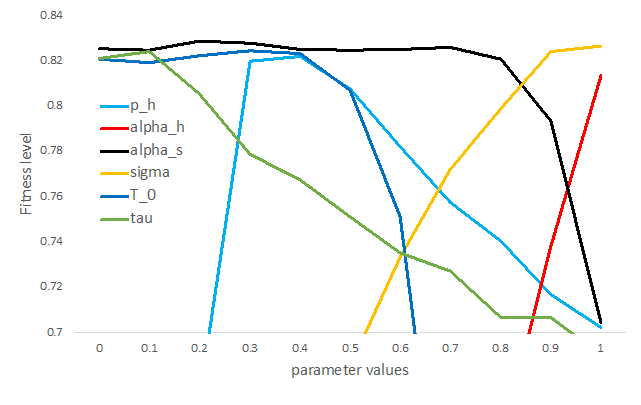
Figure 14 shows the average fitness level of different parameter values where we varied the parameter values from 0 to 1 in steps of 0.1. We see that the initial harvesting probability between 0.3 and 0.4 lead to the best performance, while values close to 1 for \(\alpha_{h}\) are the only ones leading to good performance. This means that harvesting probability is sensitive to trust in others. In contrast, the speed of agents should not be adjusted rapidly to trust since high values of \(\alpha_{s}\) lead to lower performance of the model.
Trust in others moves close to the maximum value after a communication period, as can we see for good fitness values for values of \(\theta\) of 0.9 or higher. If the initial trust in others is lower than 50%, the performance of the model is good. Sensitivity of trust to observed inequality in the group needs to be in the lower level of the parameter range of \(\tau\) to derive high performance of the model.
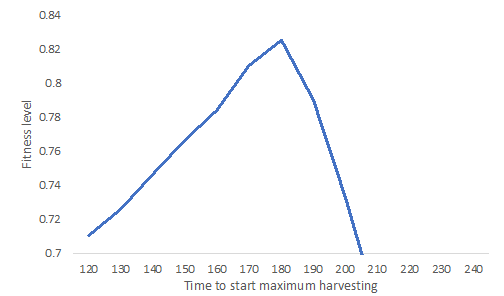
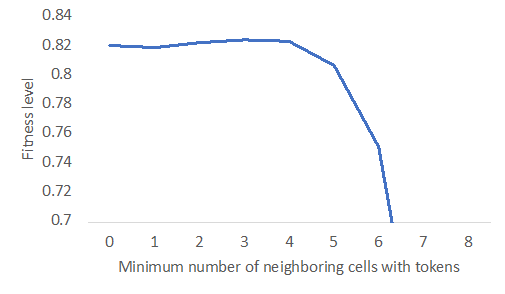
Figure 15 shows the sensitivity of the time for the conditional cooperative agent to "go crazy." If this happens with around 60 seconds left on the clock, the performance of the model with the data is good. Finally, in Figure 16, we show performance is slightly higher if agents do not harvest tokens in rounds after round 3 if there are less than 3 neighboring cells of the cell with the token occupied with tokens. Performance drops quickly if more than four tokens are on the neighboring cells.
Finally, in Table 6, we see the fitness levels for different mixtures of selfish, cooperative, and one type of conditional cooperative agents. As long as 70% or more of the agents are conditional cooperative, the fitness level of the model is 70% or more. The best performance is still to have some selfish and cooperative agents and not only have conditional cooperative agents.
| Selfish/Coop | 0 | 0.1 | 0.2 | 0.3 | 0.4 |
|---|---|---|---|---|---|
| 0 | 0.766 | 0.758 | 0.745 | 0.495 | -0.131 |
| 0.1 | 0.784 | 0.803 | 0.781 | 0.458 | 0.302 |
| 0.2 | 0.710 | 0.719 | 0.595 | 0.492 | -0.143 |
| 0.3 | 0.637 | 0.680 | 0.651 | 0.443 | 0.259 |
| 0.4 | 0.561 | 0.589 | 0.605 | 0.457 | -0.373 |
References
ANDERIES, J. M., Janssen, M. A., Bousquet, F., Cardenas, J. C., Castillo, D., Lopez, M. C., Tobias, T., Vollan, B., & Wutich, A. (2011). The challenge of understanding decisions in experimental studies of common pool resource governance. Ecological Economics, 70(9), 1571–1579. [doi:10.1016/j.ecolecon.2011.01.011]
BALAFOUTAS, L., Nikiforakis, N., & Rockenbach, B. (2014). Direct and indirect punishment among strangers in the field. Proceedings of the National Academy of Sciences, 111(45), 15924–15927. [doi:10.1073/pnas.1413170111]
BALLIET, D. (2010). Communication and cooperation in social dilemmas: A meta-Analytic review. Journal of Conflict Resolution, 54(1), 39–57. [doi:10.1177/0022002709352443]
BOCHET, O., Page, T., & Putterman, L. (2006). Communication and punishment in voluntary contribution experiments. Journal of Economic Behavior & Organization, 60(1), 11–26. [doi:10.1016/j.jebo.2003.06.006]
BOWLES, S. (2008). Policies designed for self-Interested citizens may undermine “The Moral Sentiments”: Evidence from economic experiments. Science, 320(5883), 1605–1609. [doi:10.1126/science.1152110]
BROSIG, J., Weimann, J., & Ockenfels, A. (2003). The effect of communication media on cooperation. German Economic Review, 4(2), 217–241. [doi:10.1111/1468-0475.00080]
DECARO, D. A. (2019). 'Humanistic rational choice: Understanding the fundamental motivations that drive self-organization and cooperation in commons dilemmas.' In B. Hudson, J. Rosenbloom, & D. Cole (Eds.), Routledge Handbook of the Study of the Commons (pp. 117–131). New York, NY: Routledge. [doi:10.4324/9781315162782-10]
DECARO, D. A., Janssen, M. A., & Lee, A. (2021). Motivational foundations of communication, voluntary cooperation, and self-Governance in a common-Pool resource dilemma. Current Research in Ecological and Social Psychology, 2(10001), 6. [doi:10.1016/j.cresp.2021.100016]
FEHR, E., & Schmidt, K. M. (1999). A theory of fairness, competition, and cooperation. Quarterly Journal of Economics, 114(3), 817–868. [doi:10.1162/003355399556151]
FISCHBACHER, U., Gächter, S., & Fehr, E. (2001). Are people conditionally cooperative? Evidence from a public goods experiment. Economics Letters, 71(3), 387–404. [doi:10.1016/s0165-1765(01)00394-9]
HARDIN, G. (1968). The tragedy of the commons. Science, 162(3859), 1243–1248. [doi:10.1126/science.162.3859.1243]
JANSSEN, M. A., Holahan, R., Lee, A., & Ostrom, E. (2010). Lab experiments for the study of social-ecological systems. Science, 328(5978), 613–617. [doi:10.1126/science.1183532]
JANSSEN, M. A., Radtke, N. P., & Lee, A. (2009). Pattern-oriented modeling of commons dilemma experiments. Adaptive Behaviour, 17, 508–523. [doi:10.1177/1059712309342488]
JANSSEN, M. A., Tyson, M., & Lee, A. (2014). The effect of constrained communication and limited information in governing a common resource. International Journal of the Commons, 8(2), 617–635. [doi:10.18352/ijc.473]
OSTROM, E. (1990). Governing the Commons: The Evolution of Institutions for Collective Action. Cambridge, MA: Cambridge University Press.
OSTROM, E. (1998). A behavioral approach to the rational choice theory of collective action. American Political Science Review, 92(1), 1–22. [doi:10.2307/2585925]
OSTROM, E., Walker, J., & Gardner, R. (1992). Covenants with and without a sword: Self-Governance is possible. American Political Science Review, 86(2), 404–417. [doi:10.2307/1964229]
STONEDAHL, F., & Wilensky, U. (2010). BehaviorSearch. Center for Connected Learning and Computer Based Modeling, Northwestern University, Evanston, IL. Available at: http://www.behaviorsearch.org.
YAMAGISHI, T. (1986). The provision of a sanctioning system as a public good. Journal of Personality and Social Psychology, 51(1), 110–116. [doi:10.1037/0022-3514.51.1.110]
YANG, Y., Onderstal, S., & Schram, A. (2016). Inequity aversion revisited. Journal of Economic Psychology, 54, 1–16. [doi:10.1016/j.joep.2015.12.009]