Deriving an Opinion Dynamics Model from Experimental Data

, ,
and
Department of Psychology, University of Limerick, Ireland
Journal of Artificial
Societies and Social Simulation 25 (4) 4![]()
<https://www.jasss.org/25/4/4.html>
DOI: 10.18564/jasss.4947
Received: 13-Oct-2021 Accepted: 26-Sep-2022 Published: 31-Oct-2022
Abstract
Opinion dynamics models have huge potential for understanding and addressing social problems where solutions require the coordination of opinions, like anthropogenic climate change. Unfortunately, to date, most of such models have little or no empirical validation. In the present work we develop an opinion dynamics model derived from a real life experiment. In our experimental study, participants reported their opinions before and after social interaction using response options “agree” or “disagree,” and opinion strength 1 to 10. The social interaction entailed showing the participant their interaction partner’s agreement value on the same topic, but not their certainty. From the analysis of the data, we observed a very weak, but statistically significant influence between participants. We also noticed three important effects. (1) Asking people their opinion is sufficient to produce opinion shift and thus influence opinion dynamics, at least on novel topics. (2) About 4% of the time people flipped their opinion, while preserving their certainty level. (3) People with extreme opinions exhibited much less change than people having neutral opinions. We also built an opinion dynamics model based on the three mentioned phenomena. This model was able to produce realistic results (i.e. similar to real-world data) such as polarization from unpolarized states and strong diversity.Introduction
The importance of deriving the micro-dynamic rule
The modern world faces some serious threats which are dependent on people’s opinions and behavior (e.g., climate change and trust in vaccines; De Figueiredo et al. 2020). Opinion dynamics models are agent-based models with a huge potential for addressing these problems, as they could allow us to study how people are influenced by others and how they update their own opinions. While many of these models have been intensively studied from a theoretical standpoint, unfortunately, to date, most of them have little to no experimental validation (Flache et al. 2017). This limits their usefulness for real-world applications, such as predicting the future states of a system or estimating the risk of certain opinions becoming more popular (e.g., anti-vaccine opinions; De Figueiredo et al. 2020; Carpentras et al. 2022).
This does not mean that there is no evidence supporting these models. Indeed, most models are grounded on psychological theories and effects (Flache et al. 2017) such as homophily (Lazarsfeld & Merton 1954; McPherson et al. 2001; Wimmer & Lewis 2010), confirmation bias (Nickerson 1998) and social judgement theory (Sherif & Hovland 1961). For example, homophily is the idea that people tend to like more (and so be more influenced by) people who are similar to them, which is at the core of many opinion dynamics models (Flache et al. 2017).
While this may be a sound basis for identifying model mechanisms for opinion dynamics, it does not tell us quantitatively how the opinion will be affected. These precise dynamics are specified in a model by what are usually called “micro-dynamic rules” (sometimes also referred to as "influence-response functions"; Lopez-Pintado & Watts 2008) which precisely and quantitatively specify (1) how people interact and (2) what happens to personal opinions when they do. Because of that, it is usually represented as an equation (Castellano et al. 2009), or, for more complex models as a system of equations (Duggins 2017). In this way, the value of the opinion after the interaction can be obtained from the value of opinion before the interaction and from other variables that the model may consider. Despite the key role of micro-dynamic rules in model dynamics, there are very few studies focused on developing an ABM of opinion dynamics from experimental data.
Indeed, many studies in psychology or social media studies have approached the problem of how people form and change opinion (Andreoni & Mylovanov 2012; Bond et al. 2012). While these works are usually strongly empirically grounded, they approach data collection and analysis more in the light of statistical modelling, thus making them not ideal for simple opinion dynamics models, such as the Deffuant model (Deffuant et al. 2001) or the voter model (Liggett 1999). Alternatively, some models have been developed from more robust psychological theories (Gerard & Orive 1987; Nowak et al. 1990), however these models are much more complex to study than the most popular models in opinion dynamics.
In this work, we want to develop a simple opinion dynamics model on novel topics directly from quantitative opinion change in experimental setting. The agent-based model will be similar to the Deffuant or Hegselmann-Krause models (Deffuant et al. 2001; Hegselmann et al. 2002), thus having simple rules, a few parameters and a simple dynamics, as opposed to other more complex models, such as Duggins (2017). To do so we designed an experiment which could allow us to measure opinions similarly to how they have been modeled in many opinion dynamics models.
In the next subsections we will explore better the derive of the micro-dynamic rule and other works which attempted this derivation. This will allow us to better define some research questions in the following sub-section. We will also dedicate section 2 to explaining the importance of novel attitudes and their difference to non-sensical statements. Later, in Section 3, we will explain our experimental setup and the finding from the data analysis. Then, in Section 4, we will introduce the agent-based model derived from the experiment, together with its properties. Finally, in Section 5, we summarize our results and discuss possible future studies.
The derivation of the micro-dynamic rule
Before analyzing studies deriving the micro-dynamic rule, it is better to first have a look at how people interact in real life. For example, they may discuss at a formal meeting, or maybe in a bar with some friends. They may also interact via text message or even just by “liking” a post on Facebook. In each of these cases, people interact in very different ways. This is even beyond the verbal versus non-verbal distinction, as every interaction is different in nature. Thus, we do not expect that a single experiment or model will be able to summarize all varieties of interaction. Instead, we expect to observe different types of dynamics depending on the kind of interaction we select. Notice also that we cannot have a model which is the "the best" or "the most accurate" in general. But models can be "good" or "accurate" depending on the type of interaction under study.
A second distinction regards the way we measure opinions. Unfortunately, there is no “unit of measurement” for opinions, meaning that any given opinion can be measured in many possible ways (Pfeffer et al. 2014). For example, one may ask "where would you place yourself on the left-right scale?" (ESS 2021). Alternatively, we can assess this construct by asking several questions on topics relative to political values, such as abortion and immigration, and combine them together into a single score (Everett 2013). The possible ways to capture opinions are countless and, unfortunately, choosing a different measurement may change the model’s dynamics and, consequently, also its predictions. Indeed, it has been shown that by changing how opinion is measured it is possible to turn one model into another (and so with different micro-dynamic rules; Schroeder & Yitzhaki 2017; Carpentras et al. 2020).
Similarly, the use of different measurements of “trust in vaccines” in different works results in the impossibility to directly compare their results (De Figueiredo et al. 2020). Indeed, there is not a single way to measure trust in vaccination (e.g., asking a single question, or averaging over multiple ones.)
The problem of using different scales while studying dynamic models (such as in ABM) is that in general they may produce also different dynamics behavior. Indeed, it is theoretically possible for people to change their opinion on gun control, while preserving their opinion on the left-right spectrum (or vice versa). If this happens, by using the combined score (i.e., measurement 2) we will observe some opinion change, while by using the single-item measure we would observe preservation of the original opinion. These issues can usually be ignored in purely theoretical agent-based models but become critical when aligning models with empirical data (Schroeder & Yitzhaki 2017).
Consequently, when performing a study on the micro-dynamic rule, we should be extremely careful about (1) how people interact and (2) how do we measure opinions, since each of this will affect the dynamic we will observe.
Previous empirically based opinion dynamics models
As just discussed, when deriving the micro-dynamic rule, one of the main challenges consists in converting real opinions into numbers. A smart way to perform this measurement has been found in the work of Moussaïd et al. (2013) and Chacoma & Zanette (2015) where they directly asked to the participant to report a numerical value. For example, two questions were: “How deep is the Baltic Sea at its deepest point (in meters)?” and “How many gold medals were awarded during the Olympics in China in 2008?”
Notably, these questions all have a correct answer. This is quite different from topics such as gun control or immigration for which it is not possible to identify what is right and what is wrong (unless we use a specific moral system). Indeed, many people will change their answer on the depth of the Baltic Sea if we tell them that the right answer is 459 m. But we do not expect people to change their opinion on gun control if we tell them that their answer was wrong. Because of this, we will refer to statements that are either correct or incorrect as "empirical statements," to differentiate them from the "normative" opinions.
A study which measures normative opinions was performed by Takács et al. (2016). In this study, the survey asked participants to provide a number between 0 and 100 in sentences such as: “the warning signs on cigarette boxes should cover 0…100 percent of the box total surface.” Or also: “0…100 percent of immigrants who come to the Netherlands for economic reason should receive a residence permit.”
Interestingly, Takács found that people tended to have only attractive forces; meaning that they tend to move to the opinion of the person they interacted with. Furthermore, this study did not find any evidence of bounded confidence. This means that people with extreme opposite views will still move towards each other. However, this also raises the well-known question of why, then, we observe diversity in our society instead of all people converging to the same opinion (Axelrod 1997).
Another fundamental property of the study of Takács et al. (2016) lies in the fact that people were forced by the experiment to express their opinion as a number. While this made extremely easy to place people’s opinions on a single axis, this would be an uncommon way to interact in daily life. Indeed, people frequently interact on such topics using natural language, sharing posts or “reactions” on social media, but rarely using numbers. For example, regarding immigration, it is common to see people being positive or negative about it. People could also argue for nuances, like allowing only children, or only women, but it is extremely rare to observe statements about the numerical percentage of immigrants that should be allowed.
Research questions
In this article, we experimentally test social influence in a way that can easily be transported into an opinion dynamics model. Contrary to studies which focus on empirical statements, here we study normative opinions. Furthermore, agreement and disagreement on a topic are expressed by selecting the relative option instead of using numbers. This setup is someway similar to the influence generated by scrolling through social media and observing that a stranger endorsed a specific opinion.
The analysis of this experiment and model can be further expanded into the following research questions. For the experimental setup:
- What is the effect of social influence on participants?
- How does the opinion at time 2 depend on the opinion at time 1?
- Do people with higher certainty change their mind as much as people with lower certainty?
Regarding the simulations:
- Is the model capable of producing polarization? If so, what is its driving force?
- Is the model capable of producing strong diversity? If so, what is its driving force?
Where S1 and S2 are based on E1-3. In the next sections we will explore these questions providing insight on both the experiment and the opinion dynamics model.
Difference Between Novel Attitudes and Non-Sensical Statements
Attitudes in this study consisted of participant’s agreement or disagreement with “novel statements.” By ‘novel’ we refer to the fact that opinions on the subjects we present are not associated with the self or with existing social categories or social groups. This novelty is important for the internal validity of the experiment. In particular, it is necessary to reduce the impact of preconceived or “external” social consensus. For example, a participant may perceive that the majority of their social group likes cars. Therefore, the opinion of a random participant on the topic of cars will hold less weight in comparison to another participant who has no knowledge of any social consensus around cars. The 6 novel attitude statements used in this study were selected from previous research (Maher et al. 2020). Maher et al. (2020) established the “novelty” of a series of carefully constructed statements consisting of novel and innocuous statements like “Circle is a noble shape” that the participants are very unlikely to have any previous experience of. The statements were selected from a larger pool pilot based on their low level of importance and consensus across participants (i.e., participants rated these topics as topics of low importance).
Furthermore, we can notice how novel attitudes have been designed to not relate to any personal factor or identity. Besides higher internal validity, this also allows us to process data from different novel attitudes together (e.g., by averaging them). This operation would have been more complex in the case of established attitudes, as, for example, we do not know if people’s behavior on immigration would be the same as the behavior on gun control.
Some readers here may be confused by the concept of a “novel attitude” and think that it is equivalent to a non-sensical statement. For example, in his debate with Skinner on the nature of language, Chomsky famously used the phrase “colourless green ideas sleep furiously” as an example of a grammatically correct but non-sensical statement. Similarly, Carnep used “Caesar is a prime number” as an example of a meaningless statement.
In the following lines, we will empirically show that novel attitudes are clearly different from non-sensical or meaningless statements. Before that, we should clarify some fundamental distinctions between the field of logic and opinion dynamics. Indeed, very similar problems have been studied already in logic, thus it is almost natural for many readers to draw a parallel with principles in this field. However, the two fields have very different goals and deal with quite different problems and statements. Indeed, many logic systems require statements to be either true or false (Stebbing 2018) as even a single statement which is both true and false will compromise the entire system. On the contrary, opinion dynamics deals with opinions, where the main requirement is that people are able to express a meaningful personal opinion on the subject independently on their true value (which may even not exists).
This can be better understood by observing, for example, that people have no issue in discussing which is “the most beautiful equation” (Quora 2011). Indeed, it looks like quite a strong consensus has formed around the fact that “Euler’s equation is the most beautiful equation,” (Wikipedia 2021) even if this statement may appear meaningless to several other people. Therefore, our main goal with novel attitudes is not to show that they can be used in a coherent logic system. Instead, we want to show that people generally believe they can make sense of them and that it is possible to express an opinion on the subject.
To confirm this hypothesis, we compared two novel statements (“Circle is a noble shape” and “Doors are charming”) with the two previously mentioned meaningless/nonsensical statements (“Colourless green ideas sleep furiously” and “Caesar is a prime number”). For each statement we ask 60 participants: (1) how much the statement made sense on a scale 0 to 100 and (2a) if it was possible to give an opinion, (2b) if it was possible to give a correct answer or (2c) none of the two (only one of the three possibilities could be chosen for question 2).
Results show a clear distinction between novel attitudes and nonsensical. Specifically, the meaningfulness of the Doors (\(mean = 56\), \(SD = 5\)) and Circles (\(mean = 44\), \(SD = 4.8\)) statements was significantly higher (\(p < .00001\)) than the meaningfulness of the Caesar (\(mean = 12\), \(SD = 3.5\)) and Colourless green (\(mean = 4.9\), \(SD = 2.2\)) statements. Furthermore, for novel attitude statements the strong majority selected that it is possible to express an opinion (Doors: 91%; Circles: 77%), but for the Caesar and Colorless green statements this option was selected only by a minority of people (respectively, 11% and 26%). Also in this case the difference was significant (\(p < 0.00001\)).
This shows us that people do not approach novel attitudes in the same way as they approach non-sensical statements. Indeed, they feel that the first are more meaningful and that, unlike non-sensical statements, it is possible to have an opinion about them.
Since some novel attitudes have been designed to be as independent as possible to other identity traits, they can be thought as an abstraction of more common attitudes. This is similar to behavioral experiments, where participants are asked to play games which abstract from some kind of everyday behavior.
Attitude Experiments
Participants and design
We recruited participants through Prolific, an online participant recruitment site, and they took part in exchange for £1.00 each. The final total sample (N=365, Age: 18 - 69, M=31.08, SD=11.39 Gender: male 160, female 205, other 0) consisted of fluent English speakers. Study instructions informed participants that the survey involved “working alongside others in real time to learn about each other’s attitudes on a range of different topics.” They were also informed that participation involved engaging in decision-making tasks.
The study had a within-subjects design. Participants reported each of their attitudes before and after exposure to a fellow participant’s attitude. For each attitude they reported, participants were randomly presented with either a consistent or an inconsistent response from an anonymous fellow-participant (i.e., if the participant answered ‘agree’ the anonymous answer shown was “agree” in the consistent, or “disagree” in the inconsistent condition). A subgroup (N=94, Age: 18 - 53, 25.96, SD = 7.76 Gender: male 58, female 36, other 0) was "designated" as control group. The procedure for the control group was the same as the experimental group, except that the step exposing them with a fellow participant’s attitude was not included.
Materials and procedure
To begin, participants read the information sheet provided and gave informed consent to the processing of their data. After this, participants reported demographic information such as age, gender and Academic Prolific ID. Embedded within the study was an attention check that asked participants to select the word “yes” among a series of possible responses.
All participants in the experimental group were shown a page that explained to them that they were about to enter an online lobby with other participants and soon they will be rating and sharing attitude statements with other participants in real time. Upon entering the online group lobby, participants were greeted with a loading gif which stated ‘Please wait for other participants to join the lobby’ underneath it. Participants were made to believe a participant had joined the online group lobby prior to them, followed by another participant seconds later. The participants had to wait a further 12 seconds until they were informed all 6 participants had joined the group and they could press next to view the first attitude statement. The participants IDs were displayed as well as their status (i.e., “Participant_117: Joined”). All participants were led to believe they were in an online group session for the purpose of attitude sharing. Each participant was given the choice to report either “agree” or “disagree” in response to a given attitude statement, before reporting how certain they were of this view on a scale of 1 (Not at all) to 10 (Very certain). Participants were asked to make a note of their own answers. Notice that the "Agree" and the "Disagree" option were further apart and they were presented always in the same position (i.e., Agree on the left and Disagree on the right), so that they could not be mistaken by the respondent.
After reporting an attitude position and certainty score, participants were thanked and asked to wait for the other participants to complete the task. Participants were then shown the bogus-participant’s answer as either ‘Agree’ or ‘Disagree’ (e.g., "Participant_117: Agrees with this statement"). Notice that the answers provided by the bogus participant are exactly the same as those that another real participant would have provided as participants could only agree or disagree. Thus the use of a bogus participant does not result in unrealistic answers, nor can the participant identify that she is not interacting with a real person. The participant was then asked to confirm if the displayed position was consistent or inconsistent with their own.
After ostensibly viewing the response of a fellow participant, a very simple puzzle was presented. This acted as a simple delay before participants reported their attitude position and certainty for a second time. This delay provided time for attitude change to take place. The above procedure was repeated for all 6 attitude statements presented in a randomized order. The influence on each attitude statement was provided by a different bogus participant (i.e., the 6 initial bogus participants of the lobby). Finally, participants read a closing statement debriefing them on the nature of the study.
The same procedure was used also for the control group, with the exception that all the interactions with other participants were avoided. This research study has received ethical approval from the University of Limerick, Education and Health Sciences Research Ethics Committee (19_06_2019).
Results from the data analysis
In order to produce a continuous opinion (similarly to the one used in the Deffuant et al. 2001 or Hegselmann et al. 2002 model) we combined agreement and certainty. Specifically, we encoded the agreement to each statement as “agree”\(= +1\) and “disagree”\(= -1\). Certainty, instead, has been obtained by taking the numerical value representing how certain the participant was and dividing it by 10. Thus, certainty ranges from 0.1 to 1 in steps of 0.1. Finally, the opinion was obtained as the product between agreement and certainty. Thus, as a number ranging between -1 and 1 in steps of 0.1 (except between 0.1 and -0.1 where there is a gap of 0.2). Notice that, even if we collected the certainty of the person as a number, participants were exposed only with “agree” or “disagree.” Meaning that they would not know the certainty of the other (bogus) participant and that during the interaction they will only deal with words and not numbers. This is similar to many types of social interaction, including seeing someone’s “like” on a social media post.
Before aggregating the data from the questions, we analyzed them separately. From Figure 1 it appears that 5 out of the 6 questions had relatively symmetric distributions, meaning that the number of agreement and disagreement is rather balanced. However, one of them seemed to have most of the people disagreeing (i.e., negative opinions). To analyze this difference quantitatively we introduced the asymmetry coefficient as:
| \[ \alpha = \frac{\max{[N_+,N_-]}}{N_++N_-}\] | \[(1)\] |
Table 1 show us that while 5 attitudes have \(\alpha\) between 0.59 and 0.67, the last one has a value of 0.86. We cannot be sure of why people behaved differently in this attitude, but we suspect it is because it was the only question containing a negation. Because of that, we decided to remove the question from the analysis and keep only affirmative sentences. However, as it can be seen in the supplementary material, including it into the analysis will have a very minor change on the experimental results and the model.
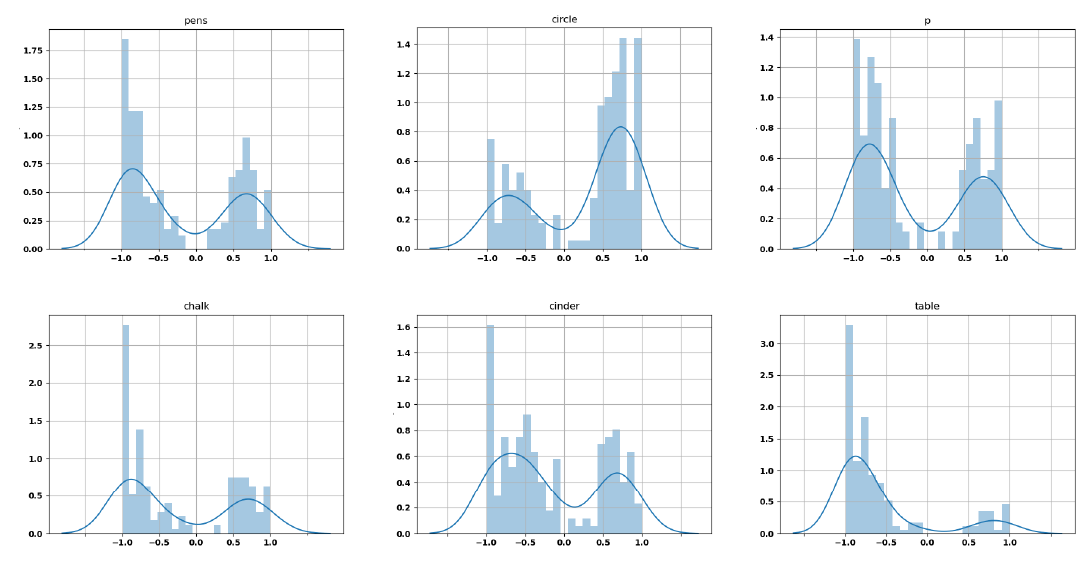
| Pens | Chalk | Letter p | Cinder | Circle | Table |
|---|---|---|---|---|---|
| 0.59 | 0.62 | 0.59 | 0.63 | 0.67 | 0.86 |
We also tested if the exposure of agreement or disagreement had an effect on the participant (i.e., social influence, research question E1). From the analysis we observed that this result was statistically significant, but also extremely small. Indeed, people exposed with “agree” showed an average shift of their opinion of +0.036, while people exposed with “disagree” showed a shift of -0.031. In both cases the standard error was below 0.015, producing a p-value \(< 0.05\). The small size of this effect is most likely due to the weakness of the social exchange. However, this does not mean that people were not changing their opinion. Indeed, as we will discuss soon, the average change of opinion was one order of magnitude bigger (i.e., 0.3 compared to 0.036).
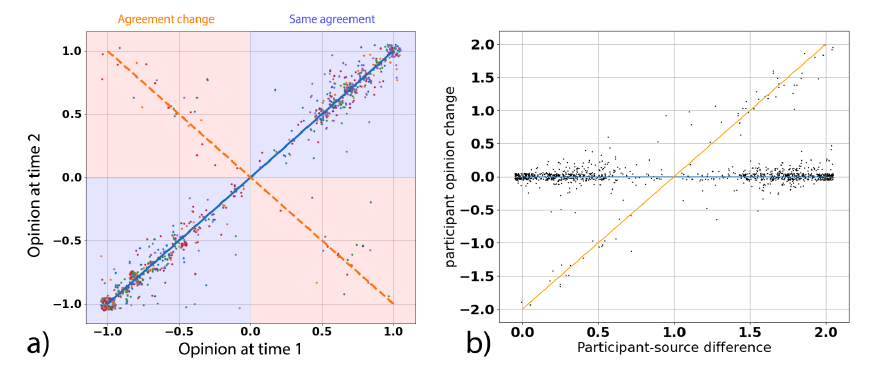
An interesting result about this dynamic behavior comes from the shape shown in Figure 2a. In this graph we represented people’s opinion at time 2 versus their own opinion at time 1 (research question E2). Points laying on the diagonal passing though quadrants 1 and 3 (coloured in blue) represent the cases of people not changing their opinion (i.e., Op1 = Op2). The opposite diagonal, instead, (orange quadrants in Figure 2a) represent people which flipped their own opinion (i.e., Op1 = -Op2). Meaning that they changed their agreement but preserved their certainty.
We are not surprised that most of the dynamics is around the main diagonal. Indeed, most opinion dynamics models suppose that people will stay in the range of their initial opinion. For example, in the Deffuant model, if a person with opinion 1 interacts with a person with opinion -1 (suppose \(\varepsilon\) = 2) at maximum she will move to 0 and no further (Deffuant et al. 2001). All the other possible interactions will produce an even smaller movement, keeping the agent close to her initial opinion. This result is further confirmed by the strong correlation between opinions at time 1 and at time 2. Indeed, we find a correlation coefficient of \(r = 0.927\), \(p < .0001\), showing also that opinions are not random.
However, in the data we collected, people were either staying close to their original opinion (as expected) or directly “jumping” to the opposite one. Furthermore, this jumping happened independently from the exposure we used (i.e., either agreement or disagreement). Meaning that a person which expressed agreement with certainty 1, may switch to “disagree” with certainty 1, even if she was exposed with “agree.” This can be also observed in Figure 3a and 3b where we showed the same graph as Figure 2a separately for people exposed with agreement and people exposed with disagreement.
To our knowledge, this behavior is completely new for the opinion dynamics literature. Indeed, even models that add noise constantly in time (Pineda et al. 2013) would expect people to randomly move either around their initial opinion or to choose a random point in the opinion space. This would mean that the probability distribution of the opinion at time 2 (Op2) would be either uniform, or unimodal centered in Op1 (or, eventually, a combination of the two). However, in our data it appears to roughly be bimodal with a local maximum in +Op1 and the other in -Op1.
This "flipping behavior" happened only 4% of the time and, probably, it would not appear on more polarized topics. For example, we would not expect people to randomly flip their opinion on immigration or abortion. However, there are several topics which today are central in the public debate which were almost novel to most people up to some years ago (e.g., up to some years ago people were not often discussing about the possible dangers of vaccination, while now this is central in the public debate). Furthermore, as previously discussed, as every dynamic effect, it depends on the measurement we choose. Meaning that if we chose another way to measure opinions, probably we would not have observed such an effect.
For example, this effect does not seem to be present in the previously mentioned Takács et al. (2016) study. To confirm this distinction, we could plot the opinion change in terms of opinion difference (i.e., Op2-Op1) and distance between the interacting pair as done in Takács. However, as the interaction happened without revealing the certainty value it is not really possible to calculate this difference. Thus, just for the sake of making this comparison, we assume that agreement and disagreement are perceived by the real participant as having always maximal certainty (i.e., 10). Figure 2b shows that even with this type of plot, data points present a jump between two extreme behaviors: preserving the original opinion (blue line) and changing agreement while preserving certainty (orange line). Let us stress again that the difference in results between these two works should not be considered as a problem. Indeed, as previously mentioned, different measurements of the same phenomena may produce different dynamic behaviors.
To explore research question E3 we analyzed the relationship between certainty and average opinion change. Indeed, people who initially reported higher certainty were less prone to change this value at time 2. Numerically we calculated this value, that we called mobility, similarly to a standard deviation where the mean is substituted with the certainty at time 1. In formula:
| \[ m = \sqrt{\sum_{i,j} (c_{i,j}(t_2)-c_{i,j}(t_1))}\] | \[(2)\] |
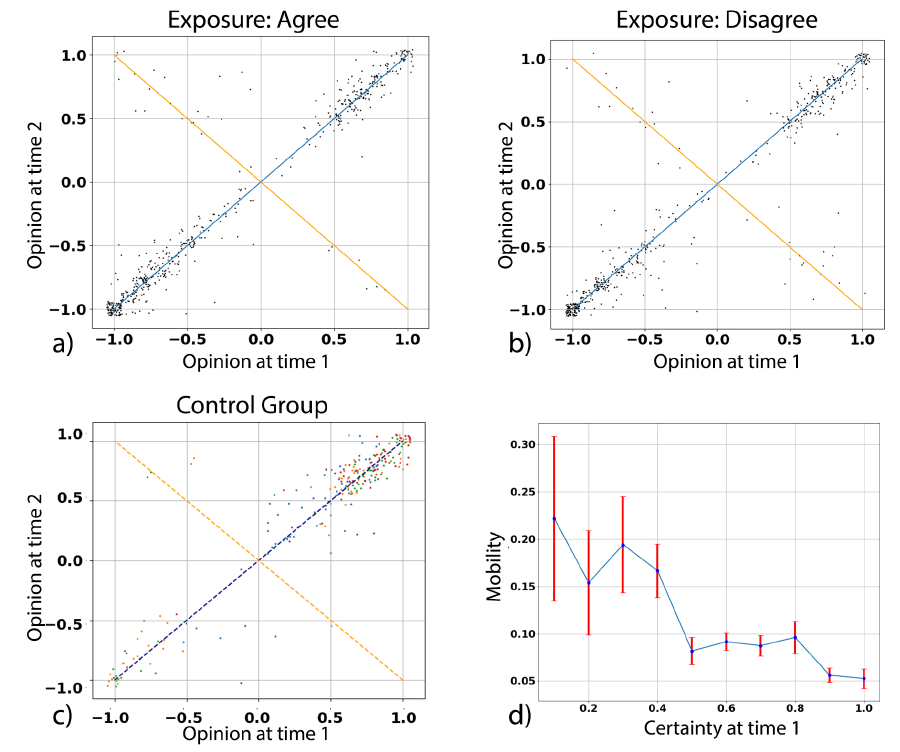
Here we would like to comment again that the data contained a rich dynamic, despite the very little shift due to social influence. Indeed, the average opinion change was 0.3, while the direct effect of social influence was a shift of roughly 0.03. This begs the question of why, then, we observe so much variation and if it is actually due to social influence. By analyzing the control group (which was not exposed with someone else’s opinion) we observe that the mean opinion variation is 0.25. Furthermore, in Figure 3c we can see the plot for opinion at time 2 versus the opinion at time 1 also for the control group. As it is possible to see, the plot still follows the X shaped pattern we discussed before. This means that, even if absence of social interaction, people still experience a very similar dynamics.
This is another crucial effect, as most models suppose that people will not update their opinion unless they are influenced by someone else to move their opinion into a specific direction (e.g., towards more positive values). Instead, here we see that simply the act of self-reflection (i.e., thinking about their own opinion on the topic) may be enough to elicit some dynamics.
For example, reading an-unbiased news article on vaccines may push the reader to think about her relationship with vaccines, health, doctors, needles, etc. As result, the reader may update her opinion on vaccination, even if no direct influence has been exerted. Furthermore, this dynamic is not totally random. Indeed, as discussed, we observed more change in people who expressed low, rather than high, certainty. As we will show in the next section, this is enough to produce a model which will produce polarization from unpolarized states.
Agent-Based Model
Model properties
We used the results from the data analysis to build an agent-based model of opinion dynamics. Specifically, we selected the three phenomena we highlighted in the previous section:
- Agents will initially move following the normally distributed random noise. Similar to the previous behavior, agents with certainty 0.1 will be affected by a noise of zero mean and standard deviation of 0.24 (equivalent to a mobility of 0.24). As certainty grows, this mobility value linearly decreases down to 0.05.
- At every interaction, agents will have a probability of 4% to flip their opinion (thus changing agreement level while preserving certainty).
- When an agent knows about someone else’s agreement value (i.e., either +1 or -1), she will move her opinion by a fixed amount of 0.03 in the direction of the other’s agreement value.
Notice here that, besides effect 2, effect 1 may also generate a change of sign in agents with certainty near zero. Their main difference is that effect 1 generates a random shift near the initial opinion, while effect 2 allows a direct jump toward the opposite opinion (e.g., from -0.8 to +0.8). For simplicity, in the model we assumed the steps between opinions not to be fixed to 0.1 but as fine as the machine precision. As we used floating points numbers in python for representing the opinion, this results in a spacing of \(2.2\) \(10^{-16}\); thus qualitatively continuous. While the floating point resolution has been identified as a potential problem for some specific models (Galán et al. 2009; Polhill et al. 2005) this is usually not the case with simple opinion dynamics models (Deffuant et al. 2001; Hegselmann et al. 2002). To verify this, we added the possibility to run the analysis specifying the resolution of the opinion. This will consist in rounding the opinions to the closest value. For example, if we set a resolution of 0.01 the value 0.447234 will be rounded to 0.45. For our test, we run the analysis both at maximal resolution and with a resolution of 0.001 without finding any difference in the model dynamics.
In the model we coded effect (1) by adding to the initial opinion a normally distributed random variable of standard deviation 0.24. This value was linearly decreased down to 0.05 for a certainty of 1, in agreement with the data (effect 1, Figure 3c). To avoid adding additional noise (and thus artificially inflate the data variance) we coded effect 3 as just a fixed shift.
For each model run, we initialize the opinion from a specific distribution (e.g., normal or uniform). Then for each iteration, the code executes the following steps in the following order:
- It selects a random pair of agents.
- Agent 1 shifts her opinion in a random direction using the previously discussed normally distributed variable (effect 1).
- With a probability of 4% agent 1 changes the sign of her own opinion (effect 2) unless the change already happened due to effect 1.
- Agent 1 shifts her opinion in the direction of agent 2 by 0.03 (effect 3).
- If the opinion is above 1 or below -1 it is rounded to the closest acceptable value (i.e., either +1 or -1).
These iteration steps are repeated for 100,000 times.
Results
Figure 4a shows the same plot of Figure 2a (thus, Op2 versus Op1) for the simulations. This plot appears to be qualitatively similar to the one of the real data (Figure 2a), showing that the simulated dynamics mimics well the real dynamics.
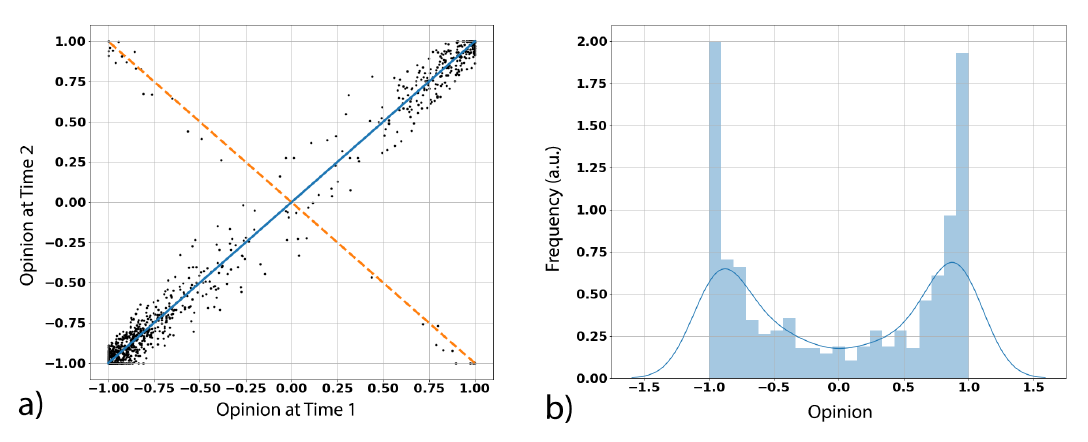
Figure 4b shows the models convergence after 100,000 iterations for 1,000 agents. We obtain this result almost independently from the initial distribution. Indeed, we tested several of them: uniform distribution, normal distribution centered in 0, bimodal with maxima in 0.5 and -0.5 and Dirac delta function (i.e., all agents in the same position) centered in 0.
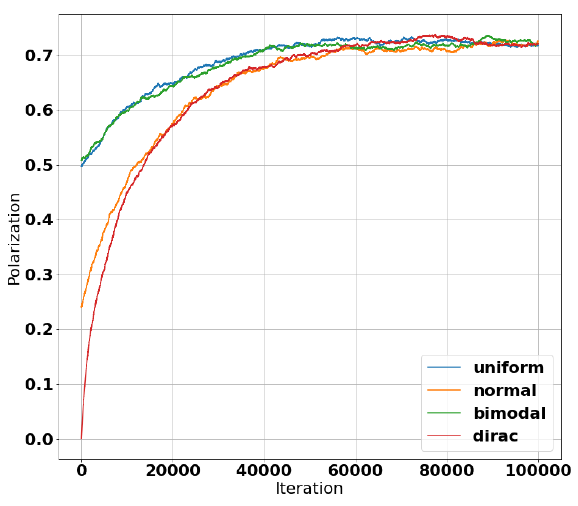
We confirmed this result (and thus explore research question S1) by analyzing polarization for different initial distributions. We calculated polarization as mean of the absolute value of the opinion. In formula:
| \[ p = Mean (|Op|)\] | \[(3)\] |
Figure 5 shows the value of polarization in time for different initial opinion distributions. As it is possible to see, even if they start with different levels of polarization, they all "dynamically converge" to the same value.
The stability of the polarization pattern is mostly due to the property of the random fluctuations. Indeed, the mobility is bigger when opinion is close to 0, making these agents more likely to move to the sides. However, when they reach the side, their mean movement is strongly decreased, increasing the time they will spend on the extremes.
We also tested the model without social influence (thus equivalent to people just self-reflecting) and obtained results indistinguishable from the previous case. This means that even if social influence is present in the model, its effect is hidden by strength of the random fluctuations. Even if this result is mostly due to the properties of random movements, it still shows three features which are quite rare for opinion dynamics models.
The first one is that the model produces polarization from unpolarized states and without using repulsive forces. Indeed, repulsive forces (i.e., the fact that two agents may push each other to opposite extremes) have been criticized to lack experimental evidences (Flache et al. 2017; Mäs et al. 2013). Thus, a common challenge in opinion dynamics has become producing polarized states without including repulsive effects in the model.
Another important feature regards what is sometimes called “strong diversity” (Duggins 2017) (research question S2). Indeed, one of the main problems in comparing results from opinion dynamics models to the real data, lays in the fact that they usually do not produce realistic distributions. Instead, in many models, opinion distributions have a comb shape in which all people have the same two or three opinions (e.g., -1, 0 and +1) and nobody holds the opinions in between (e.g., 0.4).
The third interesting feature may be referred as “dynamic convergence.” Indeed, while many models converge to a static pattern, in this model the distribution keeps showing some minor changes. This is due to the nature of the fluctuations, which eventually will keep introducing small changes in the distribution. However, even after 1 million iterations we did not observe any relevant qualitative change. This means that, similarly to the real-world data, the system does not freeze into a static distribution while often remaining stable.
Conclusions
In this article we analyzed people’s opinion dynamics both experimentally and by developing an agent-based model. Due to its nature and weak effect, this interaction is someway similar to the one that people may experience by observing the endorsement of a certain opinion by a stranger on social media. Furthermore, since we chose novel attitudes, the person being influenced should not already have a strong opinion on the topic.
The experimental setting showed to us three fundamental phenomena:
- Self-reflection is enough to produce opinion change.
- People have a small probability of flipping their opinion (while roughly preserving their certainty).
- People with a lower level of certainty experience a bigger change of opinions.
We implemented these phenomena in an agent-based model of opinion dynamics. Here the model exhibited three interesting features: polarization, strong diversity and dynamic convergence. This means that the result of this model appears more similar to real life distributions than most of the models in the literature.
It is important to notice that this work does not represent a conclusive or universally generalizable solution for experimentally analyzing the micro-dynamic rule. Indeed, in this study we used a very specific setup and a specific way to measure opinions. Different dynamic behaviors may appear by changing one of the two. Indeed, each one of the previous works which used different ways to measure opinions observed different effects (Moussaïd et al. 2013; Takács et al. 2016).
While changing the experimental setting will enrich the literature, we should be careful in changing the way opinions are measured. This is because, using a new measurement for a new experiment will make it incomparable to previous studies. Indeed, even if two scales measure the same opinion, they may have different properties and in general the relationship between the two would be non-linear (Krantz et al. 1971; Stevens 1951; Stevens 1946).
Another important question regards what happens after several interactions. Indeed, in our model we assumed that the topic will keep being novel forever. However, some topics (such as vaccination’s side effects) started in the public domain as almost novel and then become progressively more well known. Therefore, we do not expect these dynamic features (such as the possibility of flipping opinion) to hold even when a topic becomes more established. This kind of dynamic behavior should be studied and understood to produce progressively more realistic models and predictions.
Similarly, it is important to notice that our work was based on novel attitudes. However, while some topics may be totally new when they are presented the first time to an individual (e.g., "what is the most beautiful equation" or "cryptocurrency") they may rapidly get incorporated into cultures. We realize that new concepts are continuously entering our culture, on which people may ultimately need to have an opinion. For example, on the day of writing this sentence, a Wikipedia page was created describing the Pink Peacock Café: "the only queer Yiddish anarchist vegan pay-what-you-can café in the world" (Wikipedia 2022a). Prior to this moment, we did not have an opinion on the Pink Peacock Café, and did not expect to. While these novel attitude statements (currently) have no material consequences, and are thus different to many new concepts bubbling into society that we quickly need to form opinions on, such as “AstraZenca” (intending the vaccine for covid-19) or “Dogecoin,” it is also true that once opinions are formed on arbitrary statements such as these they can have material and social consequences. For example, enough people agree that four is an unlucky number that it is expunged from lift control panels, seating plans and addresses (Wikipedia 2022b). Since new concepts are bubbling into our culture all the time, it is important for opinion dynamics theory and models to consider how people come to have opinions on novel topics as well as established ones. Therefore in future works it will be interesting to see which kind of behavior we can expect when either established topics (e.g., "gun control") or partially-novel topics (e.g., a new vaccine).
Finally, it would be possible to explore also different effects in the data. For example: how do people behave when exposed to a person which agrees or disagrees with them? Or how does it change if the person belongs to the same or opposite political party? Or even, are other parameters, such as stubbornness, important for this type of dynamics? Many of these questions should be addressed in future research.
All of this shows that measuring the micro-dynamic rule appears to be a promising direction for opinion dynamics models, providing plenty of opportunities for the discovery of new effects. Thus, we want to conclude on a positive note, wishing that in the future, the literature will be enriched by plenty of studies on this phenomenon, and the possibility of easily applying these models to real-world applications.
Acknowledgements
This project has received funding from the European Union’s Horizon 2020 research and innovation programme under the Marie Skłodowska-Curie (grant agreement No 891347) and from the European Research Council (ERC) under the European Union’s Horizon 2020 research and innovation programme (grant agreement No. 802421). We would also like to thank Shane Moriarty from the University of Limerick, Ireland for helping with the data collection.Model Documentation
The code used for the simulations can be found at: https://www.comses.net/codebase-release/1a29e181-9a79-479c-926b-b717c3c6d904/.References
ANDREONI, J., & Mylovanov, T. (2012). Diverging opinions. American Economic Journal: Microeconomics, 4(1), 209–232. [doi:10.1257/mic.4.1.209]
AXELROD, R. (1997). The dissemination of culture: A model with local convergence and global polarization. Journal of Conflict Resolution, 41(2), 203–226. [doi:10.1177/0022002797041002001]
BOND, R. M., Fariss, C. J., Jones, J. J., Kramer, A. D., Marlow, C., Settle, J. E., & Fowler, J. H. (2012). A 61-million-person experiment in social influence and political mobilization. Nature, 489(7415), 295–298. [doi:10.1038/nature11421]
CARPENTRAS, D., Dinkelberg, A., & Quayle, M. (2020). A new degree of freedom for opinion dynamics models: The arbitrariness of scales. arXiv preprint. Available at: https://arxiv.org/abs/2010.04788.
CARPENTRAS, D., Lüders, A., & Quayle, M. (2022). Mapping the global opinion space to explain anti-vaccine attraction. Scientific Reports, 12(1), 1–9. [doi:10.1038/s41598-022-10069-3]
CASTELLANO, C., Fortunato, S., & Loreto, V. (2009). Statistical physics of social dynamics. Reviews of Modern Physics, 81(2), 591. [doi:10.1103/revmodphys.81.591]
CHACOMA, A., & Zanette, D. H. (2015). Opinion formation by social influence: From experiments to modeling. PloS ONE, 10(10), e0140406. [doi:10.1371/journal.pone.0140406]
DEFFUANT, G., Neau, D., Amblard, F., & Weisbuch, G. (2001). Mixing beliefs among interacting agents. Advances in Complex Systems, 3, 11. [doi:10.1142/s0219525900000078]
DE Figueiredo, A., Simas, C., Karafillakis, E., Paterson, P., & Larson, H. J. (2020). Mapping global trends in vaccine confidence and investigating barriers to vaccine uptake: A large-scale retrospective temporal modelling study. The Lancet, 396(10255), 898–908. [doi:10.1016/s0140-6736(20)31558-0]
DUGGINS, P. (2017). A psychologically-motivated model of opinion change with applications to American politics. Journal of Artificial Societies and Social Simulation, 20(1), 13: https://www.jasss.org/20/1/13.html. [doi:10.18564/jasss.3316]
ESS. (2021). European social survey. Available at: https://www.europeansocialsurvey.org.
EVERETT, J. A. (2013). The 12 item social and economic conservatism scale (SECS). PloS ONE, 8(12), e82131. [doi:10.1371/journal.pone.0082131]
FLACHE, A., Mäs, M., Feliciani, T., Chattoe-Brown, E., Deffuant, G., Huet, S., & Lorenz, J. (2017). Models of social influence: Towards the next frontiers. Journal of Artificial Societies and Social Simulation, 20(4), 2: https://www.jasss.org/20/4/2.html. [doi:10.18564/jasss.3521]
GALÁN, J. M., Izquierdo, L. R., Izquierdo, S. S., Santos, J. I., Del Olmo, R., Adolfo, L., & Edmonds, B. (2009). Errors and artefacts in agent-based modelling. Journal of Artificial Societies and Social Simulation, 12(1), 1: https://www.jasss.org/12/1/1.html.
GERARD, H. B., & Orive, R. (1987). The dynamics of opinion formation. Advances in Experimental Social Psychology, 20, 171–202. [doi:10.1016/s0065-2601(08)60414-1]
HEGSELMANN, R., Krause, U., & others. (2002). Opinion dynamics and bounded confidence models, analysis, and simulation. Journal of Artificial Societies and Social Simulation, 5(3), 2: https://www.jasss.org/5/3/2.html.
KRANTZ, D., Luce, D., Suppes, P., & Tversky, A. (1971). Foundations of Measurement, Vol. I: Additive and Polynomial Representations. Mineola, NY: Dover Publications. [doi:10.1016/b978-0-12-425401-5.50015-5]
LAZARSFELD, P. F., & Merton, R. K. (1954). 'Friendship as a social process: A substantive and methodological analysis.' In M. Berger, T. Abel, & H. Charles (Eds.), Freedom and Control in Modern Society (Vol. 18, pp. 18–66). New York, NY: Van Nostrand.
LIGGETT, T. M. (1999). Stochastic Interacting Systems: Contact, Voter and Exclusion Processes. Berlin Heidelberg: Springer. [doi:10.1007/978-3-662-03990-8_4]
MAHER, P. J., MacCarron, P., & Quayle, M. (2020). The likes that bind: Group identification and attitude strength. University College Dublin, UCD Politics Spring Seminar Series.
MÄS, M., Flache, A., Takács, K., & Jehn, K. A. (2013). In the short term we divide, in the long term we unite: Demographic crisscrossing and the effects of faultlines on subgroup polarization. Organization Science, 24(3), 716–736.
MCPHERSON, M., Smith-Lovin, L., & Cook, J. M. (2001). Birds of a feather: Homophily in social networks. Annual Review of Sociology, 27(1), 415–444. [doi:10.1146/annurev.soc.27.1.415]
MOUSSAÏD, M., Kämmer, J. E., Analytis, P. P., & Neth, H. (2013). Social influence and the collective dynamics of opinion formation. PloS ONE, 8(11), e78433.
NICKERSON, R. S. (1998). Confirmation bias: A ubiquitous phenomenon in many guises. Review of General Psychology, 2(2), 175–220. [doi:10.1037/1089-2680.2.2.175]
NOWAK, A., Szamrej, J., & Latané, B. (1990). From private attitude to public opinion: A dynamic theory of social impact. Psychological Review, 97(3), 362. [doi:10.1037/0033-295x.97.3.362]
PFEFFER, J., Zorbach, T., & Carley, K. M. (2014). Understanding online firestorms: Negative word-of-mouth dynamics in social media networks. Journal of Marketing Communications, 20(1–2), 117–128. [doi:10.1080/13527266.2013.797778]
PINEDA, M., Toral, R., & Hernández-García, E. (2013). The noisy Hegselmann-Krause model for opinion dynamics. The European Physical Journal B, 86(12), 1–10. [doi:10.1140/epjb/e2013-40777-7]
POLHILL, J. G., Izquierdo, L. R., & Gotts, N. M. (2005). The ghost in the model (and other effects of floating point arithmetic). Journal of Artificial Societies and Social Simulation, 8(1), 5: https://www.jasss.org/8/1/5.html.
QUORA. (2011). What is the most beautiful equation? Available at: https://www.quora.com/What-is-the-most-beautiful-equation.
SCHROEDER, C., & Yitzhaki, S. (2017). Revisiting the evidence for cardinal treatment of ordinal variables. European Economic Review, 92, 337–358.
SHERIF, M., & Hovland, C. I. (1961). Social Judgment: Assimilation and Contrast Effects in Communication and Attitude Change. New Haven, CT: Yale Univerity Press.
STEBBING, L. S. (2018). A Modern Introduction to Logic. London: Routledge.
STEVENS, S. S. (1951). Mathematics, Measurement, and Psychophysics.' In S. S. Stevens (Ed.), Handbook of Experimental Psychology (pp. 1–49). Hoboken, NJ: Wiley.
STEVENS, S. S., & others. (1946). On the theory of scales of measurement. Science, 103, 677–680.
TAKÁCS, K., Flache, A., & Mäs, M. (2016). Discrepancy and disliking do not induce negative opinion shifts. PloS ONE, 11(6), e0157948.
WIKIPEDIA. (2021). Euler identity. Available at: https://en.wikipedia.org/wiki/Euler%27s_identity.
WIKIPEDIA. (2022a). Pink Peacock. Available at: https://en.wikipedia.org/wiki/Pink_Peacock.
WIKIPEDIA. (2022b). Tetraphobia. Available at: https://en.wikipedia.org/wiki/Tetraphobia.
WIMMER, A., & Lewis, K. (2010). Beyond and below racial homophily: ERG models of a friendship network documented on Facebook. American Journal of Sociology, 116(2), 583–642. [doi:10.1086/653658]