Agent-Based Simulation of Land Use Governance (ABSOLUG) in Tropical Commodity Frontiers

and
Stanford University, United States
Journal of Artificial
Societies and Social Simulation 26 (1) 5![]()
<https://www.jasss.org/26/1/5.html>
DOI: 10.18564/jasss.4951
Received: 11-Jan-2022 Accepted: 25-Nov-2022 Published: 31-Jan-2023
Abstract
Well-designed land use governance that involves multiple stakeholders is crucial to reducing deforestation in tropical commodity frontiers. The effectiveness of different policy mixes is difficult to assess due to long implementation times and challenges to conducting real-world experiments. Here we introduce an agent-based simulation of land use governance (ABSOLUG) to examine the interactions among governments, commodity producers, and civil society and assess the impacts of different land use governance approaches on deforestation. The model represents a generic commodity producing landscape in the tropics with a central marketplace and features four groups of agents: largeholders, smallholders, NGOs, and a government. The objective of largeholders and smallholders is to generate profits through the production of commodity crops. Statistical evaluation through local and global sensitivity analyses shows that the model is robust, and few parameters show threshold behaviors. We used a hands-off and a proactive-government scenario to evaluate the model operationally. The hands-off scenario was inspired by high rates of tropical deforestation in the second half of the 20th century and the pro-active government scenario by a few recent cases of forest transition countries. The hands-off scenario led to quasi-complete deforestation of the landscape at the end of the simulation period. Deforestation in the proactive-government scenario decreased and eventually stopped in the second half of the simulation period, followed by reforestation.Introduction
Extraction of natural resources and production of agricultural commodities are key drivers of land use change in the tropics (Geist & Lambin 2002; Rudel et al. 2009). Tropical landscapes are complex social-ecological systems where multiple stakeholder groups interact with the environment and one another, often pursuing competing goals and interests (Ostrom 2009). To achieve environmental sustainability at scale in such systems, land use policies and governance interventions (henceforth governance interventions) must integrate the interests of all stakeholder groups (Lambin et al. 2020; von Essen & Lambin 2021). Increasingly, this is recognized in the formation of partnerships among private, public, and/or civil society actors whose success is dependent on the interplay, sequencing, and enabling conditions of individual land use policies (Furumo & Lambin 2020, 2021; Hsu et al. 2015, 2017). Assessing these multi-stakeholder governance interventions, however, is challenging due to their long implementation times, limitations to using true real-world experiments, and difficulties with natural experimental studies (Leatherdale 2019; Louie & Carley 2008). As a result, studies of governance interventions are frequently based on expert or stakeholder interviews for individual case studies, whose findings may be difficult to generalize. To develop a complementary approach to the study of governance interventions in tropical forest frontier systems, we developed an agent-based model to assess the impact of land use governance on forest cover change. Specifically, we are interested in the roles of the government, private sector, and civil society, and how their involvement changes the effectiveness of governance interventions like the designation of protected areas or zero-deforestation supply chains.
Deforestation in the tropics is a major contributor to global carbon dioxide emissions and estimated to transform tropical forests from sinks into sources of carbon dioxide (Baccini et al. 2017; Feng et al. 2022). In combination with the loss of biodiversity and ecosystem services, this has made tropical forest conservation a key objective of the international community which is manifested in the proliferation of international treaties, declarations, and commitments to reducing deforestation, in particular in relation to agricultural commodity production and timber extraction (Curtis et al. 2018; Furumo & Lambin 2020; Lambin et al. 2018). These measures cover a wide range of policy and governance interventions, involving private, public, and civil society stakeholders at local to global scales (Hsu et al. 2017; von Essen & Lambin 2021). Increasingly, attention is dedicated towards initiatives composed of public and non-public actors, such as public-private partnerships or jurisdictional approaches, as they are believed to include a beneficial combination of stakeholders at appropriate scales to address the challenge of deforestation (Lambin et al. 2020; Nelson 2013). While some initiatives, such as the “Produzir, Conservar, Incluir” project in Mato Grosso, Brazil (PCI Mato Grosso 2021), show a promising development, continuous assessment of these novel governance structures using a variety of methods remains important.
Computational models allow one to test assumptions about the processes and behaviors thought to govern social-ecological systems by creating simplified representations of these systems (Gilbert 2008). Users can design experiments by varying input parameters and observing output changes compared to an untreated system. Agent-based models are a type of computational model in which individual agents interact with their environment and one another according to user-defined rules, generating macro-level behaviors (e.g., forest cover change) by aggregating decisions at the individual level (e.g., a largeholder converting forest) (Louie & Carley 2008; Matthews et al. 2007). Agents can be human or non-human actors, elements of the environment, organizations such as companies, or entities such as governments. Agent-based models are therefore well-suited for studying land use governance in complex socio-ecological systems (Furtado et al. 2019; Matthews et al. 2007; Ostrom 2009) and have been used to develop facsimile, middle-range, and abstract models (Gilbert 2008). Abstract models help advance theory, demonstrate underlying processes of a system, and serve as bases for middle-range theories (Meyfroidt et al. 2018). Agent-based models are especially useful in systems where the connections between agent-level behavior and emergent macro-level behavior are not well understood or competing theories exist (Louie & Carley 2008).
Since their first implementation in the early 1990s, agent-based models have regularly been used to address issues around land use change (Matthews et al. 2007), covering themes like common-pool resource governance (Agrawal et al. 2013; Janssen 2020), telecoupling (Dou et al. 2020), or agricultural policy (Kremmydas et al. 2018). For example, the Land Use Dynamic Simulator (LUDAS) and SimPachamama explore the socio-ecological consequences of alternative policy bundles in the tropics (Andersen et al. 2017; Le et al. 2008). In both models, human agents are represented at the household level and interact with their environment under a set of policy constraints. LUDAS is calibrated with socio-ecological data from an upland watershed in central Vietnam and SimPachamama with rural household survey data from the Bolivian Amazon (Andersen et al. 2017; Le et al. 2008). To explore more deeply the interactions between a broader spectrum of stakeholders and the impact of alternative multi-stakeholder governance approaches on deforestation, we developed a model that also includes civil society and government agents where policies can endogenously change throughout the simulation. Here we present the agent-based simulation of land use governance model (ABSOLUG) to explore the impacts of land use governance on forest cover change in tropical commodity-production systems.
Modeling Approach and ODD+D Protocol
We developed ABSOLUG with the NetLogo multi-agent modeling software (Wilensky 1999) and described it using an adapted version of the ODD+ D (Overview, Design Concepts and Details, + Decisions) protocol (Grimm et al. 2006, 2010; Müller et al. 2013).
Overview
Purpose
The purpose of ABSOLUG is to advance our understanding of land use governance, identify macro-level patterns of interaction among governments, commodity producers, and NGOs in tropical deforestation frontiers, and to set a foundation for generating middle-range theories for multi-stakeholder governance approaches. The model represents a simplified, generic, tropical commodity production system, as opposed to a specific empirical case, and as such aims to generate interpretable macro-level patterns that are based on plausible, micro-level behavioral rules (Gilbert 2008). It is designed for scientists interested in land use governance of tropical commodity production systems, and for decision- and policymakers seeking to develop or enhance governance schemes in multi-stakeholder commodity systems.
Entities, state variables, and scale
The ABSOLUG model features a landscape consisting of cells (called patches) in which agents move and interact in discrete time steps (called ticks). It comprises four types of human agents (government, non-governmental organizations, smallholder producers, and largeholder producers), and a non-human entity (landscape). Definitions of largeholder and smallholder producers vary with geographic context. A household in the Brazilian Amazon with 200ha under cultivation is considered a smallholder (Carrero et al. 2020) while cocoa-producing smallholder household in Ghana cultivates less than 5 ha of land on average (Bymolt et al. 2018). Smallholders rely more on family members to for farming than largeholders and engage in polyculture (Bymolt et al. 2018; FAO 2015; Feintrenie et al. 2010). Largeholders employ laborers, operate monocultures, and cultivate between 500 – 5000 ha (Carrero et al. 2020). The contributions to deforestation from small- and largeholders also vary by commodity. Cocoa in West Africa is predominantly produced by smallholders while most of the soy in the Brazilian Amazon is produced by large farms (Carodenuto 2019; Cattelan & Dall’Agnol 2018). In our model, we categorize largeholders into three sub-groups (pioneers, mainstreamers, and laggards). Agents are homogenous within their respective type (e.g., smallholder or NGO) and sub-group (e.g., pioneer or laggard largeholder). The model operates along discrete time steps (ticks) where each tick represents three months, which is sufficiently granular to allow for actions within crop growing seasons yet broad enough to manage computing requirements.
The government-agent represents the political entity governing the landscape and is characterized by its propensity toward environment or business, its conservation goals, and subsidization and/or taxation of crop cultivation, eco-certification, and intensification. It monitors protected areas, penalizes agricultural encroachment into protected areas, and responds to political pressure from NGOs and largeholders according to a user-defined cadence (Government-action-cadence). ABSOLUG users determine the goals of the government with respect to economic development and nature conservation, e.g., the government could prioritize the expansion of area under cultivation or aim to designate protected areas and promote environmentally friendly production methods.
The NGO-agent represents social and environmental NGOs that operate in the landscape and monitor the activities of the government and largeholder producers. They apply political pressure to the government if deforestation rates exceed a user-defined threshold, and campaign against largeholder producers who encroach protected areas or illegally acquire smallholder-owned land. Users can determine how often NGOs can campaign (NGO-action-cadence) and how well they can monitor deforestation and encroachment (NGO-deforestation-monitoring).
Smallholder-agents represent households that engage in shifting cultivation and commodity crop cultivation. Smallholders can move up to ten patches per tick and carry out one action per year (i.e., every four ticks) (parameter Action cadence smallholder), choosing among three actions: converting forest to cropland, intensify or certify owned cropland, or idle.
Largeholder agents represent commodity crop producing companies or individual farmers with large landholdings and are categorized as pioneers (high intrinsic motivation to adopt sustainable cultivation practices, high reputational risk), mainstreamers (little intrinsic motivation to adopt sustainable cultivation practices, medium reputational risk), or laggards (no intrinsic motivation for sustainable cultivation, little reputational risk). The number of largeholders in each category is user-defined and largeholder agents remain in their respective category for the duration of the simulation. Largeholders can move across the landscape freely and carry out one action every 1.5 years (i.e., six ticks) (parameter Action cadence largeholder), choosing among four land use actions: converting forest to cropland, intensify or certify owned cropland, or idle. The action cadence reflects the balance between resource limitations for largeholders in developing new concessions and the rapid growth observed in some tropical commodities such as palm oil (167% increase in planted area between 1990 and 2010 globally; Pirker et al. 2016) and soy in Brazil (almost tenfold increase in production volume between 1975 and 2015; Bicudo Da Silva et al. 2020).
The ABSOLUG landscape consists of 125 x 125 patches (15,625), each representing a 1-hectare unit of the landscape. A central attribute of patches is their land use type which can be either natural (forest, riparian zone, river), anthropogenic (marketplace, cropland, fallow), or hybrid (protected area, smallholder forest). The initial landscape is comprised of 13,980 forest patches (89.47% of total patches), 978 river and riparian patches (6.26%), and 665 anthropogenic patches (4.26%). Patches can transition from one land use to another through natural succession or human intervention. Other patch attributes include ownership and time of land use change and the default simulation duration is 40 years (160 ticks).
Process overview
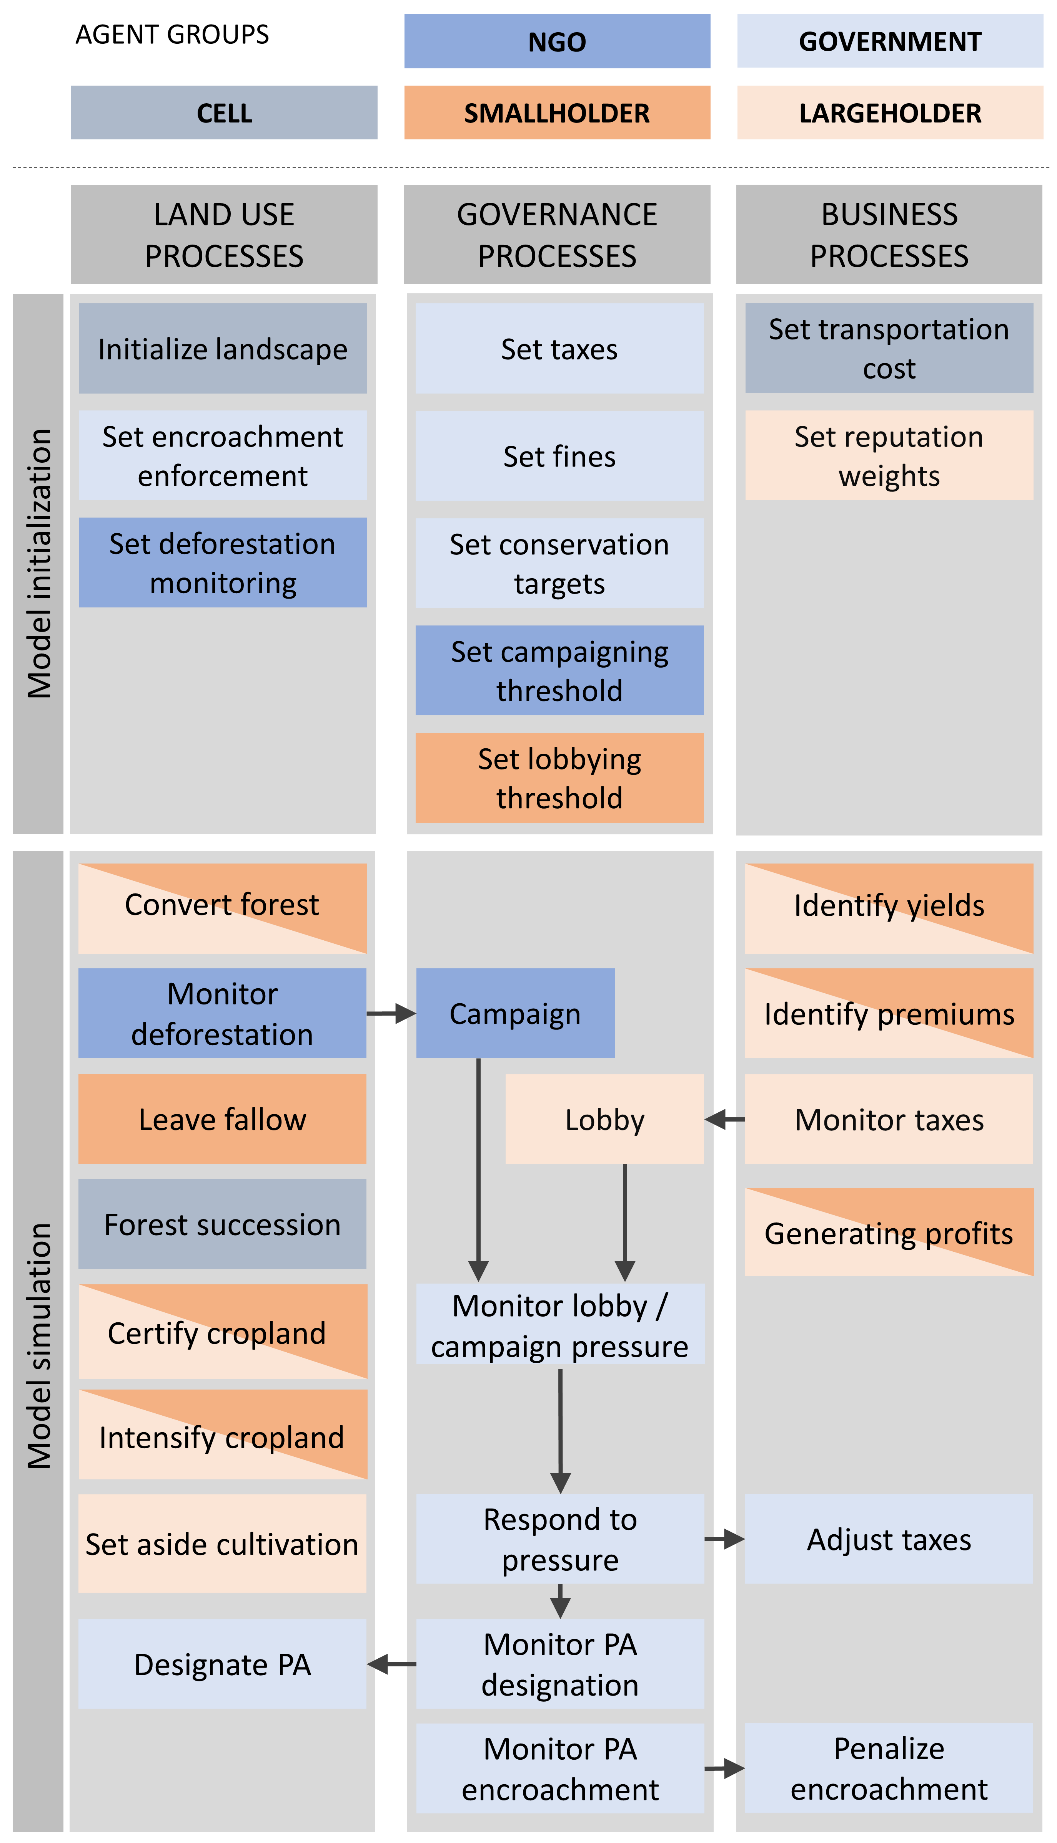
The model represents three processes related to forest cover change: land use, governance, and business processes (Figure 1). Processes in agent-based models are the result of interactions among individual agents and are characterized by causal links and feedback loops (Gilbert 2008). Agent behavior is determined by conditional arguments (if-then arguments) and agents perform actions if the corresponding conditions are met, resulting in a model logic that is based on a network of conditional statements.
Business processes. Business processes revolve around crop cultivation driven by smallholders and largeholders (collectively called growers) seeking to maximize their profit. Profits are generated by engaging in crop cultivation and are defined as the difference between income and costs. Income is determined by yield, price, and price premiums, and costs by operational, transportation, and reputational costs. Initial, one-time costs, such as acquisition of land or costs of meeting eco-certification standards are rolled into the operational costs. Profits are calculated for each patch, using the net present value discounted to infinity with a discount rate of 5% (Heilmayr et al. 2020). Following Ricardo’s law of rent, growers choose the most profitable action by sensing the landscape for the patch that generates the highest profit from cultivation, eco-certification, or intensification (Ricardo & Gonner 1891). If no patch is profitable, growers choose to idle. The profitability of a patch can vary among agent groups, depending on the group’s reputational risk and inclination for sustainable practices.
Consistent with von Thünen’s model of agricultural land use (Thünen 1826), the location of each patch in relation to the central marketplace determines the transportation costs associated with producing crops – the further away from the central marketplace, the higher the transportation cost. As the simulation progresses, transportation costs decrease to simulate improvements in infrastructure.
Smallholders engage in shifting cultivation and return to forest cells that they previously cultivated, creating an informal system of land ownership. When smallholders choose to certify or intensify a patch it is no longer part of the shifting cultivation cycle.
Process details: determining most profitable land use. When their action cadence allows them to act, growers determine their action based on the net-present-value of each cultivation option, defined as:
| \[ NPV_{cultivation} = (y + r_{gain}) - (c_{land} + c_{transportation} + c_{eco-certification} + c_{intensification} + r_{risk}) / 5\] | \[(1)\] |
Reputational gain and risk vary by largeholder type, with pioneer largeholders having the highest gains and risks, and laggard largeholders the lowest. Intensification is reputationally neutral and does not entail a reputational risk or gain. Land costs represent all costs related to ownership and cultivation of patches, as well as taxes. Transportation costs are determined by the distance of the patch to the central marketplace and the time of the simulation, defined as:
| \[ C_{transportation} = \frac{log_{10}(distance \; to \; center)}{log_{10}(ticks)}\] | \[(2)\] |
Eco-certification and intensification costs are user-defined and represent government subsidies for sustainable cultivation. Growers scan each patch for each cultivation option and move to the patch with the highest net present value. If several patches have the same net present value, growers move to a random patch. Largeholders monitor changes in land-costs (i.e., taxes) and lobby the government to lower taxes once a user-defined threshold is crossed.
Governance processes. Governance processes represent lobbying and campaigning efforts by largeholders and NGOs and the government’s responses. NGOs monitor deforestation rates and campaign directly against the government if rates exceed a threshold and indirectly against largeholders through demanding more stringent regulation of production. Largeholders monitor taxes on crop cultivation and lobby the government if a cost threshold is crossed or if no cultivation options are profitable. When responding to NGO campaigning, the government chooses between tax increases on crop cultivation or designation of protected areas. When responding to largeholder lobbying, the government decreases taxes on crop cultivation.
Process details: NGOs and largeholders applying political pressure. Largeholder lobbying is triggered by increases in cultivation cost or by a lack of profitable cultivation options. Largeholders monitor their cultivation costs every other tick (i.e., semiannually) and apply pressure to the government if the current cultivation costs exceed the initial cultivation costs by a user-defined percentage (parameter Largeholder lobbying threshold, Table 1). If there are no profitable cultivation options, largeholders apply a user-defined pressure value to the government each time they idle (parameter Action cadence largeholder).
NGOs monitor the landscape every other tick and apply pressure to the government if the annual deforestation rate exceeds a user-defined threshold (parameter NGO campaigning threshold, Table 1) or when a largeholder converts a patch of forest that is informally owned by a smallholder.
Process details: governments responding to pressure. Pressures on government accumulate over time and are accounted for in two pressure-contingents, one for lobbying pressure from largeholders and one for campaigning pressure from NGOs. By default, campaigning increases the NGO-pressure-contingent by one pressure-unit (see the Interactions section of the ODD+ protocol). Lobbying takes place when land taxes exceed the initial land taxes by a user-defined threshold that can vary for each largeholder type or when the economic conditions of the simulation force largeholders to idle. The amount of lobbying pressure applied to the largeholder-pressure-contingent depends on the lobbying thresholds and composition of the largeholders. The government checks its pressure contingents according to the user-defined Government-action-cadence and responds to pressure if the contingents reach a certain value which is determined by the government's inclination towards pro-environmental policies (parameter Government favoring environment) or inclination towards pro-cultivation policies (parameter Government favoring business). If the lobbying-pressure threshold is crossed, the government lowers taxes by a user-defined value (Richter et al. 2009). If the campaigning-pressure threshold is crossed, the government has two options, it either declares a protected area or increases taxes depending on its progress toward achieving its conservation goal which is a user-defined percentage of the landscape to be protected by the end of the policy period. When it is on track to meeting its conservation goals, the government increases the current taxes by a user-defined percentage. The agent group, either NGOs or largeholders, achieving a government response resets its pressure contingent to its baseline while the agent group whose pressure was not responded to sets its pressure contingent to half of its current value. This mechanism reflects the recognition by agents that the government has limited capacity to respond to pressure while maintaining a raised pressure contingent from the losing side (Haslam & Godfrid 2020; Jänicke 1992). Interactions among the government and largeholders and/or smallholders are tracked.
Process details: conservation goal. The conservation goal is a percentage of the model landscape to be protected by the end of the policy period. It is modeled off the idea to formally protect a certain percentage of terrestrial and freshwater ecosystems by a target date, as seen in the Convention on Biological Diversity’s Aichi Target 11 where signatories pledged to designate 17% of their terrestrial and inland waters as protected area by 2020 (SCBD 2011).
The trajectory towards achieving the conservation goal is a linear function defined as:
| \[ Conservation \; trajectory = \frac{N_{protected}}{T_{policy}}\] | \[(3)\] |
At each tick, NGOs monitor progress towards the conservation goal and call on the government to act if the remaining natural area in the simulation world is smaller than the area determined by the conservation trajectory. If the campaigning-pressure threshold is crossed and the government is not on track to meeting its conservation goal, then it declares a large protected area (421 patches with 96 buffer patches) instead of raising land taxes.
If the government is set to be proactive towards achieving its conservation goal, it designates protected areas without NGO pressure. To reflect resource constraints faced by governments, proactive designation follows the same cadence as responses to pressure and is carried out only if neither pressure from NGOs nor largeholders exceeds their respective thresholds, i.e., the government only carries out an action once per year (i.e., every four ticks). A proactive government determines whether it is on track to meeting its conservation goal by comparing its conservation trajectory to the current area under protection. During the policy period (years 15 to 40), the government considers itself on track to meeting its conservation goal if the number of protected patches in the model world exceeds the number of protected patches as determined by the conservation trajectory. To reflect initial inertia and resource challenges, the government designates small protected areas (213 patches with 72 buffer patches) during years 25 to 32, and large protected areas (421 patches with 96 buffer patches) during years 32 – 40.
Land use processes. Land use processes pertain to regulation, alteration, and monitoring of forest cover, such as conversion, natural succession of forest, or designation of protected areas. The focus of this model is on land use transitions associated with agriculture, thus excluding forestry operations (e.g., selective logging) and natural forest disturbances (e.g., drought, fires, storm events) that cause forest degradation. Smallholders convert a single patch per action while largeholders convert 45 patches in a concentric circle around their position. Eco-certification and intensification occur on already converted patches. Eco-certification can only occur on patches that have been converted prior to a user-defined cut-off value, resembling the use of cut-off dates in sustainability eco-certification schemes such as the Roundtable for Sustainable Palm Oil or the Round Table on Responsible Soy (RSPO 2018; RTRS 2017). Pioneer largeholders can engage in set-aside conversion where an area of 69 patches is affected of which two-thirds (45 patches) are converted to eco-certified cropland and one-third (24 patches) is set aside for conservation to replicate set-aside schemes such as Olam’s Sustainable Palm Oil Policy in Mouila, Gabon (Booth 2012). Smallholders engage in shifting cultivation and fallow their crop patches after 8 time-steps (2 years) (Hauser & Norgrove 2013; Mertz et al. 2009). Deforestation rate is calculated annually as:
| \[ r = (1 / t_{2}-t_{1}) * ln (A_{2} / A_{1})\] | \[(4)\] |
Process details: largeholders converting, intensifying, or certifying land. After determining the net present value of all patches in the landscape, largeholder agents move to one of the patches with the highest value. When converting, patches are imprinted with information such as time of conversion, agent type, and the unique agent-ID of the converter. Largeholders can only certify or intensify patches they own, i.e., patches with a matching agent-ID, and only conventional crop patches can be eco-certified or intensified. Eco-certification is only possible on patches that have been converted prior to the cut-off date and users can define the production cost premium and sales price premium of eco-certified commodities. Largeholders move to the patch with the highest net present value and certify or intensify all patches with matching agent-IDs within a radius of 3.8 patches around their position.
Process details: smallholders converting, intensifying, or certifying land. After determining the net present value of patches in radius of 10 patches around their position, smallholder agents move to one of the patches with the highest net present value and convert, certify, or intensify the patch they are located on. When converting, smallholders imprint their unique agent-ID on the patch, creating an informal system of ownership where reforested patches are still associated with the smallholder agent who originally converted it. Smallholders engage in shifting cultivation and fallow their crop patches after 2 years (8 ticks). Fallow patches return to secondary forest after 5 years (20 ticks) and mature forest after 20 years to mimic natural forest succession in tropical ecosystems (Hauser & Norgrove 2013; Mertz et al. 2009; Poorter et al. 2021). To convert, smallholders return to their informally owned forest patches if possible and otherwise seek out non-owned patched.
Process details: protected area encroachment. Encroachment is the illegal conversion of patches in protected areas to cropland. It is punishable by a fine, whose amount varies with the protection-tier of the encroached patch. Patches can be protected in one of three tiers where Tier 1 protection has the highest encroachment fine and is typically applied to protected areas and river buffers. Tier 2 patches are buffer zones of protected areas and forest informally held by smallholders. Tier 3 protection can be applied to conventional forest patches. Land-use decisions by growers integrate the risk of being fined in their estimation of the cost of forest encroachment by multiplying the fine for encroachment by the perceived probability of enforcement. Whether a largeholder encroaches a protected area is determined by the cost of encroachment and by how much the largeholder values reputation (parameter Importance of reputation). Besides incurring a potential fine, encroachment into protected areas has negative reputational impact, as seen with Greenpeace’s campaign against Nestlé for allegedly sourcing palm oil linked to deforestation (Greenpeace 2010). Pioneer largeholders incur the highest reputational damage and laggard largeholders the least. Encroachment of protected areas or riparian buffers (Tier 1) is considered most damaging to reputation and encroachment of conventional forest (Tier 3) the least. Reputational damage is expressed as a modifier on the cost side of the decision-making formula. To reflect the different levels of reputational damage associated with the conversion of forest patches with different degrees of formal protection, encroachment of Tier 1 patches is weighted with a factor of two, encroachment of Tier 2 patches with a factor of 1.5, and encroachment of Tier 3 patches with a factor of one.
Design Concepts
Theoretical and empirical background
Our model simulates forest cover change in space and over time, building on four theoretical frameworks, the von Thünen model of land rent (spatial), Ricardo’s law of rent (economic), the forest transition theory (temporal), and Abbot & Snidal’s governance triangle (regulatory). In von Thünen’s model, conversion of land is a result of actors seeking land rents. Rents are determined by proximity of the land to a central marketplace (Angelsen 2007; Thünen 1826) and defined as the difference between income (yield, price) and cost (wages, capital, transport costs). Following Ricardo’s law on rent, actors choose sites with higher rents over marginal sites with lower rents, given the same inputs of labor and capital (Ricardo & Gonner 1891). Growers seek to maximize land rents and individual agents hold no preferences for specific actions or locations (Sen 2017).
The governance triangle consists of private (growers), public (government), and civil society (NGOs) actors, all interacting in the regulatory standard-setting process (Abbott & Snidal 2009). Civil society organizations influence social and environmental practices of largeholder producers by advancing their agenda through public institutions, or by targeting private agents, often in the public domain (Baron & Diermeier 2007; Eberlein et al. 2014). The objectives of public actors, their regulatory power over the private sector, and their desire to regulate vary substantially across geographies. While some governments emphasize the conservation of natural ecosystems, others may prioritize economic development over the associated social and environmental externalities or may not have the resources and capacity to address them adequately (Abbott & Snidal 2009). Governments, in contrast to private and civil society actors, have the option to directly regulate land use processes if their institutions are sufficiently strong (Abbott & Snidal 2009).
The forest transition theory describes empirical observations of forest cover change and identifies a contingent chronological sequence observed for a few countries (Angelsen 2007; Rudel et al. 2005). Starting with low rates of deforestation in a high forest cover landscape, deforestation rates increase until forest cover reaches a minimum after which a transition to forest expansion occurs, followed by an eventual stabilization (Angelsen 2007; Mather 1992; Rudel et al. 2005).
Individual decision-making
Decision-making occurs at the level of the individual agent and agents apply their decision-making logic consistently. Changes in input variables might affect decision-making, for example higher encroachment fines decrease the likelihood of agents encroaching protected areas. Crop-cultivating agents pursue the objective of maximizing profit based on the net present value of land rent. Cultural norms and values are reflected in different valuations of reputation by pioneer, mainstreamer, and laggard largeholders.
Individual sensing and prediction
Agents non-erroneously sense the values of variables relevant to their decision-making in a radius of ten patches around their current location (smallholders) or in the entire landscape (largeholders, NGOs, and the government). Cost for cognition or information gathering is not explicitly included and growers predict future revenue streams to determine the net present value of their actions. Relevant information to calculate revenue streams are available to agents and include yield, price, operational costs, premiums, potential fines, reputational impact, and transport costs.
Interactions
Direct interactions among NGOs, government, and growers include lobbying (largeholders to government), campaigning (NGOs to government and largeholder agents), and policy interventions such as taxation, subsidies, and fines (government to growers). Interactions depend on changes in state variables such as deforestation rate, taxes, and protected areas, and on detection of encroachment by growers, and are coded as if-then conditions. For example, the triggering of largeholder lobbying and NGO campaigning are coded as follows:
    IF ticks are even AND
    IF land-taxes > (initial-land-taxes * pioneer-lobbying-threshold):
    THEN increase largeholder-pressure-contingent by (#-of-pioneers / total-#-of-largeholders)

    IF ticks are even AND
    IF (Annual-deforestation * NGO-deforestation-monitoring) > NGO-reporting threshold:
THEN increase NGO-pressure-contingent by 1Stochasticity
The initial placement of agents within the central marketplace is random. The delay before agents carry out their first action is a random value between zero and nine months (zero to three ticks) for smallholders and one to two years (four to eight ticks) for largeholders. This delay-difference allows smallholders to establish ownership over land patches without pressure from largeholders and mimics the low deforestation rates observed in the pre-frontier deforestation phase (Rodrigues et al. 2009). If presented with multiple equally profitable patches, agents randomly select one of these patches.
Observation
Outputs and variables that are monitored for analysis include deforestation rate, encroachment of protected areas, area of conventional, eco-certified, and intensified cultivated land, area of set-aside protected areas, area of forest, transactions among agents, operational costs (including taxes), idling of producers (measured as stagnation), and the political pressure applied to the government. All outputs are emerging from the actions of individual agents.
Details
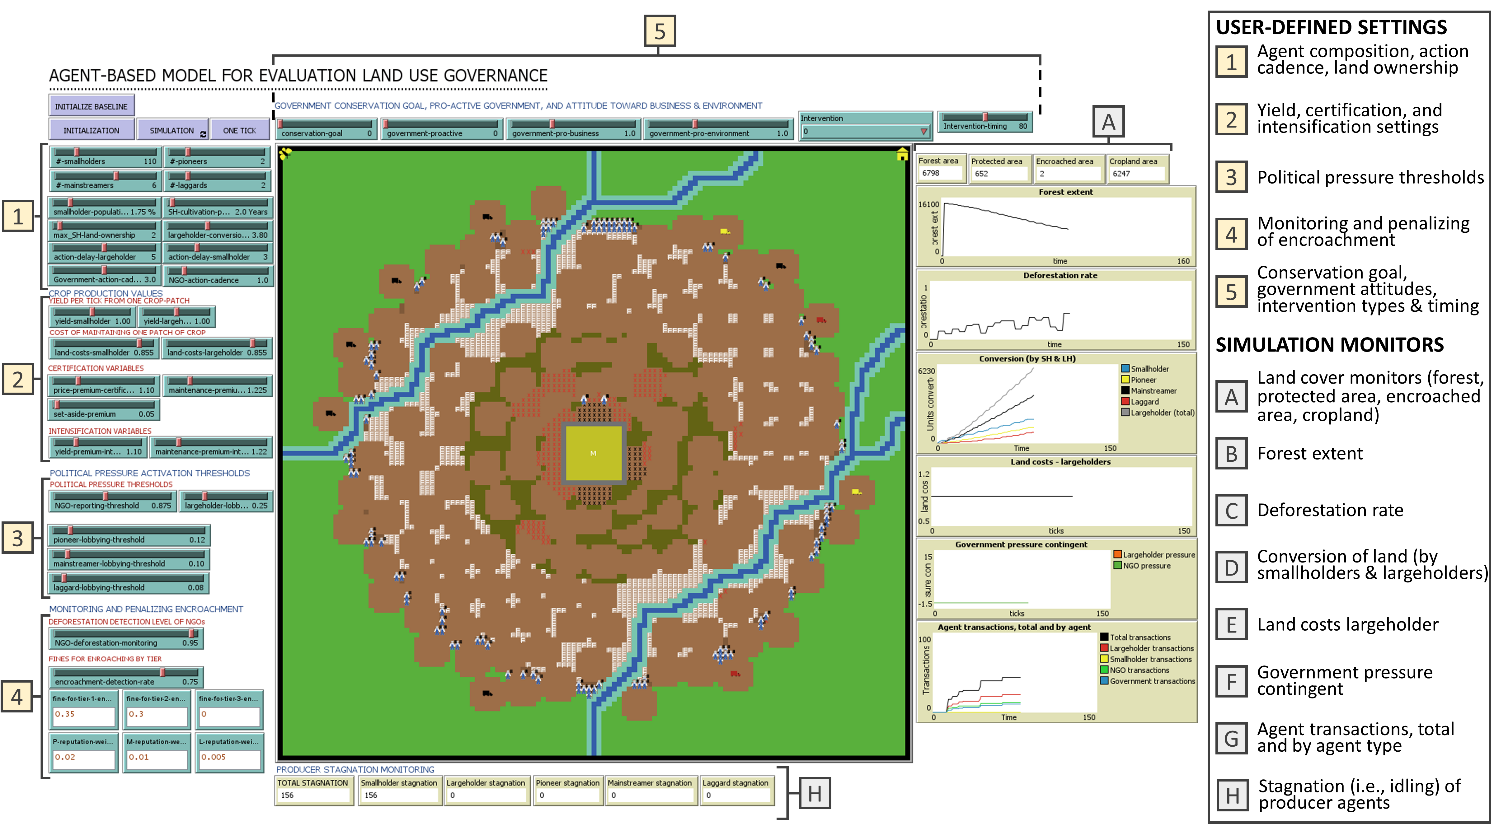
Implementation details and initialization. The model has been implemented in NetLogo version 6.2.0 (https://ccl.northwestern.edu/netlogo/). The initial state of the landscape resembles a central marketplace surrounded by a homogenous, flat landscape with undisturbed forest, consistent yields, and two rivers (Figure 2). The model captures key processes of the system through simplification and stylization (Gilbert 2008).
Simplifications include full demand for all produced commodities without any intermediaries or traders, a stable number of largeholder producers throughout the simulation, and consistent yields over space and time. The initialization does otherwise not vary among simulations and initial values are based on empirical data derived from the scientific literature, prior model calibration, or user preferences (Table 1).
| Process | Parameter | Baseline value | Source |
|---|---|---|---|
| Initialization | Simulation period | 40 years | Andersen et al. (2017) |
| Valbuena et al. (2010) | |||
| An et al. (2005) | |||
| Land use | Conversion per action-smallholder | 1 patch | Maass Wolfenson (2013) |
| USDA (2009) | |||
| FAO (2015) | |||
| Feintrenie et al. (2010) | |||
| Bymolt et al. (2018) | |||
| Land use | Conversion per action-largeholders | 45 patches | USDA (2009) |
| Cattelan & Dall’Agnol (2018) | |||
| IBGE (2017) | |||
| Land use | Set-aside percentage of protected area in concession | 34.87% | Scriven et al. (2019) |
| Hoyle (2015) | |||
| Land use | Crop to fallow period | 2 years | Hauser & Norgrove (2013) |
| Pelzer (1945) | |||
| Mertz et al. (2009) | |||
| Land use | Fallow to forest period | 5 years | Hauser & Norgrove (2013) |
| Pelzer (1945) | |||
| Mertz et al. (2009) | |||
| Governance | NGO campaigning threshold | 0.60% | Landsat data (2014) |
| Governance | Conservation goal | 0 | SCBD (2011) |
| Business | Net present value discount period | \(\infty\) | Expert judgement |
| Business | Net present value discount rate | 5% | Expert judgement |
| Heilmayr et al. (2020) | |||
| Business | Eco-certification price premium | 10% | Furumo et al. (2020) |
| Lambin & Rueda (2013) | |||
| Fenger et al. (2017) | |||
| Lakhal et al. (2008) | |||
| Hutabarat et al. (2018) | |||
| Glasbergen (2018) | |||
| Business | Eco-certification costs | 21% | Calo & Wise (2005) |
| Setboonsarng et al. (2008) | |||
| Business | Eco-certification cut-off value | 20 years | RSPO (2018) |
| Hospes (2014) | |||
| Business | Intensification yield improvement | 10% | Rhebergen et al. (2020) |
| Hipólito et al. (2018) | |||
| Antoneli et al. (2019) | |||
| Mueller et al. (2012) | |||
| Business | Intensification costs | 20% | Modeling decision based on scenario calibration |
| Business | Set-aside maintenance premium | 0.03 | Modeling decision based on scenario calibration |
| Internal | Action cadence smallholder | 3 | Hidden model parameter |
| Internal | Action cadence largeholder | 5 | Hidden model parameter |
| Internal | Pioneer importance of reputation | 0.02 | Hidden model parameter |
| Internal | Mainstreamer importance of reputation | 0.01 | Hidden model parameter |
| Internal | Laggard importance of reputation | 0.005 | Hidden model parameter |
| Internal | Largeholder lobbying threshold | 10% | Hidden model parameter |
| Internal | Largeholder lobbying while idle | 0 | Hidden model parameter |
| Internal | Government favoring business | 1 | Hidden model parameter |
| Internal | Government favoring environment | 1 | Hidden model parameter |
| Internal | Tier 1 encroachment fine | 0.2 | Hidden model parameter |
| Internal | Tier 2 encroachment fine | 0.1 | Hidden model parameter |
| Internal | Tier 3 encroachment fine | 0.0625 | Hidden model parameter |
Model evaluation
Evaluation of abstract models needs to consider that the modeling goal is replication of macro-level behavior, as opposed to modeling empirical cases, thus requiring an adequate approach to evaluation (Louie & Carley 2008). We use a two-step evaluation approach: first, we evaluate ABSOLUG operationally through scenario analysis to demonstrate that it can reproduce known macro-level behaviors. Second, we evaluate the model statistically, using local and global sensitivity analyses.
Scenarios
The scenarios represent key land use policy processes in tropical landscapes, for example government-led, top-down conservation approaches, to generate empirically observable patterns of land use change in tropical landscapes like forest transitions or quasi-complete deforestation.
The hands-off scenario represents a system with minimal policy interventions and civil society involvement and is inspired by high rates of tropical deforestation in the second half of the 20th century, which were frequently state-enabled and/or enterprise driven (Rudel et al. 2009). The model landscape is initialized with 65 smallholders, no population growth, and two pioneer, six mainstreamer, and two laggard largeholders. There is no conservation goal and the annual deforestation threshold for NGOs to campaign against the government is moderate (0.6%). The government is indifferent towards pressure from NGOs and largeholders and fines for encroachment of protected areas are low (0.2 for Tier 1, 0.1 for Tier 2). There are no subsidies for sustainable production and the price premium for eco-certified crop is 10% at a 21% cost increase, and the yield gain for intensification is 10% at a 20% cost increase.
The middle-ground scenario features a government that is a signatory to an international conservation treaty (Aichi targets) but has a restricted budget and operates in a pro-business environment. The government proactively pursues compliance with the Convention on Biological Diversity’s Aichi Targets 11 to designate 17% of its terrestrial area as protected but does not have the capacity to provide subsidies or support for environmentally sustainable production of goods. Fines for encroaching protected areas are moderate (0.35 for Tier 1, 0.3 for Tier 2) and the largeholder producers are mostly pro-business (six laggards, two mainstreamers, and two pioneers). NGOs are not prominent and their threshold for campaigning is high (0.875). Halfway into the simulation period, the progressive largeholders participate in an intervention to make their supply chains more sustainable.
The proactive government scenario represents a landscape with a pro-environmental government that will act to achieve its goals without pressure from NGOs. This scenario is modelled after countries which reverted forest loss and increased forest cover as a result of state-led conservation and reforestation efforts, such as Costa Rica and Vietnam (Meyfroidt & Lambin 2008, 2011). The government is pursuing a 40% conservation target, informed by observations from the Brazilian Amazon (54% protected, Soares-Filho et al. 2010) and the target of the High Ambition Coalition for Nature & People (30% protected, High Ambition Coalition for Nature and People 2019). The government will designate protected areas if it is not on track to meeting its target. Fines for protected area encroachment are high (0.6 for Tier 1, 0.3 for Tier 2) and the government is more likely to respond to pressure from NGOs than from largeholders (parameter Government favoring environment = 2). NGO campaigning is triggered at an annual deforestation rate of 0.35%. All other parameters, including costs and premiums of intensification and eco-certification, remain unchanged.
Sensitivity analyses
To assess how sensitive ABSOLUG output is toward changes among the input parameters, we conduct a two-tiered sensitivity analysis. First, we perform a local, one-factor-at-a-time (OFAT) sensitivity analysis (Saltelli & Annoni 2010) followed by a Sobol′ global sensitivity analysis (Saltelli 2002; Saltelli et al. 2010; Sobol 2001).
For the OFAT sensitivity analysis, we varied 17 parameters in increments of 5% around their nominal values, ranging from \(\pm\) 25% where applicable. Following Norton (2015), we calculated normalized sensitivity as:
| \[ \frac{p_{j}}{y_{i}} * \frac{\delta y_{i}}{\delta p_{j}}\] | \[(5)\] |
We calculated normalized sensitivity for each input value and then averaged the resulting sensitivities to create a single value.
To test global sensitivity, we conducted a variance-based analysis, using a Saltelli extension of the quasi-random low-discrepancy Sobol′ sequence from all parameters (Saltelli 2002). We calculated the Pearson correlation coefficient (\(r\)) and the first-order and total Sobol′ sensitivity indices for each parameter to measure the relative influence of each parameter on the output (Herman & Usher 2017; Jaxa-Rozen & Kwakkel 2018). The first-order Sobol′ index reflects the influence of a parameter on the output in isolation, i.e., without interacting with other parameters. Higher order indices measure the influence of the parameter when it interacts with multiple other parameters, e.g., interactions with two other parameters are considered for the second-order index. The total index is the sum of the first-order and all higher order indices that involve the parameter of interest and represents the total effect of the parameter on the output.
To balance computational expense and variance in model outputs, we calculated the number of simulation runs per input to be 32 for the OFAT sensitivity analysis and 64 for the scenario evaluation, following Ritter et al. (2011) and performed two global sensitivity analyses with n-values of 1024 respectively, each resulting in 14,336 unique experiments. The first global sensitivity analysis was conducted with 17 parameters, the second with 15 parameters excluding Action cadence largeholder and Action cadence smallholder. OFAT was conducted in NetLogo’s BehaviorSpace and global sensitivity analysis on a computing cluster using the PyNetLogo integration (Jaxa-Rozen & Kwakkel 2018) and the SALib Python package (Herman & Usher 2017).
Results
Scenarios
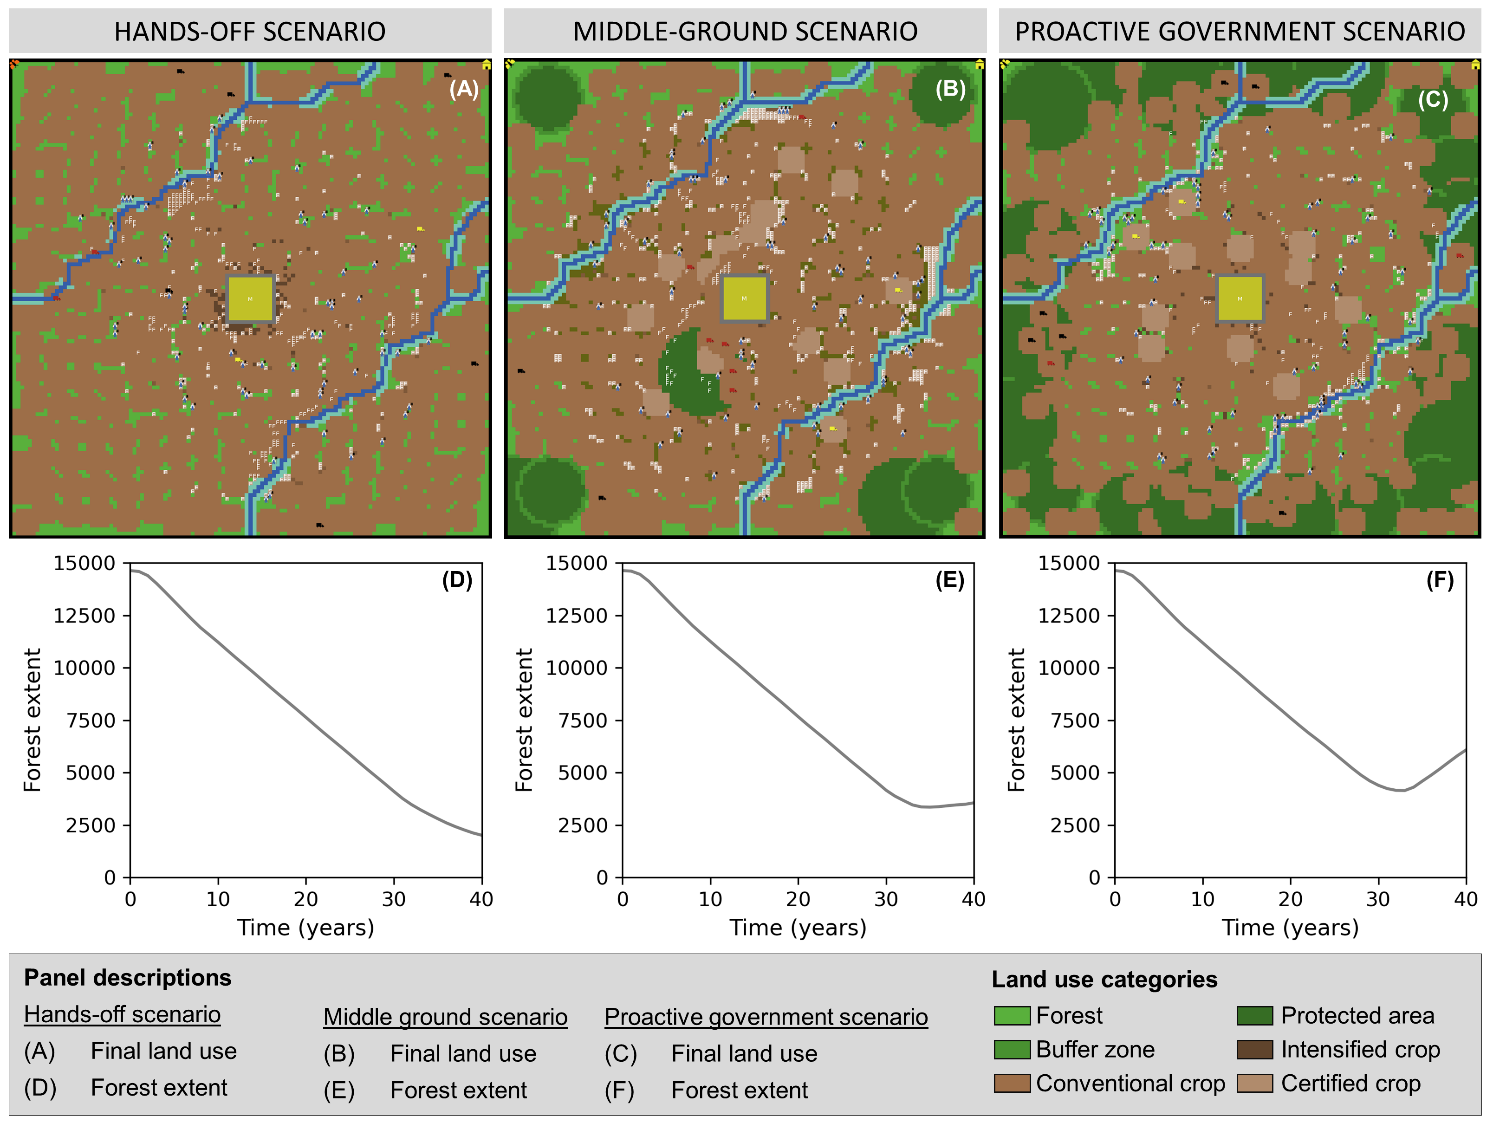
Forest extent declined in the hands-off scenarios over the duration of the simulation, resulting in a mean forest loss of 87% with a standard deviation of 2.2% (i.e., 315 patches) (Figure 3, panel D) and mean annual deforestation rates between 0.05% and 0.69%. Conversion occurred in a concentric pattern around the central marketplace and smallholders migrated from their initial starting points to more remote patches with lower land rents. Protected areas in the form of river buffers have been encroached and no additional protected areas have been designated (Figure 3, panel A).
In the middle-ground scenario, forest extent is similar to the other two scenarios for the first thirty years before it stabilizes and increases slightly (+ 420 patches), and eventually remains stagnant until the end of the simulation period at an average of 24% of the original forest cover (3560 patches) (Figure 3, panel E). Encroachment of riparian buffers occurs close to the marketplace and protected areas have been designated at the edges of the landscape, accounting for 16.74% of the initial forest area (2449 patches). Eco-certification is present and mostly located close to the marketplace (Figure 3, panel C).
In the proactive government scenario, forest cover decline slowed down after thirty years and then reversed to forest cover gain in year thirty-three (Figure 3, panels E and F). By the end of the simulation, forest cover rebounded to a mean of 41.6% of the original forest cover (6085 patches) with a standard deviation of 3.2% (452 patches), representing a forest transition. Several protected areas have been designated, primarily in remote areas (Figure 3, panel C). All protected areas, i.e., protected areas, buffer zones, and river buffers have been encroached and several concessions around the central marketplace have been eco-certified. The frequent encroachment of protected areas was countered by the designation of new protected areas to achieve the 40% conservation target.
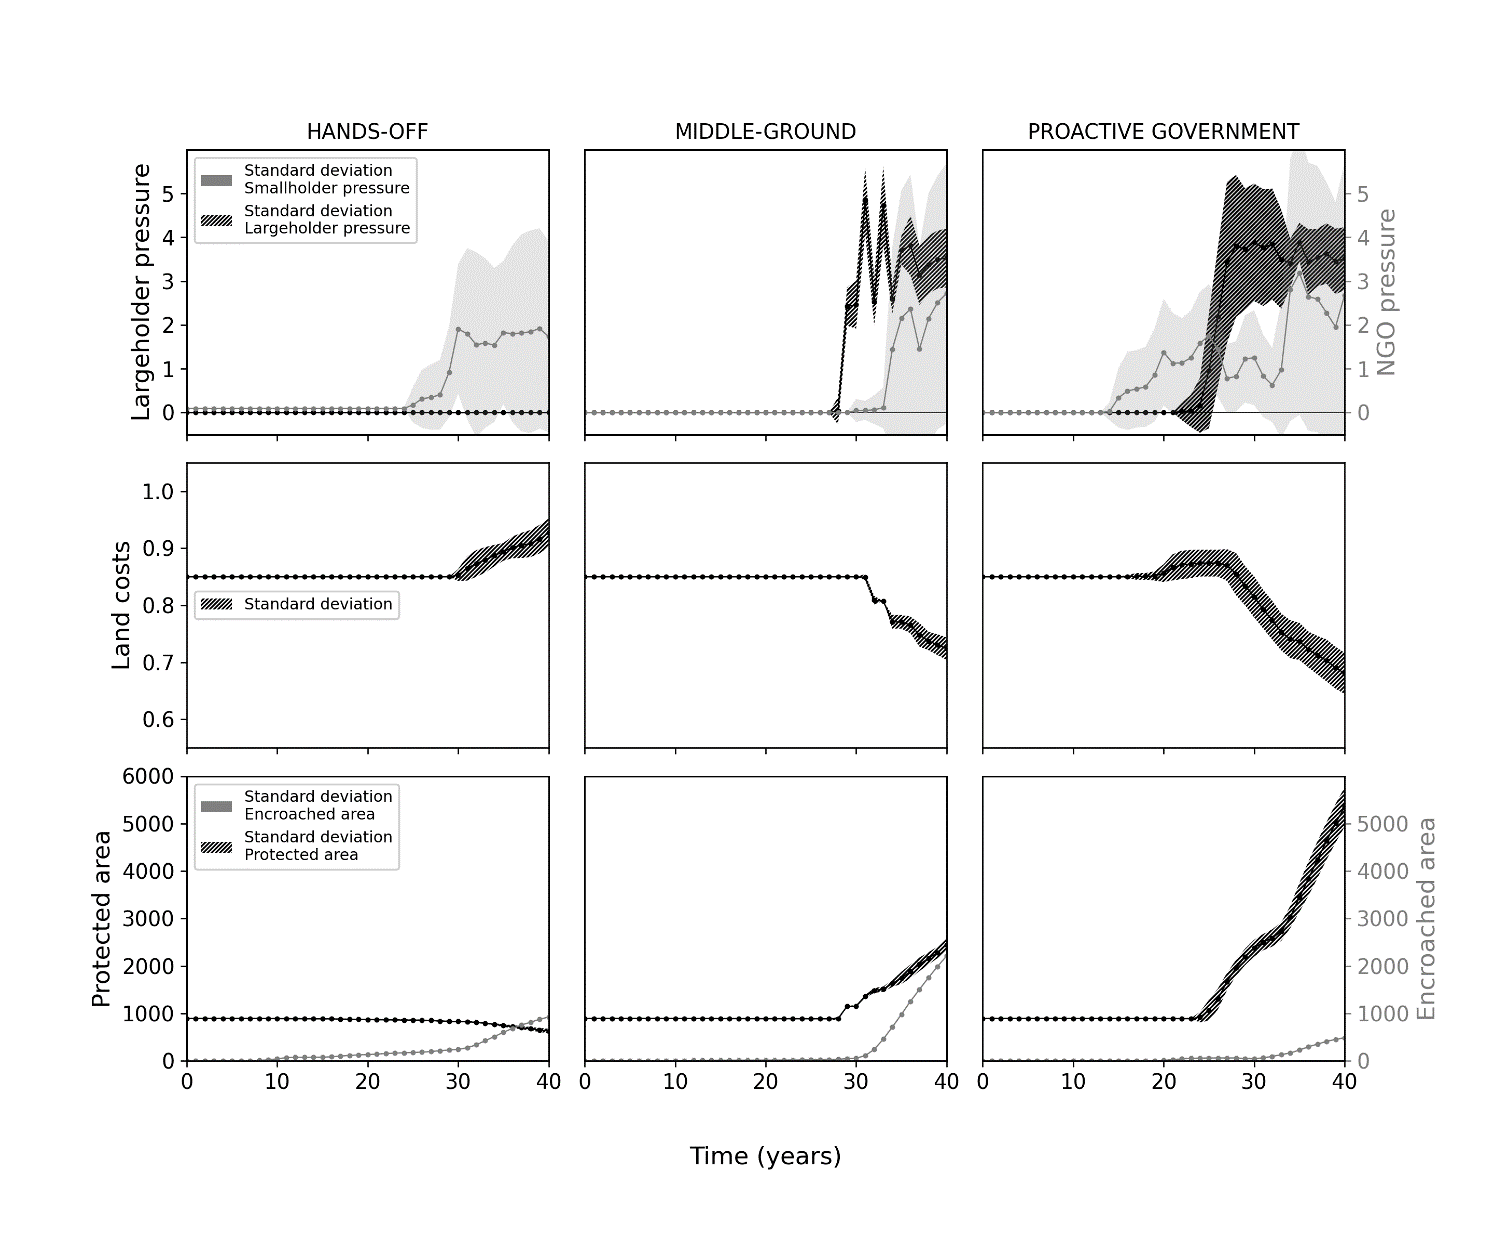
A key difference between the scenarios is the area under protection, with 4.25% (622 patches) in the hands-off, 16.74% (2449 patches) in the middle-ground, and 38.38% (5617 patches) protected in the proactive government scenario. In the second half of the proactive government scenario the government designated protected areas whenever the area under protection fell below the conservation trajectory. Compared to the hands-off scenario, the government responded earlier in the simulation (year 20) to NGO pressure by increasing land taxes, which remained high for around 7.5 years. These high land costs led smallholders to lobby, leading to high largeholder-pressure contingent values for the government, which responded by lowering land taxes starting around the year 27 (Figure 4). Land-costs continued to decline and largeholder pressure remained high until the end of the simulation. By contrast, in the hands-off scenario, largeholder pressure was low throughout the simulation period.
Land taxes remain stable for the first half of the simulation in all scenarios and increase after thirty years in the hands-off scenario, coinciding with a rise in NGO pressure (Figure 4). The middle-ground scenario sees a decline in land taxes after thirty years, which correlates with a rise in largeholder pressure. The proactive government scenario displays a decline in land taxes from year twenty-eight after an initial rise from year 20 (Figure 4). Encroachment of protected areas occurs in all scenarios at comparable levels until tick 120 when it rises sharply in the middle-ground and proactive government scenarios and continues to increase in the former (Figure 4). This rise coincides with an increase in protected areas (Figure 4) which are designated by the government in response to higher NGO pressure and/or to meet the conservation goal.
Local sensitivity analysis
Eco-certification cost had the highest mean normalized sensitivity, followed by intensification cost, and the action cadence of largeholders (Table 2). These parameters also had maximum \(\delta y_{i}\) values of more than three times the standard deviation. Government favoring the environment and government favoring business showed high maximum \(\delta y_{i}\) values of 4690 patches and 12,331 patches respectively (Table 2) while displaying lower mean normalized sensitivities.
| Parameter | Normalized sensitivity | Maximum \(\delta y_{i}\), in patches |
|---|---|---|
| Eco-certification cost | 4.716 | 2,201 |
| Set-aside maintenance premium | 0.079 | 55 |
| Intensification cost | 2.339 | 5,502 |
| Action cadence smallholder | 0.156 | 310 |
| Action cadence largeholder | 1.361 | 5,326 |
| Pioneer importance of reputation | 0.236 | 84 |
| Mainstreamer importance of reputation | 0.204 | 104 |
| Laggard importance of reputation | 0.087 | 38 |
| NGO campaigning threshold | 0.114 | 427 |
| Largeholder lobbying threshold | 0.152 | 162 |
| Government favoring business | 0.132 | 4,690 |
| Government favoring environment | 0.292 | 12,331 |
| Tier 1 encroachment fine | 0.190 | 47 |
| Tier 2 encroachment fine | 0.103 | 47 |
| Tier 3 encroachment fine | 0.113 | 74 |
| Conservation goal | 0.036 | 76 |
| Largeholders lobbying while idle | 0.0172 | 64 |
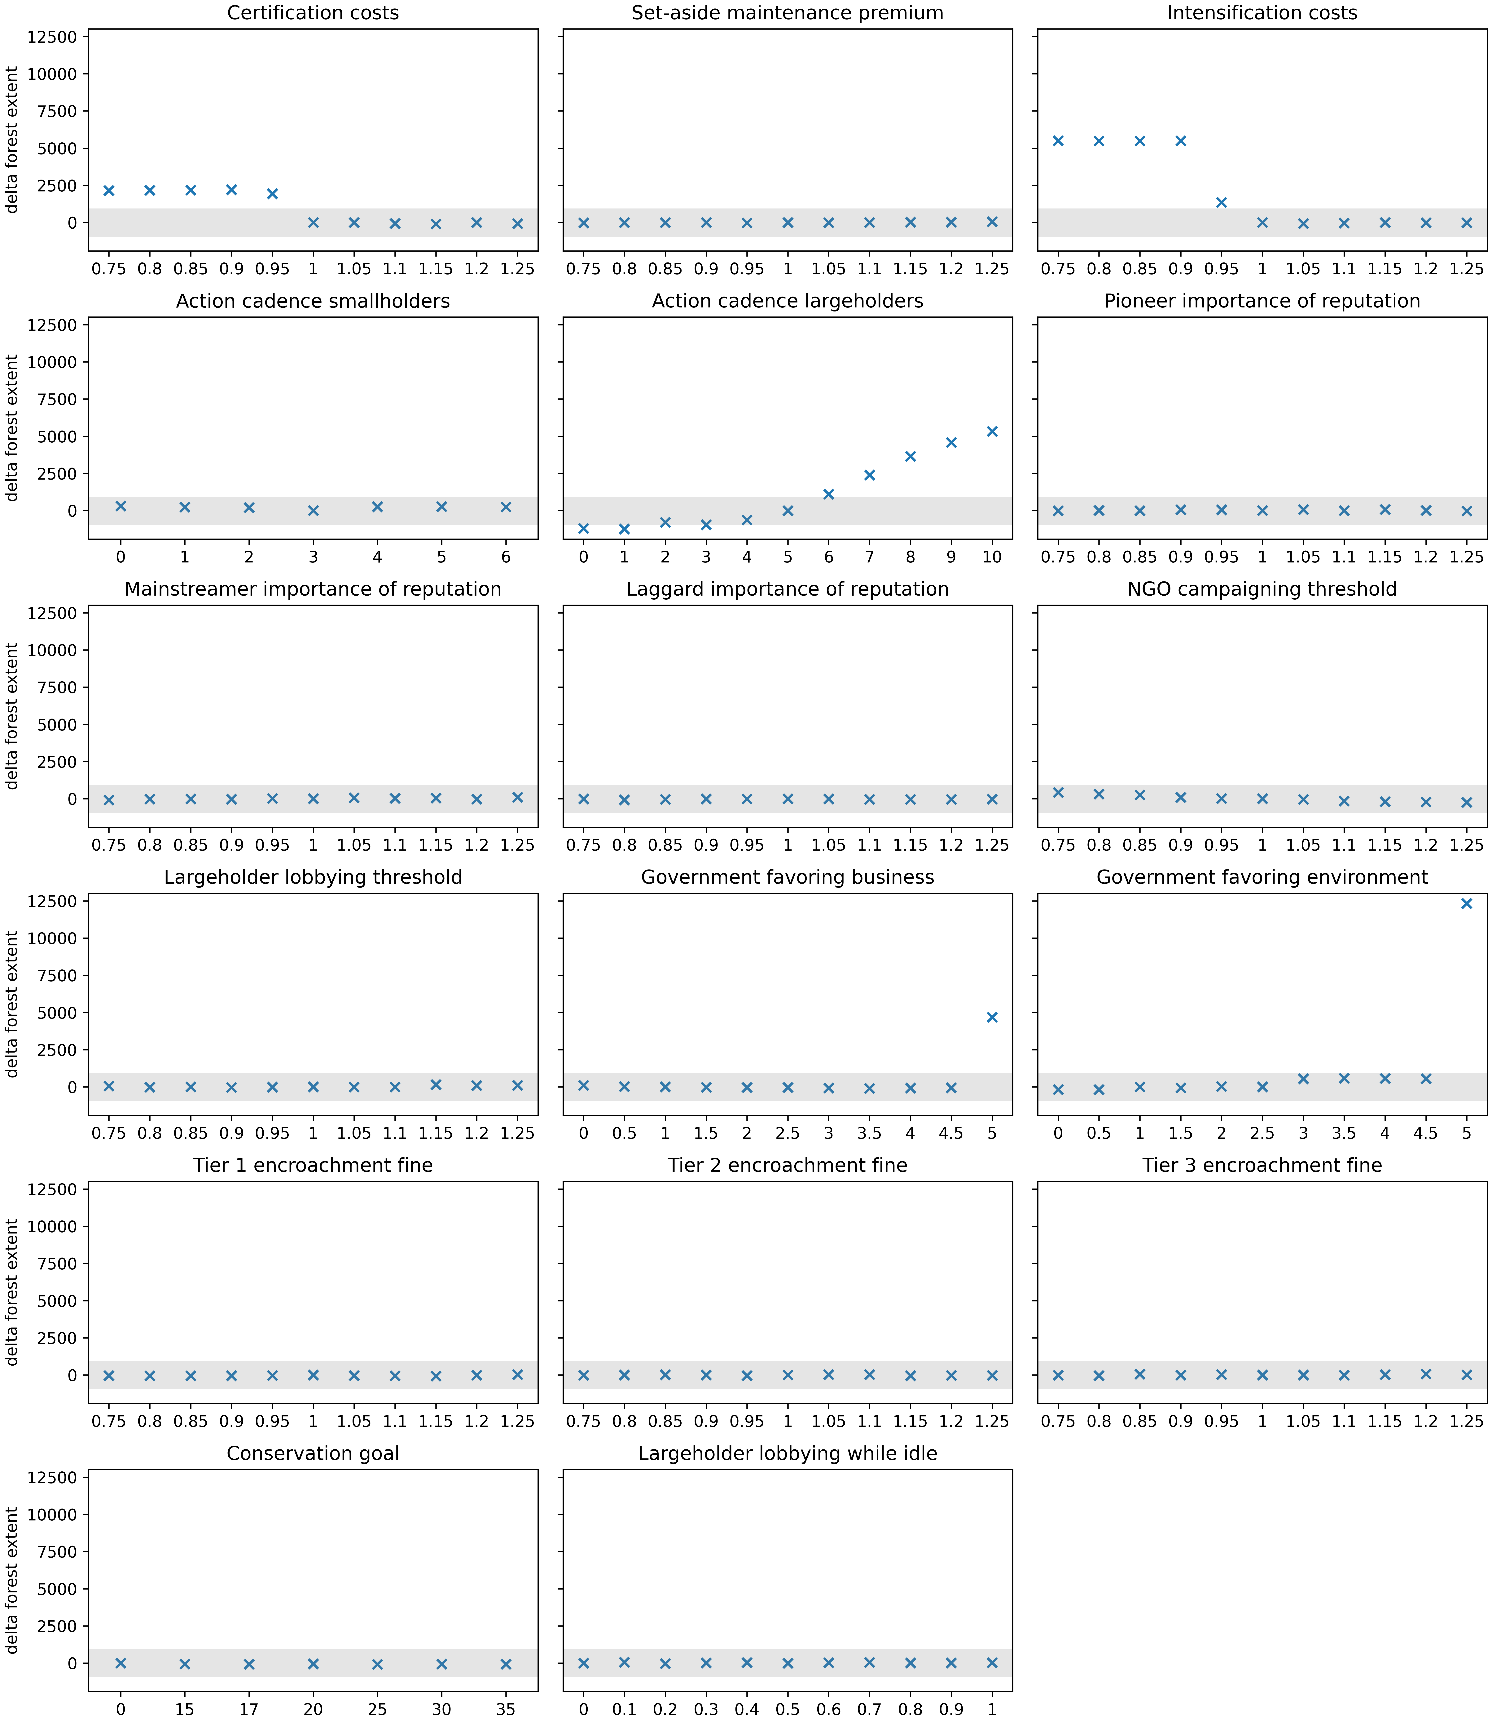
Five parameters displayed threshold behavior, i.e., their impact on the model output became significantly larger once a threshold was crossed (Figure 5). The parameters describing the government inclination towards the environment and business, for example, saw a spike in sensitivity at input value five. Normalized sensitivities for the cost of eco-certification and intensification showed an inverse behavior where sensitivity dropped after passing a certain input value. The action cadence of largeholder agents displayed a steady increase in sensitivity across the entire range of input variables. Normalized sensitivities of twelve parameters remained within the range of three standard deviations.
Global sensitivity analysis
The first global sensitivity analysis included 17 parameters and showed that the model is highly sensitive to the parameter Action cadence largeholder with a Pearson correlation coefficient of 0.975, indicating a near-perfect positive correlation. The first-order (S1) and total (ST) Sobol′ indices of 0.995 and 0.999 respectively show that Action cadence largeholder contributes to 99.9% of the output variance of the model. The remaining parameters displayed insignificant correlation coefficients and Sobol′ indices.
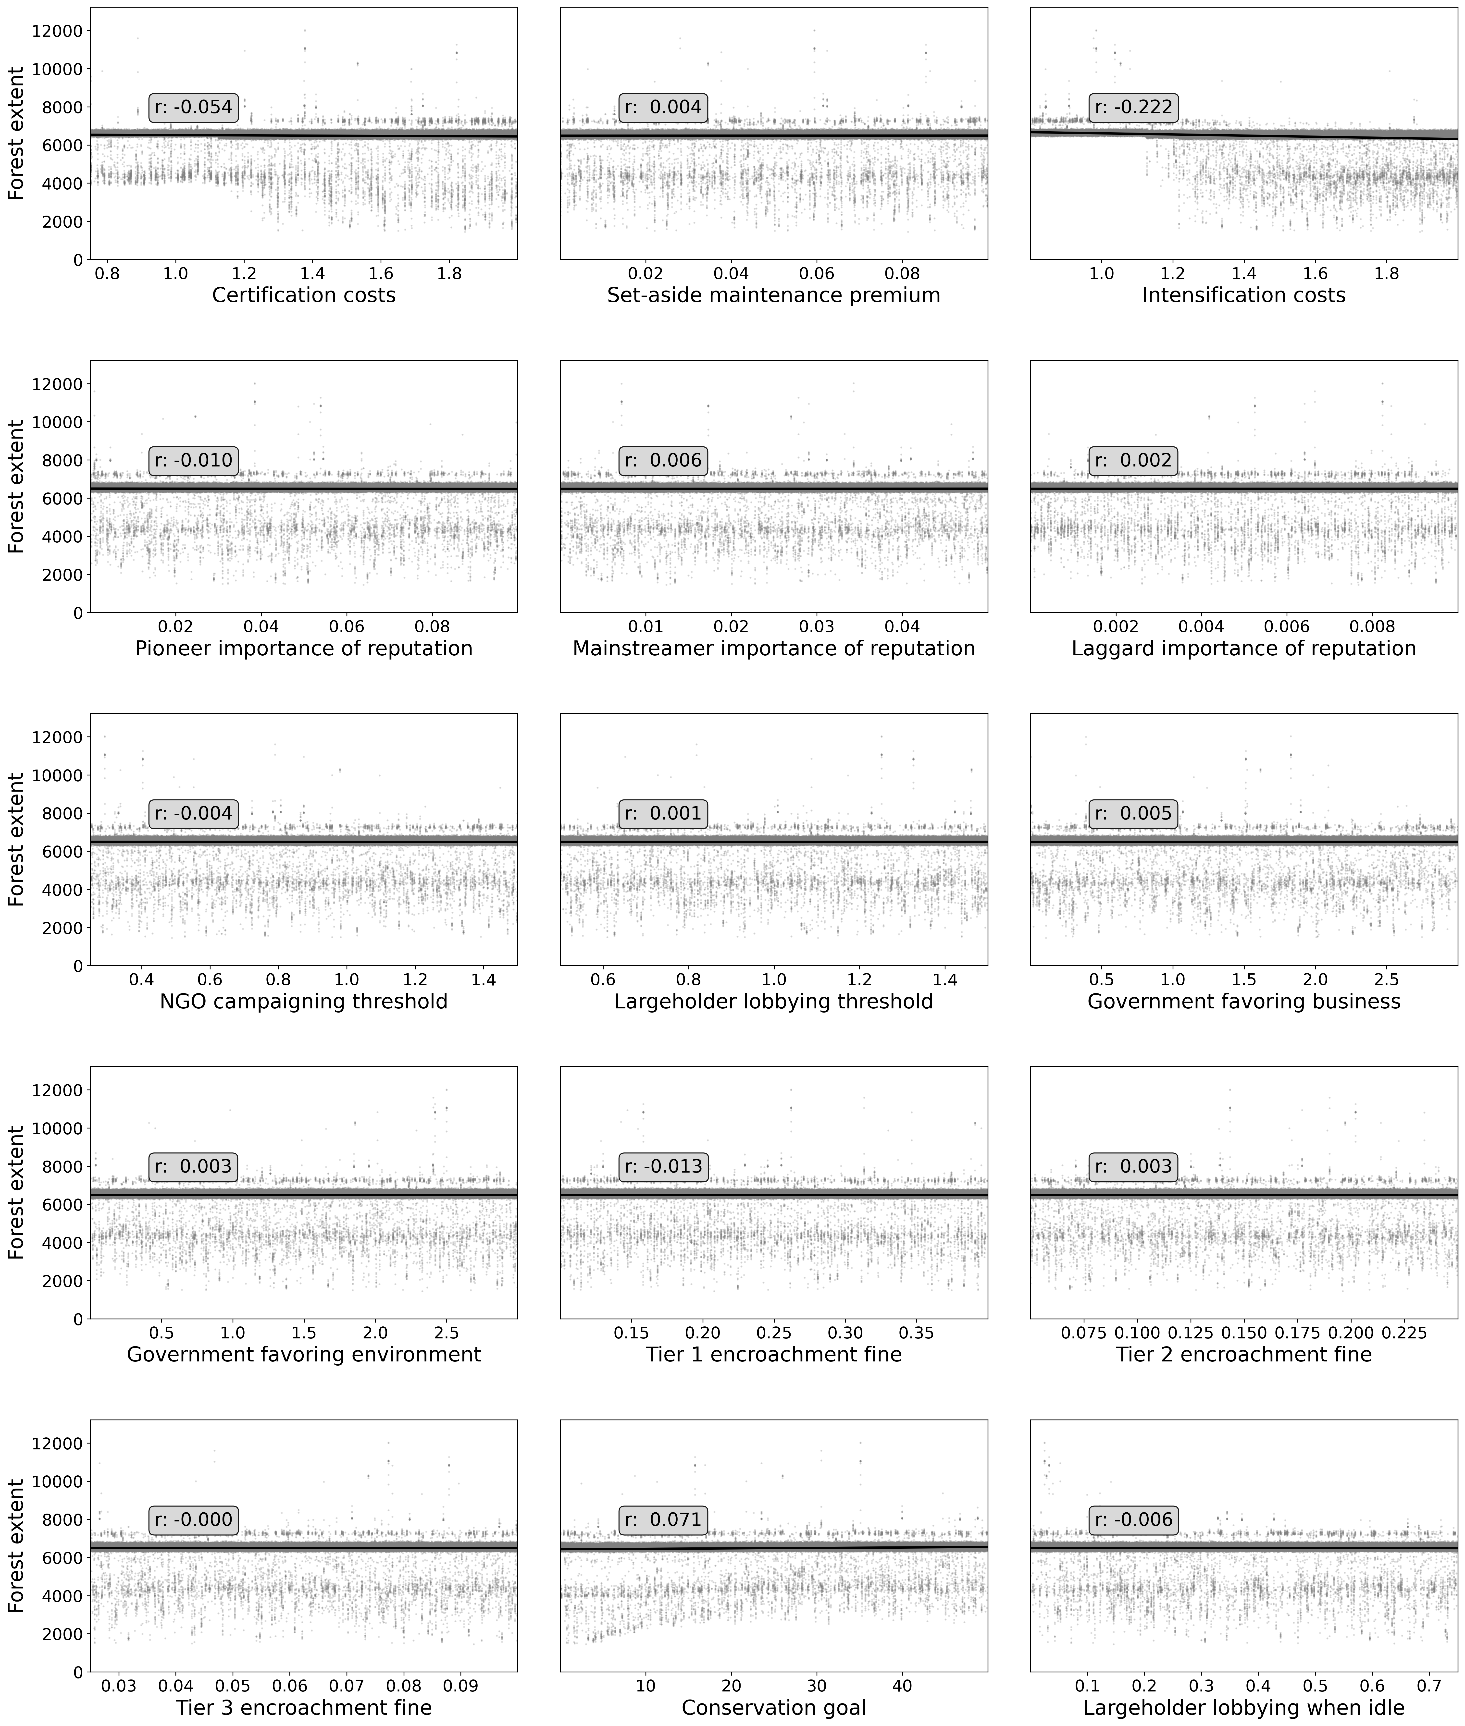
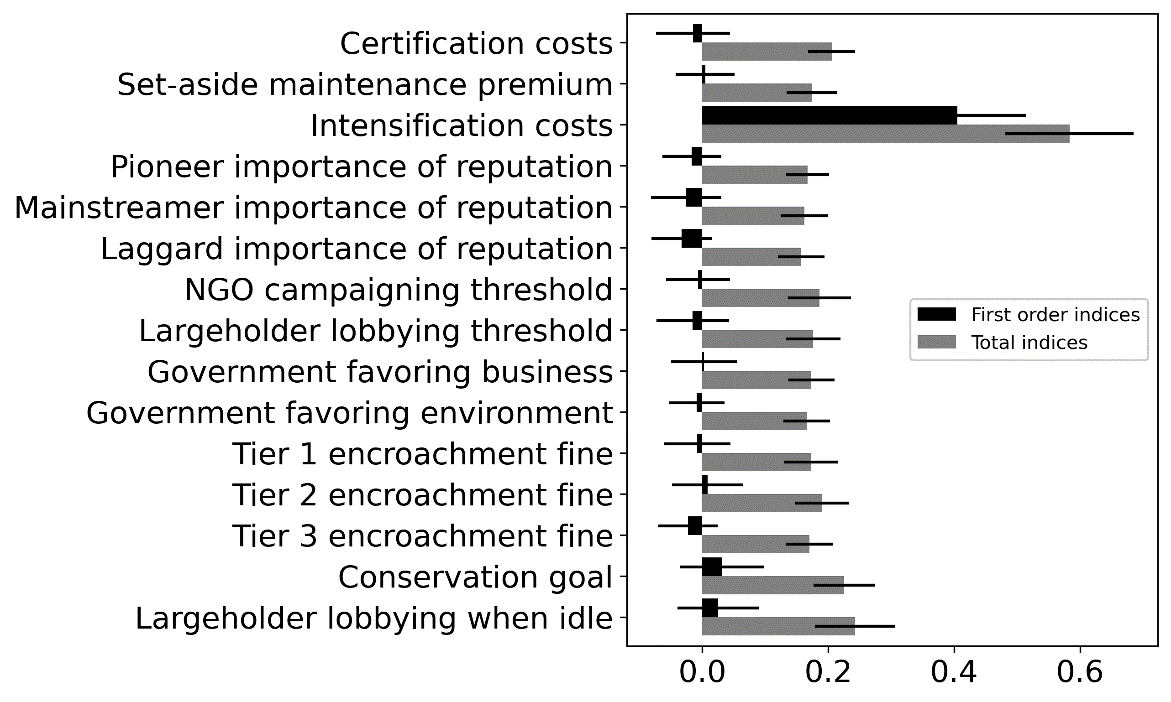
The second global sensitivity analysis shows that in the absence of Action cadence largeholder, Intensification costs have the highest correlation coefficient with \(r = -0.222\), followed by Conservation goal (\(r = 0.071\)), and Eco-certification cost (\(r = -0.054\)) (Figure 6). These parameters also display high first-order and total Sobol′ indices (Figure 7) with Intensification cost contributing 58% to the output variance. The remaining parameters contribute between 15.7% (Laggard importance of reputation) and 24.2% (Largeholder lobbying when idle) to the outcome variance. With the exception of Intensification cost, the parameters show large discrepancies between the first-order and total Sobol′ indices, indicating that in isolation these parameters do not contribute substantially to the variance in output (first-order indices). Only when interacting with other parameters, their influence becomes more substantial (total indices).
Discussion
The three scenarios demonstrate the ability of the ABSOLUG model to replicate forest cover patterns observed in real world systems. The hands-off scenario exhibits continuous deforestation resulting in 87% reduction in forest extent. Similar levels of forest cover decline have been recorded in several tropical jurisdictions since the middle of the 20th century, including Côte d’Ivoire, Ghana, Uganda, Riau, IND, Sabah, MYS, and Sarawak, MYS (Aleman et al. 2018; Bryan et al. 2013; Tsujino et al. 2016; Uryu et al. 2008). Deforestation, i.e., agricultural expansion, occurred in concentric circles around the central marketplace due to growers opting for patches with high land-rents close to the central marketplace. The model thus replicated behavior and patterns described by von Thünen’s model of agricultural land use (Ricardo & Gonner 1891; Thünen 1826). As the simulation progresses, agents expand the agricultural frontier because of competition for profitable patches and diminishing transportation costs over time, a pattern described by the forest transition theory (Angelsen 2007).
The proactive government scenario displays a similar trend of forest cover loss during the first half of the simulation before deforestation seizes and reforestation occurs. This is the result of an ambitious conservation target (40%) and a pro-environmental attitude by the government, as well as a lower campaigning threshold for NGOs. The subsequent forest cover curve resembles that of the forest transition theory and the turning point occurred around 30% forest cover, similar to turning points observed in tropical systems that underwent a forest transition such as Costa Rica or Vietnam (Meyfroidt & Lambin 2008; Rudel et al. 2005).
The middle-ground scenario represents the trajectory for a government that committed to protect 17% of its terrestrial area according to the Aichi targets but shows no ambition beyond this target and is faced with a challenging socio-economic environment, which is manifested in zero net deforestation after year thirty. In contrast to the proactive government scenario, forest cover increases slower, which is caused by a simultaneous increase in encroachment. This suggests that the government faces challenges in enforcing protected areas and largeholders have little incentive to engage in reputation-preserving activities, similar to dynamics that can be observed in countries like Cameroon which struggle to enforce environmental regulations and have to grapple with bad private actors (Ordway et al. 2017). Pioneer and mainstreamer largeholders engage in an initiative to reduce deforestation which led to an increase in eco-certification and fewer encroachments. However, this effect is limited as progressive largeholders are outnumbered by laggard actors who do not undergo behavioral change and continue to deforest protected areas. This correspond to observations that forest loss continues to be driven by permanent land use change for commodity production (Curtis et al. 2018) and that private sector-led initiatives may not be suited to address the issue of deforestation at scale (Lambin et al. 2018).
In the proactive government scenario, reforestation is primarily achieved by designation of protected areas, as opposed to abandonment of land, suggesting a transition initiated by a strong government with an ambitious conservation target (Meyfroidt & Lambin 2008). Protected areas have been designated in remote areas of the landscape and preferably on patches with intact forest cover, resembling a bias of protected area locations towards marginal and remote lands with little additionality, which has been described in real-world systems (Joppa & Pfaff 2009). The area under protection in the hands-off scenario displays a ragged trajectory, caused by continuous encroachment followed by designation of protected areas. Decreasing land-taxes and insufficient fines made encroachment profitable for some agents (mainstreamer and laggard largeholders), suggesting an inefficient approach by the government to achieving reforestation. Increased lobbying pressure from largeholders caused the government to lower land-taxes, thus undermining its efforts to achieving the conservation goal.
The OFAT sensitivity analysis showed that four parameters (Government favoring business, Government favoring environment, Intensification cost, and Eco-certification cost) exhibit threshold behavior where their sensitivities change significantly after a tipping point is crossed. The parameter Action cadence largeholder also had a high sensitivity value, but sensitivity changed more gradually. The remaining twelve parameters show low normalized sensitivity values, suggesting that input changes for these parameters will not result in nonlinearities or unexpected model behavior (ten Broeke et al. 2016). Interactions among parameters, however, are not captured with the OFAT analysis and results need to be interpreted alongside the results from the global sensitivity analysis.
The global sensitivity analysis with 17 parameters shows that the model is highly sensitive to changes in the parameter Action cadence largeholder which determines how frequently largeholders can carry out an action, e.g., convert forest to cropland or certify existing crop patches. This is not entirely unexpected since the action cadence acts as a multiplier for other production-related parameters such as eco-certification and intensification costs. For example, if a largeholder faces low production costs coupled with a high action cadence, it will engage in conversion or intensification at a high rate thus leading to increased deforestation, and vice-versa. The high degree of sensitivity, however, makes it difficult to assess how other parameters influence the outcome. Therefore, we conducted a second global sensitivity analysis without Action cadence largeholder and Action cadence smallholder. The insights gained from this analysis are relevant to the scenarios explored in this study since they were developed using the same, fixed action cadence for largeholders and smallholders.
The OFAT and Sobol′ sensitivity analyses show that overall, ABSOLUG is robust and has few parameters with threshold behavior, except for the parameter Action cadence largeholder to which the model is highly sensitive. These tipping points and parameter characteristics should be used as guidelines when developing other scenarios of land use governance approaches and need to be considered when interpreting their results in future applications of ABSOLUG. For the scenarios presented here, the action cadence did not vary among the scenarios. Combining local and global sensitivity analyses further highlights that the interaction among parameters influences the model output. For example, the action cadence for largeholders does not stand out in the OFAT analysis but displays the highest sensitivity in the Sobol′ analysis. Conversely, Government favoring environment has the highest \(\delta y_{i}\) in the OFAT analysis but does not stand out from the Sobol′ analysis results.
ABSOLUG will be utilized in future studies to test hypotheses on land use governance interventions in tropical forest frontier systems. Using experiments and scenarios, the next step is to investigate the success of governance interventions under varying social, political, and ecological conditions. Specifically, we are interested in the social, environmental, and operational performance of multi-stakeholder coalitions, government-led approaches, and private sector-driven initiatives, thereby contributing to the refinement and development of theories of land use governance.
Limitations and weaknesses
Due to the complex nature of the socio-ecological systems simulated in ABSOLUG, we made several assumptions and simplifications which should be considered when interpreting the model outputs. In particular, we simplified the agent categories, i.e., smallholders and largeholders (and their sub-categories), to capture their archetypal characteristics, thus omitting nuance and intermediate producer categories. Largeholder agents are fixed in their sub-categories which prohibits the simulation of behavioral adaptation and the monitoring of all possible agent interactions. Furthermore, ABSOLUG cannot capture the dynamics typically encountered in a commodity market since commodity prices as well as price and cost premiums for certification and intensification are fixed. Addressing this limitation would require a partial equilibrium model, which would greatly increase the complexity of the model. The costs of designing, implementing, and operating the policy interventions are not included in the model either.
Conclusion
Assessing the effectiveness of land-use governance in tropical commodities frontiers is challenging due to their long implementation times and barriers for carrying out real world experiments. By replicating feedbacks, agent and system behaviors, agent-based simulations can overcome these barriers to generate theoretical questions or serve as a foundation for developing middle-range theories. We validated our model quantitatively through local and global sensitivity analysis and operationally through scenario analysis. Local sensitivity analysis showed threshold behaviors for four parameters and low normalized sensitivities for twelve parameters. Global sensitivity analysis demonstrated that several parameters display different sensitivities when interacting with other parameters, such as the cost of intensification, or the conservation goal. Overall, the sensitivity analyses suggest that parameters regarding production (intensification and eco-certification costs) and policy interventions (government’s conservation goals) have the highest impact on forest extent.
Analysis of the scenario outputs validated ABSOLUG operationally by replicating three forest cover pathways widely observed in tropical commodity frontier systems: quasi-complete deforestation, stagnation of forest cover at a low level, and a forest transition. These pathways describe the two extreme and a middle ground deforestation trajectories and demonstrate the ability of the model to reproduce land use outputs with high relevance for real-world systems. Through a wider range of scenarios representing specific policy interventions or policy mixes, the ABSOLUG model can contribute to exploring the costs and benefits of land use governance in tropical deforestation frontiers.
Acknowledgments
The authors would like to thank Linnea Shieh, Jevan Bhutani Yu, and Jim Yoon for their support and advice on sensitivity analysis in Python. Special thanks go to Zhiyong Zhang and the Sherlock team for their patience and support in using Stanford University’s High-Performance Computing cluster. The authors would also like to thank all members of the Land Change Lab for their creative ideas and valuable feedback.The authors received no external financial support for the research, authorship, and/or publication of this article and declare that the research was conducted in the absence of any commercial or financial relationships that could be construed as a potential conflict of interest.
Model Documentation
The source code for ABSOLUG is available through the CoMSES Computational Model Library as: ABSOLUG – Agent-based simulation of land-use governance (Version 1.1.0), from: https://www.comses.net/codebases/ead4f596-6987-4829-9c33-08144bda3a03/releases/1.1.0/.References
ABBOTT, K. W., & Snidal, D. (2009). 'The governance triangle: Regulatory standards institutions and the shadow of the state.' In W. Mattli & N. Woods (Eds.), The Politics of Global Regulation (pp. 44–88). Princeton, NJ: Princeton University Press. [doi:10.1515/9781400830732.44]
AGRAWAL, A., Brown, D. G., Rao, G., Riolo, R., Robinson, D. T., & Bommarito, M. (2013). Interactions between organizations and networks in common-pool resource governance. Environmental Science & Policy, 25, 138–146. [doi:10.1016/j.envsci.2012.08.004]
ALEMAN, J. C., Jarzyna, M. A., & Staver, A. C. (2018). Forest extent and deforestation in tropical Africa since 1900. Nature Ecology & Evolution, 2(1), 26–33. [doi:10.1038/s41559-017-0406-1]
AN, L., Linderman, M., Qi, J., Shortridge, A., & Liu, J. (2005). Exploring complexity in a human-Environment system: An agent-Based spatial model for multidisciplinary and multiscale integration. Annals of the Association of American Geographers, 95(1), 54–79. [doi:10.1111/j.1467-8306.2005.00450.x]
ANDERSEN, L. E., Groom, B., Killick, E., Ledezma, J. C., Palmer, C., & Weinhold, D. (2017). Modelling land use, deforestation, and policy: A hybrid optimisation-Heterogeneous agent model with application to the Bolivian Amazon. Ecological Economics, 135, 76–90. [doi:10.1016/j.ecolecon.2016.12.033]
ANGELSEN, A. (2007). Forest cover change in space and time: Combining the von Thunen and forest transition theories. Working Paper, World Bank Policy Research (Issue 4117). Available at: https://doi.org/10.1596/1813-9450-4117 [doi:10.1596/1813-9450-4117]
ANTONELI, V., Mosele, A. C., Bednarz, J. A., Pulido-Fernández, M., Lozano-Parra, J., Keesstra, S. D., & Rodrigo-Comino, J. (2019). Effects of applying liquid swine manure on soil quality and yield production in tropical soybean crops (Paraná, Brazil). Sustainability, 11(14), 3898. [doi:10.3390/su11143898]
BACCINI, A., Walker, W., Carvalho, L., Farina, M., Sulla-Menashe, D., & Houghton, R. A. (2017). Tropical forests are a net carbon source based on aboveground measurements of gain and loss. Science, 358(6360), 230–234. [doi:10.1126/science.aam5962]
BARON, D. P., & Diermeier, D. (2007). Strategic activism and nonmarket strategy. Journal of Economics & Management Strategy, 16(3), 599–634. [doi:10.1111/j.1530-9134.2007.00152.x]
BICUDO Da Silva, R. F., Batistella, M., Moran, E., Celidonio, O. L. D. M., & Millington, J. D. A. (2020). The soybean trap: Challenges and risks for Brazilian producers. Frontiers in Sustainable Food Systems, 4, 12. [doi:10.3389/fsufs.2020.00012]
BOOTH, A. (2012). Summary report of planning and management for oil palm plantation municipality of Mouila. Gabon
BRYAN, J. E., Shearman, P. L., Asner, G. P., Knapp, D. E., Aoro, G., & Lokes, B. (2013). Extreme differences in forest degradation in Borneo: Comparing practices in Sarawak, Sabah, and Brunei. PLoS One, 8(7), e69679. [doi:10.1371/journal.pone.0069679]
BYMOLT, R., Laven, A., & Tyszler, M. (2018). Demystifying the cocoa sector in Ghana and Côte d’Ivoire. Chapter 6: Land. Available at: https://www.kit.nl/wp-content/uploads/2018/10/Demystifying-cocoa-sector-chapter6-land.pdf
CALO, M., & Wise, T. a. (2005). Revaluing peasant coffee production: Organic and fair trade markets in Mexico. Global Development and Environment Institute (Issue October). Available at: https://agris.fao.org/ag ris-search/search.do?recordID=GB2013202630
CARODENUTO, S. (2019). Governance of zero deforestation cocoa in West Africa: New forms of public-private interaction. Environmental Policy and Governance, 29(1), 55–66. [doi:10.1002/eet.1841]
CARRERO, G. C., Fearnside, P. M., do Valle, D. R., & de Souza Alves, C. (2020). Deforestation trajectories on a development frontier in the Brazilian Amazon: 35 years of settlement colonization, policy and economic shifts, and land accumulation. Environmental Management, 66(6), 966–984. [doi:10.1007/s00267-020-01354-w]
CATTELAN, A. J., & Dall’Agnol, A. (2018). The rapid soybean growth in Brazil. OCL - Oilseeds and Fats, Crops and Lipids, 25(1), 1–12. [doi:10.1051/ocl/2017058]
CURTIS, P. G., Slay, C. M., Harris, N. L., Tyukavina, A., & Hansen, M. C. (2018). Classifying drivers of global forest loss. Science, 361(6407), 1108–1111. [doi:10.1126/science.aau3445]
DOU, Y., Yao, G., Herzberger, A., da Silva, R. F. B., Song, Q., Hovis, C., Batistella, M., Moran, E., Wu, W., & Liu, J. (2020). Land-Use changes in distant places: Implementation of a telecoupled agent-Based model. Journal of Artificial Societies and Social Simulation, 23(1), 11. [doi:10.18564/jasss.4211]
EBERLEIN, B., Abbott, K. W., Black, J., Meidinger, E., & Wood, S. (2014). Transnational business governance interactions: Conceptualization and framework for analysis. Regulation and Governance, 8(1), 1–21. [doi:10.1111/rego.12030]
FAO (2015). The economic lives of smallholder farmers - An analysis based on household data from nine countries. Available at: http://www.fao.org/3/a-i5251e.pdf
FEINTRENIE, L., Chong, W. K., & Levang, P. (2010). Why do farmers prefer oil palm? Lessons learnt from Bungo District, Indonesia. Small-Scale Forestry, 9(3), 379–396. [doi:10.1007/s11842-010-9122-2]
FENG, Y., Zeng, Z., Searchinger, T. D., Ziegler, A. D., Wu, J., Wang, D., He, X., Elsen, P. R., Ciais, P., Xu, R., Guo, Z., Peng, L., Tao, Y., Spracklen, D. V., Holden, J., Liu, X., Zheng, Y., Xu, P., Chen, J., … Zheng, C. (2022). Doubling of annual forest carbon loss over the tropics during the early twenty-first century. Nature Sustainability, 5, 444–451. [doi:10.1038/s41893-022-00854-3]
FURTADO, B. A., Fuentes, M. A., & Tessone, C. J. (2019). Policy modeling and applications: State-of-the-art and perspectives. Complexity, 2019. [doi:10.1155/2019/5041681]
FURUMO, P. R., & Lambin, E. F. (2020). Scaling up zero-deforestation initiatives through public-private partnerships: A look inside post-conflict Colombia. Global Environmental Change, 62, 102055. [doi:10.1016/j.gloenvcha.2020.102055]
FURUMO, P. R., & Lambin, E. F. (2021). Policy sequencing to reduce tropical deforestation. Global Sustainability, 4, e24. [doi:10.1017/sus.2021.21]
FURUMO, P. R., Rueda, X., Rodríguez, J. S., & Parés Ramos, I. K. (2020). Field evidence for positive certification outcomes on oil palm smallholder management practices in Colombia. Journal of Cleaner Production, 245, 118891. [doi:10.1016/j.jclepro.2019.118891]
GEIST, H. J., & Lambin, E. F. (2002). Proximate causes and underlying driving forces of tropical deforestation. BioScience, 52(2), 143–150. [doi:10.1641/0006-3568(2002)052[0143:pcaudf]2.0.co;2]
GILBERT, N. (2008). Agent-Based Models. London: Sage.
GLASBERGEN, P. (2018). Smallholders do not eat certificates. Ecological Economics, 147, 243–252. [doi:10.1016/j.ecolecon.2018.01.023]
GREENPEACE. (2010). Caught red-Handed: How Nestlé’s use of palm oil is having a devastating impact on rainforest, the climate and orang-utans. Available at: https://www.greenpeace.org/usa/research/caught-red-handed-how-nestle/
GRIMM, V., Berger, U., Bastiansen, F., Eliassen, S., Ginot, V., Giske, J., Goss-Custard, J., Grand, T., Heinz, S. K., Huse, G., Huth, A., Jepsen, J. U., Jørgensen, C., Mooij, W. M., Müller, B., Pe’er, G., Piou, C., Railsback, S. F., Robbins, A. M., … DeAngelis, D. L. (2006). A standard protocol for describing individual-based and agent-based models. Ecological Modelling, 198(1–2), 115–126. [doi:10.1016/j.ecolmodel.2006.04.023]
GRIMM, V., Berger, U., DeAngelis, D. L., Polhill, J. G., Giske, J., & Railsback, S. F. (2010). The ODD protocol: A review and first update. Ecological Modelling, 221(23), 2760–2768. [doi:10.1016/j.ecolmodel.2010.08.019]
HASLAM, P. A., & Godfrid, J. (2020). Activists and regulatory politics: Institutional opportunities, information, and the activation of environmental regulation. The Extractive Industries and Society, 7(3), 1077–1085. [doi:10.1016/j.exis.2020.06.019]
HAUSER, S., & Norgrove, L. (2013). Slash-and-Burn agriculture, Effects of. In S. A. Levin (Ed.), Encyclopedia of biodiversity (6th Ed.) (pp. 551–562). Amsterdam: Elsevier. [doi:10.1016/b978-0-12-384719-5.00125-8]
HEILMAYR, R., Echeverría, C., & Lambin, E. F. (2020). Impacts of Chilean forest subsidies on forest cover, carbon and biodiversity. Nature Sustainability, 3, 701–709. [doi:10.1038/s41893-020-0547-0]
HERMAN, J., & Usher, W. (2017). SALib: An open-source Python library for Sensitivity Analysis. The Journal of Open Source Software, 2, 9. [doi:10.21105/joss.00097]
HIGH Ambition Coalition for Nature and People. (2019). Concept note. High Ambition Coalition for Nature & People
HIPÓLITO, J., Boscolo, D., & Viana, B. F. (2018). Landscape and crop management strategies to conserve pollination services and increase yields in tropical coffee farms. Agriculture, Ecosystems & Environment, 256, 218–225.
HOSPES, O. (2014). Marking the success or end of global multi-stakeholder governance? The rise of national sustainability standards in Indonesia and Brazil for palm oil and soy. Agriculture and Human Values, 31(3), 425–437. [doi:10.1007/s10460-014-9511-9]
HOYLE, D. (2015). HCV Assessment Summary Mouila Lot 3. Ngounié, Gabon. Available at: https://www.olamgroup.com/content/dam/olamgroup/files/uploads/2016/12/Description-of-the-Three-New-Oil-Palm-Estates-Being-Developed-by-Olam-in-Gabon-3.pdf
HSU, A., Moffat, A. S., Weinfurter, A. J., & Schwartz, J. D. (2015). Towards a new climate diplomacy. Nature Climate Change, 5(6), 501–503. [doi:10.1038/nclimate2594]
HSU, A., Weinfurter, A. J., & Xu, K. (2017). Aligning subnational climate actions for the new post-Paris climate regime. Climatic Change, 142(3), 419–432. [doi:10.1007/s10584-017-1957-5]
HUTABARAT, S., Slingerland, M., Rietberg, P., & Dries, L. (2018). Costs and benefits of certification of independent oil palm smallholders in Indonesia. International Food and Agribusiness Management Review, 21(6), 6681–6700. [doi:10.22434/ifamr2016.0162]
IBGE. (2017). Censo agro 2017. Instituto Brasileiro de Geografia e Estatistica - IBGE
JANSSEN, M. (2020). Governing the commons (1.0.0.). CoMSES Computational Model Library
JAXA-ROZEN, M., & Kwakkel, J. H. (2018). PyNetLogo: Linking NetLogo with Python. Journal of Artificial Societies and Social Simulation, 21(2), 4. [doi:10.18564/jasss.3668]
JÄNICKE, M. (1992). Conditions for environmental policy success: An international comparison. Environmentalist, 12, 47–58.
JOPPA, L. N., & Pfaff, A. (2009). High and far: Biases in the location of protected areas. PLoS ONE, 4(12), e8273. [doi:10.1371/journal.pone.0008273]
KREMMYDAS, D., Athanasiadis, I. N., & Rozakis, S. (2018). A review of agent based modeling for agricultural policy evaluation. Agricultural Systems, 164, 95–106. [doi:10.1016/j.agsy.2018.03.010]
LAKHAL, S. Y., Sidibé, H., & H’Mida, S. (2008). Comparing conventional and certified organic cotton supply chains: The case of Mali. International Journal of Agricultural Resources, Governance and Ecology, 7(3), 243–255. [doi:10.1504/ijarge.2008.018328]
LAMBIN, E. F., Gibbs, H. K., Heilmayr, R., Carlson, K. M., Fleck, L. C., Garrett, R. D., le Polain de Waroux, Y., McDermott, C. L., McLaughlin, D., Newton, P., Nolte, C., Pacheco, P., Rausch, L. L., Streck, C., Thorlakson, T., & Walker, N. F. (2018). The role of supply-chain initiatives in reducing deforestation. Nature Climate Change, 8(2), 109–116. [doi:10.1038/s41558-017-0061-1]
LAMBIN, E. F., Kim, H., Leape, J., & Lee, K. (2020). Scaling Up solutions For A Sustainability Transition. Cambridge: Cambridge University Press. [doi:10.1016/j.oneear.2020.06.010]
LE, Q. B., Park, S. J., Vlek, P. L. G., & Cremers, A. B. (2008). Land-Use dynamic simulator (LUDAS): A multi-agent system model for simulating spatio-temporal dynamics of coupled human-landscape system. I. Structure and theoretical specification. Ecological Informatics, 3(2), 135–153. [doi:10.1016/j.ecoinf.2008.04.003]
LEATHERDALE, S. T. (2019). Natural experiment methodology for research: A review of how different methods can support real-world research. International Journal of Social Research Methodology, 22(1), 19–35. [doi:10.1080/13645579.2018.1488449]
LOUIE, M. A., & Carley, K. M. (2008). Balancing the criticisms: Validating multi-agent models of social systems. Simulation Modelling Practice and Theory, 16(2), 242–256. [doi:10.1016/j.simpat.2007.11.011]
MAASS Wolfenson, K. D. (2013). Coping with the food and agriculture challenge: Smallholders’ agenda. 2012 United Nations Conference on Sustainable Development (Rio+20), April, 47
MATHER, A. S. (1992). The forest transition. The Royal Geographical Socie, 24(4), 367–379.
MATTHEWS, R. B., Gilbert, N. G., Roach, A., Polhill, J. G., & Gotts, N. M. (2007). Agent-based land-use models: A review of applications. Landscape Ecology, 22(10), 1447–1459. [doi:10.1007/s10980-007-9135-1]
MERTZ, O., Padoch, C., Fox, J., Cramb, R. A., Leisz, S. J., Lam, N. T., & Vien, T. D. (2009). Swidden change in southeast Asia: Understanding causes and consequences. Human Ecology, 37(3), 259–264. [doi:10.1007/s10745-009-9245-2]
MEYFROIDT, P., Chowdhury, R. R., de Bremond, A., Ellis, E. C., Erb, K. H., Filatova, T., Garrett, R. D., Grove, J. M., Heinimann, A., Kuemmerle, T., Kull, C. A., Lambin, E. F., Landon, Y., le Polain de Waroux, Y., Messerli, P., Müller, D., Nielsen, J. O., Peterson, G. D., Rodriguez García, V., … Verburg, P. H. (2018). Middle-range theories of land system change. Global Environmental Change, 53, 52–67. [doi:10.1016/j.gloenvcha.2018.08.006]
MEYFROIDT, P., & Lambin, E. F. (2008). Forest transition in Vietnam and its environmental impacts. Global Change Biology, 14(6), 1319–1336. [doi:10.1111/j.1365-2486.2008.01575.x]
MEYFROIDT, P., & Lambin, E. F. (2011). Global forest transition: Prospects for an end to deforestation. Annual Review of Environment and Resources, 36, 343–371. [doi:10.1146/annurev-environ-090710-143732]
MUELLER, N. D., Gerber, J. S., Johnston, M., Ray, D. K., Ramankutty, N., & Foley, J. A. (2012). Closing yield gaps through nutrient and water management. Nature, 490(7419), 254–257. [doi:10.1038/nature11420]
MÜLLER, B., Bohn, F., Dressler, G., Groeneveld, J., Klassert, C., Martin, R., Schlüter, M., Schulze, J., Weise, H., & Schwarz, N. (2013). Describing human decisions in agent-based models – ODD + D, an extension of the ODD protocol. Environmental Modelling & Software, 48, 37–48.
NELSON, J. (2013). 'Scaling up impact through public-Private partnerships.' In L. Chandy, A. Hosono, H. Kharas, & J. Linn (Eds.), Getting To Scale: How To Bring Development Solutions To Millions Of Poor People (pp. 305–362). DC: Brookings Institution Press.
NORTON, J. (2015). An introduction to sensitivity assessment of simulation models. Environmental Modelling & Software, 69, 166–174. [doi:10.1016/j.envsoft.2015.03.020]
ORDWAY, E. M., Naylor, R. L., Nkongho, R. N., & Lambin, E. F. (2017). Oil palm expansion in Cameroon: Insights into sustainability opportunities and challenges in Africa. Global Environmental Change, 47, 190–200. [doi:10.1016/j.gloenvcha.2017.10.009]
OSTROM, E. (2009). A general framework for analyzing sustainability of social-Ecological systems. Science, 325, 419–422. [doi:10.1126/science.1172133]
PCI Mato Grosso. (2021). Desenvolvimento sustentável produzir conservar e incluir. Available at: http://pci.mt.gov.br/
PELZER, K. J. (1945). Pioneer Settlement In The Asiatic Tropics. Studies in Land Utilisation And Agricultural Colonization In Southeastern Asia. New York, NY: American Geographical Society.
PIRKER, J., Mosnier, A., Kraxner, F., Havlík, P., & Obersteiner, M. (2016). What are the limits to oil palm expansion? Global Environmental Change, 40, 73–81. [doi:10.1016/j.gloenvcha.2016.06.007]
POORTER, L., Craven, D., Jakovac, C. C., van der Sande, M. T., Amissah, L., Bongers, F., Chazdon, R. L., Farrior, C. E., Kambach, S., & Meave, J. A. and others. (2021). Multidimensional tropical forest recovery. Science, 374(6573), 1370–1376.
PUYRAVAUD, J.-P. (2003). Standardizing the calculation of the annual rate of deforestation. Forest Ecology and Management, 177(1), 593–596. [doi:10.1016/s0378-1127(02)00335-3]
RHEBERGEN, T., Zingore, S., Giller, K. E., Frimpong, C. A., Acheampong, K., Ohipeni, F. T., Panyin, E. K., Zutah, V., & Fairhurst, T. (2020). Closing yield gaps in oil palm production systems in Ghana through best management practices. European Journal of Agronomy, 115(12601), 1. [doi:10.1016/j.eja.2020.126011]
RICARDO, D., & Gonner, E. C. K. (1891). Principles of Political Economy and Taxation. George Bell & Sons.
RICHTER, B. K., Samphantharak, K., & Timmons, J. F. (2009). Lobbying and taxes. American Journal of Political Science, 53(4), 893–909. [doi:10.1111/j.1540-5907.2009.00407.x]
RITTER, F. E., Schoelles, M. J., Quigley, K. S., & Klein, L. C. (2011). 'Determining the number of simulation runs: Treating simulations as theories by not sampling their behavior.' In L. Rothrock & S. Narayanan (Eds.), Human-in-the-loop simulations: Methods and practice (pp. 97–116). Berlin Heidelberg: Springer. [doi:10.1007/978-0-85729-883-6_5]
RODRIGUES, A. S. L., Ewers, R. M., Parry, L., Souza, C., Veríssimo, A., & Balmford, A. (2009). Boom-and-bust development patterns across the amazon deforestation frontier. Science, 324(5933), 1435–1437. [doi:10.1126/science.1174002]
RSPO. (2018). Principles and criteria for the production of sustainable palm oil. Available at: https://www.bsigroup.com/en-AU/RSPO-for-Sustainable-Palm-Oil/rspo-principles-and-criteria/
RTRS. (2017). RTRS Standard for Responsible Soy Production V3.1. Available at: https://responsiblesoy.org/wp-content/uploads/2019/08/RTRS%20Standard%20Responsible%20Soy%20production%20V3.1%20ING-LOW.pdf
RUDEL, T. K., Coomes, O. T., Moran, E., Achard, F., Angelsen, A., Xu, J., & Lambin, E. (2005). Forest transitions: Towards a global understanding of land use change. Global Environmental Change, 15(1), 23–31. [doi:10.1016/j.gloenvcha.2004.11.001]
RUDEL, T. K., Defries, R., Asner, G. P., & Laurence, W. F. (2009). Changing drivers of deforestation and new opportunities for conservation. Conservation Biology, 23(6), 1396–1405. [doi:10.1111/j.1523-1739.2009.01332.x]
SALTELLI, A. (2002). Making best use of model evaluations to compute sensitivity indices. Computer Physics Communications, 145(2), 280–297. [doi:10.1016/s0010-4655(02)00280-1]
SALTELLI, A., & Annoni, P. (2010). How to avoid a perfunctory sensitivity analysis. Environmental Modelling & Software, 25(12), 1508–1517. [doi:10.1016/j.envsoft.2010.04.012]
SALTELLI, A., Annoni, P., Azzini, I., Campolongo, F., Ratto, M., & Tarantola, S. (2010). Variance based sensitivity analysis of model output. Design and estimator for the total sensitivity index. Computer Physics Communications, 181(2), 259–270. [doi:10.1016/j.cpc.2009.09.018]
SCBD. (2011). Quick guide to the Aichi biodiversity targets - Protected areas increased and improved. Secretariat of the Convention for Biological Diversity. Available at: https://www.cbd.int/doc/strategic-plan/targets/T11-quick-guide-en.pdf
SCRIVEN, S. A., Carlson, K. M., Hodgson, J. A., McClean, C. J., Heilmayr, R., Lucey, J. M., & Hill, J. K. (2019). Testing the benefits of conservation set-asides for improved habitat connectivity in tropical agricultural landscapes. Journal of Applied Ecology, 56(10), 2274–2285. [doi:10.1111/1365-2664.13472]
SEN, A. (2017). Rational behaviour. In M. Vernengo, E. Perez Caldentey, & B. J. Rosser Jr (Eds.), The New Palgrave Dictionary of Economics (pp. 1–14). Palgrave Macmillan, UK.
SETBOONSARNG, S., Stefan, A., Leung, P. S., & Cai, J. (2008). Profitability of organic agriculture in a transition economy: The case of organic contract rice farming in Lao PDR. 16th IFOAM Organic World Congress [doi:10.4337/9781847203168.00016]
SOBOL, I. M. (2001). Global sensitivity indices for nonlinear mathematical models and their Monte Carlo estimates. Mathematics and Computers in Simulation, 55(1), 271–280.
TEN Broeke, G., van Voorn, G., & LigTENberg, A. (2016). Which sensitivity analysis method should i use for my agent-Based model? Journal of Artificial Societies and Social Simulation, 19(1), 5. [doi:10.18564/jasss.2857]
THÜNEN, J. H. von. (1826). Der isolierte Staat in Beziehung auf Landwirtschaft und Nationalökonomie, oder, Untersuchungen über den Einfluss den die Getriedepreise, der Reichthum des Bodens und die Abgaben auf den Ackerbau ausüben. Wirtschaft & Finan.
TSUJINO, R., Yumoto, T., Kitamura, S., Djamaluddin, I., & Darnaedi, D. (2016). History of forest loss and degradation in Indonesia. Land Use Policy, 57, 335–347. [doi:10.1016/j.landusepol.2016.05.034]
URYU, Y., Mott, C., Foead, N., Yulianto, K., Budiman, A., Setiabudi, Takakai, F., Nursamsu, Sunarto, Purastuti, E., Fadhli, N., Hutajulu, C. M. B., Jaenicke, J., Hatano, R., Siegert, F., & Stüwe, M. (2008). Forest Degradation, Biodiversity Loss and CO2 Emissions in Riau, Sumatra, Indonesia. Available at: https://files.worldwildlife.org/wwfcmsprod/files/Publication/file/2i5fo6l9lz_WWF_Indo__27Feb08__Riau_Deforestation___English.pdf
USDA. (2009). INDONESIA: Palm oil production growth to continue.
VALBUENA, D., Verburg, P. H., Bregt, A. K., & Ligtenberg, A. (2010). An agent-based approach to model land-use change at a regional scale. Landscape Ecology, 25(2), 185–199. [doi:10.1007/s10980-009-9380-6]
VON Essen, M., & Lambin, E. F. (2021). Jurisdictional approaches to sustainable resource use. Frontiers in Ecology and the Environment, 19(3), 159–167. [doi:10.1002/fee.2299]
WILENSKY, U. (1999). NetLogo. Center for Connected Learning and Computer-Based Modeling, Northwestern University, Evanston, IL. Available at: https://ccl.northwestern.edu/netlogo/