The Role of Social Identity in a Population's Adoption of Prosocial Common-Pool Behavior

,
and
aStanford University, United States; bZaporizhzhia National University, Ukraine; cWestern Oregon University, United States
Journal of Artificial
Societies and Social Simulation 26 (3) 10
<https://www.jasss.org/26/3/10.html>
DOI: 10.18564/jasss.5132
Received: 04-May-2022 Accepted: 27-Apr-2023 Published: 30-Jun-2023
Abstract
Prosocial common-pool behavior – subtractable and non-excludable behavior that benefits others – is essential for the survival of any population of social individuals. The behavior, however, usually carries a cost to those who contribute it, placing them at a disadvantage with respect to those who freeride – those who do not contribute but still benefit. How populations sustain existing or adopt new prosocial common-pool behaviors remains unclear. We introduce a theoretical agent-based model and use it to study the role of social identity in a population’s adoption of such behavior. Social identity is relevant because it influences the behavior of individuals in a group, including their willingness to behave prosocially. Our model simulates the emergence of multiple and dynamic social identities of agents within self-organizing groups. Our simulation results suggest that the role of social identity may depend substantially on the density of the population and the commitment level of population members to their groups; that the relationship between density, commitment, and adoption may be nuanced; that, under lower density levels, mobility between groups may be essential; and that the persistence and adoption of prosocial behavior in a population may be overwhelmingly driven by individuals who are highly committed to their groups. The results caution against the influence of two looming worldwide trends – an increase in population density and a decrease in group commitment. The results suggest that, when combined, these two trends may produce the lowest adoption levels of prosocial behavior, the adverse and population-wide repercussions of which could be catastrophic. Finally, our results suggest that social identity may play a helpful role in offsetting the consequences of these trends, implying a need for further empirical and experimental study of the subject and future consideration of incorporating the role of social identity into policy analysis and design.Introduction
Prosocial behavior (i.e., behavior that benefits others; Twenge et al. 2007; e.g., cooperating, helping, sharing) is essential for the survival of any population of social individuals. It is central in resolving social dilemmas (Kollock 1998), such as existential resource management challenges (Cumming 2018; Gardner et al. 1990; Radosavljevic 2021; Schlager 2002), and in maintaining well-being during difficult times (e.g., the COVID-19 pandemic; Haller et al. 2022). Prosocial common-pool behavior (as opposed to club, private, or public) is a form of such behavior that is subtractable (benefit to one individual reduces possible benefit to another) and non-excludable (benefit is not easily limited to specific individuals) (Sotnik et al. 2022). Examples include volunteering in shared spaces, such as building and cleaning (Simon & Mobekk 2019); prosocial competition, which involves competing in a way that promotes a healthy environment (Gilbert & Basran 2019); and adhering to shared rules when consuming a common-pool resource (Ostrom et al. 1994; Ostrom 2000).
Prosocial common-pool behavior often carries a cost for its contributors. There are also often freeriders, i.e., individuals who (intentionally or unintentionally) avoid this cost by not adopting the behavior while still benefiting from it. The extra cost often positions those contributing prosocial common-pool behavior at a (sometimes substantial) disadvantage to those who do not. How do populations then sustain existing or adopt new prosocial common-pool behaviors? How could they do better at promoting such behavior? Such questions remain active research topics (e.g., Axelrod 1984; Bowles & Gintis 2004; Denant-Boemont et al. 2007; Isaac & Walker 1988; Leibo et al. 2017; Masclet et al. 2003; Ostrom et al. 1994; Schill et al. 2016; Schlüter & Pahl-Wostl 2007). Greater insight into these topics could inform the design of policies that prevent the exploitation of prosocial common-pool behavior and facilitate its adoption. Such insight becomes increasingly valuable (if not vital) as societies growingly face population-level threats. Threats, such as global climate change, which only prosocial common-pool behavior, like resisting overconsumption of essential common-pool resources, can help overcome.
Our study builds on the work by Sotnik et al. (2022), who used a new agent-based model called Multilevel Group Selection I (MGS I) to study a population’s adoption of prosocial common-pool behavior. MGS I is relatively simple and theoretical. It intentionally excludes most real-world complexities (e.g., decision-making, learning, norms, personality, social identity, and demographics) to permit their gradual inclusion and targeted study in the model’s future variants. MGS I allows for the analysis of what Sotnik et al. (2022) identified as the four most essential factors influencing a population’s adoption of prosocial common-pool behavior: population density, the population’s initial percentage of contributors of prosocial common-pool behavior, population-wide pressure to change behavior, and group-level synergy (the additional level of benefit from the behavior). The model simulates a population of agents within a social space who are: alone or in one or more pairs or groups, either contribute prosocial behavior or do not, and move and change their behavior when they cannot withstand the pressure to do so.
Despite MGS I’s simplicity, the model produces a wide variety of results and offers insight into how populations may adopt prosocial common-pool behavior. It also suggests that such adoption may even occur without any additional complexity (e.g., behavior-based sympathy; Ye et al. 2011, imitation Helbing et al. 2011; Wang et al. 2011, punishment Hauert et al. 2007, or success-driven movement Helbing & Yu 2008; Helbing et al. 2011). MGS I suggests that it may occur solely as a result of multilevel group selection. Such selection occurs when groups with more contributors of prosocial common-pool behavior outperform (outcompete, are naturally selected for over) individuals, pairs, and groups with less (Boyd 2018; Goodnight & Stevens 1997; Sober & Wilson 1999; Waring et al. 2015, 2017; Wilson & Sober 1994; Wilson & Wilson 2007).
Here, we introduce a new variant of MGS I to study the role of social identity in a population’s adoption of prosocial common-pool behavior. An individual’s social identity in a group is the aspect of their overall identity that reflects how they view themselves in relation to others in their group (Ellemers et al. 1999, 2002) and their group in comparison to other groups (Ellemers et al. 2002; Ouwerkerk & Ellemers 2002). Specifically, we study the kind of social identity that emerges in a group that one can join and leave (e.g., organization, sports team). We are interested in social identity because it influences the behavior of individuals in such groups (Charness & Chen 2020; Kalin & Sambanis 2018; Shayo 2020; Tajfel & Turner 1979), including their willingness to behave prosocially (Bruner et al. 2014, 2018; Hackel et al. 2017; Tidwell 2005).
Social identity and prosocial behavior are often positively correlated. For example, volunteers who identify more strongly with their nonprofits (Tidwell 2005) and youth with their sports teams (Bruner et al. 2018) tend to display higher levels of prosocial behavior in these groups. However, the correlation between social identity and prosocial behavior can also be negative. For example, social identity can promote antisocial behavior in sports teams plagued with unhealthy internal competition (Bruner et al. 2018).
Our study explores the following two questions: How might population density influence social identity’s effect on a population’s adoption of prosocial common-pool behavior? And, How might group commitment further influence this effect? The relationship among population density, social identity, and adoption of prosocial behavior has hardly been studied and is still poorly understood. Sotnik et al. (2022) used MGS I to explore how population density might influence the conditions faced by a population’s members and, in turn, their adoption of prosocial behavior. We explored how social identity might affect these conditions and their consequences while simultaneously considering the role played by the level of commitment members had toward their groups. While the relationship between such commitment and social identity has been studied (e.g., Ellemers et al. 2002), how both relate to population density and the role they play in the adoption of prosocial behavior have not been and, therefore, remain largely unclear.
Specifically, we simulated our new variant of MGS I with high-commitment and low-commitment agents separately at various pressure-synergy combinations under low and high population density levels. We then compared the simulation results to those run without social identity. The simulation results suggest that the role of social identity may depend substantially on the density of the population and the commitment of the members of the population to their groups. The results also suggest that the relationship between population density, commitment, and adoption may be nuanced and that mobility between groups may be essential.
Our study’s findings can serve as hypotheses for empirical and experimental studies of the relationship between social identity and a population’s adoption of prosocial behavior. Additionally, our model provides a compelling example of an approach to formalizing social identity within models of social dynamics, which remains a challenge (Schlüter et al. 2017; Scholz et al. 2023).
Four Social Situations and Corresponding Behavioral Responses
This section describes the agents’ empirically- and experimentally-grounded, social-identity-driven behavioral responses in our new MGS I variant. An individual’s behavior can differ substantially in a group under different circumstances (Ellemers et al. 2002), depending, in part, on the levels of their commitment to the group and perceived threat.
The first condition, commitment, is the extent to which an individual is (psychologically) devoted/dedicated to their group, i.e., identifies with (their overall identity relies on) the group (Ellemers & Van Knippenberg 1997). Empirical studies of individuals who volunteer at nonprofits demonstrate the substantial role that commitment in a group can play. For example, Tidwell (2005) found that nonprofit volunteers who identify more strongly with the organization tend to display higher levels of prosocial behavior within it. Findings from social psychology experiments also indicate the importance of commitment. Hackel et al. (2017), for instance, show that individuals who are highly committed to their group tend to behave more positively with group members than with those outside the group, while individuals who are not very committed to the group tend to behave more positively toward those outside the group.
The second condition, threat, is the extent to which some force adversely affects how an individual views (a) themselves (self) in relation to others in their group or (b) their group in comparison to other groups (Ellemers et al. 2002; Ouwerkerk & Ellemers 2002; Tajfel & Turner 1979). An empirical study by Bruner et al. (2018) of youth who display antisocial behavior in sports teams with unhealthy (threatening) internal competition is an example of the substantial role that threat can play in a group.
Ellemers et al. (2002) developed a taxonomy of six different social situations with anticipated social-identity-driven behavioral responses that align with the above evidence. Commitment and threat to a group are certainly not the only social-identity-related conditions that shape an individual’s behavior in a group. However, we follow Ellemers and colleagues’ (2002) work and assume the two have a substantial influence and serve as proxies for other conditions.
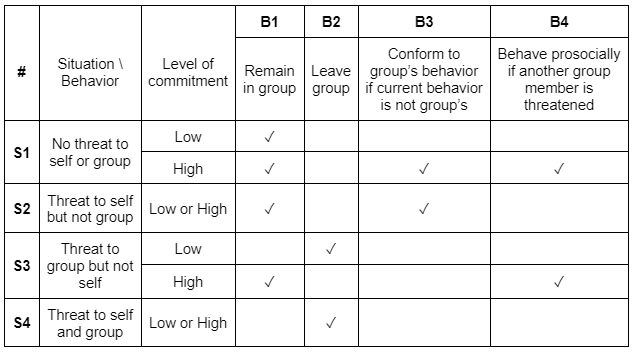
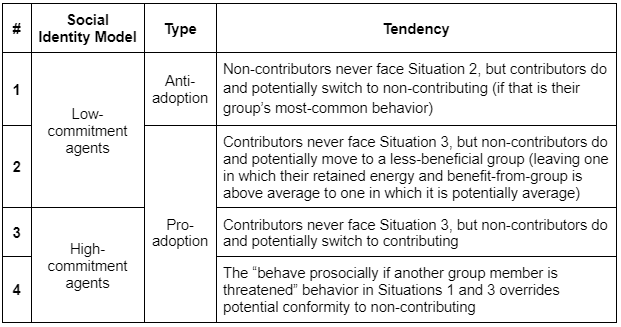
Building on their work and that of others who have studied prosocial behavior (Bruner et al. 2018; Hackel et al. 2017; Tidwell 2005), we identified an exhaustive set of four social situations and four corresponding sets of behavioral responses (Table 1). We were able to reduce the number of situations (from six to four) because, in two of the situations identified by Ellemers et al. (2002) (Situations 2 and 4 in Table 1), individuals with high and low commitment levels behave identically. The situations and behavioral responses are described below and were used to operationalize agents in the new MGS I variant.
Social situation 1: No threat to self or group
Low commitment: If there is no threat to self or group, a member will likely remain in the group and maintain their behavior.
The situation is unlikely to stimulate any behavioral response. Unlike in the case of a member with high commitment, a member with low commitment is not likely to go out of their way to conform to their group’s behavior or help their group members (Ellemers et al. 2002).
High commitment: If there is no threat to self or group, a member will likely remain in the group. If none of their group members are threatened, they will likely continue their current behavior if it is the same as the groups or conform to the group’s behavior. If at least one of their group members is threatened, they will likely continue or start behaving prosocially.
In-group bias (Tajfel & Turner 1979 i.e., tendency to favor in-group over out-group members) takes over in a social situation lacking threat to self or group and leads group members to bond and conform to the group’s norms (Ellemers et al. 2002). Members have no pressing reason to leave their group. In general, they also have no reason to change their behavior. However, as bonding often results in conforming to the same norms, a highly-committed member is likely to conform to the most frequent behavior in the group, which, of course, could be antisocial to other members in the group.
Since bonding is often associated with prosocial behavior (Bruner et al. 2018; Ellemers et al. 1998; Tidwell 2005), highly-committed members in groups with threatened members will (out of compassion or empathy) start behaving prosocially. Real-world examples of behavior in such social situations include volunteers becoming increasingly prosocial the longer they are employed at their nonprofit (Tidwell 2005) and youth being more prosocial when they more strongly identify with their sports team (Bruner et al. 2014).
Social situation 2: Threat to self but not group
Low or high commitment: If there is a threat to self but not group, a member will likely remain in the group and either continue with or conform to the group’s behavior.
The threat to self within a group with an unthreatened status focuses one’s attention on the level to which they are accepted within the group, resulting in attempts to gain acceptance (Branscombe et al. 1999; Ellemers et al. 2002). Such attempts result in the member continuing or conforming to the group’s behavior. Interestingly, threatened members are also more likely to be critical of others whose identities are also threatened (Schmitt & Branscombe 2001). Therefore, threatened members in groups with other threatened members are unlikely to start behaving prosocially solely out of concern for other threatened members. An example is youth in sports teams with unhealthy internal competition. Bruner et al. (2018) showed that they tend to continue displaying or adopt antisocial behavior.
Social Situation 3: Threat to group but not self
Low commitment: If there is a threat to group but not self, a member will likely leave their group and maintain their behavior.
A threatened member who is not very committed to a group would likely behave differently than a highly committed member (Branscombe et al. 1999; Scholl et al. 2018; Tajfel & Turner 1979). For example, they are likely to leave the group in pursuit of what may be referred to as “upward mobility” (Tajfel & Turner 1979). They are also likely to leave the group if they perceive themselves as not fitting in (Mitchell et al. 2001).
High commitment: If there is a threat to group but not to self, a member will likely remain in the group. They will likely maintain their behavior unless at least one of their group members is threatened, in which case they will likely continue or start behaving prosocially.
An unthreatened member in a threatened group is likely well-established in the group. As such, they are likely to express and promote higher group affiliation and loyalty to the group (Ellemers 1993; Ellemers et al. 2002). As bonding is often associated with prosocial behavior (Bruner et al. 2018; Ellemers et al. 1998; Tidwell 2005), members in groups with threatened members will start behaving prosocially. Functional magnetic resonance imaging supports this observation (Hackel et al. 2017).
Social Situation 4: Threat to self and group
Low or high commitment: If there is a threat to self and group, a member will likely leave the group.
Threatened members in a threatened group are likely to try to avoid the group’s threatened status by leaving the group (Ellemers et al. 2002).
Model
We developed the new MGS I variant in two stages, each resulting in a distinct model. The first stage involved creating a Python-based version of the original NetLogo-based model (version 2.0; Sotnik et al. 2022). Henceforth, we refer to the original model as the “initial base model” and the new model (version 3.0) as the “new base model.” While the purpose of the new base model remains the same – to explore a population’s adoption of prosocial common-pool behavior under alternative parameter settings – the design of the new base model includes an important modification. Namely, agent movement and change in behavior now stem from its experience in all of the pairs and groups it is in (as opposed to just in one, as in the initial base model). This difference is described in the section “New base model” and aligns well with recent advancements in social identity research that demonstrate that multiple social identities shape an individual’s behavior (Gaither 2018; Kang & Bodenhausen 2015).
The second stage involved developing a variant of the new base model in which the agents were operationalized with the four sets of the social-identity-driven behavioral responses described in the previous section (“Four social situations and corresponding behavioral responses”). Henceforth, we refer to this new variant as the “social identity model” (version 1.0). Since the behavioral responses vary based on an agent’s level of commitment (high or low) to a group, the social identity model simulates agents with either just high or just low commitment.
New base model
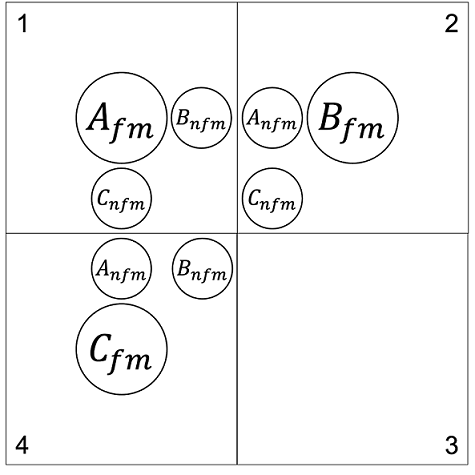
As in the initial base model, the population of agents in the new base model is in a social space that takes the form of a torus. Each agent in the social space becomes a focal member in a pair or a group when it has either one or at least two (Moore neighborhood) neighbors, respectively. It is also a non-focal member of the pairs/groups in which its neighbors are focal members (Figure 1). Each agent is either a contributor of prosocial common-pool behavior in each of the pairs/groups it is in or not (non-contributor).
The model topology constrains the structure of the implied social network as the maximum degree of an agent is 8, and the maximum clique size is 4. On a local level, this limits the clustering coefficient of an agent – the prevalence of triadic closure between the agent’s connections – if its focal group size is greater than 4. Therefore, the model structure does not represent social groups where triadic closure (Granovetter 1973) is expected. The local nature of an agent’s connections also causes the social network distance between agents to scale with the distance between agents on the underlying 2-dimensional grid.
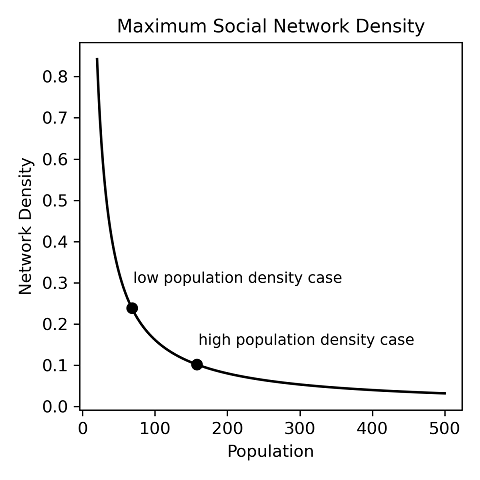
The relationship of population density to network density – the prevalence of direct ties between agents – is limited by the maximum degree, with the network density falling off exponentially with respect to population size when population density is high (Figure 2). If the size of the toroidal grid is fixed, a higher population density implies a higher total population and a lower maximum network density.
During any simulation, the observed network density fluctuates as agents move within the social space. The range of fluctuations is wider when the population density is low. In this case, as there is no mechanism that encourages or selects for a connected network to form, multiple small components are common. When population density increases, a giant component emerges.
The uniqueness of any pair/group is based solely on its composition – the number and combination of contributors and non-contributors. For simplicity, we ignore other relevant pair/group characteristics (e.g., the duration of its existence, its purpose, its norms). The population’s size, density, and the initial percentage of contributors are configurable initial conditions. The percentage of contributors is the variable of interest that can change during a simulation due to internal dynamics stemming from agents switching their behavior. Time is interpreted abstractly, with an iteration representing some time interval during which individuals composing a population are alone or in one or more pairs or groups.
At the beginning of an iteration, each agent is endowed with one unit of energy – the effort required for (the cost of) behaving prosocially in a pair or group. We set the unit of energy to one to normalize calculations. An agent can only behave prosocially (i.e., contribute) or benefit from others behaving prosocially when in a pair/group. A contributing agent gives all its energy to each of its pairs/groups (i.e., one unit of energy per pair/group). A non-contributing agent does not give its energy to any of its pairs/groups, i.e., it freerides. An agent’s energy level does not accumulate from one iteration to the next. It resets to one at the end of each iteration.
Focal members then multiply the aggregate energy contribution to their pair/group by the synergy level, divide the result by the number of members in their pair/group, and distribute the benefit equally among the members. Synergy – the additional benefit from prosocial common-pool behavior above the contributed energy level – is also a configurable initial condition and is identical in all pairs/groups across the population. The described calculation is essentially that of the public good equation applied in each pair/group, with the synergy parameter replacing the multiplication factor in the equation. Agents treat the benefit from each pair/group separately, i.e., benefits are not combined or averaged. Non-contributors always end up better off than contributors in any pair/group because they also keep their retained energy in addition to receiving an equal share of the benefit.
Each agent is then equally exposed to some level of pressure (physical, psychological, social threat) to switch their behavior (from contributing to non-contributing or vice versa). For simplicity, the pressure parameter is in the same units as energy and is also a configurable initial condition. Table 1 summarizes the initial conditions in all the mentioned models (initial base, new base, and social identity).
| Parameter | Initial setting |
|---|---|
| Social space size | 225 spots |
| Population size | 68 or 158 agents |
| Population density | 0.3 or 0.7 |
| Initial percentage of contributors | 30% |
| Energy | 1 unit |
| Synergy | 0-10 units |
| Pressure | 0-10 units |
Agents moving and switching their behavior are the two sources of dynamics in the model. Agents potentially form new and dissolve old pairs/groups by moving, and thereby modifying the implied social network accordingly. By switching their behavior, agents change the percentage of contributors in the population and the composition of pairs/groups that form as a result.
The difference in the design of the initial and the new base model is in when an agent moves and switches behavior. In the initial base model, an agent moves to the closest randomly-selected empty spot and switches behavior when its final energy (retained + benefit-from-pair/group) in the pair/group where the agent is the focal member is equal to or less than the pressure to switch behavior. In the new base model, an agent moves and switches behavior when its final energy in more than half of the pairs/groups it is in is equal to or less than the pressure.
The difference mentioned above reflects the reality that individuals can participate in multiple pairs/groups and that their adoption of prosocial behavior (or more generally switching from one behavior to another) is likely to stem from their overall experience in all of their pairs/groups, as opposed to experience in just one of them. The difference has a similar negative effect on a population’s adoption of prosocial common-pool behavior as does an increase in population density (Figure 3, Table 3).
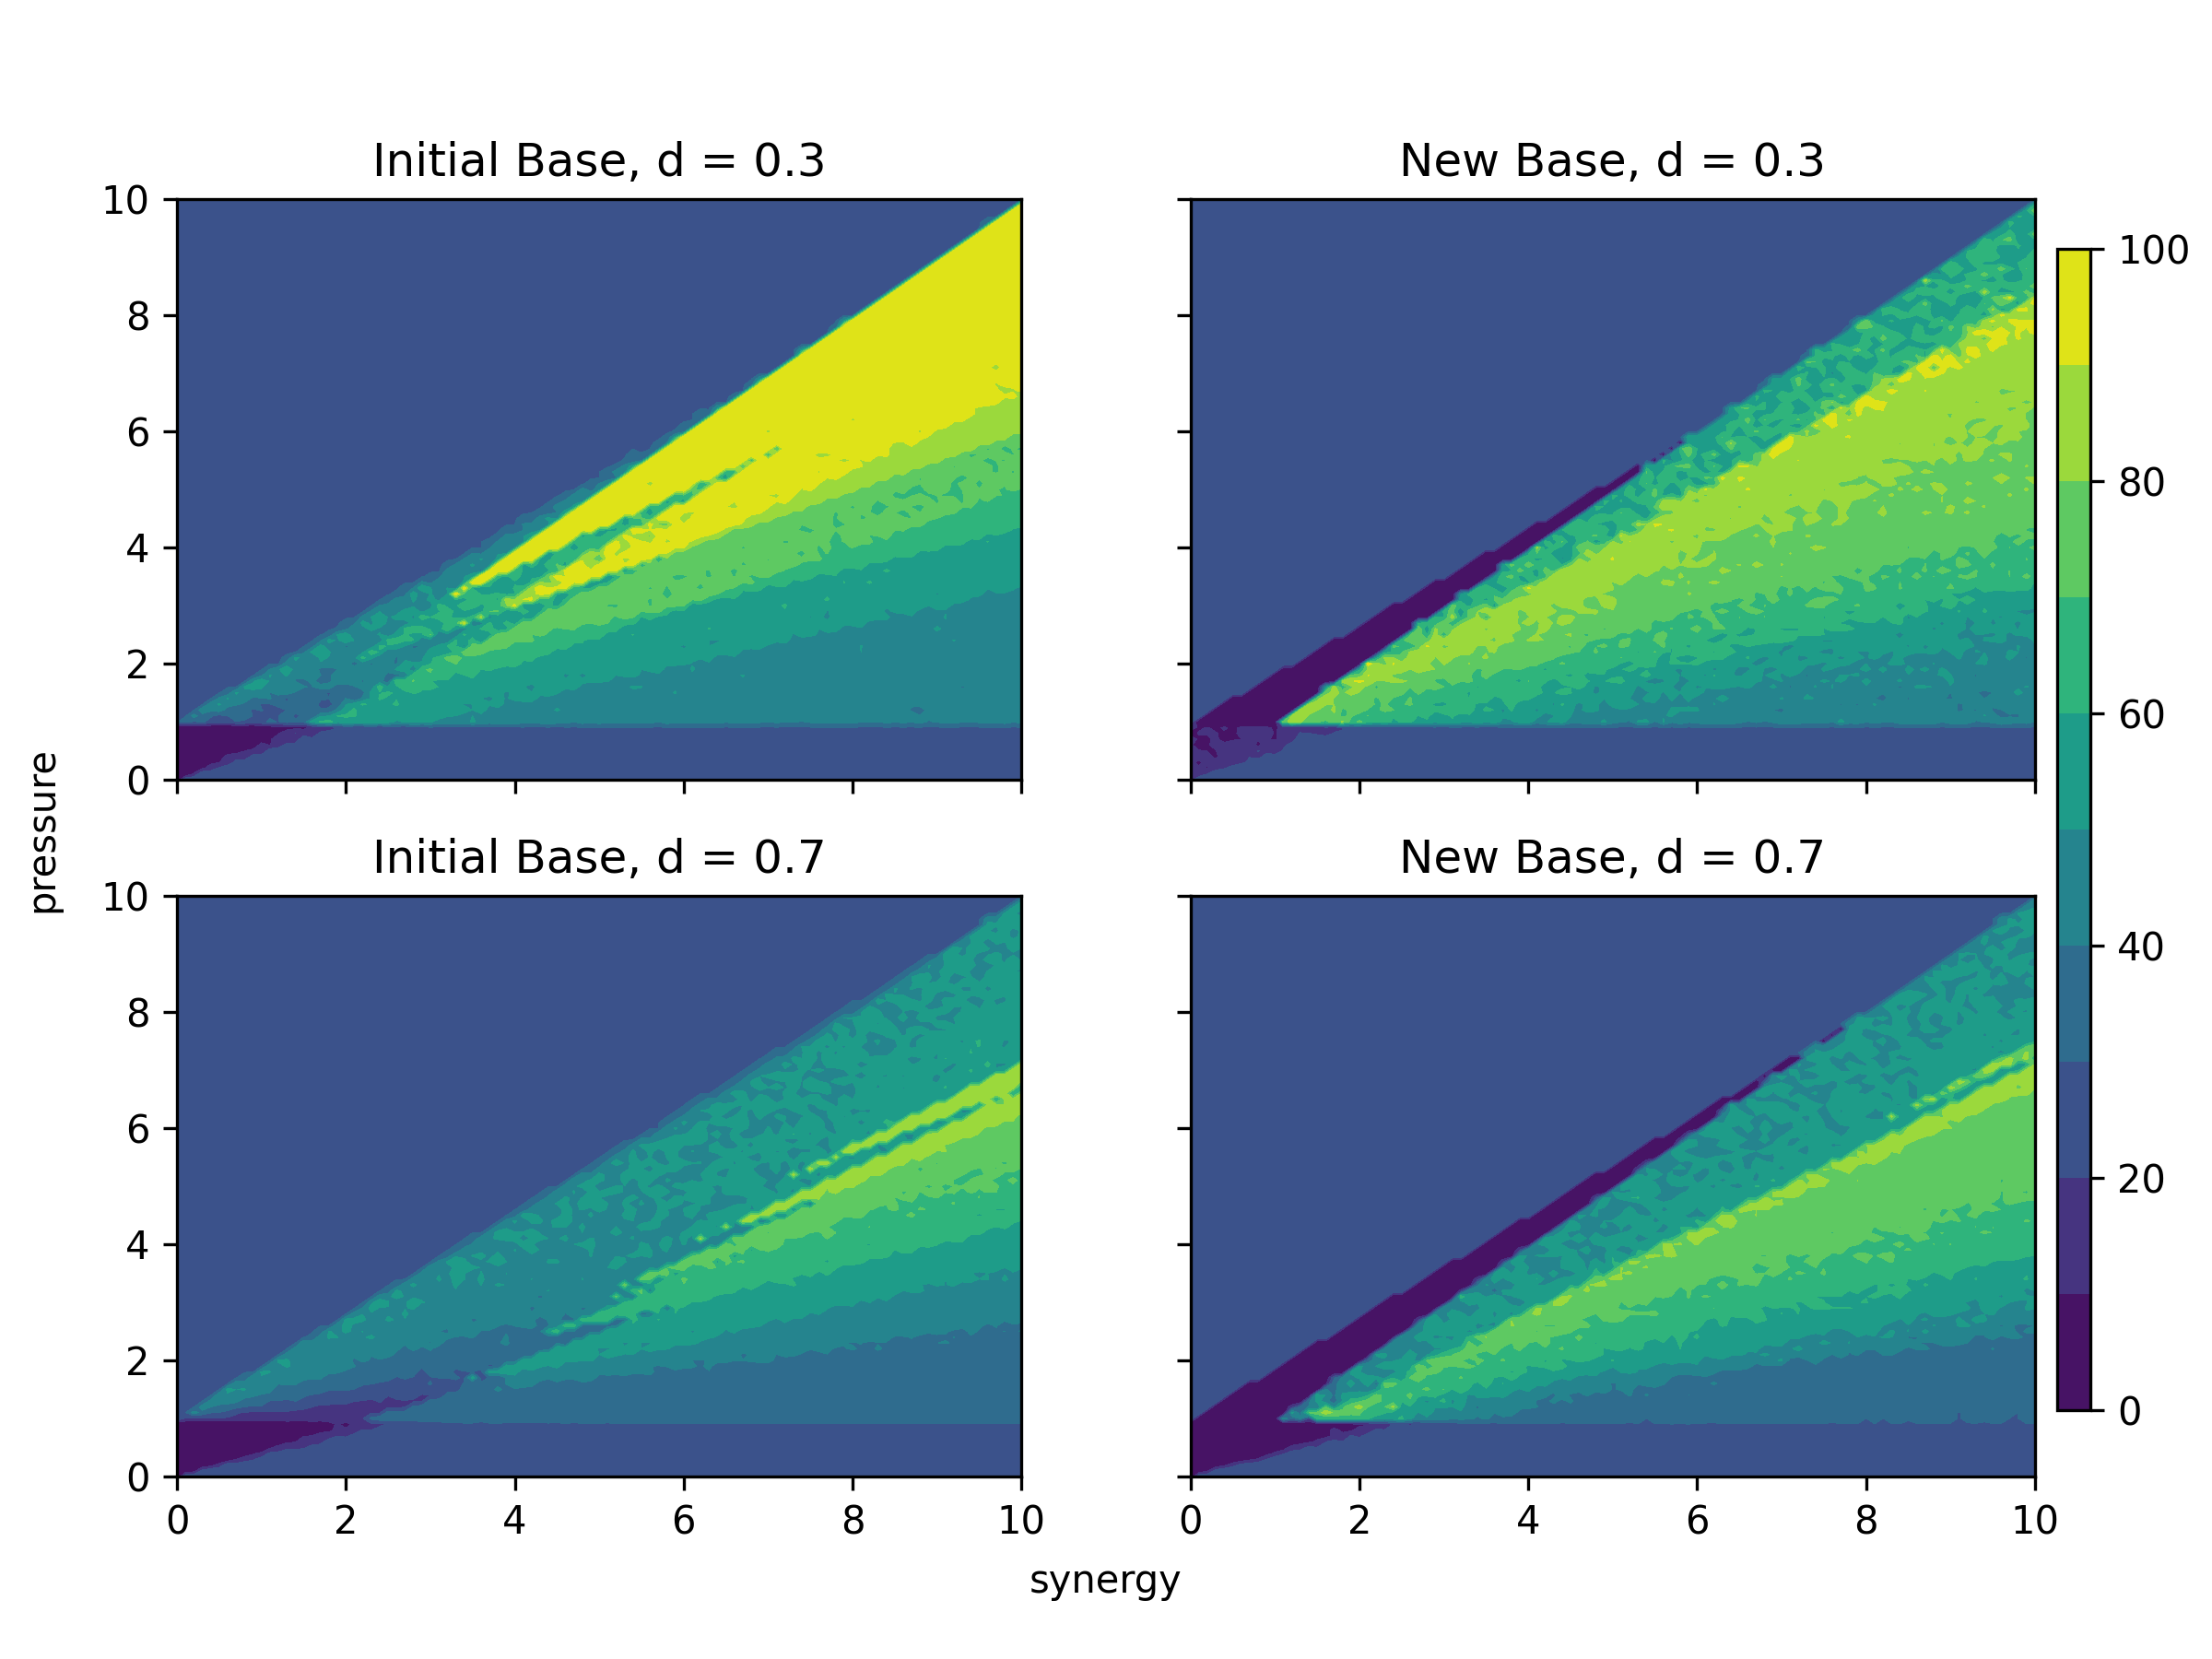
When starting with a relatively low percentage of contributors (e.g., 30%), a higher population density usually increases the chance of an agent having a non-contributing pair/group member, which, at higher pressure levels, reduces especially a contributing agent’s ability to withstand pressure (Sotnik et al. 2022). Basing an agent’s behavior on a higher number of pairs/groups increases the chance of it having non-contributing neighbors, which, at higher pressure levels, similarly reduces its ability to withstand pressure.
As a result, multilevel neighborhood selection drives the population’s adoption of prosocial common-pool behavior in the new model, instead of multilevel group selection (as in the initial base model); where an agent’s neighborhood consists of all its pairs and groups. Neighborhoods with more contributors of prosocial common-pool behavior outperform/outcompete (are naturally selected for over) neighborhoods with less. We leave a fuller analysis of this new concept of neighborhood-level selection for future study.
| # | Model | Initial Base | New Base | Initial Base | New Base |
|---|---|---|---|---|---|
| Density | 0.3 | 0.7 | |||
| 1 | Percentage of map with > 90% adoption | 11.66% (0.06%) | 1.75% (0.07%) | 0.00% (0.01%) | 0.03% (0.01%) |
| 2 | Percentage of map with < 10% adoption | 0.77% (0.02%) | 2.91% (0.03%) | 1.07% (0.01%) | 4.71% (0.01%) |
| 3 | Average percentage of adoption in map with ≥ 10% and ≤ 90% adoption | 87.57% (0.05%) | 95.34% (0.09%) | 98.93% (0.01%) | 95.26% (0.01%) |
| 4 | Average number of iterations to > 90% adoption | 218.2 (242.4) | 461.8 (343.5) | N/A (N/A) | N/A (N/A) |
Social identity model
The social identity model equips the agents in the new base model with four sets of behavioral responses corresponding to the four social situations in which agents can find themselves in (see section “Four social situations and corresponding behavioral responses”). The model simulates populations of only high- or low-commitment agents at a time. This simplification lets us analyze the effects of high and low commitment separately.
In the model, an agent’s social identity within each group emerges anew during every iteration that it or its neighbors move, and is based on the unique composition of the group. Therefore, we focus on the social identity formed in groups that can be relatively easily joined and left, such as professional and social organizations (and not an age or ethnic group). In line with Hogg & Abrams (1998) and Hogg (2006), we define a group as a set of three or more agents (when an agent has two or more neighbors). In other words, we do not view a pair (two agents) as a group in which a social identity emerges. This perspective is rooted in the premise that pairwise and group interactions are inherently different. For example, pairwise interactions tend to be much more transparent than those in groups of three or more, as it relates to group members knowing who is doing what, which is likely to produce different contribution levels of prosocial behavior, as well as responses to freeriding, than in groups of three or more in which transparency is less easily achieved. Therefore, we assume in the model that members of a pair are driven by other motivations (e.g., we-ness) that are not included in the model.
Recall that an individual’s social identity in a group is the aspect of their overall identity that reflects how they view themselves in relation to others in their group (Ellemers et al. 1999, 2002) and their group in comparison to other groups (Ellemers et al. 2002; Ouwerkerk & Ellemers 2002). The social identities of agents in the model are similarly two-pronged, shaped by two factors. One factor is an agent’s final energy (retained + benefit-from-group), which serves as a proxy for comparison of how the agent views itself in relation to others in that group. A higher final energy level implies that the agent views itself more favorably than it would if it had a lower level. Non-contributors always have higher final energy levels than the contributors in their group and thereby view themselves more favorably.
The other factor is the average final energy of all agents in a group, which serves as a proxy for comparing the group’s status to that of other groups. A higher average implies that the group’s social status is more favorable than it would be if it had a lower average. A larger proportion of contributors of prosocial common-pool behavior in a group increases its status in comparison to other groups with a lower proportion. In-group versus out-group categorization (Tajfel et al. 1971; Tajfel 1974) is implicitly present in the social identity model through the agents’ behavioral responses (Table 1). Agents do not, however, explicitly engage in any group comparison. Similarly, there is no explicit representation of opposing or conflicting social identities beyond that which is reflected in the behavioral responses from Ellemers et al.’s (2002) taxonomy (see section “Four social situations and corresponding behavioral responses”).
The pressure parameter in the model serves as a proxy for threat – some (physical, psychological, social) force that undermines the factors shaping an agent’s two-pronged social identity (as in Ellemers et al. 2002). Since an agent can be in multiple groups, it can have more than one social identity. In each of its groups, an agent faces one of four social situations, each of which is defined by:
- Whether the agent feels threatened in a group when comparing itself to others in that group. This occurs when the agent’s final energy is equal to or below the pressure level.
- Whether the agent’s group’s status is threatened. This occurs when the average final energy of the agents in the group is equal to or below the pressure level.
As a result, an agent with two or more neighbors can face one of the following four possible social situations (Table 1):
- No threat to self or group,
- Threat to self but not group,
- Threat to group but not self, and
- Threat to self and group.
As mentioned above, social identities for isolated agents and agents in groups of size two (with only one neighbor) do not emerge. They are, therefore, unaffected by the social situations described above and continue following the logic defined in the new base model (which does not account for social identity).
An agent in more than one group can simultaneously face different situations in each and behave in each accordingly. In other words, it can move out of or switch its behavior in any or all of its groups, affecting the corresponding social situations faced by its group members and their resulting behavior accordingly. At the end of each iteration, each agent uses its unique experiences from all its groups, which can be contradictory, to determine whether it starts the next iteration as a contributor or non-contributor of prosocial common-pool behavior. Specifically, an agent starts the next iteration with its most frequent behavior across all its groups, including those with only one neighbor (where a social identity did not emerge).
As a result, in addition to an agent’s social identity potentially affecting its behavior, an agent’s behavior can also affect its social identity. Because experience shapes behavior and agents are often members of more than one group, the behavior and social identity of an agent in one group can affect its social identity in another group. The relationships among the behaviors of agents and their social identities are interconnected, bidirectional, and nonlinear.
As in the base models, the large variety of pressure, groups, and prosocial common-pool behaviors in the real world remain ignored in the social identity model. This continued simplification focuses the model on agent behavior in alternative situations and its effect on group performance and general adoption of prosocial behavior. Introducing variation in forms of pressure and prosocial common-pool behavior that correspond to the (potentially vast) variety of groups in the real world would add an unnecessary (for this study) level of complexity. As a result, all groups in the model implicitly compete for contributing agents, allowing for multilevel neighborhood selection.
To focus the model on social identity, each agent only possesses those aspects of an individual’s identity that it needs to recognize alternative situations and behave accordingly. These aspects are:
- The agent’s awareness of the level of its (psychological) commitment to a group (Ellemers & Van Knippenberg 1997).
- The agent’s ability, its group members’ ability, and its group’s ability to withstand pressure (per social comparison; Hogg & Abrams 1998).
It is worth noting that an individual’s characteristics (e.g., personality) also influence how they view and are affected by a social situation (Spears 2001; Stets & Burke 2000), as well as whether they behave prosocially (Ding et al. 2018). The social identity model, however, intentionally ignores such personal characteristics, focusing on the influence of differences in situations. This simplification isolates the effect of the social identities of members of a population on the adoption of prosocial common-pool behavior. It also allows us to base agent behavior on averaged results from social psychology experiments (Ellemers et al. 2002) that studied how between- and within-group differences influence human behavior (with averaging canceling out differences in personal characteristics). We leave the incorporation of personal characteristics for future variants.
Informal pseudocode
Below is the informal pseudocode describing the logic we added to the new base model to create the social identity model.
- Randomly select an agent.
- Calculate the agent’s number of neighbors.
- If the agent’s number of neighbors is \(\leq\) 1, follow the base model’s logic for movement and behavior switching
- If the agent’s number of neighbors is \(>\) 1 (forming a group):
- Calculate each group member’s (including the agent’s) retained energy and benefit-from-group.
- Calculate the group’s average retained energy and benefit-from-group.
- Use 4.a and 4.b to determine the agent’s situation.
- Enact the behavior corresponding to the situation:
- If the agent’s behavior involves moving, move the agent to the closest randomly-selected empty spot (using the base model’s moving logic).
- If the agent’s behavior does not involve moving, randomly select another member of the agent’s group. Determine which situation the group member faces (within the agent’s group) and enact the corresponding behavior. If the group member’s behavior involves moving, remove/hide that member from that group but do not move it (since it is also a member in the neighboring group[s]). Repeat step 4.d.ii until all of the agent’s group members have behaved.
- Repeat steps 1 through 4 until all agents have behaved.
- Agents who were in groups with >1 neighbors:
- Calculate how frequently the agent is a contributor and non-contributor in its groups (ignoring the group[s] in which it was removed/hidden).
- Assign to the agent the most frequent behavior (contributor vs. non-contributor), with which it will begin the following iteration.
Macro-level analysis of behavioral tendencies
Agents behave differently in the (initial and new) base models and under the social identity model’s low- and high-commitment settings. In the base models, agents do not behave more pro- or anti-socially. Contributors and non-contributors switch behavior and move whenever their final energy is equal to or below pressure (Table 4). As a result, the base model’s only driver of prosocial behavior is multilevel group/neighborhood selection. In the social identity model, the social-identity-driven behaviors (Table 1) introduce, in some situations, tendencies toward prosocial behavior and, in others, toward antisocial behavior (Tables 4, 5). We describe these tendencies below.
In the social identity model with only low-commitment agents:
- a. A contributing agent potentially switches behavior to non-contributing when facing Situation 2 (Threat to self but not group).
A non-contributing agent never faces this situation because it is always equally as well off as other non-contributors in its group and better off than contributing members.
- b. A non-contributing agent moves when facing Situation 3 (Threat to the group but not self).
A contributing agent never faces this situation because it is always equally as or less well off than the group average.
- c. Contributing and non-contributing agents move when facing Situation 4 (Threat to self and group).
| # | Situation | Base | Low | High |
|---|---|---|---|---|
| S1 | No threat to self or group |
no change | no change | nc → c, c → nc |
| S2 | Threat to self but not group |
nc → c, c → nc, move | no change, c → nc | |
| S3 | Threat to group but not self |
no change | no change, move | nc → c |
| S4 | Threat to self and group |
nc → c, c → nc, move | no change, move | |
In the social identity model with only high-commitment agents (Table 4):
- Contributing and non-contributing agents potentially switch behavior in Situation 1 (No threat to self or group) to conform to their group’s behavior;
- A non-contributing agent potentially switches to contributing in Situation 1 (No threat to self or group), if the group includes a threatened member;
- A contributing agent potentially switches behavior to non-contributing in Situation 2 (Threat to self but not group) to conform to its group’s behavior;
- A non-contributing agent potentially switches behavior to contributing in Situation 3 (Threat to group but not self), if the group includes a threatened member, and
- Contributing and non-contributing agents move when facing Situation 4 (Threat to self and group).
Verification
We verified first the new base model and then the low- and high-commitment settings in the social identity models (built on the new base model) through code walkthroughs and analysis of agent behavior under alternative parameter settings. The code walkthroughs involved discussions of every code line’s fit with the corresponding components of the pseudocode (see section “Informal pseudocode” above). The analysis of agent behavior involved investigating whether contributing and non-contributing agents behaved as intended under alternative pressure-synergy combinations. For example, in the case of the social identity model, a non-contributor should never face Situation 2 (Threat to self but not group), and a contributor should never face Situation 3 (Threat to group but not self).
Simulation Results and Analysis
We simulated two models: the new base model and the social identity model. Agents do not have social identities in the former model, whereas they do in the latter.
We ran the following two batches of simulations of the new base model:
- With population density at 0.3 and
- With population density at 0.7
We ran the following four batches of simulations of the social identity model:
- With low-commitment agents and population density at 0.3,
- With low-commitment agents and density at 0.7,
- With high-commitment agents and density at 0.3, and
- With high commitment agents and density at 0.7.
The new base and social identity models’ initial conditions were identical (Table 1). The simulations were set to either end after the percentage of contributors reached 0% or 100% or after 1,000 iterations, whichever came first. Simulations were allowed to end after 1,000 iterations because test simulations that ran for up to 15,000 iterations indicated that initially-established patterns might later include fluctuations of \(\pm\) 5% but overall persisted. We simulated each model for 10,000 pressure-synergy combinations, with pressure and synergy ranging between 0 and 10 at 0.01 increments. To account for stochasticity, each combination’s final result is the average of three simulations (i.e., 30,000 runs for each simulation). The Python (version 3.9; van Rossum & 2009) code for the models and the scripts used for their analyses and visualization are available on GitHub: https://github.com/Multilevel-Group-Selection.
Population density at 0.3
In the simulations with population density at 0.3, the presence of social identity expanded the number of conditions under which populations fully adopted prosocial common-pool behavior, accelerated the speed with which full adoption occurs, and reduced the number of conditions under which a population fully rejected prosocial common-pool behavior (Figure 4, Table 6).
The expansion was reflected by Indicator 1 (Percentage of the heat map with \(>\) 90% adoption of prosocial common-pool behavior). The percentages were substantially higher in the two configurations of the social identity model (0.3=12.7%, 0.7=23.1%) than in the new base model (1.75%). The reduction in the number of conditions under which a population fully rejected adoption was reflected by Indicator 2 (Percentage of map with <10% adoption). The percentages were substantially lower in the two configurations of the social identity model (0.3=0.6%, 0.7=0.4%) than in the new base model (2.9%). Finally, the acceleration in adoption was reflected by Indicator 4 (Average number of iterations to \(>\) 90% adoption). The average number of iterations that it took to reach \(>\) 90% adoption is substantially lower in the two configurations of the social identity model (0.3=11, 0.7=7) than in the new base model (462).
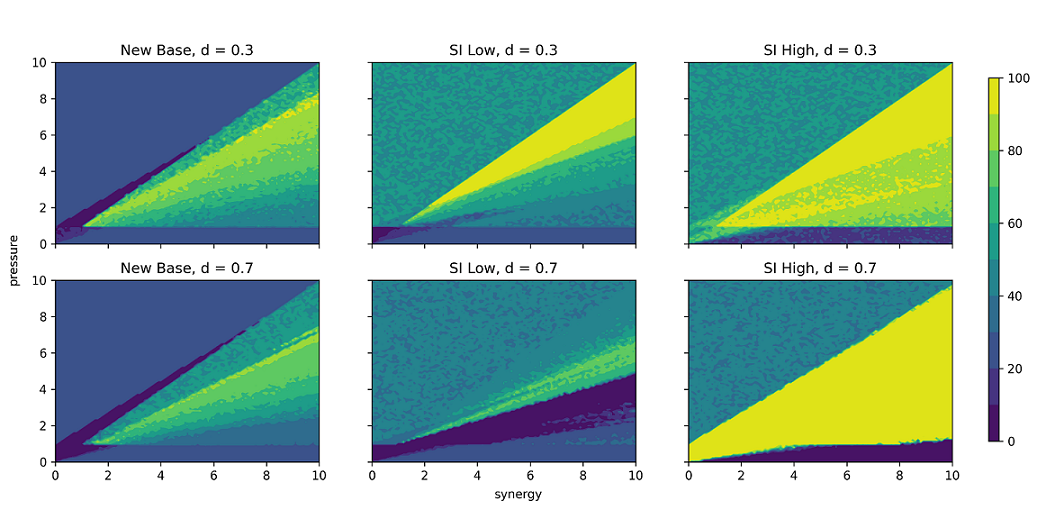
The expansion of the adoption of prosocial common-pool behavior was anticipated in the case of the population with high-commitment agents, the behavioral responses of which included two pro-adoption (of prosocial common-pool behavior) and no anti-adoption tendencies (Table 5). In the case of the population with low-commitment agents, the results suggest that, at lower population densities, the pro-adoption tendency (contributors never face Situation 3, but non-contributors do and potentially move to a less-beneficial group) dominates the anti-adoption tendency (non-contributors never face Situation 2, but contributors do and potentially switch to non-contributing). Why this occurs is counterintuitive and deserves an explanation, mainly because a low-commitment, non-contributing agent maintains its behavior in Situation 1, never faces Situation 2, and only moves but does not switch its behavior when facing Situation 3 or 4 (Table 4). In other words, the social-identity-driven behavior of a low-commitment, non-contributing agent never directly results in it switching to contributing, irrespective of the situation.
| Indicators | Base | Low | High | Base | Low | High | |
|---|---|---|---|---|---|---|---|
| # | Population Density | 0.3 | 0.7 | ||||
| 1 | Percentage of map with > 90% adoption | 1.75% (0.07%) | 12.69% (0.03%) | 23.05% (0.23%) | 0.03% (0.01%) | 0.00% (0.00%) | 44.73% (0.07%) |
| 2 | Percentage of map with < 10% adoption | 2.91% (0.03%) | 0.60% (0.02%) | 0.35% (0.07%) | 4.71% (0.01%) | 13.82% (0.07%) | 7.25% (0.03%) |
| 3 | Average percentage of adoption in map with ≥ 10% and ≤90% adoption | 95.34% (0.09%) | 86.70% (0.01%) | 76.60% | 95.26% (0.01%) | 86.18% (0.07%) | 48.02% (0.06%) |
| 4 | Average number of iterations to > 90% adoption | 461.8 (343.5) | 11.1 (1.9) | 6.8 | N/A (N/A) | N/A (N/A) | 28.4 (95.2) |
The percentage of the map with $>$90% adoption of prosocial common-pool behavior expands in the social identity model with low-commitment agents because their low commitment increases instability in groups of non-contributors. In the simulated pressure-synergy combinations in question, non-contributors often face Situation 3 (Threat to group but not self). In the base model, non-contributors facing Situation 3 would not move. They do, however, in the social identity model (Table 4). As a result, non-contributors move much more than contributors, (because of the low density) often end up alone or with only one neighbor, and (because in the social identity model agents that are alone or in pairs enact the base model’s behavior) switch to contributing.
In other words, the social-identity-driven behavior of a low-commitment, non-contributing agent indirectly results in it switching to contributing. Due to the fact that in the simulations with these pressure-synergy combinations, the agents need higher levels of benefit-from-group to withstand the pressure levels, a stable equilibrium is reached only when all agents are contributors facing Situation 1 (No threat to self or group). A group consisting primarily of non-contributors would not withstand the pressure, leading to members moving. Therefore, the mentioned increase in instability (stemming primarily from non-contributors moving) continues until a stable equilibrium with all agents contributing is reached through multilevel neighborhood selection.
Population density of 0.7
In the simulations with population density at 0.7, social identity had a slightly negative effect on adoption in a population of low-commitment agents and an overall, extremely positive effect in a population of high-commitment agents (Figure 4, Table 6).
In the case of the low-commitment agents, the percentage of the map with $>$90% adoption is zero, which is identical to that of the new base model. Meanwhile, the percentage of the map with <10% adoption is even higher (13.8% vs. 4.7%). These results suggest that the anti-adoption tendency (non-contributors never face Situation 2, but contributors do and potentially switch to non-contributing) in the behavior of low-commitment agents prevails over the pro-adoption tendency (contributors never face Situation 3, but non-contributors do and potentially move to a less-beneficial group) (Table 5). The prevalence is driven by the higher population density, under which contributors find themselves more frequently in Situation 2 (Threat to self but not group).
In the case of the high-commitment agents, the percentage of the map with >90% adoption is 44.7%, which is nearly twice as high as the percentage in the simulations with density at 0.3. This result suggests that an increase in population density amplifies any or all of the three pro-adoption tendencies in the behavioral responses of high-commitment agents (Table 5).
Discussion
Using a theoretical agent-based model, we set out to better understand social identity’s role in a population’s adoption of prosocial common-pool behavior. The simulation results suggest that the role of social identity may depend substantially on the density of the population and the commitment of the members of the population to their groups. The results also suggest that the relationship between population density, commitment, and adoption may be nuanced; and that, under lower population density levels, mobility between groups may be essential.
The simulation results with low population density (0.3) suggest that social identity may expand the number of conditions (pressure-synergy combinations) under which populations fully adopt prosocial common-pool behavior and accelerate the speed with which full adoption occurs. It also may reduce the number of conditions under which a population rejects prosocial behavior. In populations with low commitment, the above results are driven by non-contributors moving – changing groups – more frequently than contributors and often ending up alone or in a pair, which reduces their ability to withstand pressure, removes social identity as a driver of their behavior, and leads to their switching to contributing. This result is a reminder that social identity does not affect everyone in a population equally. In the case of the kind of social identity that is considered in this study, the kind that is formed within groups that can be easily joined or left, the social identity may not necessarily affect everyone in a population at any specific point in time, with the behavior of those alone or in pairs potentially motivated by other factors (including other kinds of social identities).
The simulation results with high population density (0.7) suggest that while social identity may negatively affect a population of agents who are not very committed to their groups, it may have an extremely positive impact in one of highly committed agents. In other words, our study suggests that, at higher levels, population density may have a nuanced effect on the adoption of prosocial behavior, depending on the commitment level of population members to their groups. Mobility is constrained in higher-density populations and, therefore, may play much less of a role (i.e., it is unable to have the same pro-adoption effect that it has in a population with lower density).
This insight suggests that the persistence and adoption of prosocial common-pool behavior may be overwhelmingly driven by individuals who are highly committed to their groups. Simultaneously, it provides potential explanations for why prosocial common-pool behavior is not widely adopted. One explanation might be the presence of groups to which individuals are not very committed. Another might be that populations often face pressure-synergy combinations that produce lower levels of adoption. Another might be that other anti-adoption factors (not present in our model) influence the extent to which members commit to a group and to which ones (e.g., Bochatay et al. 2019). Yet another explanation might be that personal identity (e.g., Teraji 2019), which we excluded from our model, serves as a baseline inertia in a population’s adoption of prosocial common-pool behavior. All these potential explanations imply that the roles of many other factors must be studied in isolation and together in order to gain a deeper understanding of how populations adopt prosocial common-pool behavior.
Interestingly, the study’s results caution against the influence of two looming worldwide trends – an increase in population density and a decrease in commitment to groups. The increase in population density is driven by urbanization, with more than two-thirds of the world population expected to live in urban areas by 2050 (UNDESA 2019). The decrease in commitment in groups has thus far been observed in the United States alone, with social isolation increasing while social engagement and companionship decreasing over the past twenty years (Kannan & Veazie 2023). This trend may continue in the US and extend to other parts of the world, as people spend less time in any one place and the number of virtual social groups increase.
The simulation outcomes suggest that, when combined, the above two trends may produce the lowest adoption levels of prosocial common-pool behavior, the adverse and population-wide repercussions of which could be catastrophic. This insight also suggests that real-world populations might be able to offset these trends through policies that increase the synergy (carrot) and the pressure (stick) to adopt prosocial common-pool behavior. That being the case, promoting healthy social identities and higher commitment within groups might have a more significant and long-lasting effect. Mosimane et al. (2012) have shown that social identity can be essential in resolving social dilemmas. Such evidence supports calls to integrate social identity into policy analysis (e.g., Hornung et al. 2019) and design (e.g., Shayo 2020).
Of course, the interpretation of our study’s results must consider that its subject is new and barely examined. Therefore, drawing conclusions from our study would be premature. Its results are most helpful in developing hypotheses about the general influence of the explored factors (social identity, synergy, pressure, movement, commitment, population density) on adoption and the relationships among them. Nonetheless, our model provides a compelling example of an approach to formalizing social identity within models of social dynamics, which remains a challenge (Schlüter et al. 2017; Scholz et al. 2023). Specifically, multiple and dynamic social identities that emerge within self-organizing groups shape the behavior of the agents in our model. In turn, population-level outcomes are driven, in part, by multilevel neighborhood selection, a concept introduced in this study and to be explored further in future work.
More empirical and experimental research is needed to understand better the factors influencing a population’s adoption of prosocial common-pool behavior and to validate the model’s results. There is a need to understand better which prosocial common-pool behaviors exist and their corresponding pressures and synergies. Subsequently, there is a need to get a better idea of which pressure-synergy combinations are realistic and most frequent. There is also a need to explore the roles of relevant complexities currently excluded from our model. It would be helpful to explore the roles of other social identities associated with groups that individuals cannot quickly join or leave (e.g., age, ethnicity); other emergent group-level properties that stem from individuals sharing a social identity; individual biases against certain social identities; explicit intergroup comparison and competition/rivalry; social network tendencies, such as triadic closure, and characteristics, such as small-world structures and large cliques; the psychological and social processes of social identity formation in individuals and groups; and the psychological and social mechanisms that form an individual’s level of commitment to a group.
Our future applications of the MGS I model will focus on the role of personal identity in a population’s adoption of prosocial common-pool behavior and how it interacts with the role played by social identity. We also plan to study a population’s adoption of prosocial common-pool behavior in the context of common-pool resource management, and, specifically, the relationship between common-pool behavior and resources. Finally, to address a wider variety of human activity, we plan to relax the topological constraint of the Moore neighborhood on the model’s implied social network by generalizing the model’s group structure. Such a generalization would permit the investigation of small-world structures and large cliques.
References
AXELROD, R. M. (1984). The evolution of cooperation. New York, NY: Basic Books.
BOCHATAY, N., Bajwa, N. M., Blondon, K. S., Junod Perron, N., Cullati, S., & Nendaz, M. R. (2019). Exploring group boundaries and conflicts: A social identity theory perspective. Medical Education, 53(8), 799–807. [doi:10.1111/medu.13881]
BOWLES, S., & Gintis, H. (2004). The evolution of strong reciprocity: Cooperation in heterogeneous populations. Theoretical Population Biology, 65(1), 17–28. [doi:10.1016/j.tpb.2003.07.001]
BOYD, R. (2018). A different kind of animal: How culture transformed our species. Princeton, NJ: Princeton University Press.
BRANSCOMBE, N. R., Ellemers, N., Spears, R., & Doosje, B. (1999). The context and content of social identity threat. In N. Ellemers, R. Spears, & B. Doosje (Eds.), Social identity: Context, commitment, content (pp. 35–58). Hoboken, NJ: Blackwell Science. [doi:10.4135/9781446211946.n10]
BRUNER, M. W., Boardley, I. D., Benson, A. J., Wilson, K. S., Root, Z., Turnnidge, J., Sutcliffe, J., & Côté, J. (2018). Disentangling the relations between social identity and prosocial and antisocial behavior in competitive youth sport. Journal of Youth and Adolescence, 47(5), 1113–1127. [doi:10.1007/s10964-017-0769-2]
BRUNER, M. W., Boardley, I. D., & Côté, J. (2014). Social identity and prosocial and antisocial behavior in youth sport. Psychology of Sport and Exercise, 15(1), 56–64. [doi:10.1016/j.psychsport.2013.09.003]
CHARNESS, G., & Chen, Y. (2020). Social identity, group behavior, and teams. Annual Review of Economics, 12(1), 691–713. [doi:10.1146/annurev-economics-091619-032800]
CUMMING, G. S. (2018). A review of social dilemmas and social-Ecological traps in conservation and natural resource management. Conservation Letters, 11(1), 1. [doi:10.1111/conl.12376]
DENANT-BOEMONT, L., Masclet, D., & Noussair, C. N. (2007). Punishment, counterpunishment and sanction enforcement in a social dilemma experiment. Economic Theory, 33(1), 145–167. [doi:10.1007/s00199-007-0212-0]
DING, W., Shao, Y., Sun, B., Xie, R., Li, W., & Wang, X. (2018). How can prosocial behavior be motivated? The different roles of moral judgment, moral elevation, and moral identity among the young Chinese. Frontiers in Psychology, 9, 10. [doi:10.3389/fpsyg.2018.00814]
ELLEMERS, N. (1993). The influence of socio-structural variables on identity management strategies. European Review of Social Psychology, 4(1), 27–57. [doi:10.1080/14792779343000013]
ELLEMERS, N., de Gilder, D., & van den Heuvel, H. (1998). Career-Oriented versus team-Oriented commitment and behavior at work. Journal of Applied Psychology, 83(5), 717–730. [doi:10.1037/0021-9010.83.5.717]
ELLEMERS, N., Spears, R., & Doosje, B. (1999). Social identity: Context, commitment, content. Hoboken, NJ: Blackwell Publishers.
ELLEMERS, N., Spears, R., & Doosje, B. (2002). Self and social identity. Annual Review of Psychology, 53, 161–186. [doi:10.1146/annurev.psych.53.100901.135228]
ELLEMERS, N., & Van Knippenberg, A. (1997). Stereotyping in social context. In R. Spears, P. J. Oakes, N. ELLEMERS, & S. A. Haslam (Eds.), The social psychology of stereotyping and group life. Hoboken, NJ: Wiley-Blackwell.
GAITHER, S. E. (2018). The multiplicity of belonging: Pushing identity research beyond binary thinking. Self and Identity, 17(4), 443–454. [doi:10.1080/15298868.2017.1412343]
GARDNER, R., Ostrom, E., & Walker, J. M. (1990). The nature of common-Pool resource problems. Rationality and Society, 2(3), 335–358. [doi:10.1177/1043463190002003005]
GILBERT, P., & Basran, J. (2019). The evolution of prosocial and antisocial competitive behavior and the emergence of prosocial and antisocial leadership styles. Frontiers in Psychology, 10, 610. [doi:10.3389/fpsyg.2019.00610]
GOODNIGHT, C. J., & Stevens, L. (1997). Experimental studies of group selection: What do they tell US about group selection in nature? The American Naturalist, 150(1), 59–79. [doi:10.1086/286050]
GRANOVETTER, M. S. (1973). The strength of weak ties. The American Journal of Sociology, 78(6), 1360–1380. [doi:10.1086/225469]
HACKEL, L. M., Zaki, J., & Van Bavel, J. J. (2017). Social identity shapes social valuation: Evidence from prosocial behavior and vicarious reward. Social Cognitive and Affective Neuroscience, 12(8), 1219–1228. [doi:10.1093/scan/nsx045]
HALLER, E., Lubenko, J., Presti, G., Squatrito, V., Constantinou, M., Nicolaou, C., Papacostas, S., Aydın, G., Chong, Y. Y., Chien, W. T., Cheng, H. Y., Ruiz, F. J., Garcı́a-Martı́n, M. B., Obando-Posada, D. P., Segura-Vargas, M. A., Vasiliou, V. S., McHugh, L., Höfer, S., Baban, A., … Gloster, A. T. (2022). To help or not to help? Prosocial behavior, its association with well-Being, and predictors of prosocial behavior during the Coronavirus disease pandemic. Frontiers in Psychology, 12, 77503. [doi:10.3389/fpsyg.2021.775032]
HAUERT, C., Traulsen, A., Brandt, H., Nowak, M. A., & Sigmund, K. (2007). Via freedom to coercion: The emergence of costly punishment. Science, 316(5833), 1905–1907. [doi:10.1126/science.1141588]
HELBING, D., & Yu, W. (2008). Migration as a mechanism to promote cooperation. Advances in Complex Systems, 11(04), 641–652. [doi:10.1142/s0219525908001866]
HELBING, D., Yu, W., & Rauhut, H. (2011). Self-Organization and emergence in social systems: Modeling the coevolution of social environments and cooperative behavior. The Journal of Mathematical Sociology, 35(1–3), 177–208. [doi:10.1080/0022250x.2010.532258]
HOGG, M. A. (2006). Social identity theory. In P. J. Burke (Ed.), Contemporary social psychological theories (pp. 111–136). Palo Alto, CA: Stanford University Press. [doi:10.1515/9780804768047-008]
HOGG, M. A., & Abrams, D. (1998). Social identifications: A social psychology of intergroup relations and group processes. London: Routledge.
HORNUNG, J., Bandelow, N. C., & Vogeler, C. S. (2019). Social identities in the policy process. Policy Sciences, 52(2), 211–231. [doi:10.1007/s11077-018-9340-6]
ISAAC, R. M., & Walker, J. M. (1988). Group size effects in public goods provision: The voluntary contributions mechanism. The Quarterly Journal of Economics, 103(1), 179–199. [doi:10.2307/1882648]
KALIN, M., & Sambanis, N. (2018). How to think about social identity. Annual Review of Political Science, 21(1), 239–257. [doi:10.1146/annurev-polisci-042016-024408]
KANG, S. K., & Bodenhausen, G. V. (2015). Multiple identities in social perception and interaction: Challenges and opportunities. Annual Review of Psychology, 66(1), 547–574. [doi:10.1146/annurev-psych-010814-015025]
KANNAN, V. D., & Veazie, P. J. (2023). US trends in social isolation, social engagement, and companionship - Nationally and by age, sex, race/ethnicity, family income and work hours, 2003-2020. SSM - Population Health, 21, 101331. [doi:10.1016/j.ssmph.2022.101331]
KOLLOCK, P. (1998). Social dilemmas: The anatomy of cooperation. Annual Review of Sociology, 24(1), 183–214. [doi:10.1146/annurev.soc.24.1.183]
LEIBO, J. Z., Zambaldi, V., Lanctot, M., Marecki, J., & Graepel, T. (2017). Multi-agent reinforcement learning in sequential social dilemmas. arXiv preprint. Available at: https://arxiv.org/abs/1702.03037.
MASCLET, D., Noussair, C., Tucker, S., & Villeval, M.-C. (2003). Monetary and nonmonetary punishment in the voluntary contributions mechanism. American Economic Review, 93(1), 366–380. [doi:10.1257/000282803321455359]
MITCHELL, T. R., Holtom, B. C., Lee, T. W., Sablynski, C. J., & Erez, M. (2001). Why people stay: Using job embeddedness to predict voluntary turnover. Academy of Management Journal, 44(6), 1102–1121. [doi:10.5465/3069391]
MOSIMANE, A., Breen, C., & Nkhata, B. A. (2012). Collective identity and resilience in the management of common pool resources. International Journal of the Commons, 6(2), 344–362. [doi:10.18352/ijc.298]
OSTROM, E. (2000). Collective action and the evolution of social norms. The Journal of Economic Perspectives, 14(3), 137–158. [doi:10.1257/jep.14.3.137]
OSTROM, E., Gardner, R., & Walker, J. (1994). Rules, games, and common-Pool resources. Ann Arbor, MI: The University of Michigan Press.
OUWERKERK, J. W., & Ellemers, N. (2002). The benefits of being disadvantaged: Performance-related circumstances and consequences of intergroup comparisons. European Journal of Social Psychology, 32(1), 73–91. [doi:10.1002/ejsp.62]
RADOSAVLJEVIC, S. (2021). Implications of poverty traps across levels. World Development, 12, 105437. [doi:10.1016/j.worlddev.2021.105437]
SCHILL, C., Wijermans, N., Schlüter, M., & Lindahl, T. (2016). Cooperation is not enough - exploring social-Ecological micro-Foundations for sustainable common-Pool resource use. PLoS One, 11(8), e0157796. [doi:10.1371/journal.pone.0157796]
SCHLAGER, E. (2002). Rationality, cooperation, and common pool resources. American Behavioral Scientist, 45(5), 801–819. [doi:10.1177/0002764202045005005]
SCHLÜTER, M., Baeza, A., Dressler, G., Frank, K., Groeneveld, J., Jager, W., Janssen, M. A., McAllister, R. R. J., Müller, B., Orach, K., Schwarz, N., & Wijermans, N. (2017). A framework for mapping and comparing behavioural theories in models of social-ecological systems. Ecological Economics, 131, 21–35.
SCHLÜTER, M., & Pahl-Wostl, C. (2007). Mechanisms of resilience in common-pool resource management systems: An agent-based model of water use in a river basin. Ecology and Society, 12(4), 2.
SCHMITT, M. T., & Branscombe, N. R. (2001). The good, the bad, and the manly: Threats to one’s prototypicality and evaluations of fellow in-Group members. Journal of Experimental Social Psychology, 37(6), 510–517. [doi:10.1006/jesp.2001.1476]
SCHOLL, A., Sassenberg, K., Ellemers, N., Scheepers, D., & de Wit, F. (2018). Highly identified power-holders feel responsible: The interplay between social identification and social power within groups. British Journal of Social Psychology, 57(1), 112–129. [doi:10.1111/bjso.12225]
SCHOLZ, G., Wijermans, N., Paolillo, R., Neumann, M., Masson, T., Chappin, É., Templeton, A., & Kocheril, G. (2023). Social agents? A systematic review of social identity formalizations. Journal of Artificial Societies and Social Simulation, 26(2), 6. [doi:10.18564/jasss.5066]
SHAYO, M. (2020). Social identity and economic policy. Annual Review of Economics, 12(1), 355–389. [doi:10.1146/annurev-economics-082019-110313]
SIMON, C., & Mobekk, H. (2019). Dugnad: A fact and a narrative of Norwegian prosocial behavior. Perspectives on Behavior Science, 42(4), 815–834. [doi:10.1007/s40614-019-00227-w]
SOBER, E., & Wilson, D. S. (1999). Unto others: The evolution and psychology of unselfish behavior. Cambridge, MA: Harvard University Press.
SOTNIK, G., Shannon, T., & Wakeland, W. (2022). A new agent-based model offers insight into population-wide adoption of prosocial common-pool behavior. The Journal of Mathematical Sociology, 0(0), 1–28. [doi:10.1080/0022250x.2021.2021513]
SPEARS, R. (2001). The interaction between the individual and the collective self: Self-categorization in context. In C. Sedikides & M. B. Brewer (Eds.), Individual self, relational self, collective self (pp. 171–198). London: Psychology Press.
STETS, J. E., & Burke, P. J. (2000). Identity theory and social identity theory. Social Psychology Quarterly, 63(3), 224. [doi:10.2307/2695870]
TAJFEL, H. (1974). Social identity and intergroup behaviour. Social Science Information, 13(2), 65–93. [doi:10.1177/053901847401300204]
TAJFEL, H., Billig, M. G., Bundy, R. P., & Flament, C. (1971). Social categorization and intergroup behaviour. European Journal of Social Psychology, 1(2), 149–178. [doi:10.1002/ejsp.2420010202]
TAJFEL, H., & Turner, J. C. (1979). An integrative theory of intergroup conflict. In W. G. Austin & S. Worchel (Eds.), The social psychology of intergroup relations (pp. 33–37). Pacific Grove, CA: Brooks/Cole.
TERAJI, S. (2019). Identity switching and conservation on the commons. International Review of Economics, 66(2), 101–113. [doi:10.1007/s12232-018-0316-9]
TIDWELL, M. V. (2005). A social identity model of prosocial behaviors within nonprofit organizations. Nonprofit Management and Leadership, 15(4), 449–467. [doi:10.1002/nml.82]
TWENGE, J. M., Baumeister, R. F., DeWall, C. N., Ciarocco, N. J., & Bartels, J. M. (2007). Social exclusion decreases prosocial behavior. Journal of Personality and Social Psychology, 92(1), 56–66. [doi:10.1037/0022-3514.92.1.56]
UNDESA. (2019). World urbanization prospects: The 2018 revision (ST/ESA/SER.A/420). United Nations, Department of Economic and Social Affairs, Population Division
VAN Rossum, G., & F. L. (2009). Python 3 Reference Manual. CreateSpace.
WANG, J., Wu, B. W. C., D., H., & WANG, L. (2011). Evolution of cooperation in multilevel public goods games with community structures. EPL (Europhysics Letters), 93(5), 58001. [doi:10.1209/0295-5075/93/58001]
WARING, T. M., Goff, S. H., & Smaldino, P. E. (2017). The coevolution of economic institutions and sustainable consumption via cultural group selection. Ecological Economics, 131, 524–553. [doi:10.1016/j.ecolecon.2016.09.022]
WARING, T. M., Kline, M. A., Brooks, J. S., Goff, S. H., Gowdy, J., Janssen, M. A., Smaldino, P. E., & Jacquet, J. (2015). A multilevel evolutionary framework for sustainability analysis. Ecology and Society, 20(2), 2. [doi:10.5751/es-07634-200234]
WILSON, D. S., & Sober, E. (1994). Reintroducing group selection to the human behavioral sciences. Behavioral and Brain Sciences, 17(4), 585–608. [doi:10.1017/s0140525x00036104]
WILSON, D. S., & WILSON, E. O. (2007). Rethinking the theoretical foundation of sociobiology. The Quarterly Review of Biology, 82(4). [doi:10.1086/522809]
YE, H., Tan, F., Ding, M., Jia, Y., & Chen, Y. (2011). Sympathy and punishment: Evolution of cooperation in public goods game. Journal of Artificial Societies and Social Simulation, 14(4), 20. [doi:10.18564/jasss.1805]