Examining the Interplay Between National Strategies and Value Change in the Battle Against COVID-19: An Agent-Based Modelling Inquiry

, ,
and
Delft University of Technology, Netherlands
Journal of Artificial
Societies and Social Simulation 27 (1) 18
<https://www.jasss.org/27/1/18.html>
DOI: 10.18564/jasss.5283
Received: 03-Jun-2022 Accepted: 08-Nov-2023 Published: 31-Jan-2024
Abstract
Social disruptions caused by the COVID-19 pandemic challenged existing institutional arrangements that govern the society. During that time, nation-states had to prevent the collapse of society and rapidly establish new institutions and adapt existing ones to address public health, job security, and freedom-of-movement concerns. At the same time, institutional developments are explicitly or implicitly related to the cultural and moral values relevant to societal well-being. Values hold a significant role in governing society during crises, guiding states' institutional response to unforeseen challenges. However, values themselves are not static: research has shown that values may change rapidly during crises. This paper studies the relationship between value change and institutional change in times of crisis using agent-based modelling and machine learning techniques. In our model, we represent countries as agents who define institutional strategies to control disease spread and subsequently protect the well-being of their citizens. Institutional change and value change are modelled as two independent processes. Yet, the model confirms the seemingly trivial inverse correlation between them: when the value of openness-to-change increases in a society, the institutional strategies also become less strict. Conversely, when conservatism increases, the strategies become stricter on average. However, there is no direct causal relationship between the two changes: being open to change does not necessarily make a government select more relaxed rules, but this correlation is rather an emergent consequence of being more flexible in changing rules, whether the new ones are stricter or more relaxed.Introduction
The disruptions caused by the COVID-19 global pandemic significantly challenged societal structures (WHO 2020). The nations’ responses to the COVID-19 pandemic depended on their status of healthcare systems, economies, public services, and their ability to provide social safety. From the perspective of welfare, economics and the capability approach (Sen 1993), this crisis deprived societal well-being by threatening citizens’ essential needs like having good health, having a decent job, and having the freedom-of-movement to pursue a good life (Anand et al. 2020). The urge to secure the well-being of citizens invoked nation-states to deal with numerous dilemmatic situations where vital decisions had to be made. Governing the global pandemic, while at the same time being ill informed about the risks involved, resulted in heterogeneous institutional responses and challenges (Hull 2020). Conditioned in an uncertain pandemic situation (Lempert et al. 2003), na-tion-states opted for different pathways in containing and resolving this global health crisis.
Institutions, i.e., systems of rules and enforcement mechanisms that govern human behaviour and interaction (Ostrom 1990), are dynamic and are constantly adapted. For example, there are records for establishing new institutions on a daily basis during COVID-19 for some nation-states (Acaps Covid-19 2023). Although the institutions themselves were quite similar between countries, the frequency of changes and the number of institutions were different between countries. At the same time, research has shown that the nation states’ values also changed during crisis (Bojanowska et al. 2020; Bonetto et al. 2021). In general, it is a common sense that values play a significant role as they guide the state’s institutional response to unforeseen challenges. The way institutions are organised explicitly or implicitly commits to underlying cultural and moral values. These values provide guidance and justifications for the decision-makers who shape societal institutions. By referring to social psychologist Schwartz (2003 p. 261), we conceptualise values as “deeply rooted, abstract motivations that guide, justify or explain attitudes, norms, opinions and actions”, and an analysis of which “can provide predictive and explanatory power” and “reflect [a] major social change in societies and across nations”.
Values and institutions have both been evidenced to change during a crisis such as the COVID pandemic. At the same time, common sense tells us that values play a significant role in defining institutional arrangements. So, is value change what has driven institutional change in the crisis? And if so, to what extent did it play this role?
The objective of this research is to study, whether there is a causal relationship between value change and institutional change. In other words, whether the changes in the values of the society, lead to changes in how the pandemic is governed.
Answering this question can bring insights into better understanding how societies function and how we can improve the functioning of institutions to address societal problems and promote greater social and economic well-being. This, in turn, can help us make better informed and adaptive policies that align with societal values and promote institutional effectiveness.
To inquiry into this question, we take an agent-based modelling (ABM) approach to explore the dynamics of change in institutions and in values over time. The ABM outcomes can provide us a dynamic view of the interplay between individual behaviour and social structures (Bianchi & Squazzoni 2015). To be able to study the relationship between value change, and institutional change, these two processes have to be modelled independently of each other. In other words, values should not directly be an influencing factor in choosing strategies. Therefore, we use independent data for each of these processes in the same context to study such relationship. For modelling value change, we use Schwartz Value Survey (Schwartz 2003) to conceptualise and parameterize country values. For modelling institutional change, we use real-world data from ACAPS1 dataset on the COVID-19 government measures and EU COVID-19 datasets2 and machine learning (ML) techniques to inform our country agents’ decisions about changing institutions. In other words, rather than basing the decision on the value of agents, they are informed by how countries in reality decide on interventions based on factors such as number of infections.
Recently ABM has been applied to study values and their dynamicity. For example, Mercuur et al. (2019) studied the role of values on agents’ behaviour. ABM has also used extensively for modelling different dimensions of the pandemic. For example, Dignum (2021) developed the ASSOCC model for the COVID crisis which also incorporated values and culture and explore the relation with the management of the pandemic.
This article is organised as follows: Section 2 presents the related conceptual and theoretical background; Section 3 describes the model; Section 4 shows the implementation of the model; Section 5 presents the results; and Section 6 presents discussion and conclusion.
Conceptual and Theoretical Background
Institutions and institutional change during a pandemic
Institutions
The set of rules, whether formal or informal, that influence interactions, and decision making in society are called institutions (North 1991).
To model institutions, we use the ADICO grammar of institutions (IG) which provides five concrete concepts for defining institutional statements (Crawford & Ostrom 1995). In the ADICO grammar, A denotes Attributes: specifies subject, to whom a strategy or rule applies; D refers to Deontic: determines how an action is done (prohibition, obligation, and permission); I represents Aims: identifies the actions toward which Deontic applies; C indicates Conditions: under which conditions or, when, where, and how a strategy or rule applies; and O denotes Or Else: determines specific punishments to be applied when an agent acts in violation of the institutional rules. For example, in an institution: ‘All people have to keep 1.5 meter distance in any public area whether indoor or outdoor’, A is ‘all people’, D is ‘have to’, I is ‘keep 1.5 meter distance’, C is ‘in any public area’, and we do not have any sanctions (O).
According to Ostrom, a shared strategy is a social concept of behavioural patterns, which many individuals observe. A shared strategy contains AIC elements. Therefore, it is neither associated with any deontic modality nor having a reward or punishment (Crawford & Ostrom 1995).
We look at institutions at a country level, meaning that we do not focus on whether the people within a country follow the rules or not. Rather we look at these country-level rules as "strategies" that countries take in combatting the pandemic (e.g., introducing social distancing). In this definition, "a country government" is the attribute of the institutional statement, who implements certain policies under specific conditions (e.g., R rate being above 1). Most of these institutional strategies are similar across countries as there is also a lot of "copying behaviour" that makes some strategies more common than others. Therefore, the rule setting behaviour among countries can be viewed as shared strategies globally.
Institutional change during a pandemic
Although actors may recognise and potentially comply with institutions, they may also shape and change them within a social system (North 1996). Individuals or organisations can change their decisions based on new learning and skills (internal triggers) or environmental factors (external triggers), which could lead to institutional change (North 1996).
In this study, we explore institutional emergence as the result of an external shock (i.e., changes at the beginning of COVID-19 pandemic). Additionally, we consider institutional adjustments and changes in previous institutions causing by new learning and skills, especially after the starting point of the crises.
Values and value change during a pandemic
Defining values
Values play an important role in comprehending individual and social behaviours and their alignment with social institutions. A study of values allows to capture underlying societal mechanisms to equip the decision-making capacities of different regulatory bodies (e.g., policy-makers). However, the conceptual environment around values is somewhat ambiguous as various academic disciplines provide different definitions of values. In philosophy, values often pertain to what is considered as good (ontology), or what we believe (epistemology) or what we express (semantics) as being good (Hirose & Olson 2015). Anthropologists consider values as ideas about worthiness or as a conception relating to a code or standard (Belshaw 1959). In the realm of social sciences, a more empirically grounded approach is taken to study values, with scholars commonly referring to values as attitudes, preferences, and interests (Rokeach 1973).
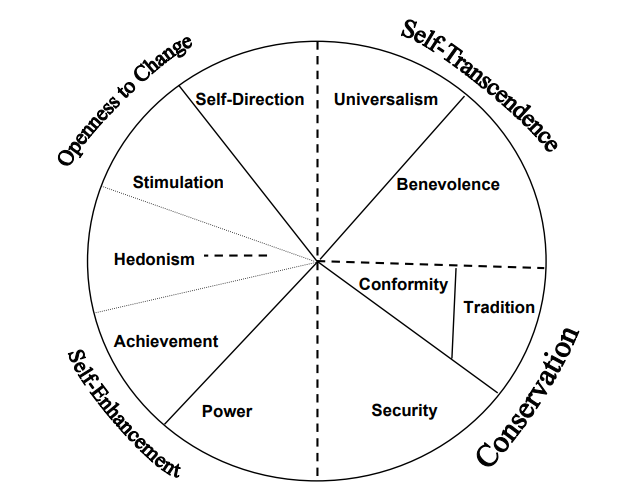
One of the most influential empirical studies on values was conducted by the social psychologist Shalom Schwartz in (1992). Inspired by Rokeach’s (1973), Schwartz conducted an extensive value survey across countries. He subsequently developed the intercultural theory of basic human values, which conceptualises values as beliefs forming an interrelated hierarchical system. This system guides individuals and/or groups to desirable goals (Schwartz et al. 1999). Schwartz’s value theory proposes a value typology including 56 values that are universal across cultures. Schwartz (1992) found that values can be arranged into ten value clusters that characterise individual variations in value priorities: conformity, tradition, universalism, benevolence, power, achievement, hedonism, stimulation, self-direction, and security. Figure 1 shows these ten value clusters:
- Power: This value emphasises the pursuit of social status, prestige, and dominance over others.
- Achievement: This value emphasises the pursuit of personal success, competence, and mastery of skills.
- Hedonism: This value emphasises the pursuit of pleasure, enjoyment, and sensory gratification.
- Stimulation: This value emphasises the pursuit of novelty, excitement, and challenge.
- Self-direction: This value emphasises the pursuit of autonomy, creativity, and personal freedom.
- Universalism: This value emphasises the pursuit of social justice, equality, and concern for the welfare of all people.
- Benevolence: This value emphasises the pursuit of caring, empathy, and concern for the welfare of others.
- Tradition: This value emphasises the pursuit of respect for cultural and religious traditions, social order, and family values.
- Conformity: This value emphasises the pursuit of obedience to authority, social norms, and group loyalty.
- Security: This value emphasises the pursuit of safety, stability, and protection from harm.
The ten value clusters can be categorised into two main groups: individualistic values and social values. The first four value clusters – conformity, benevolence, universalism, tradition – represent social values, emphasising consideration for others. The remaining six clusters – power, hedonism, self-direction, security, achievement, and stimulation – reflect individualistic values.
Visualising the ten value clusters in a two-dimensional space helps to understand them better. The first dimension distinguishes self-enhancement values from self-transcendence values. Self-transcendence values prioritise the well-being of others, while self-enhancement values emphasise personal achievement and benefits. The second dimension distinguishes openness-to-change values from conservation values. It indicative of whether individuals are open to new things and ideas versus whether they prefer tradition and conformity. Openness-to-change dimension includes the values of self-direction and stimulation, and emphasises the pursuit of creativity, novelty, and personal growth. While the conservation dimension includes the values of tradition, conformity, and security, and emphasises the pursuit of preserving the status quo, stability, and social order.
Values within the same value cluster are prioritised similarly, reflecting their shared characteristics. On the other hand, values belonging to clusters that are wide apart from each other in the two-dimensional space are typically prioritised very differently, indicating their distinct nature. Values positioned closer together in this two-dimensional space are more compatible, suggesting that individuals who prioritise these values are likely to share common perspectives. Conversely, values positioned wide apart values are more likely to conflict, representing different viewpoints and priorities. This prioritisation typically guides decision-making in a particular situation; people are typically tempted to act upon the values they prioritise.
How values can change during a crisis: COVID-19 pandemic
In the theory of basic human values, values are considered to be relatively stable (Schwartz 1992). Their prioritisation typically forms during childhood (Cieciuch et al. 2015). While there is consensus among psychologists that value prioritisation stabilises around the age of adolescence (Cieciuch et al. 2015; Sagiv et al. 2017), significant life transitions (e.g., moving to another country) can be an exception (Sagiv et al. 2017). The global pandemic quite substantially triggered rapid changes in lifestyle and reconsiderations of what is deemed "normal" and socially acceptable behaviour. Compliance with movement restrictions and social distancing, job losses, and the urgent need to digitise essential activities like schooling were unprecedented challenges that prompted people to alter their behaviour.
An extensive study of value change in the context of pandemic utilised a topic modelling approach based on the large text corpora (van de Poel et al. 2022). This study indicated that the most significant change in value prioritisation took place at the beginning of pandemic, whereas the long-term effects seem to be limited (van de Poel et al. 2022).
Another insightful perspective on value change during the pandemic was offered by Steinert (2021) who links it to the amplifying effect of information technologies, in particular social media, on human emotions and values. Steinert (2021) indicates that sharing online one’s negative emotions in relation to pandemic facilitates emotional climate that can contribute to societal value change. In particular, Steinert (2021) suggest that what he calls emotional contagion though social medial can induce to change in value prioritisation with a bigger emphasis on the conservation and security values. Furthermore, Steinert (2021) signifies an important link between personal values and political preferences. He suggests that: "When people perceive their values to be threatened, they prefer policies that protect these values and are more inclined to accept measures that limit their civic freedom" (Steinert 2021).
Similar to Steinert’s insights were concluded by a working group headed by psychologist Inglehart & Lampert (2021), who emphasise that although values related to survival gain more relevance, the lack social contact and freedom of mobility increased the importance of social solidarity, equity, community, and self-determination values (Lampert et al. 2021). In contrast, basing on the insights form survey data, other studies, have indicated that values remained relatively stable and what we witnessed was "more an emotional than a rational response to institutional functioning" (Reeskens et al. 2021 p. 5163).
In the growing body of value change scholarship, several studies have followed Schwartz’s conceptual tradition, highlighting the reprioritisation of both value sets 1) openness-to-change and 2) conservatism. These studies empirically examined the evolution of basic human values during the COVID-19 pandemic in France and Poland (Bojanowska et al. 2020; Bonetto et al. 2021). Similarly to Lampert et al. (2021), their findings revealed insightful patterns that conservatism values (i.e., security and conformity) were more valued during the outbreak than usual. In contrast, values relating to openness-to-change were less prioritised during the COVID-19 outbreak than in ordinary circumstances. These findings about changes in value prioritisation reflect a correlation between the threat imposed by the crises and conservatism. Similar insights were gained during research of the 2008 world financial crisis where researchers also drew a link between the decreasing role of openness-to-change and strengthening the role of conservatism (Sortheix et al. 2019).
From individual values to countries’ values: A situated perspective on institutions
In this research, we extend the idea of a change in the level of individual value prioritisation to the collective level. In particular, we are interested in the level of value-informed goals that nation-states pursue in order to tackle the challenges of the pandemic. Although values are not fixed, and the prioritisation can change over time in response to social and historical contexts, they remain a powerful force that shapes individual and collective actions. On the one hand, studies revealed that crises could lead to changes in the prioritisation of deeply rooted motivations for decisions and actions. In our view, this claim can also be extended to including country’s values. Crises disrupt the normal functioning of society and require individuals and societies to swiftly adapt their values and behaviours in order to respond effectively. For instance, in response to the COVID-19 pandemic, many countries implemented policies aimed at protecting public health and promoting social welfare. These value-informed goals of policies reflect the tendency that occurs on the individual level as they capture a shift towards values that prioritise the well-being of others over individual freedoms.
The pandemic created double-sided impacts on value change that were seemingly contradicting: On the one hand, many uncertainties led countries (i.e., their governments3) to prioritise conservatism more strongly. These challenges included concerns about health and safety, economic insecurity, and social disruption. In response to these challenges, countries became more risk-averse and resistant to change. On the other hand, the pandemic also created new opportunities and challenges that required individuals and governments to adapt and innovate, which promoted a greater open-ness-to-change. For instance, the pandemic accelerated the adoption of new technologies, such as remote working tools and telemedicine, and created a need for experimentation and innovation in areas such as public health and social welfare. In response to these challenges, countries became more open to trying new approaches.
One may however, question the generalizability of individual values to a country as a whole, and its government in particular. Although Schwartz’s (1992) exploration of human values started on the level of individuals, in the later work, a number of pat-terns were drawn from the cross-country study of values and value orientations (Schwartz 2008). In particular, in chapter five of the book "Cultural value orientations: Nature and implications of national differences", Schwartz (2008) suggests that "the prevailing cultural value orientations in a country are likely to find expression in the major social policies of governments and practices of society." Building on this point, in our paper we assume that nation state value system represents an aggregated system of citizen’s (individual) values. In assuming so, we intentionally take a simplistic view on how a state represents the aggregation of citizen’s values and leave out other factors to exclusively focus on an exploration of a value-based approach. In other words, this research builds on the assumption that when people within a country score high on certain values (e.g., stimulation), then the country as a whole and its government also score high on that particular value.
To make the reasoning behind the assumed level of "agency," more explicit, let us briefly elaborate on the origin of this assumption. Our objective in this research is to focus on capturing the dynamics between value change and international policy responses to the spread of COVID-19. We deliberately opted to integrate a value perspective with an institutional economics perspective, as, in our view, the global pandemic is an interesting case of the emergence of institutions (i.e., shared strategies) due to unprecedented challenges that required rapid international policy response. In order to ground this perspective on institutions, we build our assumption on the work of Dolfsma & Verburg (2008). Following Dolfsma & Verburg (2008), we claim that North interpretation of institutions is based on the individual account of what they call the agent approach (individualist), as opposed to the structuralist approach (collectivist).
This dichotomy in understanding institutions traced back to an age-old debate between proponents of the agency approach, who argue that explanations of social facts always arise from individual preferences, expectations, behaviours, and motives, and proponents of the structural approach, who claim that institutions should always be studied within social systems in which they emerge and therefore should not be reduced to individual parts. In our research, we align with the agency approach because we contend that the urgency of the COVID-19 case left no space for the rise of structured regularities. Instead, it necessitates immediate state action (policy response) aimed at protecting citizens and oriented toward other states’ (expected) actions.
An Agent-Based Model of Institutional and Value Change During COVID Crisis
In this section, we explain the assumptions that the model is based upon, the abstract model architecture and the modules. We then define the dataset we used as input data.
Assumptions
We build our model based on a set of assumptions:
- We represent countries as agents where the properties of these agents are at country-level.
- We do not give specific names to countries to avoid the claim that we are predicting the behaviour of a country. We are only looking at the changes in value prioritisation and institutions that occur during the pandemic.
- Since we focus on the introduction and emergence of institutions, we only consider the ‘Introduction/extension of measures’ in the used dataset.
- Following the previous assumption, we model the establishment of institutions during COVID-19 rather than their discontinuation.
- The institutions are defined in relation to the well-being of citizens: being healthy, having a job and having freedom-of-movement.
- Each timestep in the simulation represents two weeks as this was on average the period in which countries assessed the performance of the current policy in place, to potentially introduce a new one4.
- We model institutions as shared strategies as we are modelling country-level institutional dynamics. In other words, the institutions we define do not have a sanctioning (i.e., if a country does not implement the policy, the country is not sanctions by the UN) nor a deontic (countries do not have any obligation to implement these rules) from a global perspective but they may follow other countries’ footsteps.
Using the data in the agent-based model
The overall architecture of the simulation is shown in Figure 2, which will be ex-plained in detail in this section. The initial value for each of ABM parameter settings is a random number in a specific range which is derived by real-world data.5,,67
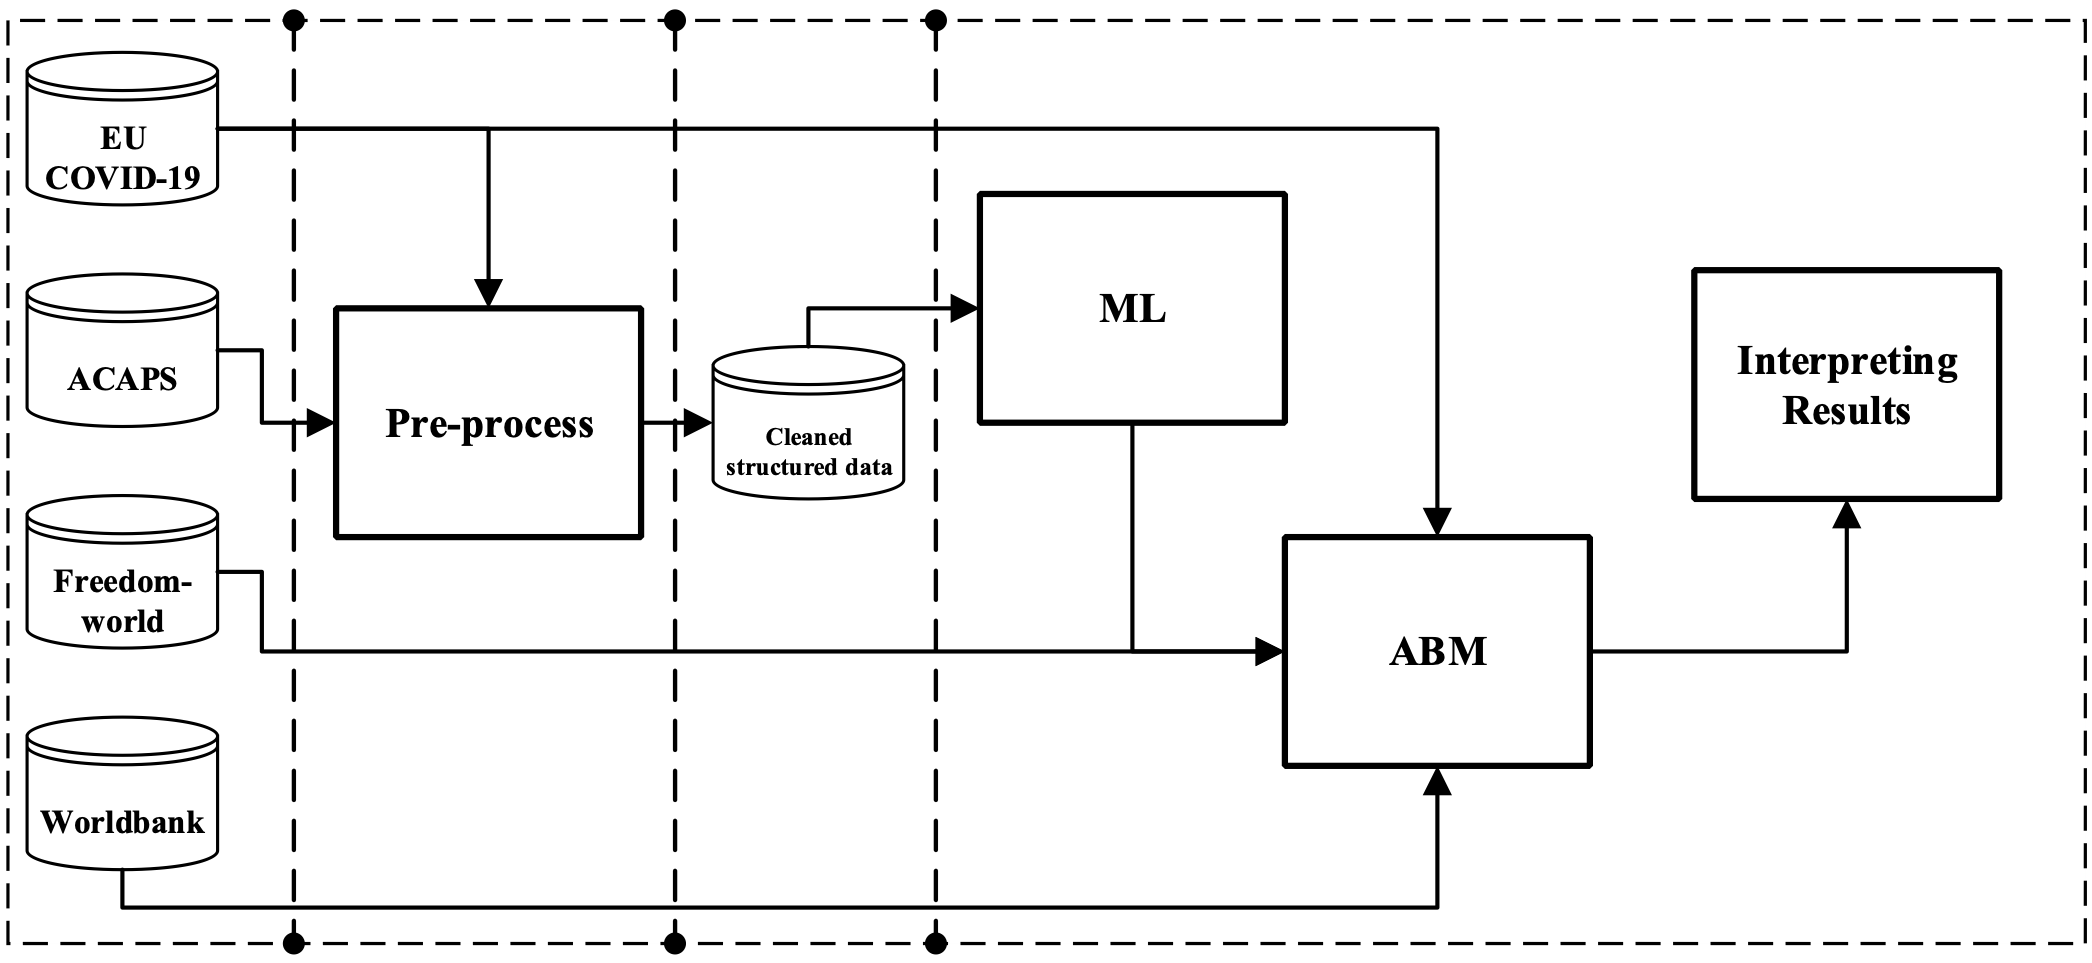
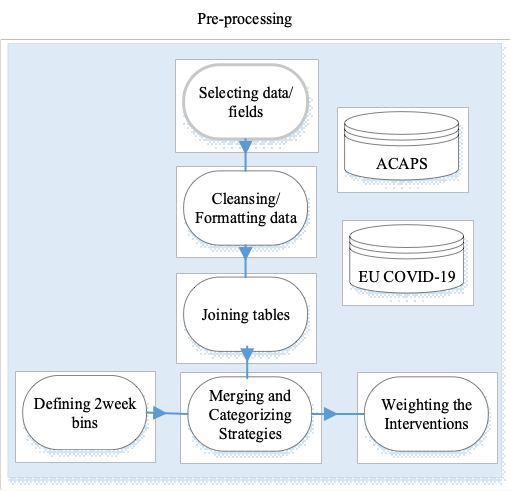
Pre-processing
Pre-processing starts with selecting required fields from ACAPS dataset on the COVID-19 government measures and EU COVID-19 datasets. The cleaning procedure includes managing null values, missing data, and formatting records. ACAPS includes measurements, which have been implemented by countries in addition to the implemented data and country name. EU COVID-19 consists of number of infected cases reported per day per country. After that, we join tables on common fields. Moreover, we categorise ACAPS measurements (category + measures) into four standard interventions (i.e., NoLockdown, SocialDistancing, SoftLockdown, Hard-Lockdown) following Kreulen et al. (2022):
- NoLockdown: only raising public awareness,
- SocialDistancing: informing about the virus and social distancing,
- SoftLockdown: staying home as much as possible,
- HardLockdown: closing non-essential locations.
It is worth mentioning that the four interventions are independent: they have accumulating impacts on the number of COVID cases and there may be more than one intervention at a time. Additionally, they have different impact weights, for example, Hard Lockdown has higher impact on reducing cases. In the dataset that was used to train the ML, the interventions were assigned to each one of these four higher-level interventions. In other words, each of the four interventions above were further divided into different sub-interventions. Each intervention can have a weight in the range of [0, 1]. An intervention would get the value of 1, if all these sub-interventions were implemented. Based on the data, we have 8 sub-interventions for NoLockdown, 6 Social Distancing, 5 SoftLockdown, and 10 HardLockdown. Therefore, we assign the following weights for each specific intervention according to its number of sub-interventions (more information can be found in Appendix A): [‘No Lockdown’, ‘Social Distancing’, ‘Soft Lockdown’, ‘Hard Lockdown’], \(value = [0.125, 0.17, 0.2, 0.1]\)
Most of the COVID rules and cases are updated bi-weekly. Therefore, we set the granularity of the data to two weeks, i.e., we aggregate data for each two weeks in one record. This new granularity starts from the day that the first country implemented an intervention. Therefore, there may be several interventions in each two weeks. We use the summation of the weights of interventions in each two weeks and average of ‘Cumulative_number_for_14_days_of_COVID_19_cases_per_100000’ for the records to avoid duplication in calculating the cases.
Finally, to improve the accuracy, we round data by applying the below procedure:
- If the weight of an intervention (i.e. sum of its sub-interventions) is greater than 0.6: we assign 'high' (1)
- If the weight is greater or equal to 0.4 and less or equal to 0.6: we assign 'middle' (0.5)
- If the weight is less than 0.4: we assign 'low' (0)
Using ML to train agents in the model
ML techniques refer to algorithms that have the ability to find patterns and predict outcomes by learning from input data and without programming all requirements explicitly (Murphy 2012; Samuel 1959). ML techniques can provide great potential to bring higher degrees of intelligence and learning into the models (An 2012; Dehkordi et al. 2023; Kavak et al. 2018; Macal & North 2010; Rand & Rust 2011).
ML can bring the opportunity to cover the world knowledge (past experiences) in the model, build an informed picture of how countries react in specific situations, and decrease the degree of model abstractness.
In this research, we use Decision trees as the ML technique. Decision tree (DT) is a predictive algorithm, which is mostly used in a supervised approach, in the form of tree which has branches that represent observations and leaves that outline conclusions. There are two ways of applying DT: classification and regression (Olkin 2002). A classification DT is a DT where discrete values are allowed. For this type of DT, leaves are class labels and branches are the links between class labels. In contrary, in a Regression DT continuous values are allowed, and the leaves can have the ranges for the regression.
The advantage of using DTs is that the knowledge represented by a DT is very clear. Therefore, the learned knowledge by a DT can be interpreted easily by even non-experts (Jadhav & Channe 2016). Another advantage is that a DT is able to map non-linear relationships quite well. Additionally, it can handle missing values (Wu et al. 2008). The disadvantages are: it has long training time (Jadhav & Channe 2016), it easily overfits and it does not support online learning; meaning that with new data, the tree needs to be rebuilt (Brijain et al. 2014). DT have been widely used in ABM. We used multivariant regression DT to predict the weights of four interventions at each time learned by cleaned structured data. The input parameters for our trained DT are: [‘week_bin’, ‘REGION’, ‘Cumulative_number_for_14_days_of_COVID_19_cases_per_100,000’]
And the Output parameters are: [‘No Lockdown’, ‘Social Distancing’, ‘Soft Lockdown’, ‘Hard Lockdown’].
One output sample could be: {‘No_Lockdown’: 0.0, ‘Social_Distancing’: 0.0, ‘Soft_Lockdown’: 0.5, ‘Hard_Lockdown’: 0.0}.
We split the cleaned structured data into training and validation sets by the split ratio 80:20. That is 80% of the data goes into the training set and 20% to test set. After the DT has learned based on the training set, the DT is validated on test set.
First, we calculated the Mean Absolute Percentage Error (\(MAPE\)), which is a commonly used metric for evaluating the performance of regression models. MAPE, Equation 1, is a percentage metric that measures the average absolute percentage difference between the predicted and actual values across all instances in the dataset. It is expressed as a percentage and represents the average magnitude of the error relative to the actual values.
| \[ MAPE = \frac{SAE}{sum \; (actuals)} \cdot 100\%\] | \[(1)\] |
While \(MAPE\) is a useful metric for evaluating the overall performance of the model, it does not provide a per-target variable measure of performance. As we used multi-variate regression DT, we have four outputs. Therefore, we calculated the accuracy of each intervention. Accuracy measures the overall correctness of the model’s predictions by comparing the number of correctly predicted instances to the total number of instances for that specific intervention. The accuracy of our DT on test set for each output (intervention) with accepting 0.1 error is:
- Number of correct predictions with accuracy of 0.1 for NoLockdown: 0.72
- Number of correct predictions with accuracy of 0.1 for SocialDistancing: 0.73
- Number of correct predictions with accuracy of 0.1 for SoftLockdown: 0.69
- Number of correct predictions with accuracy of 0.1 for HardLockdown: 0.81
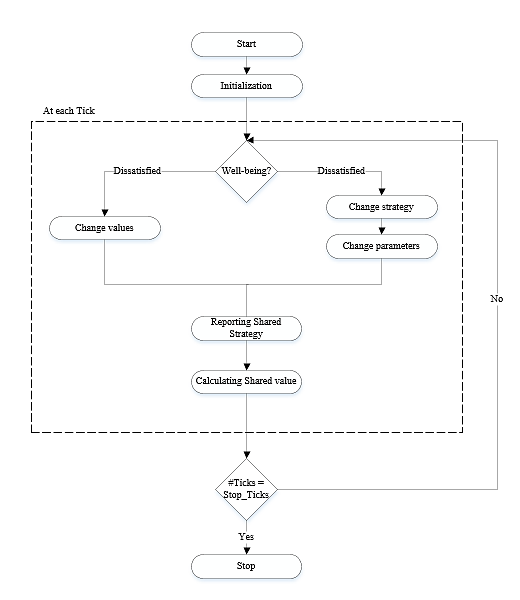
ABM conceptualisation
The flowchart of the model is shown in Figure 3. In the initialisation phase, the agents are created, the network is set up and agents are initialised with random attributes for their value systems, region, following country, tolerable threshold for infected cases, tolerable threshold for unemployment, tolerable threshold for freedom, and well-being parameters related to health, freedom, and unemployment (we define and conceptualise well-being later). At each tick (two weeks), each agent checks its well-being. A country satisfaction is measured by comparing the current status of well-being variables of the agent with the related tolerable thresholds. If one or more than one element do not meet the tolerable thresholds, the agent is not satisfied with the situation. In this way, agents who are more sensitive to freedom or unemployment will be dissatisfied faster based on their unemployment and freedom elements.
If the agent is satisfied with its well-being, nothing will happen. Otherwise, the agent follows the two independent processes of change: value change and institutional change. If the agent is dissatisfied with the current well-being, the agent changes the strategy. We conceptualise 4 types of strategy change (ML, Copy, Mutation, and Case-based). The type of strategy change, which each agent might chose is a probability that is determined based on the parameter settings of the scenarios of simulation. After each change, the parameters will be updated and the overall values and the shared strategy will be calculated. The entire process is iterative. The simulation stops after a certain number of ticks.
The model includes the following components:
- Agents. The country agents have certain attributes: region, country-to-follow, tolerable threshold for infected cases, tolerable threshold for unemployment, tolerable threshold for freedom, well-being (with its two states: satisfaction and dissatisfaction), a value system, frequency of value change, change degree and country change threshold, and country strategies to deal with the pandemic.
- Well-being is defined in terms of granting essential "doing and being" like an opportunity to be healthy, employed, and mobile by providing equal access to the healthcare services, job market and unrestricted mobility (Anand et al. 2020; Sen 1993). It is the government’s role to set institutions that would support citizens’ well-being. Therefore, we conceptualised well-being as a function including three elements: health, which is number of infected cases for 14 days ago per 100,000 population; unemployment rate; and freedom rate (civil liberties). The initial amount for each of these parameters is a random number in the specific range; derived by real-world data.
A country satisfaction (on its well-being) is measured by comparing the current status of well-being variables (number of cases, unemployment rate, and freedom rate) of that agent with the related tolerable thresholds which are cases_threshold, unemployment_threshold, freedom_threshold (the ranges of the variables are derived by real-world data and the tolerable thresholds are determined based on the initial variables + a random number or initial variables – a random number, see Table 1).
If one or more variables do not meet the tolerable thresholds, the agent is not satisfied with the situation. In this way, agents who are more sensitive to freedom or unemployment will be dissatisfied faster. Yet, the type of institution that is selected as a result of this dissatisfaction is not in anyway, related to the values of the agents.
For the country’s value system, we use two sets of Schwartz values: Openness-to-change and Conservatism. 1) Openness-to-Change (\(OSS\)) covers the two values: Self-Direction, Stimulation; 2) Conservatism (\(CST\)) covers the two values: Security, and Tradition.
We introduced two variables with a range [0, 1] to represent these two value sets for each agent, such that \(OSS + CST = 1\) following the existing literature (Bojanowska et al. 2020; Bonetto et al. 2021). - Country strategies. We defined four interventions, following Ghorbani et al. (2020): NoLockdown, SocialDistancing, SoftLockdown, HardLockdown.
A country strategy is a collection of the four interventions, Country Strategy = {‘NoLockdown’: value, ‘SocialDistancing’: value, ‘SoftLockdown’: value, ‘HardLockdown’: value}. Each intervention is a float variable in the range of [0, 1]8 (more details will be explained in Section 4.1). This implies that at any point in time, a country can have more than one of these interventions, which form the overall strategy of that country. Each agent records its current strategy (the combination of above mentioned interventions) which is coded using the ADICO grammar, along with its three well-being variables.
We measure the "strictness" of a country strategy, which is the weighted summation of all four interventions of a country strategy based on Equation 2. The weights are selected in such a way that weights of stricter interventions are higher (the weight of HardLockdown is higher than SoftLockdown and so on). The weights for each intervention are derived manually by us. Since for all scenarios we use the same weights, they are comparable.\[ W_{CS_t} = CS_t [NoLockdown] \cdot 1 + CS_t [SocialDistancing] \cdot 10 \\ + CS_t [SoftLockdown] \cdot 100 + CS_t [HardLockdown] \cdot 1000 \] \[(2)\] - Strategy change. Over time with increasing numbers of infected cases, increase in unemployment rate, or decrease in freedom rate, if agents are not satisfied with their current situation, they change their strategy. Satisfaction is measured by comparing the current status of well-being variables with the related tolerable thresholds for each agent, which is a parameter in the model. Changing strategy means changing the values of the four interventions.
Countries can copy the strategies of other countries during the pandemic. An example of countries copying other countries’ strategies during the pandemic is the widespread (adoption) of mask mandates. This strategy was first implemented in Asian countries such as South Korea and Taiwan and was later copied by many other countries around the world as a way to slow the spread of the virus (Han et al. 2020). However, our current assumption is that every country has a unique value system, economic, and social factors, and what works in one country may not work in another, so each country’s strategy change is tailored to its specific circumstances. Therefore, the strategy changes are not coded to always result in an increase or decrease of the well-being parameters. Countries have different mechanisms to change their strategies, if it is needed, that might result in a stronger or weaker strategy.
We model strategy change in four different ways:- ML, the strategy changing process makes use of extensive data that trains our agents in choosing the most realistic strategy based on what actually happened during the pandemic. A Regression Decision Tree is trained using real-world data on the conditions (e.g., number of infected cases) that lead to specific combination of interventions.
- Copying the strategy of an agent (country) that this particular agent is following (i.e., the initial values are similar to the country’s initial values). This strategy change mimics the way that countries copying each other’s strategies, as mentioned above.
- Mutation, randomly changing one of the intervention values to 1 to form a new strategy.
- Case-based with a degree of evaporation, which means agents change their strategies (interventions’ weights) according to the rise in cases: more cases, stricter interventions.
Additionally, to replicate the strategy lifting that can happen in reality over time, each intervention may evaporate with a degree. The procedure is based on Algorithm 1: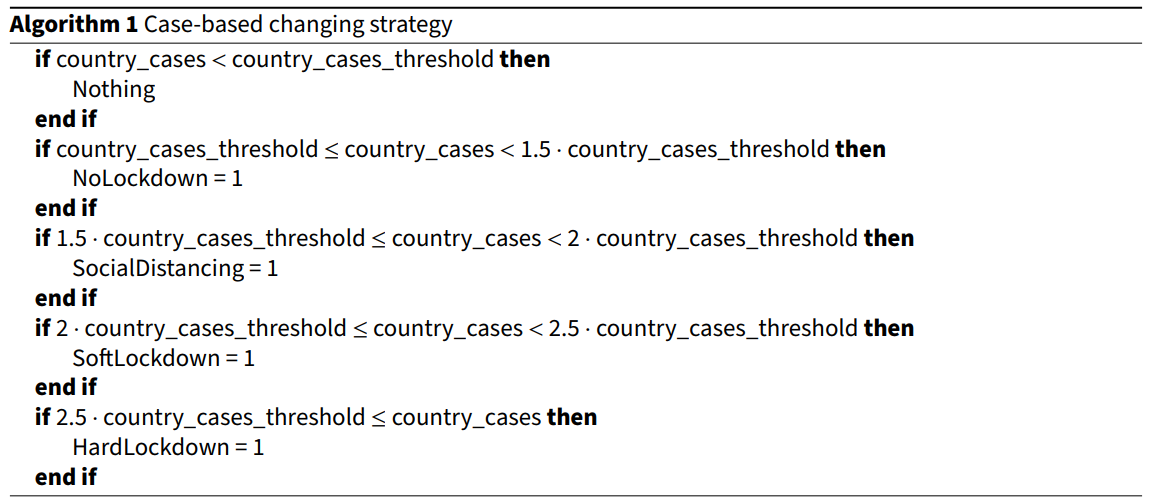
It is worth to mention that in reality, it might happen that one strategy is a combination of several countries’ strategies. Although, we did not define a strategy change in a way that produces a joint strategy (i.e., combining the strategies of several countries) as a result of one step of change, it may occur gradually over several strategy changes. - Updating parameters. Based on the new chosen country strategy, the three well-being parameters of each agent will be updated. The effects of new strategy on well-being parameters are inspired from (Nussbaumer-Streit et al. 2020), who studied the effect of different strategies on essential well-being elements (explained in Appendix B). Under this assumption, the effect of HardLockdown intervention in decreasing cases, increasing unemployment, and decreasing freedom, is greater than other softer interventions.
- Value change. Changes in the values prioritisation occur when the agent is not satisfied with the current well-being status. In this situation, value change occurs by decreasing or increasing the previous value based on its initial state (Bonetto et al. 2021). If the initial OSS is high (\(\geq\) 0.5), the new OSS will decrease: OSS - change_degree. If the initial OSS is low (\(<\) 0.5), the new OSS will increase: OSS + change_degree. Consequently, CST will be updated to 1 - OSS. However, not all countries seek to change their values at each tick. They might change or not, based on their well-being status and parameters related to value change as describe below.
The change_degree is different for each country at each changing time. This determines how much one value can change for each country. This is a random variable between 0 and changing threshold (country_change_threshold) for that specific country. Additionally, value change for each country has a threshold: country_change_threshold. This threshold determines, for each country, how much the initial values can change. This threshold is different for each country based on their initial values. The summation of all change_degrees during the simulation for each country cannot exceed this threshold. The more openness agents have higher threshold and viceversa.
Additionally, each agent has a frequency of value change. The ‘frequency_of_value_change’ determines how many ticks the agent should wait before changing the values. This parameter is based on the initial values of the agent. The frequency of change is low for the countries with the low initial OSS (the country rarely changes its values). If the initial OSS is high, the country is more open to change, thus frequency_of_value_change is higher. In other words, if the agent is not satisfied with its well-being, it is not always going to change the values. The agent waits until its frequency of change allows it to change. For example, if the frequency of change is 2 for an agent, it should wait two ticks, until while the agent is dissatisfied, and then change the values.
When values change, the unemployment_threshold and freedom_threshold also will be updated accordingly. If the initial OSS is high, the unemployment_threshold will decrease and the freedom_threshold increases by one unit. If the initial OSS is low, the unemployment_threshold will increase and the freedom_threshold decrease by one unit (see Table 1).
As pandemic changes things rapidly, the memory of the previous social order is still fresh and will pull back when possible. Therefore, we assume a roll back mechanism as one option for designing our scenarios. When values changes of a country reach a specific threshold (different for each country, country_threshold), there is a probability that the country’s values roll back to the initial values or the status quo. - Shared strategy. Later on in time, the average of all country strategies shows the average weights of interventions across all countries and here we refer to it as the shared strategy.
For example suppose we have three countries with: Country1 Strategy = {‘NoLockdown’: 0, ‘SocialDistancing’: 0, ‘SoftLockdown’: 1/2, ‘HardLockdown’: 0}, Country2 Strategy = {‘NoLockdown’: 0, ‘SocialDistancing’: 0, ‘SoftLockdown’: 1/2, ‘HardLockdown’: 1}, and Country3 Strategy = {‘NoLockdown’: 0, ‘SocialDistancing’: 1, ‘SoftLockdown’: 0, ‘HardLockdown’: 0}; the shared strategy will be {‘NoLockdown’: 0, ‘SocialDistancing’: 1/3, ‘SoftLockdown’: 1/3, ‘HardLockdown’: 1/3}.
We measured the "strictness" of a shared strategy, which is the weighted summation of all four interventions of a shared strategy based on what is mentioned in ‘Country strategies’ part, Equation 3:\[ W_{SS_t} = SS_t [NoLockdown] \cdot 1 + SS_t [SocialDistancing] \cdot 10 \\ + SS_t [SoftLockdown] \cdot 100 + SS_t [HardLockdown] \cdot 1000 \] \[(3)\] - Accumulated value. Accumulation of values is a variable that is calculated in the model, showing the sum of all OSS values for all countries. We keep track of this to explore the relationship between overall value of countries and shared strategy at each time.
Dissatisfaction about well-being serves as a starting point for both updating processes of values and country strategies. However, the actual update functions of these two are completely independent of each other. In that way, we ensured that any relationships between shared strategies and accumulated values could only be the outcome of the model and would not be coded into the model.
Model Implementation and Sensitivity Analysis
Implementation details
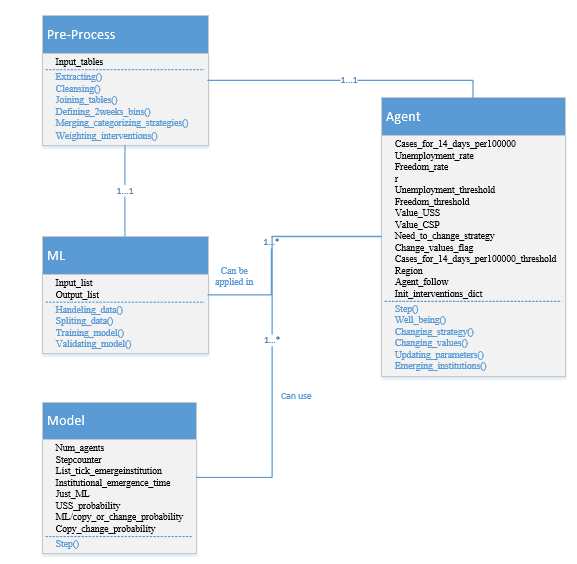
The model was implemented in Python using Mesa (ABM part) and Sklearn (ML part) libraries. The class diagram of the model is shown in Appendix C. The codes of this study is openly available on CoMSES: https://www.comses.net/codebase-release/29022830-747d-401b-80fb-177e45b94559/.
We use random initial parameter setup (to explore the whole domain space) in specific ranges. The specific ranges for our parameters are derived by real world data (Sattenspiel et al. 2019) (as mentioned in Section 3.2). The model parameters are shown in Table 1. Note that each element of well-being, also has a tolerable threshold.
Moreover, we defined three groups of countries: countries with very high initial OSS, countries with very high initial CST, and countries in between.
| Name | Base value | Threshold parameter | Variable | Description | ||
| Number of agents | 100 | - | P | Number of agents | ||
| per100000 | random integer [0, 2] | Cases_threshold = random integer [30, 60] | P-P | The number of infected cases per 100,000 in 14 days. The threshold of tolerating cases. | ||
| unemployment | random integer [0, 30] | unemployment _threshold = unemployment + random integer [0, 10] | P-V | The initial unemployment rate. The tolerable threshold for unemployment. | ||
| freedom | random integer [40, 90] | Freedom_threshold = freedom - random integer [0, 30] | P-V | The initial freedom rate. The tolerable threshold for freedom. | ||
| OSS | random uniform [0, 1] | - | V | The probability of generating an agent with high (greater or equal to 0.5) or low (less than 0.5) USS has been fed by a model parameter. | ||
| CST | random uniform [0, 1] | - | V | 1 - OSS | ||
| r | 0.2 (initial value) In each tick: r (new) = cases_this_tick / cases_previous_tick | - | P | Reproduction rate. | ||
| value_change | if the initial OSS \(\geq\) 0.8: frequency_of_value_change = 1 if 0.5 \(\leq\) initial OSS \(<\) 0.8: frequency_of_value_change = 2 if 0.5 \(<\) initial CST \(<\) 0.8: frequency_of_value_change = 4 if the initial CST \(\geq\) 0.8: frequency_of_value_change = 8 | - | P | How many ticks the agent wait to change the values. | ||
| decrease_freedom | random uniform [0.03, 0.09] | - | P | |||
| unemployment | random uniform [0.03, 0.05] | - | P | |||
| increase_cases | if r \(<\) 1: cases_14_100000 \(\times\) random.randint(0, 5) or random.randint(0, 100) if r \(\geq\) 1: cases_14_100000 \(\times\) r | - | V | |||
| initial_strategy | {‘NoLockdown’: 0, ‘SocialDistancing’: 0, ‘SoftLockdown’: 0, ‘HardLockdown’: 0} | - | V | The initial country strategy. | ||
| change_degree | if the initial OSS \(\geq\) 0.5: min (initial OSS, initial CST) if the initial CST \(>\) 0.5: min (initial OSS, initial CST)/2 | - | P | How much the initial values can be changed? | ||
| strategy | 0 | - | P | A flag to show whether it needs to change strategy or not. It feeds based on the output of well-being function. | ||
| region | Probability based on real distribution of countries in regions from ACAPS dataset (REGION_Africa, REGION_Americas, REGION_Asia, REGION_Europe, REGION_Middle_east, REGION_Pacific: 0.3, 0.2, 0.1, 0.2, 0.1, 0.1) | - | P | The region of the agent. | ||
| countrycountry-to-follow | An Agent (with similar initial OSS/CST values) | - | P | The similar agent in terms of initial values. |
Sensitivity analysis
We use sensitivity analysis on the model level variables to explore input/output domain space in order to identify parameters for which small variations most affect the model’s output (Lee et al. 2015).
The parameters, on which we did OFAT (one-factor-at-a-time) sensitivity analysis (ten Broeke et al. 2016), are shown in Table 2. ‘OSS Degree’ determines the probability of generating countries with high (OSS greater or equal to 0.5) or low initial OSS (less than 0.5). We assumed three values for this parameter to cover low, medium, and high initial OSS. ‘ML Degree’ is the probability of using past experiences (trained ML) in selecting strategies among countries. It shows which portion of the world use ‘ML’ when they need to change their strategies. Greater’ ML Degree’ shows a simulated world, where most countries use past experiences (trained using real-world data) to change their strategy. ‘Innovation Degree’ represents the probability of countries being more innovative in changing their strategies or just simply go to copy their strategy from another country. Lower value for ‘Innovation Degree’ probability means higher chance to go for copying.
| Value | Varied Range |
|---|---|
| OSS Degree | 0.3, 0.6, 0.9 |
| ML Degree | 0, 0.3, 0.6, 0.9 |
| Innovation Degree | 0, 0.3, 0.6, 0.9 |
To find the sensitivity of the model, for each combination of model parameters, we run the model 100 times (in total 4800 independent simulation runs). The model outcomes for sensitivity analysis phase are shown in Appendix E.
Based on the result of sensitivity analysis, we reached to these parameter ranges: OSS Degree 0.3, 0.6, 0.9; ML Degree 0, 0.3, 0.6; Innovation Degree 0.3, 0.6, 0.9.
The goal of our experiments is to see the overall pattern between accumulated value and shared strategy over time. We designed four scenarios as shown in Table 3, where the mechanisms of strategy change, and whether there is roll back in the value change process easing for interventions, vary.
| Scenario | Strategy Change mechanism | Roll Back? | Strategy Evaporation? | OSS Degree | ML Degree | Innovation Degree |
|---|---|---|---|---|---|---|
| 1 | Mutation, Copy, ML | No | No | 0.3, 0.6, 0.9 | 0, 0.3, 0.6 | 0.3, 0.6, 0.9 |
| 2 | Mutation, Copy, ML | Yes | No | 0.3, 0.6, 0.9 | 0, 0.3, 0.6 | 0.3, 0.6, 0.9 |
| 3 | Case-based, Copy, ML | No | Yes | 0.3, 0.6, 0.9 | 0, 0.3, 0.6 | 0.3, 0.6, 0.9 |
| 4 | Case-based, Copy, ML | Yes | Yes | 0.3, 0.6, 0.9 | 0, 0.3, 0.6 | 0.3, 0.6, 0.9 |
Results
We executed 10800 independent simulation runs (4 scenarios, each combination of model parameters 300 runs: \(4 \times 3 \times 3 \times 3 \times 100 = 10800\)).
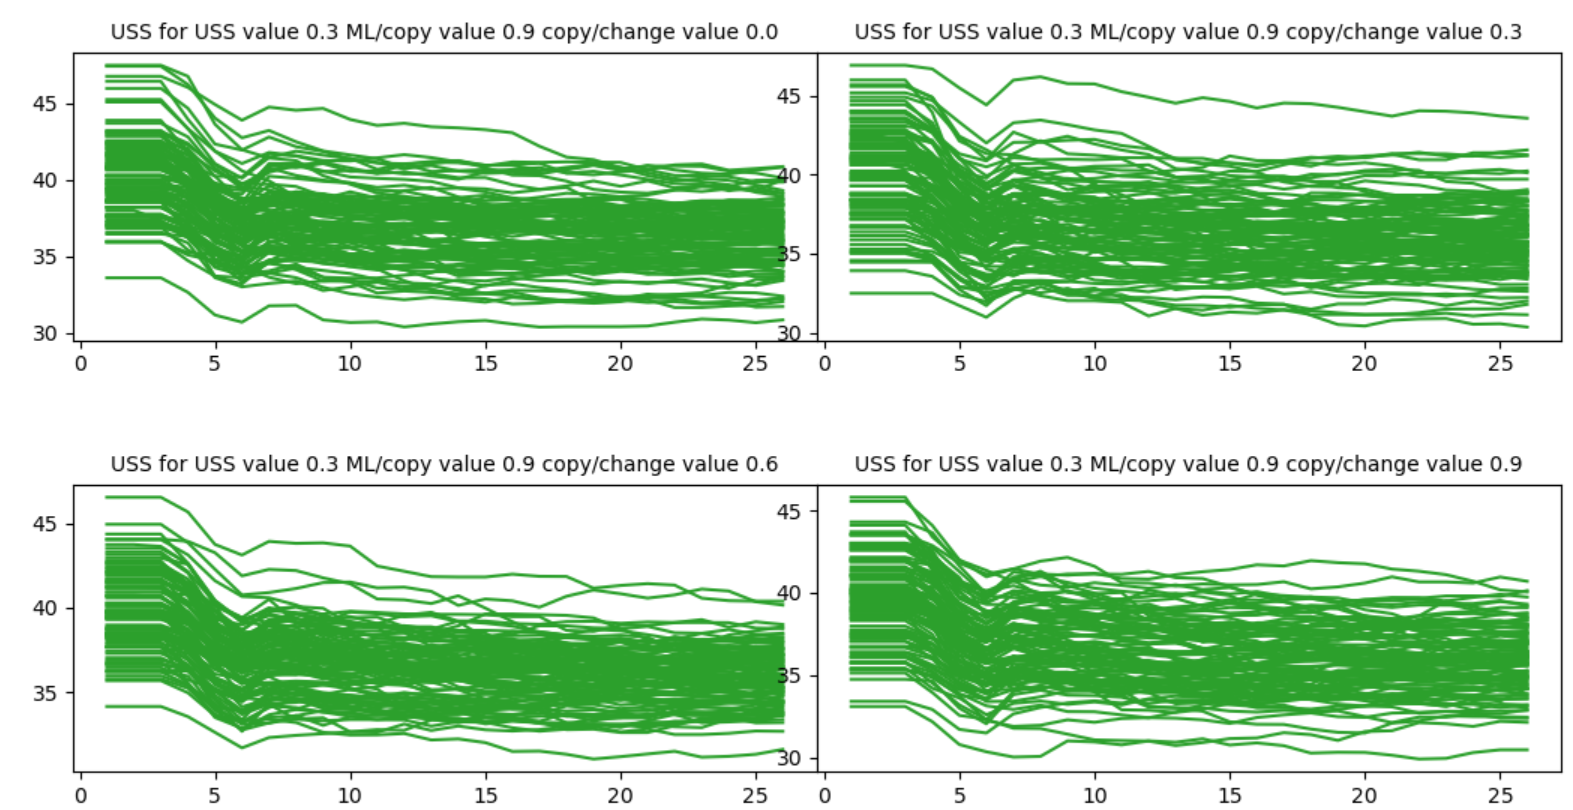
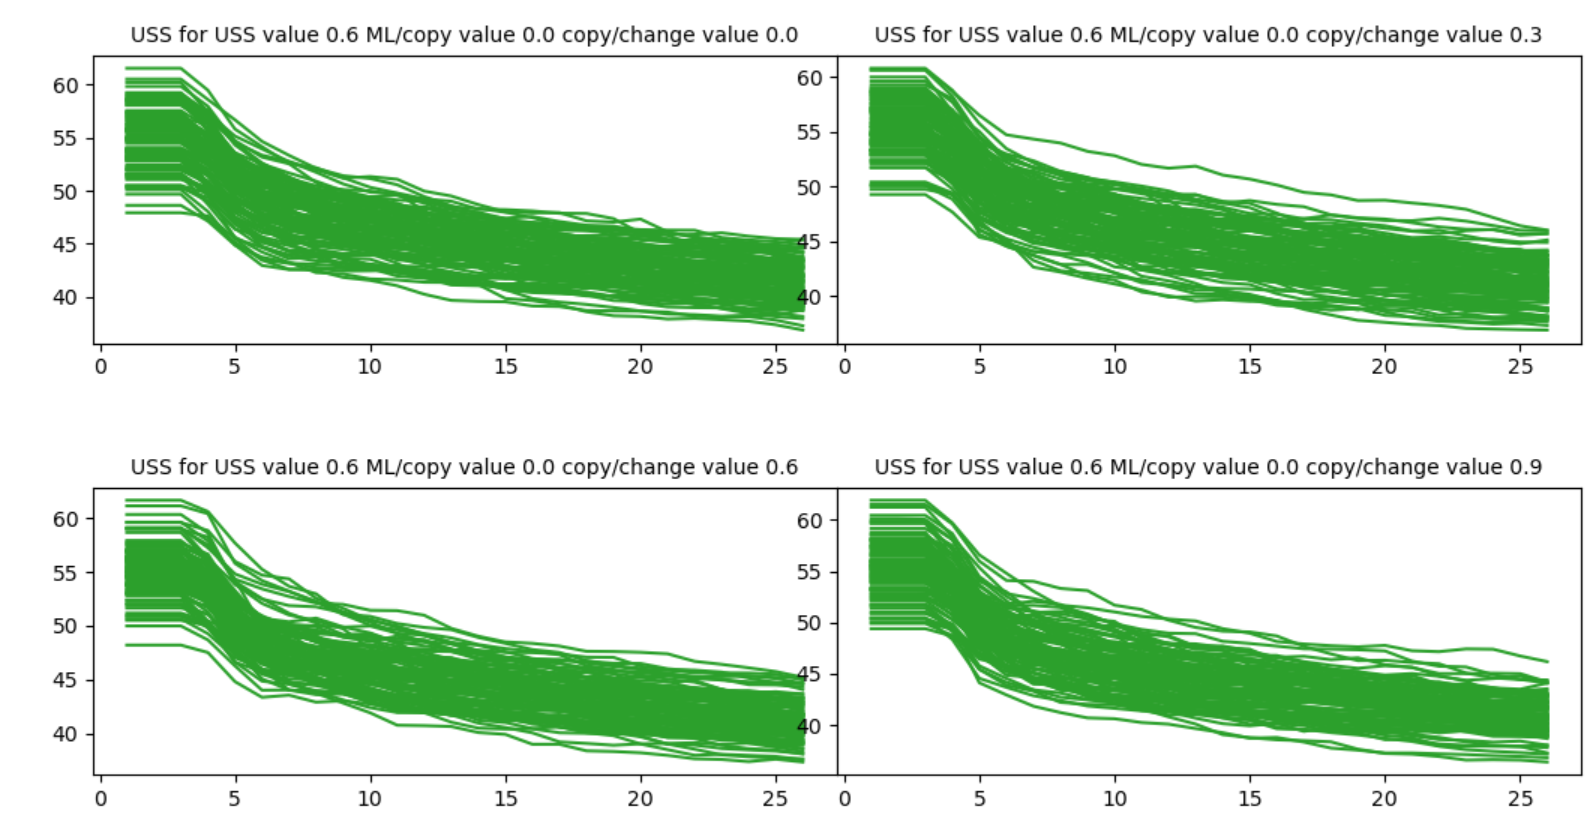
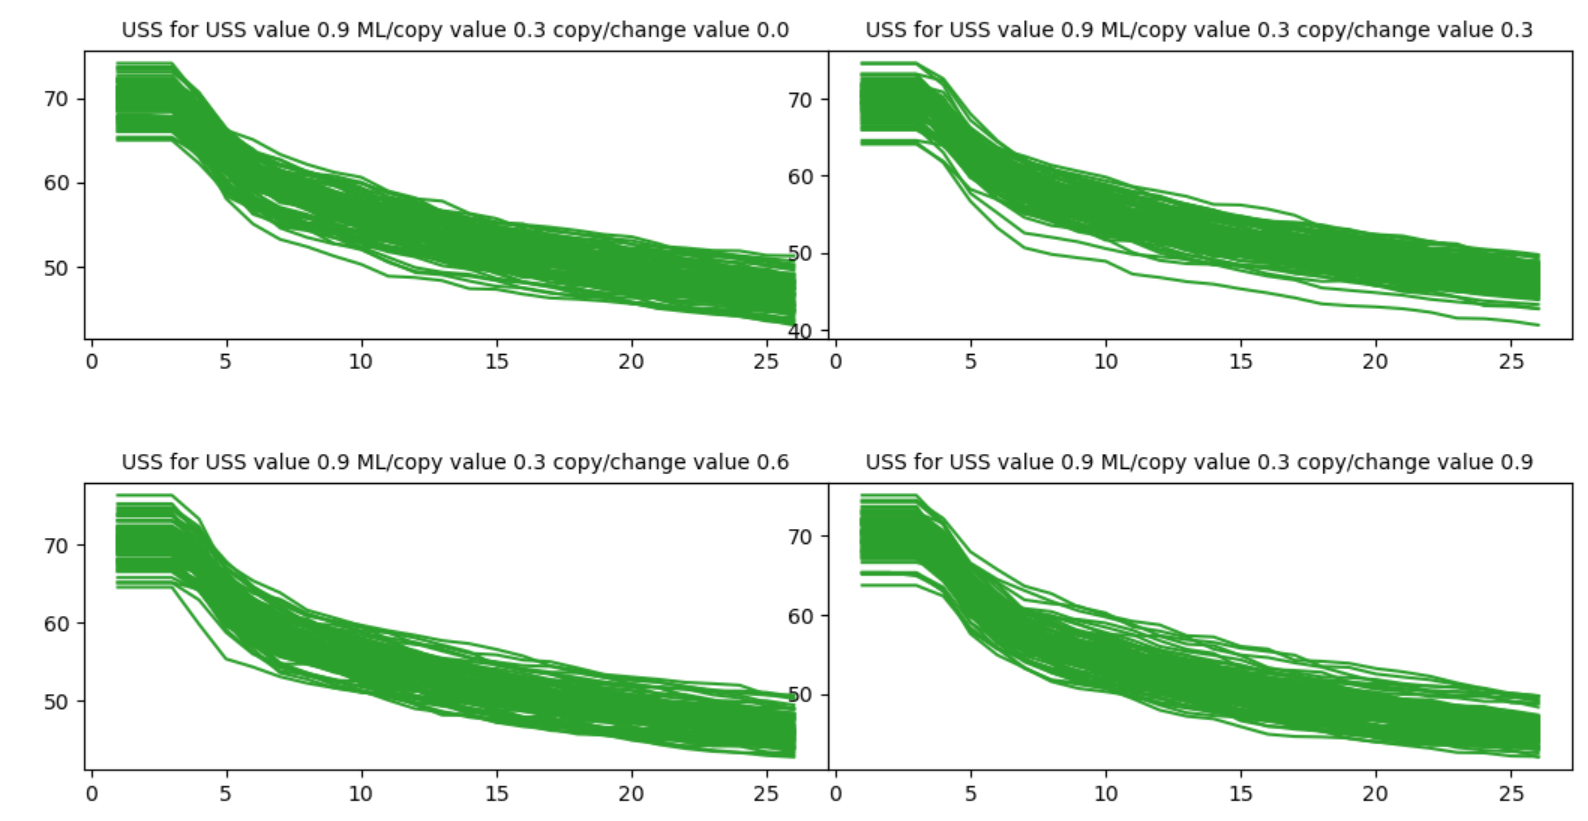
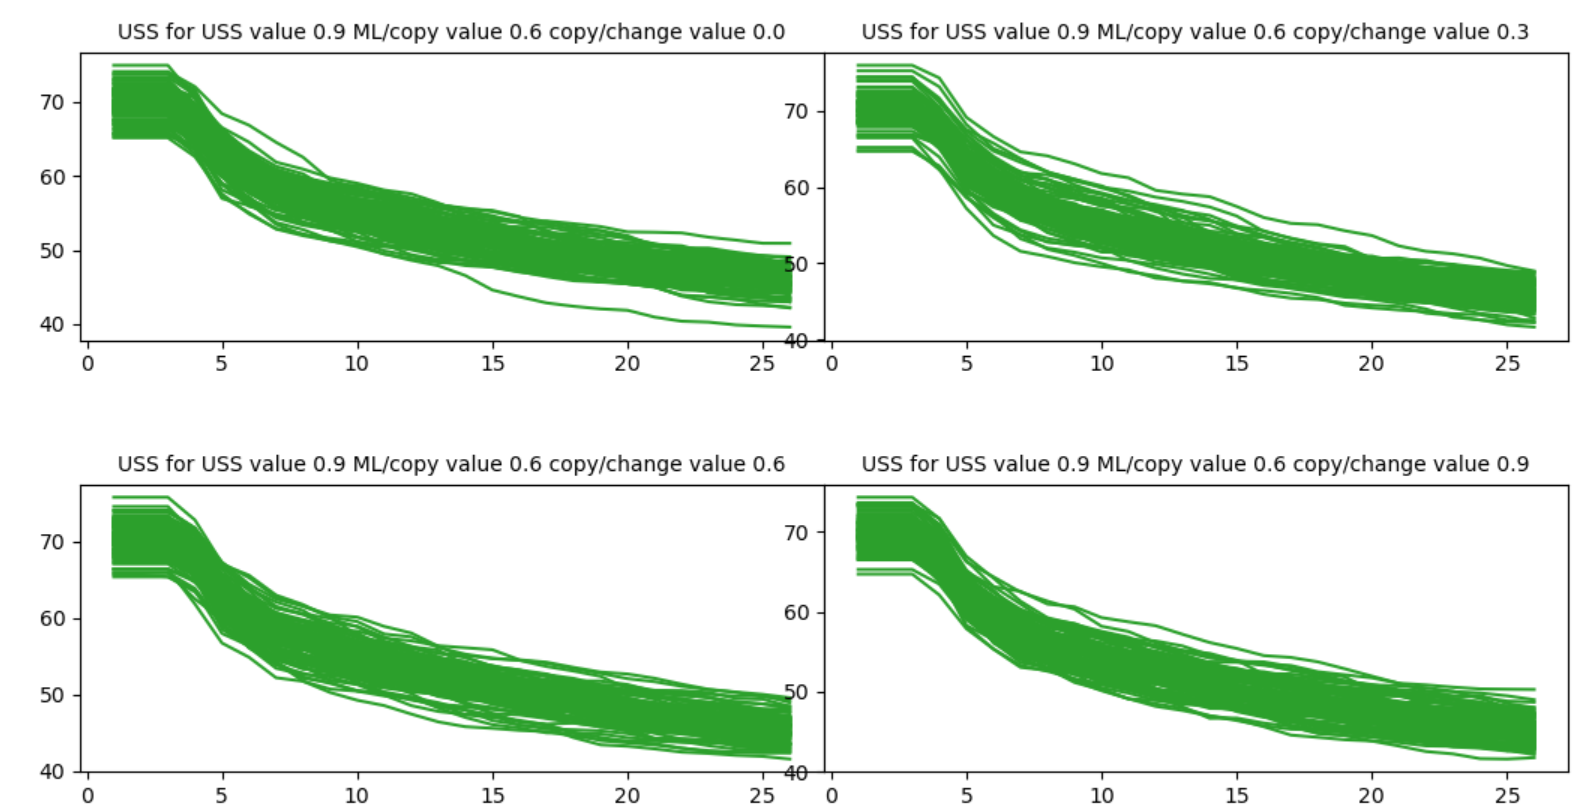
The goal is to extract general patterns between accumulated value change and shared strategy. Figure 4 shows the strictness of the shared strategy (in blue) and the accumulated value (in green) averaged over runs for all four scenarios. First, we look at the slope of diagrams; we then discuss the general pattern between shared strategy and accumulated value, the correlations, the causes by analysing dissatisfaction (well-being parameters), interventions, and agents’ specifications by exploring the differences between the scenarios.
Adaptation speed to the pandemic: The results in Figure 4 indicate that at the beginning of the pandemic, there are big changes in strategies; meaning that countries change their strategies significantly to adapt to the pandemic as shown by the slope of the diagram (Figure 4) at the beginning. This is in line with the theory that suggests institutional change is more frequent as the start of a collective situation (Farjam et al. 2020). After the cross point between accumulated value and shared strategy, the slope for both diagrams slowly flattens. This can be the consequence of selecting more effective strategies as a result of learning behaviour driven by the data-trained decisions.
General pattern: A general inverse relationship between shared strategies and accumulated values is observable (Figure 4). When the summation of OSS values for all countries is high (on average), the strategies are less strict on average and vice versa. One reason for this pattern is that when the overall accumulated OSS is high, the agents change their values more often, to adapt to new situations and therefore, there is less dissatisfaction. On the other hands, when the overall accumulated CST is high, the agents rarely change their values. Consequently, they are suddenly faced with dissatisfaction caused by the pandemic (immediate changes in the number of infected cases, unemployment rate, or freedom rate which are not in the tolerable threshold ranges of the country).
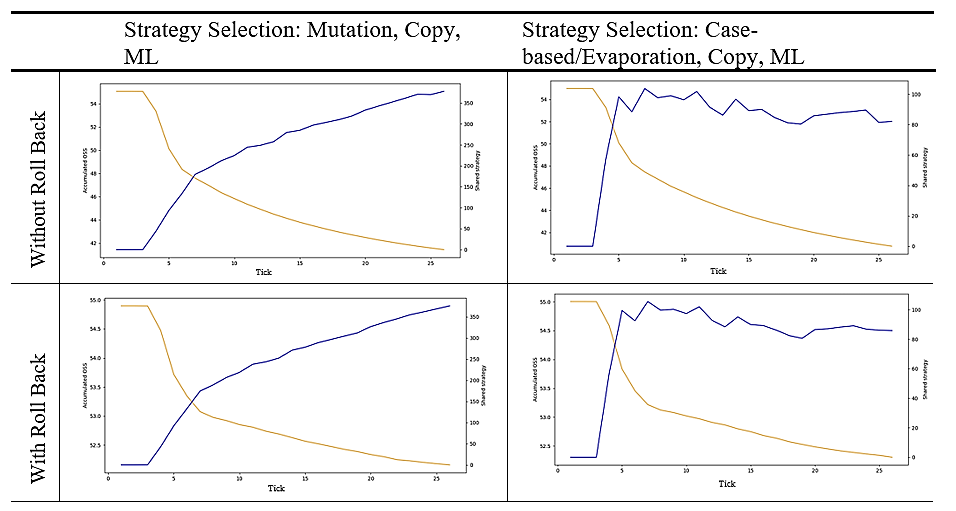
Figure 4 also shows the effect of having random selection of interventions (i.e., mutation) as opposed to being sensitive to number of infections (i.e., case-based). The strictness of interventions follows a smoother curve when mutation take place, while being have a case-based selection criteria has a much steeper path towards strictness. This is due to the fact that agents can choose stricter interventions only based on the rising of cases. This difference is also observed in the correlation analysis: it is stronger with the presence of mutation (the correlation between shared strategy and accumulated value (OSS) is - 0.99), and lower with the presence of case-based/evaporation strategy selection (- 0.72). Having rollback mechanisms for values (i.e., Scenarios 2 and 4 compared to Scenarios 1 and 3) does not however, create too much of a difference among the correlations.
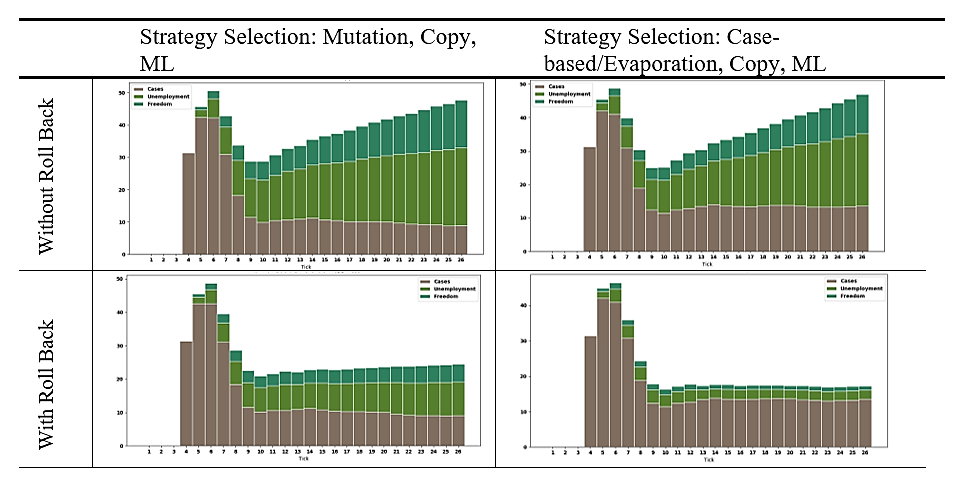
Well-being: Figure 5 shows the countries’ dissatisfaction values, for the four scenarios over time. The average number of countries who are not satisfied with each well-being elements are shown with different colours: dissatisfaction caused by the number of infected cases (in brown), increasing the unemployment rate (in light green), decreasing the freedom rate (in dark green). The dissatisfaction caused by cases shows (semi) stability after the first peak due to the interventions implemented over time.
When there is a roll back mechanism (i.e., there is a probability that the country’s values roll back to the initial values or the status quo, when values changes of a country reach a specific threshold), the satisfaction caused by unemployment and freedom rates is lower. Since in roll back mechanism, agents have the opportunity to tune their thresholds related to unemployment and freedom rates more often. Therefore, they adjust their tolerable thresholds over time and can better deal with the pandemic. Having a case-based selection/evaporation in place however, instead of mutation, does not influence the average satisfaction level of countries over time.
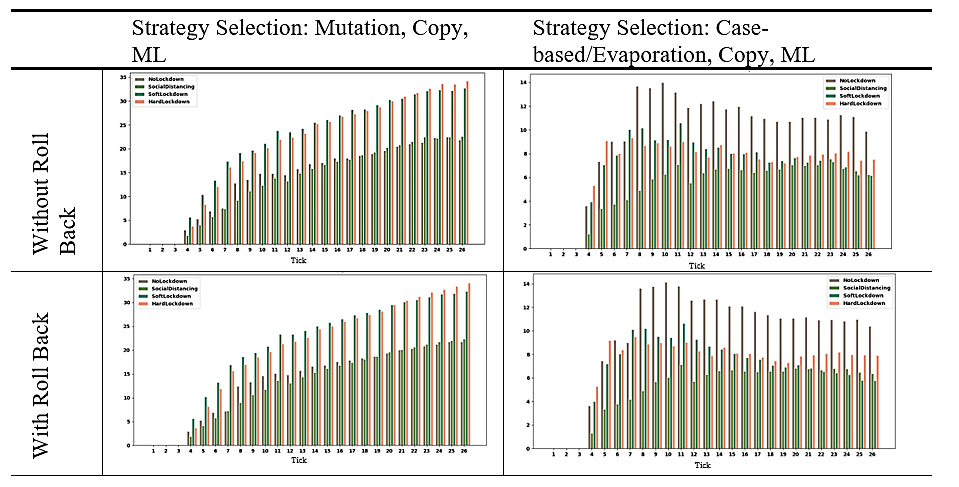
Interventions: Figure 6 shows the histograms of each interventions’ weights over time for each scenario. In Scenarios 1 and 2, agents choose stricter interventions. However, in Scenarios 3 and 4, they are choosing lighter ones.
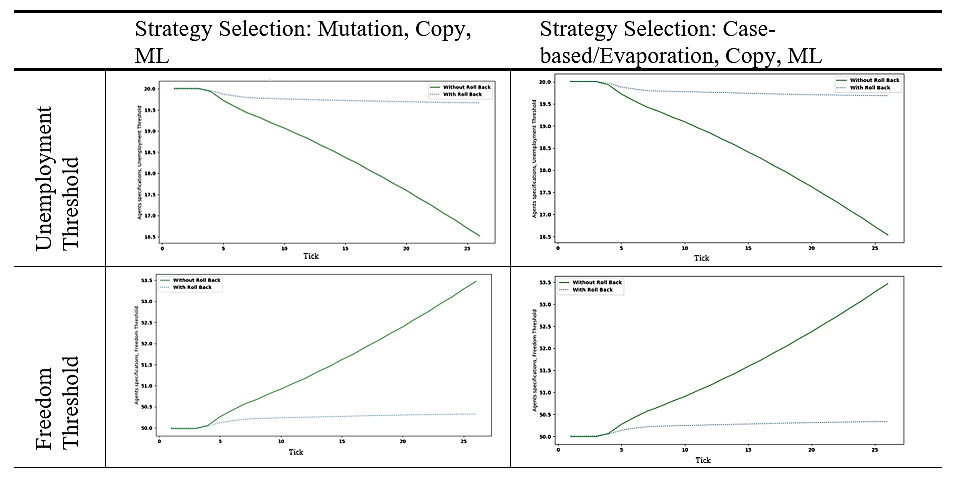
Agents’ specifications: By exploring agents’ specification in four scenarios, there is no differences between their parameters except for unemployment and freedom thresholds (Figure 7). As we discussed earlier, in situations with higher frequency of change, countries have more opportunity to adjust their unemployment and freedom tolerances when there is a roll back mechanism.
Discussion and Conclusion
This paper aimed to study and test the relationship between value change and shared strategy change during a crisis. In this work, we brought together computational capacities of agent-based modelling and machine learning to explore the relationship between change of value prioritisation in agents and emergence of shared strategies among agents.
While implementing strategy change and value change as two independent processes, we observed that the relationship between overall strategy (the intensity) change and accumulated value change under the pressure of a crisis (COVID-19 in this case) in general is inverse. Given that the selection of strategies was not directly influenced by the values of agents, this is an insightful confirmation of what may seem a trivial relation between values and institutions. When the overall openness-to-change value (OSS) among agents is high on average, the shared strategies are less strict (on average) and vice versa. This is an interesting observation as the agents are programmed to change their values more often and are therefore, able to more quickly adapt to new pandemic circumstances. In other words, being open to change, does not immediately make a government select more relaxed rules, but this correlation is rather an indirect consequence of being more dynamics in changing rules.
To better explain the findings of this research, it is also worth looking more closely at the impact of conservatism. When the overall accumulated CST among agents is high, the agents rarely change their values (i.e., OSS, CST). Therefore, they are faced with higher dissatisfaction rates caused by the pandemic in at least one of the well-being dimensions. Their responses to combat this dissatisfaction thus also needs to be large requiring them to choose more strict interventions. In other words, being more conservative does not make agents choose stricter rules, but these strict rules are the indirect consequence of not being open to (value) change.
The key message or explanation we draw from this research is, being open to change, does not necessarily cause a government to select more relaxed rules, but this correlation is rather an indirect and emergent consequence of being more flexible in changing rules, whether the consequent ones are more relaxed or stricter.
In this work, we aimed to incorporate data-driven decision making while also giving the possibility to explore a wider space of outcomes. This data-driven aspect of the work allowed us to model the process of institutional change and value change quite independently, as the selection of strategies was driven by actual decisions made by countries, rather than the result of value change in the model. Therefore, taking this data-driven decision-making approach proved to be highly useful for our specific goal.
This modelling practice, however, also faced some limitations. First, the model that we used as the basis to test the relation was quite abstract both in terms of specifications of countries (agents) and the world in general. Therefore, we did not really aim to model and study the dynamics of the pandemic in anyway, and rather used this situation as a proof-of-concept and source of data for intervention change. As such, we are not drawing any conclusion about how a pandemic can be better managed nor whether the existing institutions and values had any positive or negative impact on the way the pandemic played out. Second, we exclusively focused on shifts in values, encompassing diverse directions, rather than the intensification of values in the same direction. Specifically, countries with initially high OSS scores would experience a decrease in OSS (becoming more conservative), while countries with low OSS (high CST) would see an increase in OSS (becoming more open) in case of dissatisfaction. This is a very simplistic representation of value change and therefore, served as an illustration of how value change, and its relation with other components of a social system can be modelled. In addition to more advanced value change processes, for future work, it is also worth implementing feedback loops to inform agents about the consequences of their strategy selection on their state of well-being.
Acknowledgements
Anna Melnyk’s contribution is part of the ValueChange project that has received funding from the European Research Council (ERC) under the European Union’s Horizon 2020 research and innovation programme under grant agreement No. 788321. The later stage of the revisions was funded by the TPM Energy Transition Lab.Appendix A
Pre-processing
ACAPS Used Fields
| Field | Description |
|---|---|
| Country | Country of the record |
| Region | Region of the record |
| Log-Type | Introduction / extension of measures or Phase-out measure |
| Category | Sub-intervention category |
| Measure | Sub-intervention measure |
| Data-Implemented | The implementation date |
ACAPS Sub-interventions
| Category | Measure | Merged | Intervention |
|---|---|---|---|
| Governance and socio-economic measures | Limit product imports/exports | Governance and socio-economic measures. Limit product imports/exports | NoLockdown |
| Governance and socio-economic measures | Economic measures | Governance and socio-economic measures. Economic measures | NoLockdown |
| Movement restrictions | Border checks | Movement restrictions. Border checks | NoLockdown |
| Movement restrictions | Visa restrictions | Movement restrictions. Visa restrictions | NoLockdown |
| Movement restrictions | Additional health/documents requirements upon arrival | Movement restrictions. Additional health/documents requirements upon arrival | NoLockdown |
| Public health measures | Health screenings in airports and border crossings | Public health measures. Health screenings in airports and border crossings | NoLockdown |
| Public health measures | Awareness campaigns | Public health measures. Awareness campaigns | NoLockdown |
| Public health measures | Strengthening the public health system | Public health measures. Strengthening the public health system | NoLockdown |
| Public health measures | Other public health measures enforced | Public health measures. Other public health measures enforced | SocialDistancing |
| Public health measures | General recommendations | Public health measures. General recommendations | SocialDistancing |
| Public health measures | Requirement to wear protective gear in public | Public health measures. Requirement to wear protective gear in public | SocialDistancing |
| Public health measures | Testing policy | Public health measures. Testing policy | SocialDistancing |
| Public health measures | Psychological assistance and medical social work | Public health measures. Psychological assistance and medical social work | SocialDistancing |
| Public health measures | Obligatory medical tests not related to COVID-19 | Public health measures. Obligatory medical tests not related to COVID-19 | SocialDistancing |
| Lockdown | Partial lockdown | Lockdown. Partial lockdown | SoftLockdown |
| Movement restrictions | International flights suspension | Movement restrictions. International flights suspension | SoftLockdown |
| Public health measures | Isolation and quarantine policies | Public health measures. Isolation and quarantine policies | SoftLockdown |
| Public health measures | Mass population testing | Public health measures. Mass population testing | SoftLockdown |
| Social distancing | Limit public gatherings | Social distancing. Limit public gatherings | SoftLockdown |
| Governance and socio-economic measures | Emergency administrative structures activated or established | Governance and socio-economic measures. Emergency administrative structures activated or established | HardLockdown |
| Governance and socio-economic measures | State of emergency declared | Governance and socio-economic measures. State of emergency declared | HardLockdown |
| Lockdown | Full lockdown | Lockdown. Full lockdown | HardLockdown |
| Movement restrictions | Border closure | Movement restrictions. Border closure | HardLockdown |
| Movement restrictions | Surveillance and monitoring | Movement restrictions. Surveillance and monitoring | HardLockdown |
| Movement restrictions | Domestic travel restrictions | Movement restrictions. Domestic travel restrictions | HardLockdown |
| Movement restrictions | Curfews | Movement restrictions. Curfews | HardLockdown |
| Movement restrictions | Complete border closure | Movement restrictions. Complete border closure | HardLockdown |
| Social distancing | Schools closure | Social distancing. Schools closure | HardLockdown |
| Social distancing | Closure of businesses and public services | Social distancing. Closure of businesses and public services | HardLockdown |
Appendix B
Unemployment and freedom rates will be updated according to Table 6. There are two parameters increase_unemployment and decrease_freedom, which shows the amount to be increased or decreased at each tick (these two parameters are described in Table 1). For updating unemployment and freedom rates, we use a weighted sum of increase_unemployment/ decrease_freedom \(\times\) Effect_Intervention_i, where Effect_Intervention_i is the effectiveness of applying intervention \(i\) based on Table 6.
| Variable | NoLockdown | SocialDistancing | SoftLockdown | HardLockdown |
|---|---|---|---|---|
| Unemployment | 0.25 | 0.50 | 0.75 | 1 |
| Freedom | 0.25 | 0.35 | 0.65 | 0.90 |
Appendix C
The class diagram of the model is shown in Figure 9. Pre-processing is necessary for both ML and Agent classes. One trained and validated ML model can be applied in one or many agents (in Agent class). In addition, one Model class consists of several agents instances from Agent class.
Appendix D
Decease_freedom: based on the real data (https://freedomhouse.org/report/freedom-world), the differences in freedom between 2019, 2020, 2021 in average is 1-2, therefore each two weeks in average 0.04-0.08 is the decreased value. Therefore, we assume random uniform (0.03, 0.09) as decreased freedom parameter for each agent to cover the tolerances. In the scale of model parameters, it is between 1.4-4.2 (0.03-0.09 \(\times\) 100 /2.15).
Increase_unemployment: based on the real data (Monitor 2020), the differences in unemployment relative to 2019 in total is 1.1, therefore each two weeks in average 0.04 is the increased value. Additionally we have analysed https://databank.worldbank.org data, between 2019 and 2020 (the data for 2021 was not available on the time of analysing), we calculated the differences between unemployment rates of countries which we have available data, then divided the numbers per 24 to calculate the difference of unemployment in each two weeks, the average of differences in each two weeks for all the countries is 0.04 (same as what is mentioned for the first resource). Therefore, we assume random uniform (0.03, 0.05) as increased unemployment parameter for each agent to cover the tolerances. In the scale of model parameters, it is between 1.2-2.5 (0.03-0.05 \(\times\) 100 /2.5).
Increase_cases: It shows the increasing number of infected cases (without considering any strategies). Before starting the pandemic (\(r < 1\)) the new number of infected cases are estimated as a random number between: 1) number of current infected \(\times\) random integer [0, 5], which shows one infected person can infect 0 to 5 people; 2) or a random number between 0 to 100. When the pandemic starts (\(r \geq 1\)), based on the reproduction rate formula, the new infected cases are the current ones multiply to \(r\).
Appendix E
| OSS | ML Degree | Strategy Changes | Value Changes |
| 0.3 | 0 | 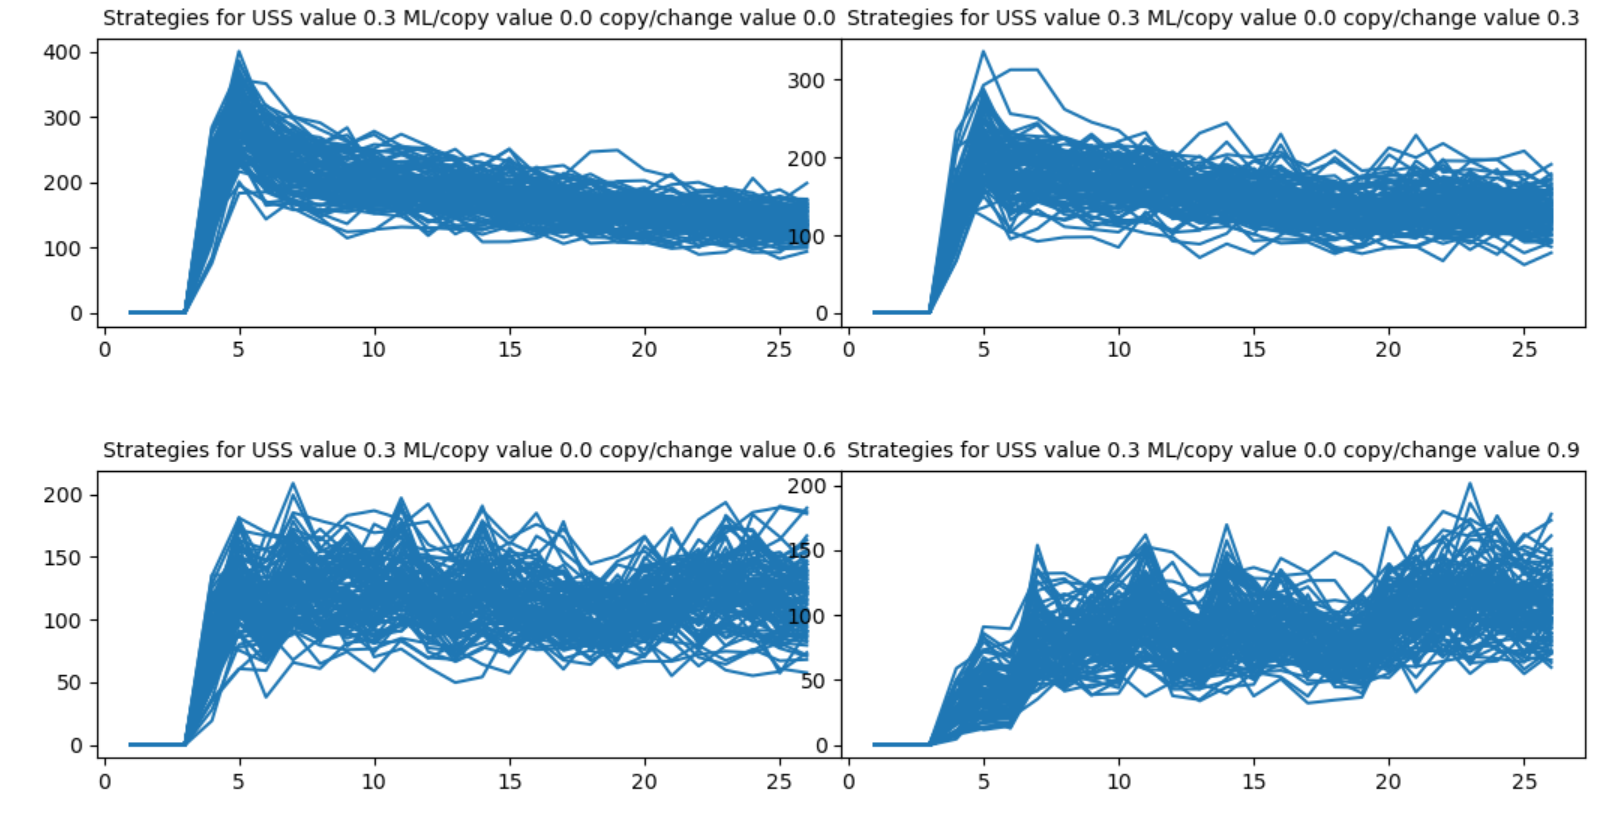 |
 |
| 0.3 | 0.3 | 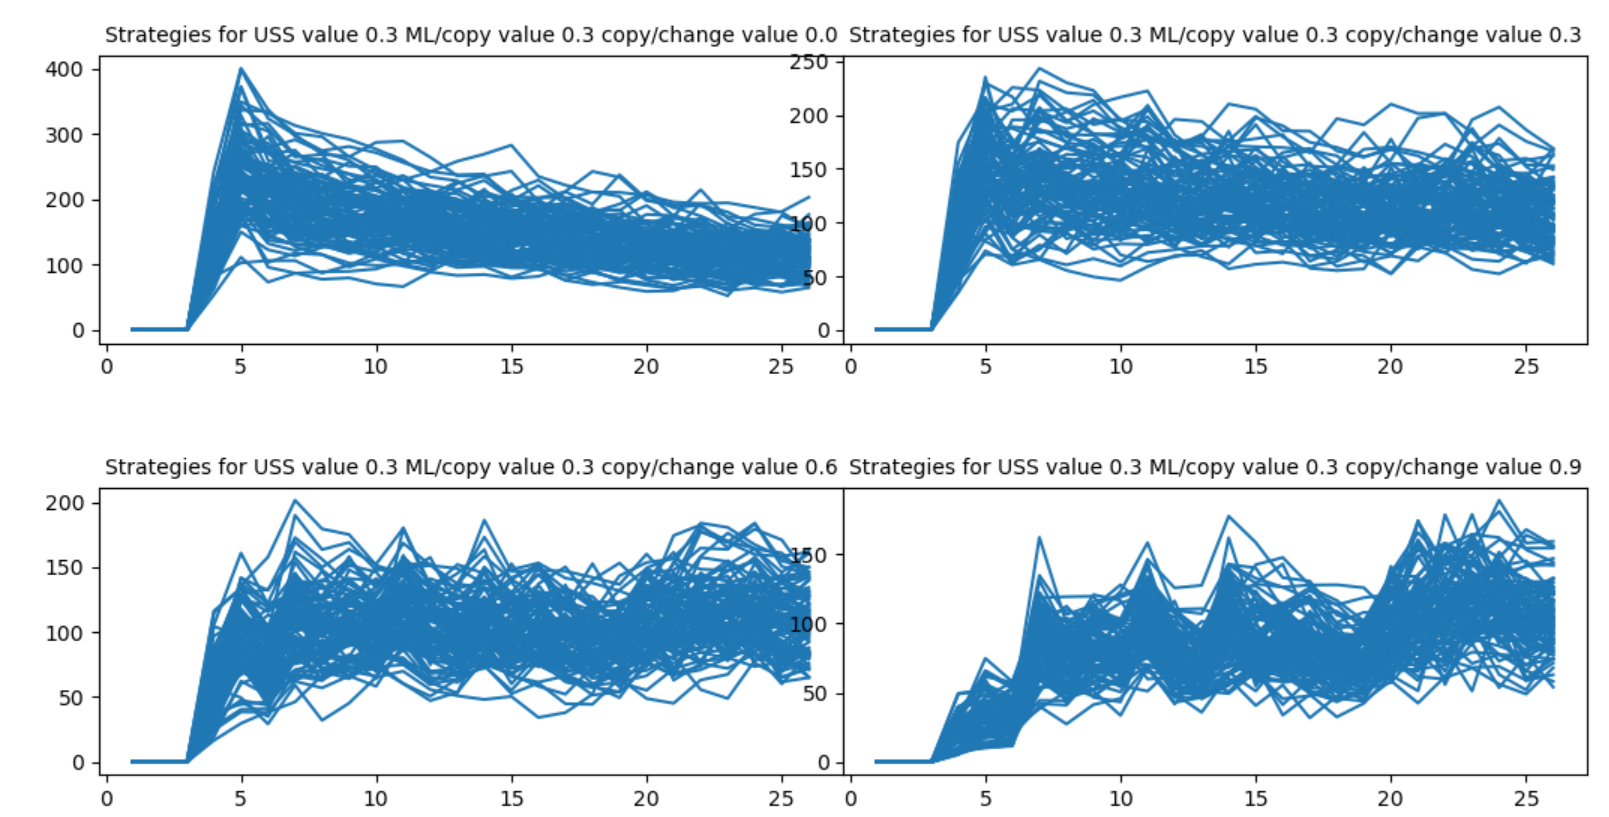 |
 |
| 0.3 | 0.6 | 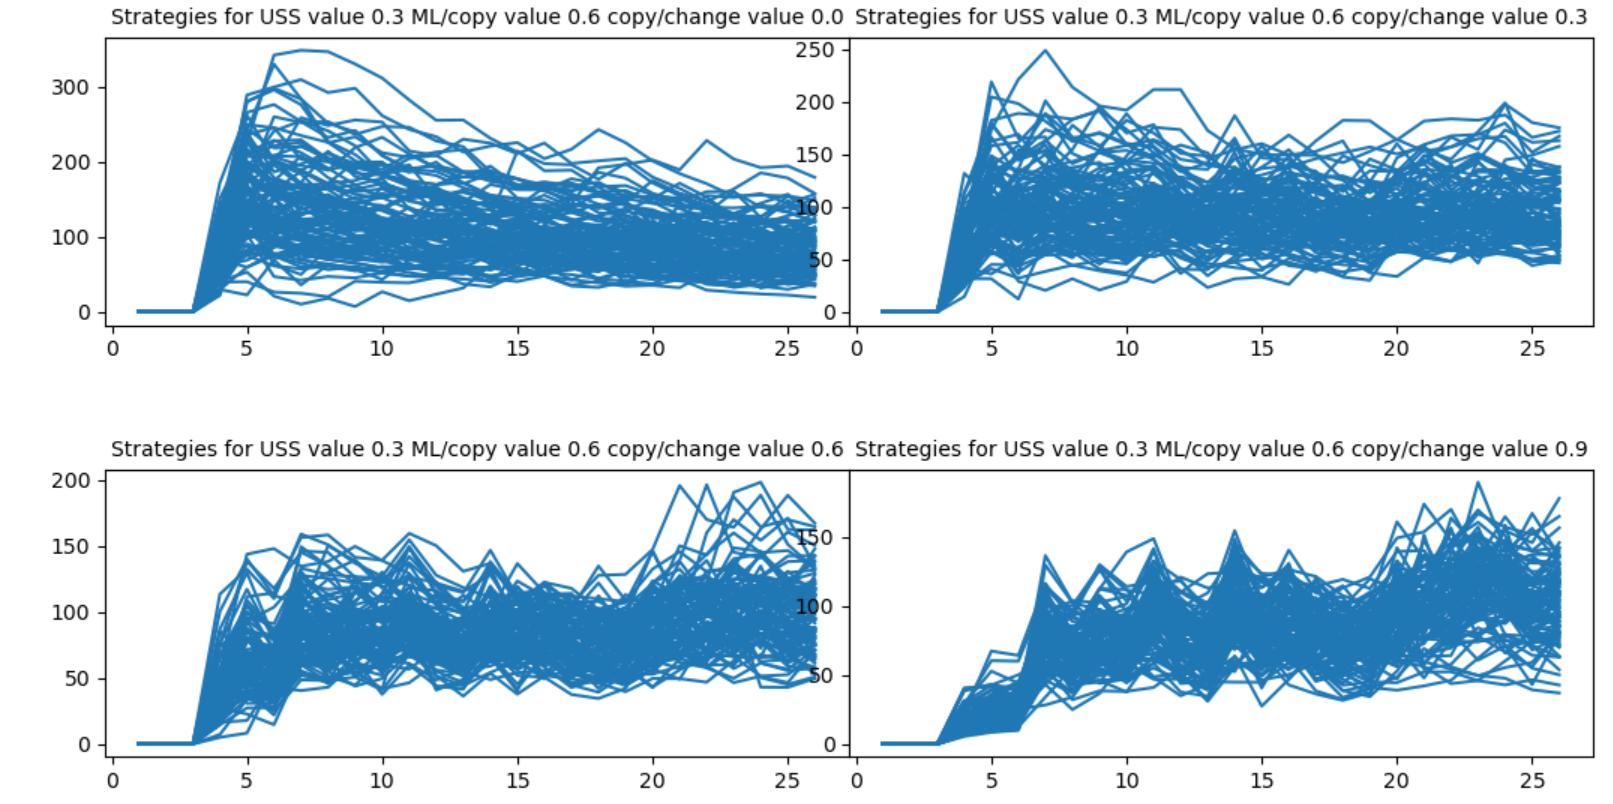 |
 |
| 0.3 | 0.9 | 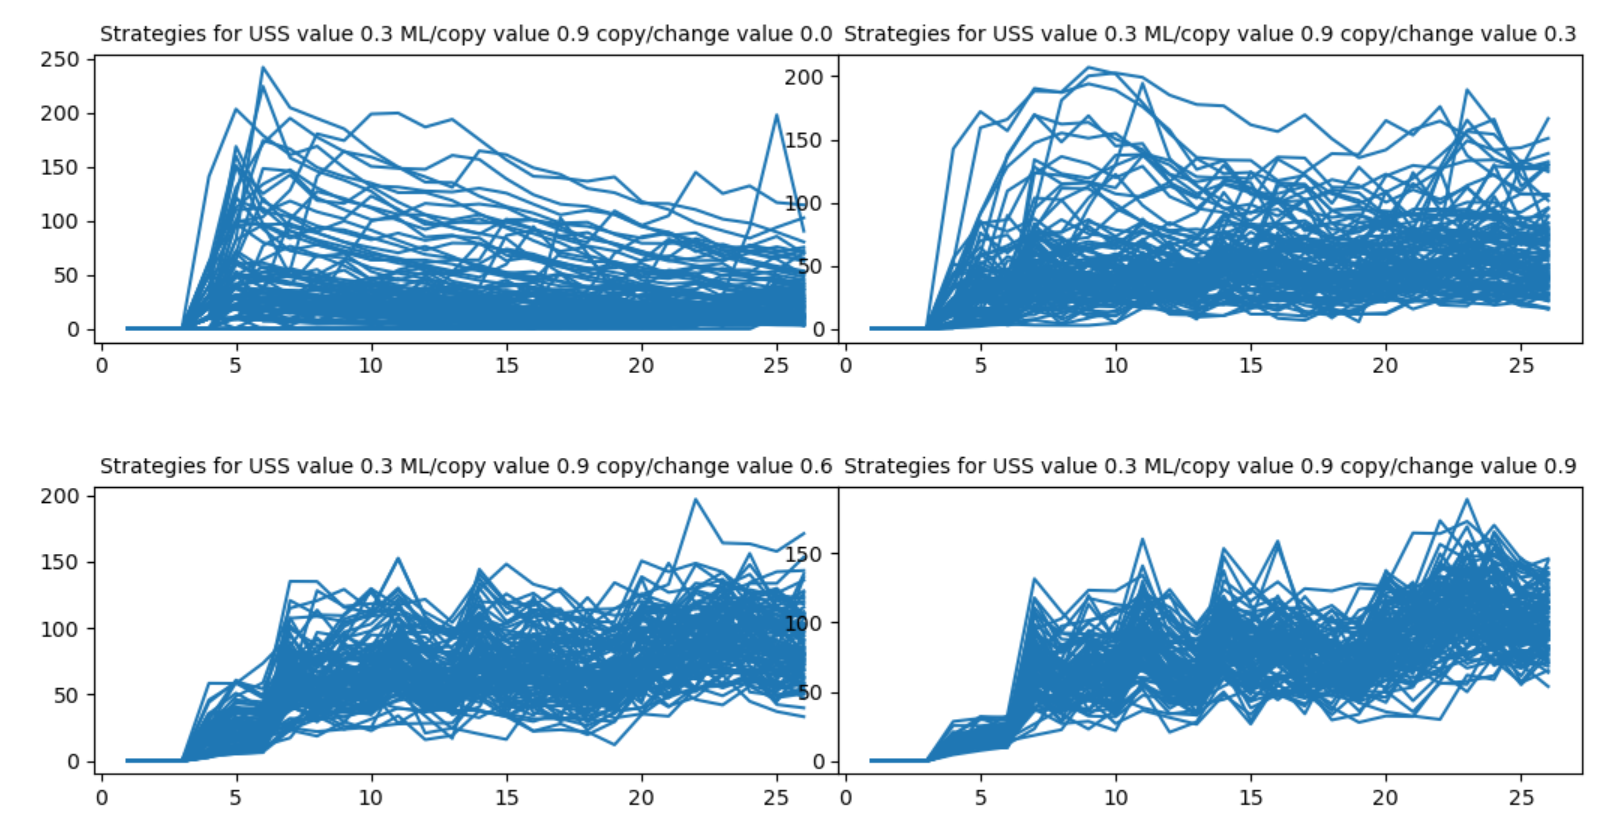 |
 |
| 0.6 | 0 | 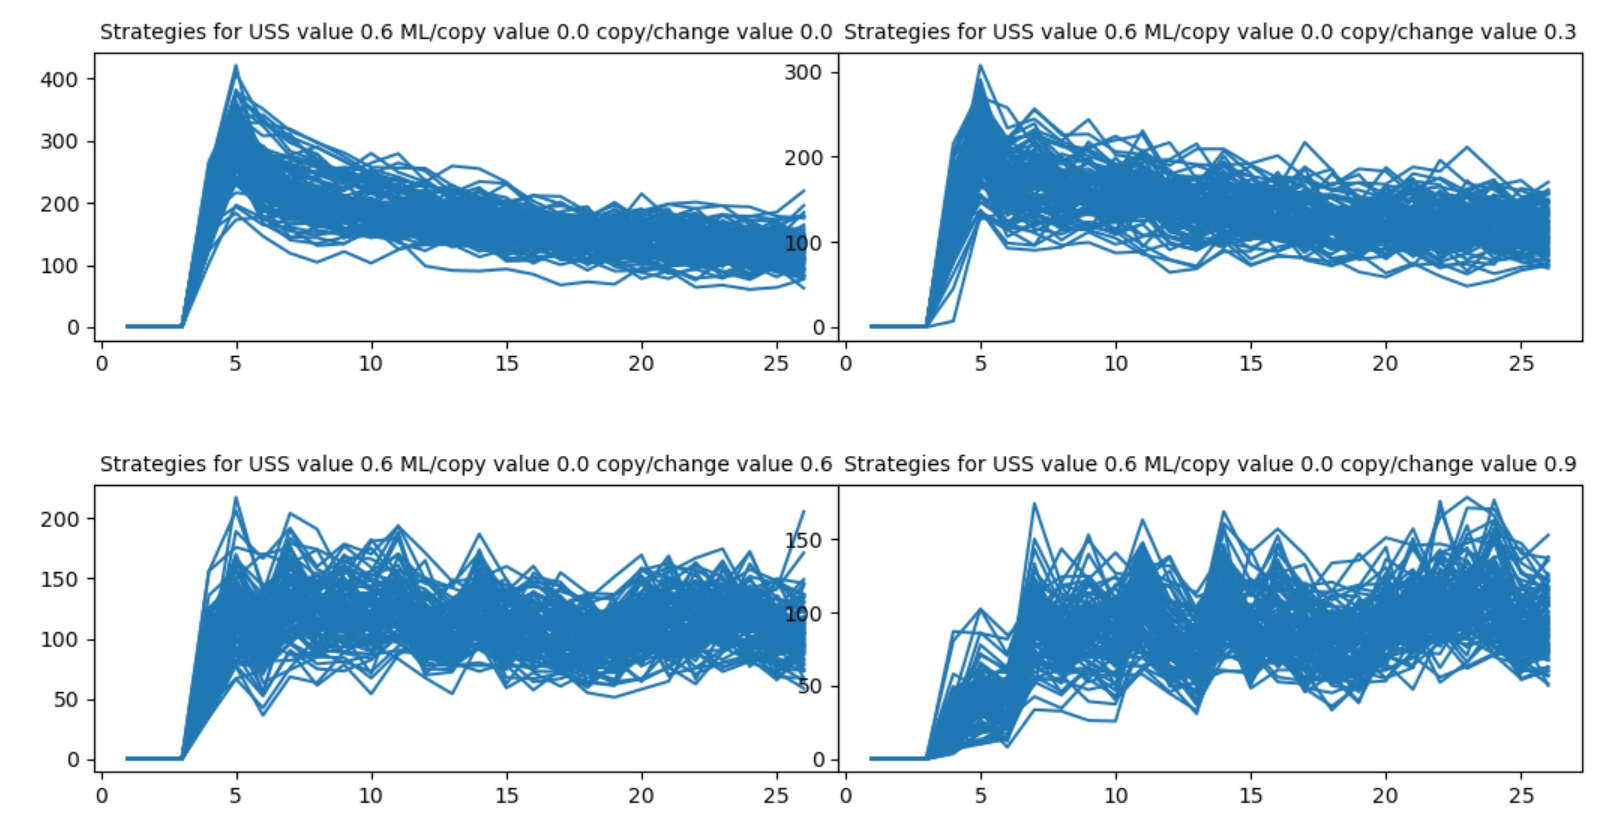 |
 |
| 0.6 | 0.3 | 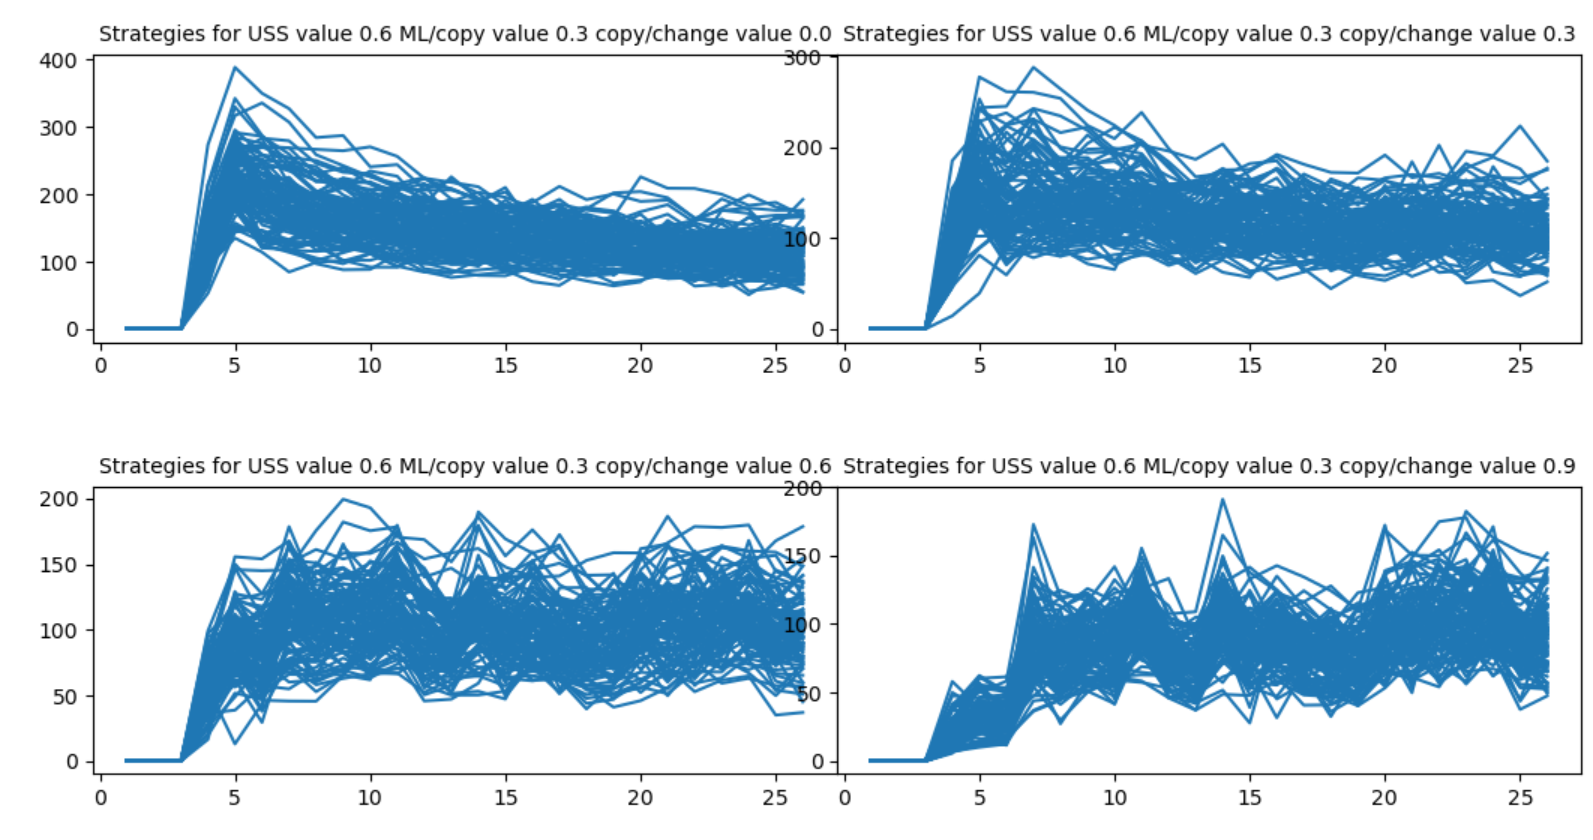 |
 |
| 0.6 | 0.6 |  |
 |
| 0.6 | 0.9 | 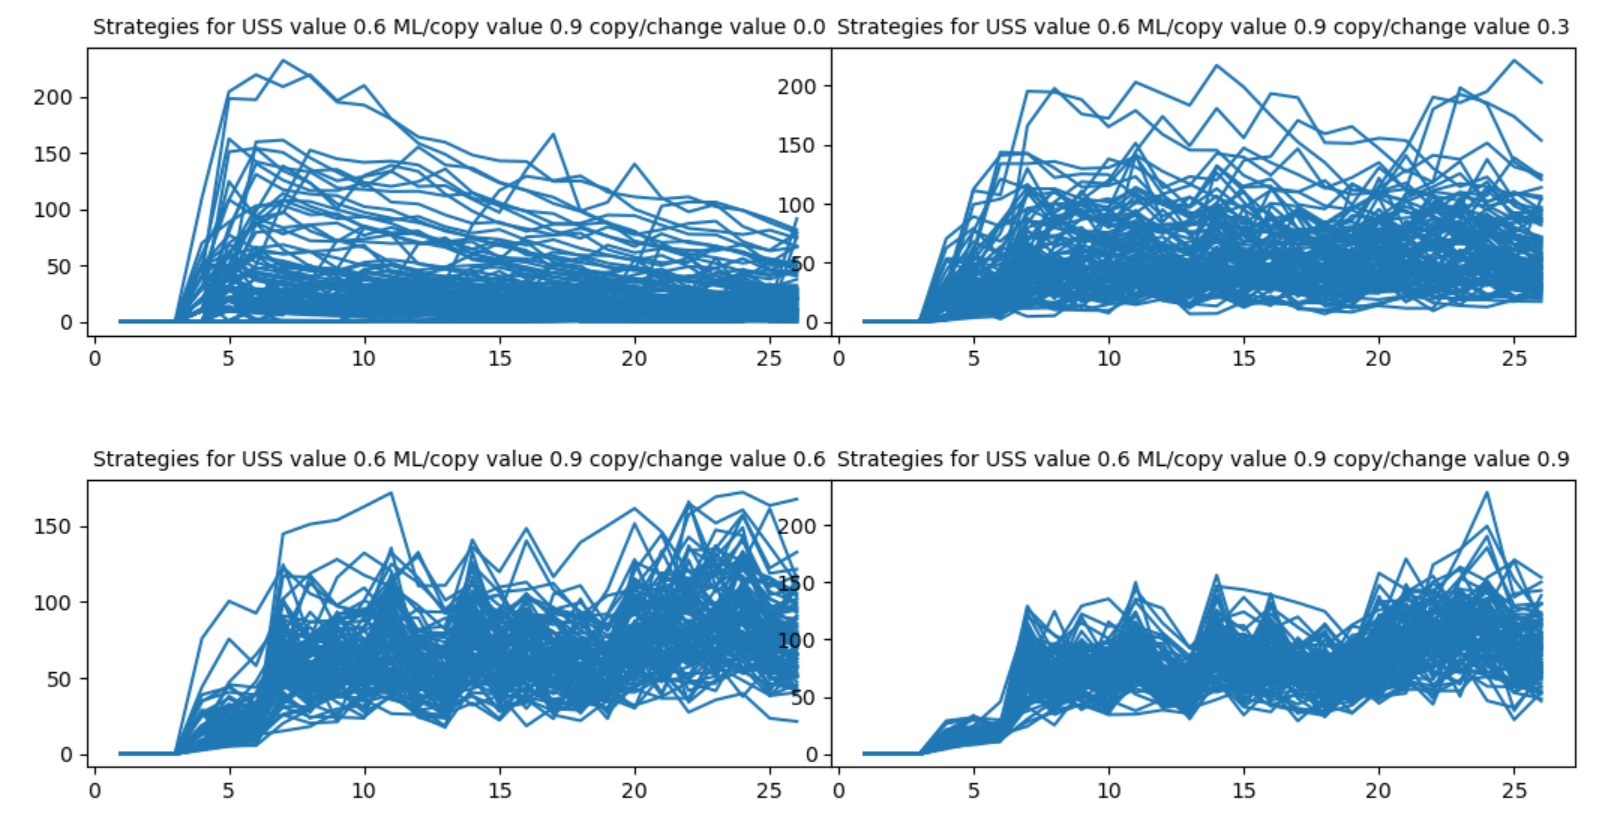 |
 |
| 0.9 | 0 |  |
 |
| 0.9 | 0.3 | 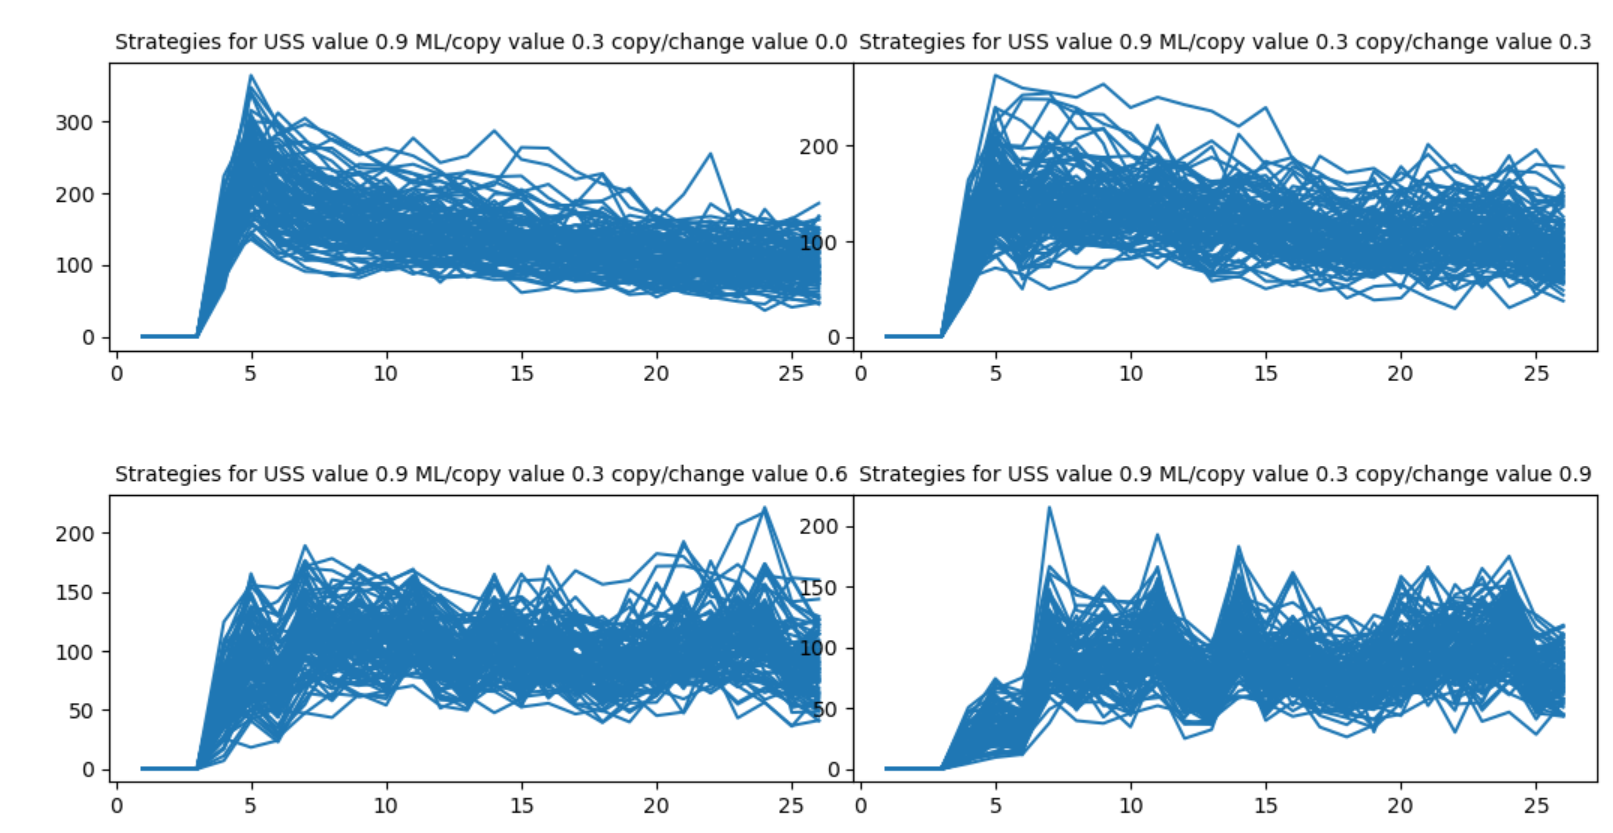 |
 |
| 0.9 | 0.6 | 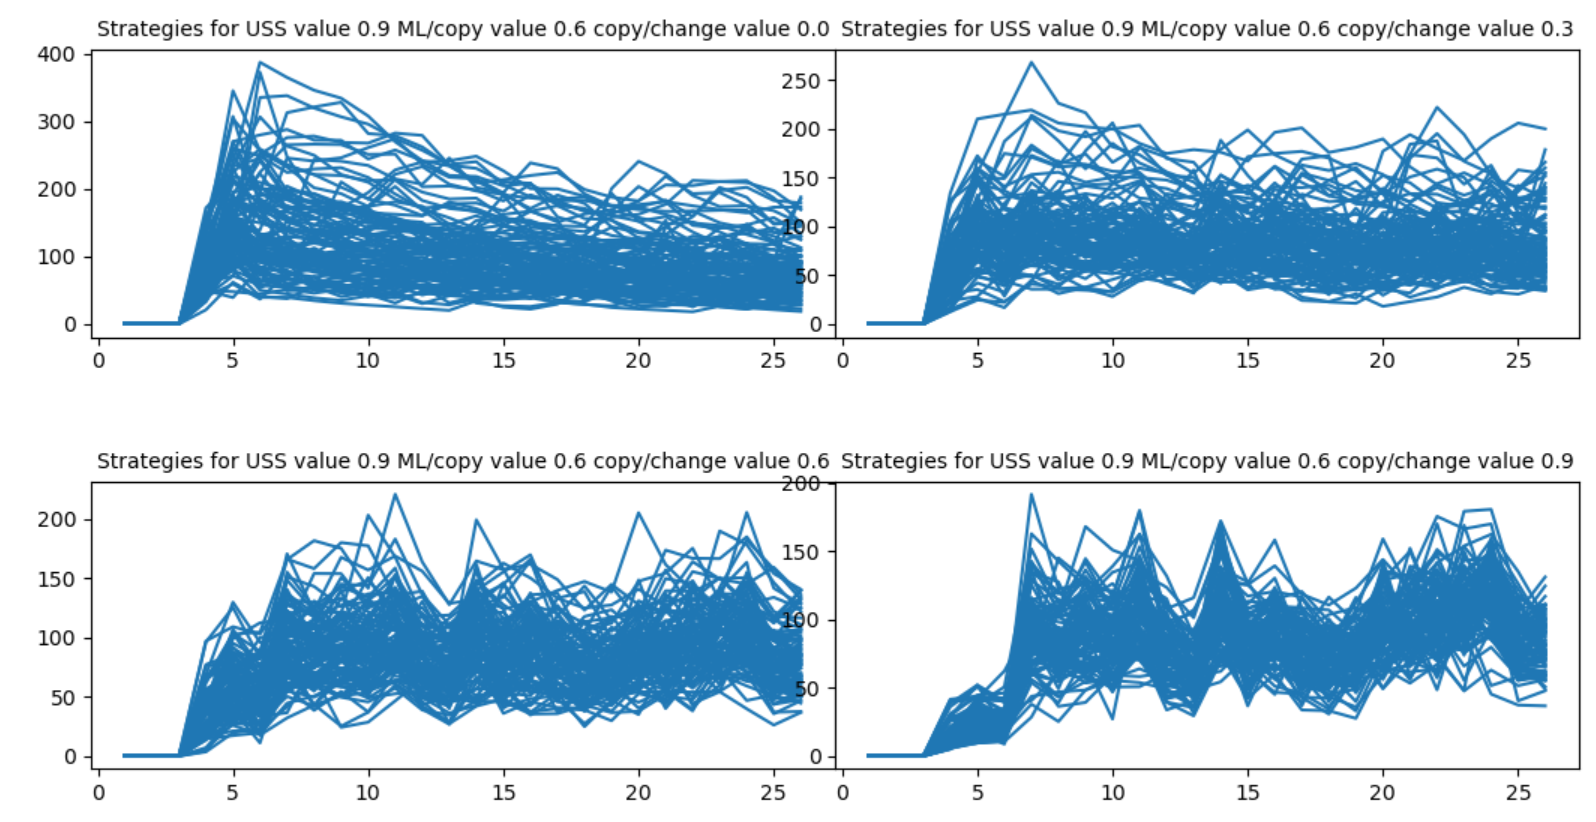 |
 |
| 0.9 | 0.9 | 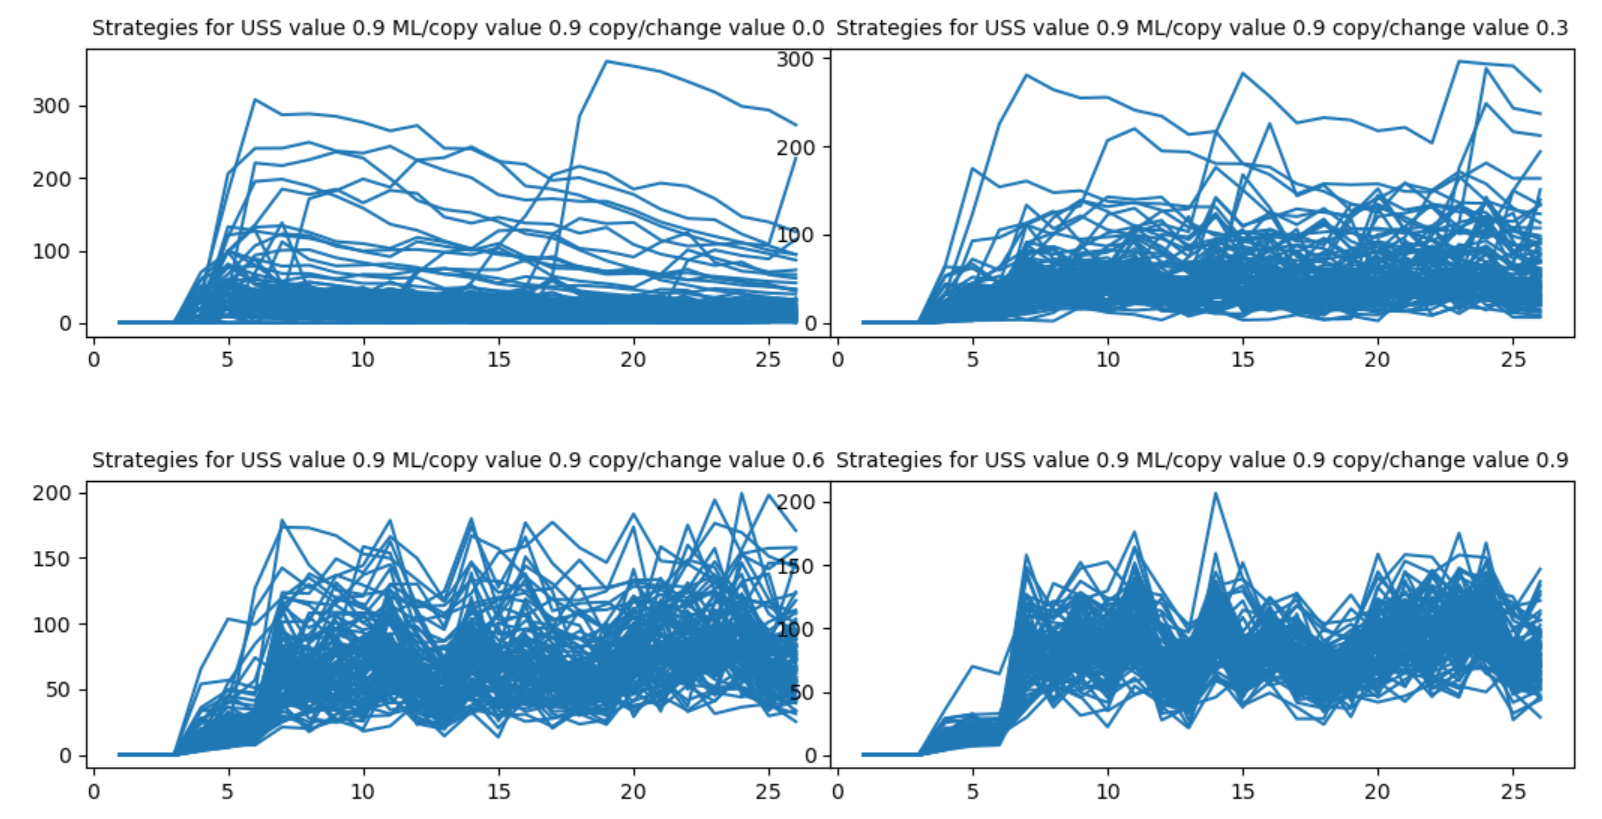 |
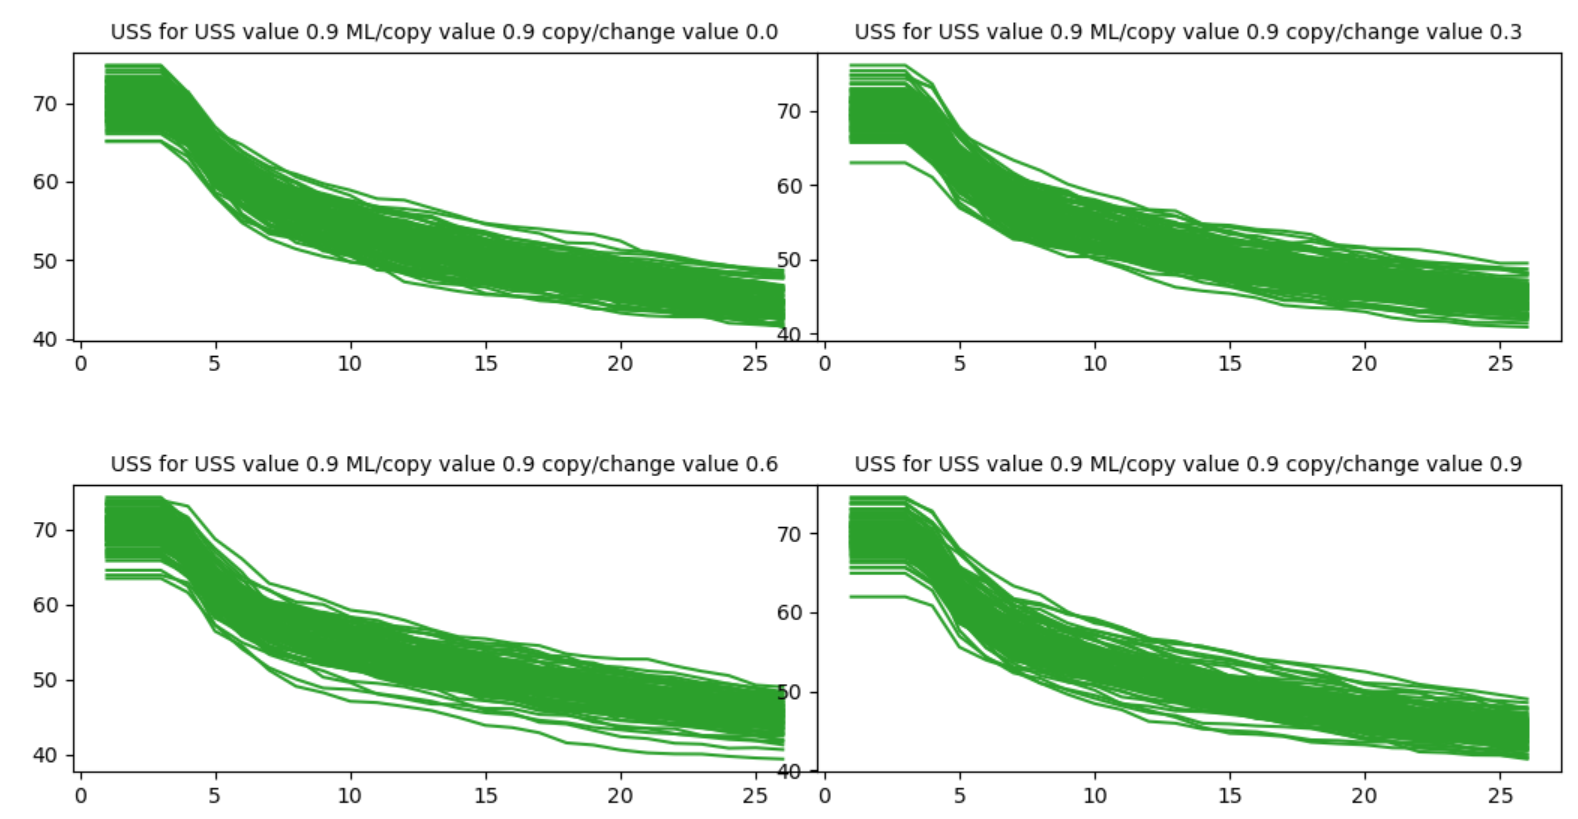 |
Although the main purpose of sensitivity analysis is to find the parameter ranges, which the model is sensitive to, it can bring more insights into searching the whole parameter domain and their effects on the relationship between accumulated value and shared strategy. The relationship between overall accumulated value and shared strategy over time is an emergent pattern from the model. Since value change and strategy change processes are completely independent in the model.
Following the first goal, the results show that the model is sensitive to ML Degree = 0.9. Since the fluctuations are always observable in this situation in comparison with other ML Degree in all combinations. In other words, the 100 runs do not converge only when ML Degree = 0.9.
Additionally, the model is sensitive to Innovation Degree = 0. Among the four diagrams for different ML Degree values, always a same pattern is observable. However, when Innovation Degree = 0, the same pattern is not observable. In other words, the model does not follow the same way and acts differently in this situation.
The case OSS Degree = 0 is not a real scenario, since the probability to produce a non-conservative country would then be zero. In that case, we are dealing with a simulated world where most of the countries are conservative or extremely conservative and almost none of the agents (countries) are willing to change their values. Therefore, we exclude this case from parameter setups.
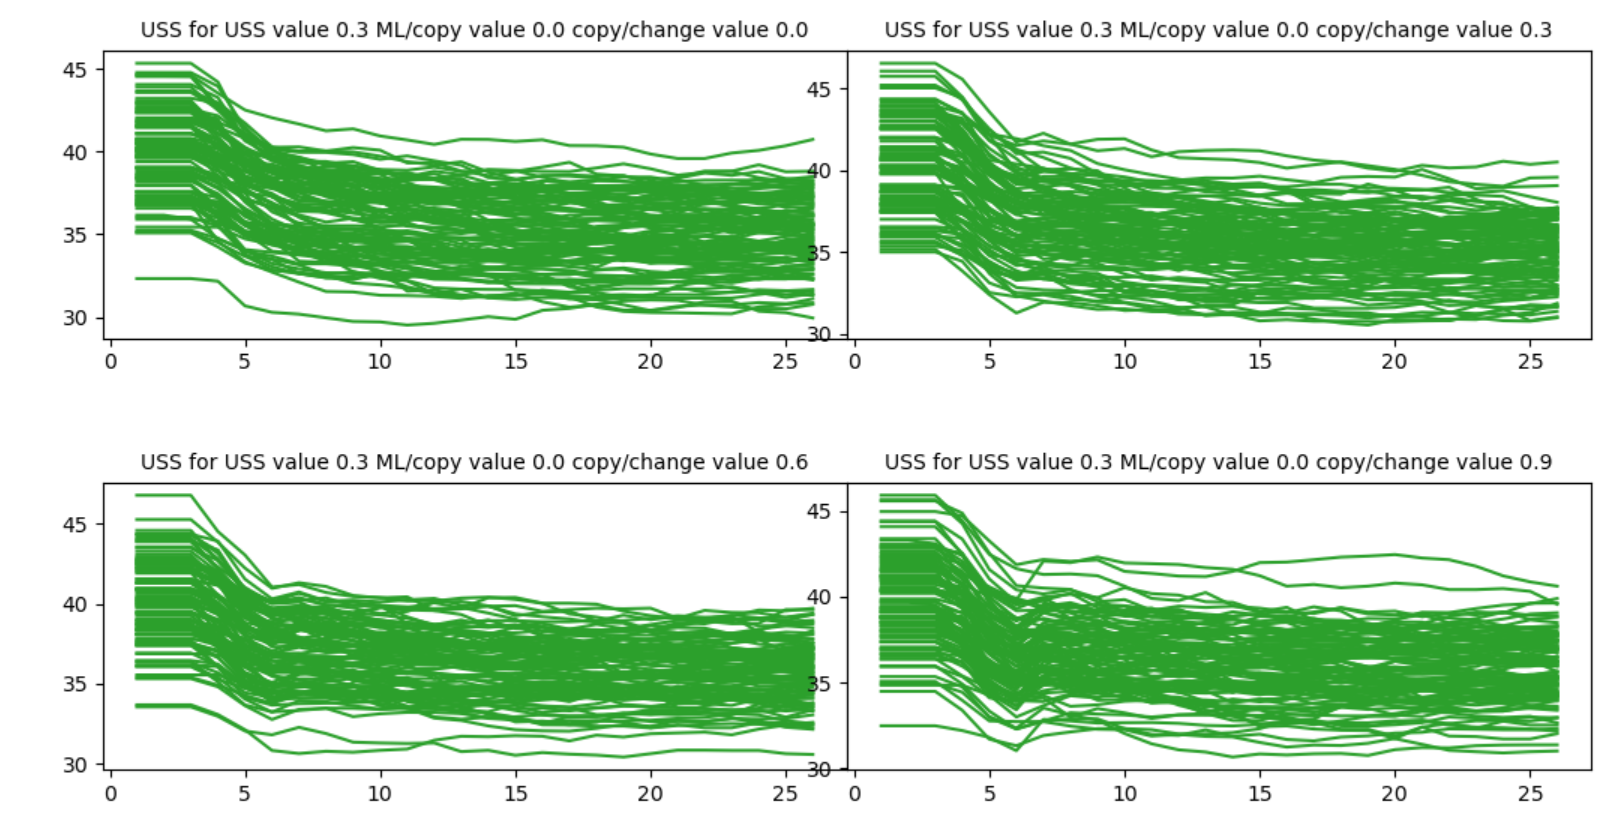
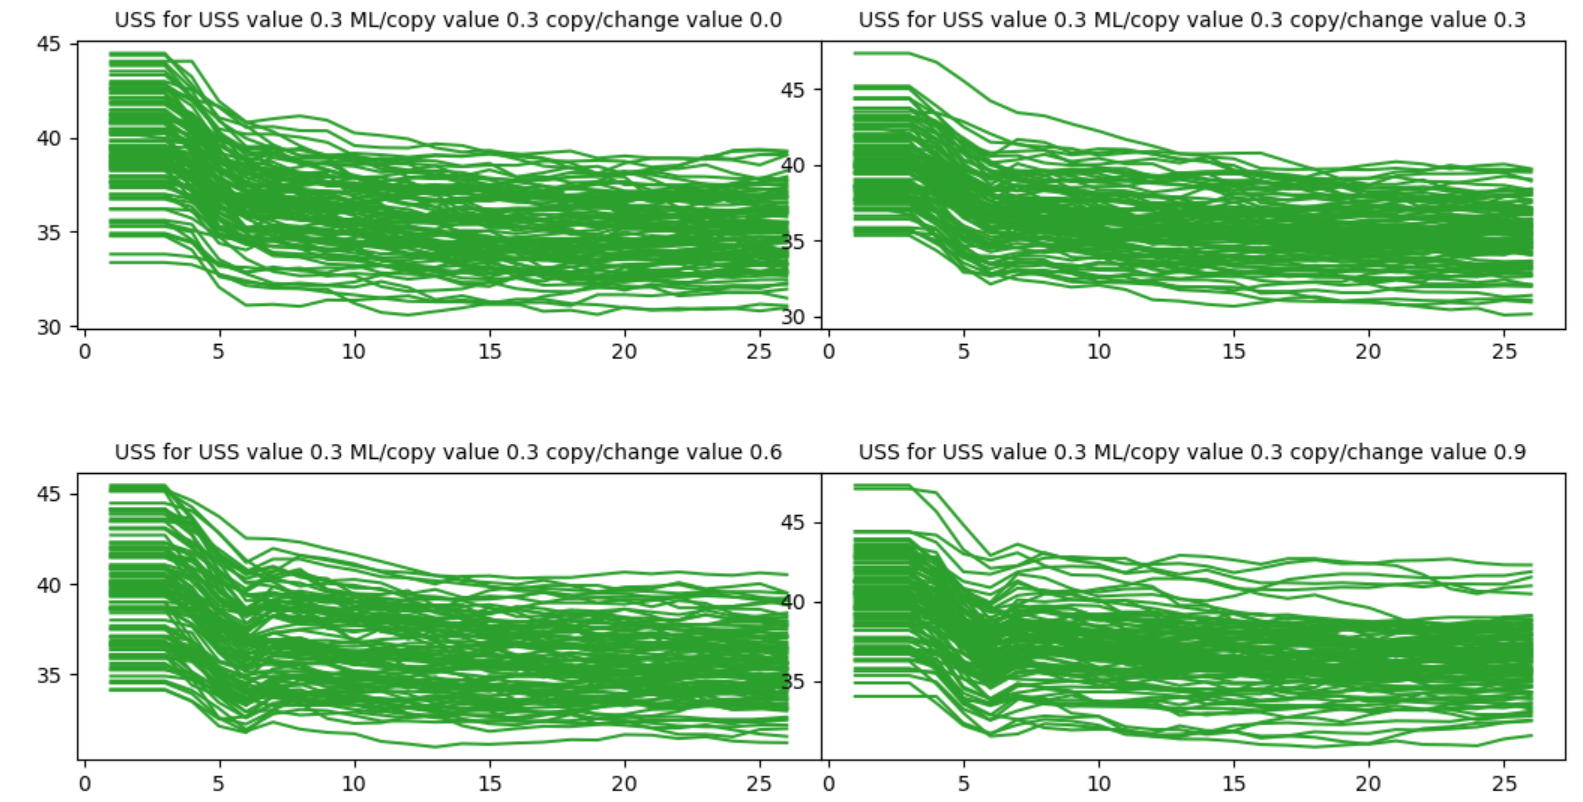
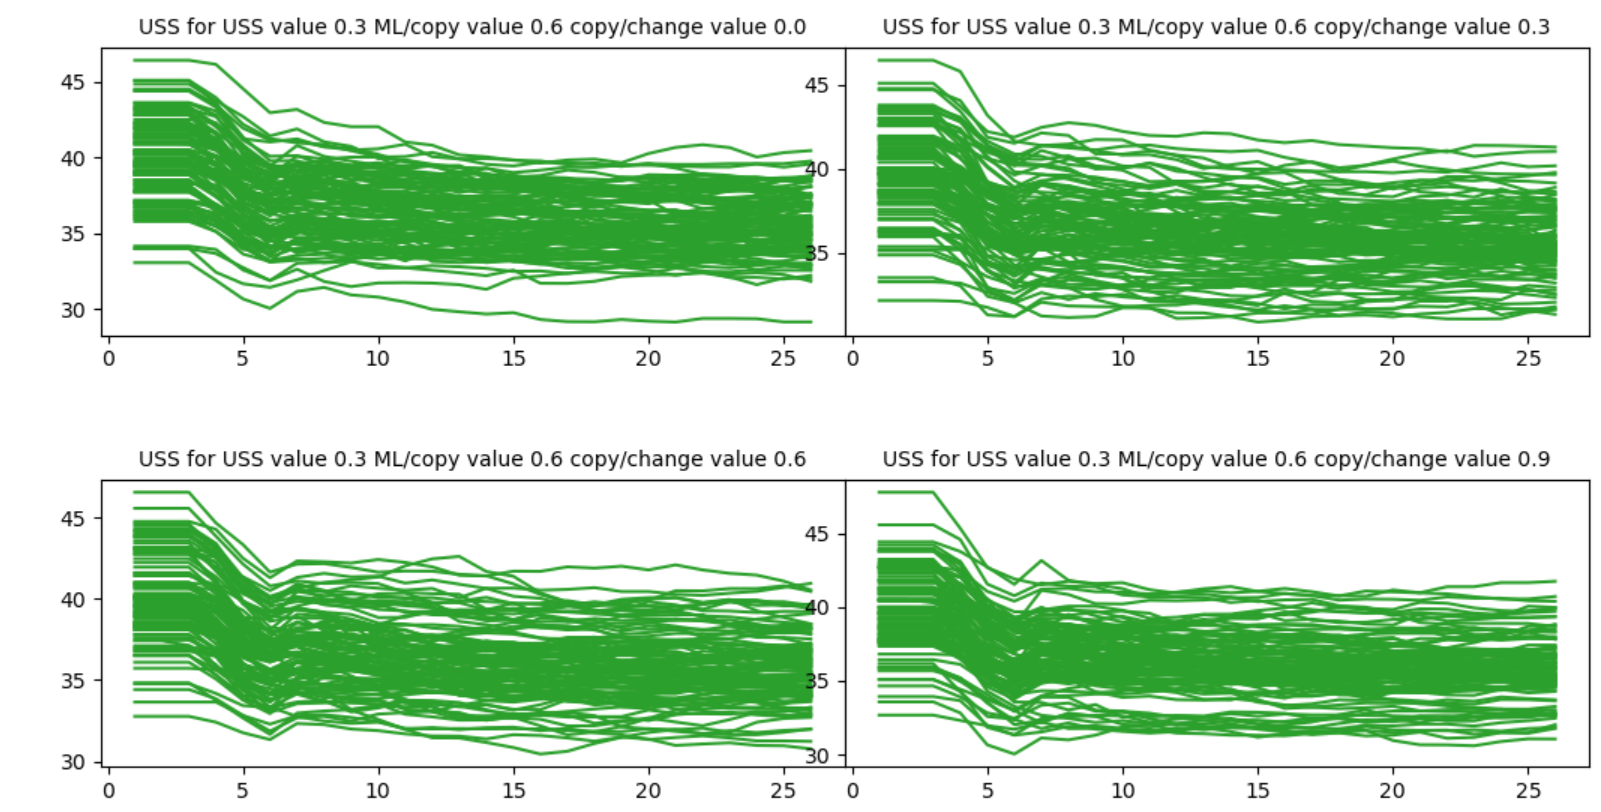
Following the second sensitivity analysis goal, the general inverse relationship between accumulated value and shared strategy is observable. Moreover, as we move to simulated worlds with higher initial degree of OSS, the ranges of strategy changes are higher. This shows that a world with more open countries is going to have stricter strategies. On the other hands, a simulated world with mostly conservative countries changes their strategy less.
Additionally, the sub-scenarios with higher initial OSS degrees have a wider range of accumulated OSS over time. The cause is that the agents (countries) with higher OSS are much more likely to change their values.
Moreover, we explore the effect of ML on the relationship between accumulated value and shared strategy. Based on the sensitivity analysis, we have three ML degrees: 0 (no intelligence), 0.3, and 0.6. In this cases, we do not discriminate sub-scenarios based on initial OSS degree. Therefore, the start points for original accumulated OSS are mostly near the average. With increase in the ML degree, the ranges of shared strategy changes are wider. It can be interpreted in this way: in reality, we may have more unexpected peaks of infected cases or other parameters, which cause countries to suddenly choose stricter strategies.
Finally, we explore the impact of Innovation degree on the output (i.e. relationship between accumulated value and shared strategy). Again, we have three different probabilities: 0.3, 0.6, and 0.9. With increase in the copying, the ranges of shared strategy changes are lower. When the level is higher, the probability to go for copying is higher. Therefore, when we have more countries, which copy other countries’ strategies (with similar initial values), the shared strategy will converge. Moreover, the ranges for strategy changes are less in these situations.
Notes
- https://data.humdata.org/dataset/acaps-covid19-government-measures-dataset↩︎
- https://data.europa.eu/euodp/en/data/dataset/covid-19coronavirusdata/resource/55e8f966-d5c8-438e-85bc-c7a5a26f4863↩︎
- In this article, we use the term “country” to refer to the government of a country↩︎
- https://data.humdata.org/dataset/acaps-covid19-government-measures-dataset↩︎
- https://data.humdata.org/dataset/acaps-covid19-government-measures-dataset↩︎
- https://freedomhouse.org/report/freedom-world↩︎
- https://databank.worldbank.org/"↩︎
- In the dataset that was used to train the ML, each of these interventions were further divided into different sub-interventions. An intervention would get the value of 1, if all these sub-interventions were implemented, and less otherwise.↩︎
References
ACAPS Covid-19. (2023). Government measures dataset. Available at: https://data.humdata.org/dataset/acaps-covid19-government-measures-dataset
AN, L. (2012). Modeling human decisions in coupled human and natural systems: Review of agent-based models. Ecological Modelling, 229, 25–36. [doi:10.1016/j.ecolmodel.2011.07.010]
ANAND, P., Ferrer, B., Gao, Q., Nogales, R., & Unterhalter, E. (2020). COVID-19 as a capability crisis: Using the capability framework to understand policy challenges. Journal of Human Development and Capabilities, 21(3), 293–299. [doi:10.1080/19452829.2020.1789079]
BELSHAW, C. S. (1959). The identification of values in anthropology. American Journal of Sociology, 64(6), 555–562. [doi:10.1086/222588]
BIANCHI, F., & Squazzoni, F. (2015). Agent-based models in sociology. Wiley Interdisciplinary Reviews: Computational Statistics, 7(4), 284–306. [doi:10.1002/wics.1356]
BOJANOWSKA, A., Kaczmarek, L. D., Koscielniak, M., & Urbańska, B. (2020). Changes in values and well-being amidst the COVID-19 pandemic in Poland. PLoS One, 16(9), e0255491. [doi:10.1371/journal.pone.0255491]
BONETTO, E., Dezecache, G., Nugier, A., Inigo, M., Mathias, J. D., Huet, S., Pellerin, N., Corman, M., Bertrand, P., Raufaste, E., Streith, M., Guimond, S., de la Sablonnière, R., & Dambrun, M. (2021). Basic human values during the COVID-19 outbreak, perceived threat and their relationships with compliance with movement restrictions and social distancing. PLoS One, 16(6), e0253430. [doi:10.1371/journal.pone.0253430]
BRIJAIN, M., Patel, R., Kushik, M., & Rana, K. (2014). A survey on decision tree algorithm for classification. Available at: https://www.ijedr.org/papers/IJEDR1401001.pdf
CIECIUCH, J., Schwartz, S. H., Davidov, E., & Wright, J. D. (2015). Values, social psychology of. In J. D. Wright (Ed.), International Encyclopedia of the Social & Behavioral Sciences (pp. 41–46). Amsterdam: Elsevier. [doi:10.1016/b978-0-08-097086-8.25098-8]
CRAWFORD, S. E. S., & Ostrom, E. (1995). A grammar of institutions. American Political Science Review, 89(3), 582–600. [doi:10.2307/2082975]
DAVIDOV, E. (2008). A cross-country and cross-time comparison of the human values measurements with the second round of the European Social Survey. Survey Research Methods, 2(1), 33–46.
DEHKORDI, M. A. E., Lechner, J., Ghorbani, A., Nikolic, I., Chappin, E., & Herder, P. (2023). Using machine learning for agent specifications in agent-Based models and simulations: A critical review and guidelines. Journal of Artificial Societies and Social Simulation, 26(1), 9. https://www.jasss.org/26/1/9.html
DIGNUM, F. (2021). Social Simulation for a Crisis. Cham: Springer International Publishing.
DOLFSMA, W., & Verburg, R. (2008). Structure, agency and the role of values in processes of institutional change. Journal of Economic Issues, 42(4), 1031–1054. [doi:10.1080/00213624.2008.11507201]
FARJAM, M., De Moor, T., van Weeren, R., Forsman, A., Dehkordi, M. A. E., Ghorbani, A., & Bravo, G. (2020). Shared patterns in long-term dynamics of commons as institutions for collective action. International Journal of the Commons, 14, 1. [doi:10.5334/ijc.959]
GHORBANI, A., Lorig, F., de Bruin, B., Davidsson, P., Dignum, F., Dignum, V., van der Hurk, M., Jensen, M., Kammler, C., Kreulen, K., Ludescher, L. G., Melchior, A., Mellema, R., & Pastrav, C. (2020). The ASSOCC Simulation Model: Aresponsetothe community call forthe COVID-19 pandemic. Review of Artificial Societies and Social Simulation. Available at: https://rofasss.org/2020/04/25/the-assocc-simulation-model/ [doi:10.1007/s11023-020-09527-6]
HAN, E., Tan, M. M. J., Turk, E., Sridhar, D., Leung, G. M., Shibuya, K., Asgari, N., Oh, J., García-Basteiro, A. L., Hanefeld, J., Cook, A. R., Hsu, L. Y., Teo, Y. Y., Heymann, D., Clark, H., McKee, M., & Legido-Quigley, H. (2020). Lessons learnt from easing COVID-19 restrictions: An analysis of countries and regions in Asia Pacific and Europe. The Lancet, 396(10261), 1525–1534. [doi:10.1016/s0140-6736(20)32007-9]
HIROSE, I., & Olson, J. (2015). The Oxford Handbook of Value Theory. Oxford: Oxford University Press.
HULL, C. (2020). Impartiality is essential in coronavirus response. The Canberra Times. Retrieved from: https://www.canberratimes.com.au/story/6664164/impartiality-is-essential-in-coronavirus-response/
INGLEHART, R., & Lampert, M. (2021). COVID-19 crisis boosts progressive values amidst growing pessimism - International panel study. World Values Survey Presentations. Available at: https://www.worldvaluessurvey.org/WVSPublicationsDocuments.jsp?PUB=186&PUB=186
JADHAV, S. D., & Channe, H. P. (2016). Comparative study of K-NN, naive Bayes and decision tree classification techniques. International Journal of Science and Research (IJSR), 5(1), 1842–1845.
KAVAK, H., Padilla, J. J., Lynch, C. J., & Diallo, S. Y. (2018). Big data, agents, and machine learning: Towards a data-driven agent-based modeling approach. Proceedings of the Annual Simulation Symposium, 12
KREULEN, K., de Bruin, B., Ghorbani, A., Mellema, R., Kammler, C., Vanhee, L., Dignum, F., & Dignum, V. (2022). How culture influences individual behavior during a pandemic: A social simulation of the COVID-19 crisis. Journal of Artificial Societies and Social Simulation, 25(3), 6. https://www.jasss.org/25/3/6.html
LAMPERT, M., Inglehart, R., Metaal, S., Schoemaker, H., & Papadongonas, P. (2021). Two faces of Covid-19 impact: The pandemic ignites fear, but boosts progressive ideals and calls for inclusive economic growth. Measuring the pandemic’s impact on social values, emotions and priorities in 24 countries. Available at: https://glocalities.com/latest/reports/valuestrends
LEE, J. S., Filatova, T., Ligmann-Zielinska, A., Hassani-Mahmooei, B., Stonedahl, F., Lorscheid, I., Voinov, A., Polhill, G., Sun, Z., & Parker, D. C. (2015). The complexities of agent-based modeling output analysis. Journal of Artificial Societies and Social Simulation, 18(4), 4. https://jasss.soc.surrey.ac.uk/18/4/4.html [doi:10.18564/jasss.2897]
LEMPERT, R. J., Popper, S. W., & Bankes, S. C. (2003). Shaping the next one hundred years: New methods for quantitative, long-term policy analysis. Report prepared for the RAND Pardee Centre, Santa Monica RAND. http://www.rand.org/pubs/monograph [doi:10.7249/mr1626]
MACAL, C., & North, M. (2010). Tutorial on agent-based modelling and simulation. Journal of Simulation, 4(3), 151–162. [doi:10.1057/jos.2010.3]
MERCUUR, R., Dignum, V., & Jonker, C. (2019). The value of values and norms in social simulation. Journal of Artificial Societies and Social Simulation, 22(1), 9. https://jasss.soc.surrey.ac.uk/22/1/9.html [doi:10.18564/jasss.3929]
MURPHY, K. P. (2012). Machine Learning: A Probabilistic Perspective. Cambridge, MA: MIT Press.
NORTH, D. (1991). Institutions. Journal of Economic Perspectives, 5(1), 97–112.
NORTH, D. C. (1996). Institutional change: A framework of analysis. In D. C. North (Ed.), Social Rules (pp. 35–46). London: Routledge.
NUSSBAUMER-STREIT, B., Mayr, V., Dobrescu, A. I., Chapman, A., Persad, E., Klerings, I., Wagner, G., Siebert, U., Christof, C., Zachariah, C., & Gartlehner, G. (2020). Quarantine alone or in combination with other public health measures to control COVID-19: A rapid review. Cochrane Database of Systematic Reviews, (9) [doi:10.1002/14651858.cd013574]
OLKIN, G. C. S. F. I. (2002). Springer Texts in Statistics. Berlin Heidelberg: Springer.
OSTROM, E. (1990). The evolution of institutions for collective action. Edición En Español: Fondo de Cultura Económica, México
RAND, W., & Rust, R. T. (2011). Agent-based modeling in marketing: Guidelines for rigor. International Journal of Research in Marketing, 28(3), 181–193. [doi:10.1016/j.ijresmar.2011.04.002]
REESKENS, T., Muis, Q., Sieben, I., Vandecasteele, L., Luijkx, R., & Halman, L. (2021). Stability or change of public opinion and values during the coronavirus crisis? Exploring Dutch longitudinal panel data. European Societies, 23, 153–171. [doi:10.1080/14616696.2020.1821075]
ROKEACH, M. (1973). The Nature of Human Values. New York, NY: Free Press.
SAGIV, L., Roccas, S., Cieciuch, J., & Schwartz, S. H. (2017). Personal values in human life. Nature Human Behaviour, 1(9), 630–639. [doi:10.1038/s41562-017-0185-3]
SAMUEL, A. L. (1959). Some studies in machine learning using the game of checkers. IBM Journal of Research and Development, 3(3), 210–229. [doi:10.1147/rd.33.0210]
SATTENSPIEL, L., Dimka, J., & Orbann, C. (2019). Using cultural, historical, and epidemiological data to inform, calibrate, and verify model structures in agent-based simulations. Mathematical Biosciences and Engineering, 16(4), 3071–3093. [doi:10.3934/mbe.2019152]
SCHWARTZ, S. H. (1992). Universals in the content and structure of values: Theoretical advances and empirical tests in 20 countries. Advances in Experimental Social Psychology, 25, 1–65. [doi:10.1016/s0065-2601(08)60281-6]
SCHWARTZ, S. H. (2003). A proposal for measuring value orientations across nations. Questionnaire Package of the European Social Survey, 259(290), 261.
SCHWARTZ, S. H. (2008). Cultural Value Orientations: Nature and Implications of National Differences. Moscow: State University - Higher School of Economics Press.
SCHWARTZ, S. H., Lehmann, A., & Roccas, S. (1999). Multimethod probes of basic human values. Social Psychology and Culture Context: Essays in Honor of Harry C. Triandis, 107-123 [doi:10.4135/9781452220550.n8]
SEN, A. (1993). Capability and well-being. The Quality of Life, 30, 270–293.
SORTHEIX, F. M., Parker, P. D., Lechner, C. M., & Schwartz, S. H. (2019). Changes in young Europeans’ values during the global financial crisis. Social Psychological and Personality Science, 10(1), 15–25. [doi:10.1177/1948550617732610]
STEINERT, S. (2021). Corona and value change. The role of social media and emotional contagion. Ethics and Information Technology, 23(1), 59–68. [doi:10.1007/s10676-020-09545-z]
TEN Broeke, G., van Voorn, G., & LigTENberg, A. (2016). Which sensitivity analysis method should I use for my agent-based model? Journal of Artificial Societies and Social Simulation, 19(1), 5. https://jasss.soc.surrey.ac.uk/19/1/5.html [doi:10.18564/jasss.2857]
VAN de Poel, I., de Wildt, T., & VAN Kooten Pássaro, D. (2022). COVID-19 and changing values. In M. J. Dennis, G. Ishmaev, S. Umbrello, & J. VAN den Hoven (Eds.), Values for a Post-Pandemic Future (pp. 23–58). Cham: Springer International Publishing. [doi:10.1007/978-3-031-08424-9_2]
WHO. (2020). How COVID-19 is changing the world: A statistical perspective. Available at: https://unstats.un.org/unsd/ccsa/documents/covid19-report-ccsa.pdf
WU, X., Kumar, V., Quinlan, J. R., Ghosh, J., Yang, Q., Motoda, H., McLachlan, G. J., Ng, A., Liu, B., Yu, P. S., Zhou, Z. H., Steinbach, M., Hand, D. J., & Steinberg, D. (2008). Top 10 algorithms in data mining. Knowledge and Information Systems, 14(1), 1–37. [doi:10.1007/s10115-007-0114-2]