An Agent-Based Model of the 2020 International Policy Diffusion in Response to the COVID-19 Pandemic with Particle Filter

,
and
aUniversity of Lausanne, Switzerland; bUniversity of Leeds, United Kingdom
Journal of Artificial
Societies and Social Simulation 27 (2) 3![]()
<https://www.jasss.org/27/2/3.html>
DOI: 10.18564/jasss.5342
Received: 27-Jan-2023 Accepted: 29-Jan-2024 Published: 31-Mar-2024
Abstract
Global problems, such as pandemics and climate change, require rapid international coordination and diffusion of policy. These phenomena are rare however, with one notable example being the international policy response to the COVID-19 pandemic in early 2020. Here we build an agent-based model of this rapid policy diffusion, where countries constitute the agents and with the principal mechanism for diffusion being peer mimicry. Since it is challenging to predict accurately the policy diffusion curve, we utilize data assimilation, that is an “on-line” feed of data to constrain the model against observations. The specific data assimilation algorithm we apply is a particle filter because of its convenient implementation, its ability to handle categorical variables and because the model is not overly computationally expensive, hence a more efficient algorithm is not required. We find that the model alone is able to predict the policy diffusion relatively well with an ensemble of at least 100 simulation runs. The particle filter however improves the fit to the data, reliably so from 500 runs upwards, and increasing filtering frequency results in improved prediction.Introduction
Several global challenges hinge on an international coordination of policy. Climate change requires a global fossil fuel phase out (Shukla et al. 2022). Prevention of the next pandemic requires a cohesive bio-security strategy as well as minimum interference with ecosystems (Morse et al. 2012). International security requires negotiation and a willingness to resolve conflict by peaceful means instead of resorting to violence (Bercovitch & Jackson 2009). Moreover, many of these challenges are immensely time pressing. With respect to climate change, for instance, only few years remain to achieve international climate targets.
There has been one recent, yet already historic, instance of international policy coordination that was surprisingly rapid, decisive and homogeneous - the implementation of lockdowns as a response to the COVID-19 pandemic. There was an initial period of action delay, and in some cases even denial of the crisis, from roughly December 2019 to February 2020, but in March 2020 nearly every country in the world implemented stringent lockdowns, including closures of public venues and schools, mask wearing duties and mandatory home office. On the first of March 2020 only around 8 % of countries had implemented such stringent measures, by the end of March 2020 more than 90% had implemented school closures and cancellation of all public events (with several more policies such as workplace closures etc. at intermediate degree) (Ritchie et al. 2020).
The pandemic has been scientifically scrutinized from many disciplinary viewpoints and data collection expanded almost universally across fields related to the pandemic. International and freely accessible virus case trackers emerged as well as most capable national governments swiftly implemented regional and sub-regional case tracking. Moreover, prompted by the drastic and widely perceived shift in the political landscape, various policy response trackers originated, some focusing only on the stringency of direct virus control mechanisms, others also on the wider fiscal policy landscape as well as state-control mechanisms monitoring political variables such as democratic freedom (Daly et al. 2020). There are large amounts of research into the biology of the virus and the epidemiology of COVID-19 and from a social scientific viewpoint, there is plenty of research on the economic effects of pandemic policies (Chetty et al. 2020).
The political science of the lockdown policies has comparatively received less attention and the rapid tipping point in March has been debated little from computational and simulation-oriented viewpoints. There is some quantitative work on the drivers of lockdown policies. To name one notable study, Sebhatu et al. (2020) emphasized the remarkable degree of homogeneity in lockdown adoption by largely heterogeneous countries in a short amount of time. They operationalized the degree of lockdown employing five metrics, namely “information campaigns”, “school closures”, “workplace closures”, “cancellation of public events” and “restrictions on internal mobility”. They found that there are some country specific drivers, such as the population density and the degree of authoritarianism, that fostered the early adoption of lockdown policies. Democracies were generally slower to adopt stringent lockdowns. Their main result is that none of these drivers, nor the actual COVID case numbers in a nation are sufficient explanations for the rapid lockdown adoption in March 2020. Instead, they conclude that this diffusion of policy resembles peer-adoption processes in which countries mimicked other countries to cope with the threat and uncertainty posed by the pandemic. Democracies stand out again because, while slow to come up with their own lockdown initiative, they exhibited higher sensitivity to adoption through mimicking peers.
This insight suggests an agent-based modelling (ABM) approach to further elucidate the diffusion mechanisms and perhaps generalize them. Innovation and cultural norm diffusion models are a widespread application of ABMs and continue to be a very active field of ABM research (Kiesling et al. 2012). These models usually employ some kind of social network structure on which the diffusion happens and achieve respectable approximations to real-world diffusion processes (Bohlmann et al. 2010; Xiao & Han 2016). Diffusion-oriented ABMs also have been extensively applied to the spread of the COVID-19 virus itself and the effect of policy interventions on the spread (Cuevas 2020; Kai et al. 2020; Kerr et al. 2021; Lorig et al. 2021).
Despite this volume of existing research, there have been no agent-based studies of the international processes that underlie the formation of lockdown policies, which is a notable gap in the literature. Two reasons for this might be that: (i) modelling the complex social networks and dynamics within diverse governmental institutions that ultimately lead to the adoption of lockdown policies would be extremely ambitious at an international scale; and (ii) there are little to no data available that could reveal how governmental decision making is actually processed. However, since, according to the literature, one of the most important drivers of lockdown policy adoption is peer mimicry, a model of international lockdown policy may not need to consider the vast complexity and variety of national decision-making structures. Hence, we contribute to the literature on lockdown policy diffusion by developing the first agent-based model of the adoption of lockdown policies, with agents representing countries. A significant advantage an ABM has over previous econometric approaches is to emphasize the role of country-interaction and the ability to study whether this interaction is a sufficient mechanism for the emergence of diffusion. We focus on March 2020 and initialize the model based on real-world data from 1\(^{st}\) March, using a measure of school closures as a reasonable proxy for overall lockdowns as elaborated on in Section 3.2. The aims of our work are to (i) better understand the influence of peer mimicry on national lockdown adoption and (ii) build a model that could be used in the future to predict short-term national policy changes before they occur.
With respect to the second aim, an additional challenge is how to capture the rapidity with which countries adopted lockdown-related policies. There was a tipping point over two weeks in March 2020 when the number of countries adopting the most extreme policies went from around 20 to more than 160 (discussed in detail in Section 3.2). It is highly unlikely that any model will be sufficiently accurate to capture the precise days when countries changed their policies. But due to the rapidity at which countries adopted lockdowns, even small model prediction errors will lead to the simulated tipping point occurring too early, or too late, and subsequently very poor model performance. Hence, we employ a novel methodological feature with respect to ABMs to try to align the model with the evolution of the real system; that of data-assimilation (DA). This means we constrain the model by regularly updated observations covering the state of the real-world, thereby improving the accuracy of future model predictions. In our case, these new observations include whether a country has adopted a lockdown or not. The DA approach we choose is a particle filter since it is well-suited for highly non-linear systems and is able to cope with categorical variables; a feature our model relies on. Moreover it has been applied to a few ABMs already, although they were mostly simulating pedestrian dynamics (Malleson et al. 2020; Ternes et al. 2022; Wang & Hu 2015). Data-assimilation with a diffusion-oriented ABM let alone a policy focus is a novel application. Our goal here is to test this new application, highlight advantages and point to challenges. We find that the particle filter generally improves the prediction, through reducing the mean-squared error (MSE) of predictions with the real-world data as a reference, and also increases the reliability of the forecast by reducing the variance of estimates.
The remainder of the paper is structured as follows: We review the relevant literature, then introduce the model, outline methods and data applied, show experimental results and discuss the findings.
Background
Policy diffusion across nations
Our model is essentially one of policy diffusion across nations – a major research topic in political science. International policy diffusion is a complex field and the exact mechanisms for diffusion are debated and also vary from policy issue to policy issue. Mechanisms in consideration include ideological similarity between countries, strategic and economic competition, learning and coercion (Baybeck et al. 2011; Dobbin et al. 2007; Gilardi 2016). Generically, international policy diffusion may be defined as “...when government policy decisions in a given country are systematically conditioned by prior policy choices made in other countries...” (Simmons et al. 2006). Given this definition, the Covid-lockdown adoption across the world arguably constitutes such a phenomenon. A substantial amount of research has also considered sub-national policy diffusion, prominently across states in the United States (Shipan & Volden 2008) but recently for instance also across provinces in China (Zhang & Zhu 2019). Themes that have been investigated under the umbrella of policy diffusion include environmental policies and technologies (Zimm 2021), social security reform (Brooks 2004), health policies (Gautier et al. 2021), mental health policies (Shen 2014), the spread of democracy (O’Loughlin et al. 1998), economic policies and economic liberalization (Simmons & Elkins 2004) and more.
Policy diffusion may unfold over widely varying timescales, yet most of the time it has occurred slowly on the order of decades or even centuries. For example the world took 150 years to go from 5% of countries being democratic to 60% being democratic (Herre & Roser 2013). Admittedly, the transition to democracy is not a single policy but rather a deep and fundamental change in a country’s political fabric, but even single normative and legal reforms can take decades to diffuse. For example, Tews et al. (2003) show that soil, air and water protection laws all took four to five decades to diffuse across OECD-countries as well as Central and Eastern European countries.
Importantly for our purposes, some policy diffusion research has specifically focused on the COVID-19 emergency in early 2020 and the observed rapid policy diffusion. Lundgren et al. (2020) for example have investigated the diffusion of “state of emergency (SOE) declarations”. They show that the declarations in early 2020 follow a typical diffusion curve but maxed out at roughly 50% of all countries world-wide. They also ascertain the drivers of SOE declarations. According to their results regional clustering occurs. Countries opted for SOE, if neighboring countries did as well and the probability to adopt SOE depends on the degree of democracy and pandemic preparedness - supporting our model’s focus on peer mimicry.
As aforementioned, Sebhatu et al. (2020) found that there are some internal drivers of lockdown policies (e.g., population density and level of democracy) but none of those alone suffices to explain the archetypal diffusion curve observed in March 2020. Instead, they argue that peer mimicry must have driven the process. This hypothesis is corroborated by other studies. For example, Mistur et al. (2020) employ fixed effect models on panel data throughout 2020 and demonstrate that mimicry of geographical neighbors and political peers in addition to having a language in common are the principal drivers for countries to introduce, or abandon again, social distancing measures.
There are also a small number of agent-based models applied to generic issues of international policy diffusion. For example, Rapaport et al. (2009) were motivated by the diffusion of central bank autonomy around the world. They found that between 1990 and 2008, 84 countries strongly increased the independence of their central banks; approximately 5 countries per year. This is a steep rate of change compared to the status quo before that, yet far from the rate of policy change observed in 2020 during the pandemic. Instead of just focusing on this particular policy diffusion phenomenon, they attempt to build a generic agent-based model of national policy diffusion. Their model is informed by Kingdon’s theory of national policy formation who considered policy issues and policy solutions to have a life of their own and arguably perceived them undergoing an evolutionary process (according to Kingdon, policy solutions have their own fitness score for instance) (Kingdon 1984). Crucially, Rapaport et al. (2009) integrated these politically endogenous mechanisms together with external mechanisms. External mechanisms refer to when agents, the countries, look to other countries in their “zone of influence”. Here “zone of influence” is an umbrella term for geographical and ideological proximity. Eventually a mixture of internal and external factors determines whether a country adopts a new policy or not, represented as a binary variable (‘yes’ or ‘no’) in their model. Moreover, there is the agent-based framework by Luyet (2011). They build a model inspired by earlier attempts to formalize national diffusion theory (mostly by Braun & Gilardi 2006). In this work the probability that a country adopts a policy is influenced by the “effectiveness” of the policy in other regions, domestic institutional constraints and the proportion of geographic neighbors that already have adopted the policy. The study then proceeds to test the impact of parameters on the S-diffusion curve as an outcome but stops short of relating to any empirical case.
The only other agent-based approach to national policy diffusion that we are aware of is by Ring (2014). Ring argues that diffusion of policies can happen through three structural properties of the international political landscape: hierarchy, neighborhood and identity. Neighborhood refers to geographical proximity and identity to ideological proximity, which is similar to other models. Hierarchy is one feature that sets his model apart. Ring argues that few countries are high ranking in the international order and most countries low ranking. He then further maps these properties on the four mechanisms discussed in the diffusion-literature (coercion, learning, emulation and competition). He concludes that the four mechanisms vary based on the speed of diffusion and whether they actually produce an archetypal S-curve. According to Ring, learning and competition do, while coercion and, surprisingly, emulation produce rather flat curves.
Data assimilation for agent-based models
Agent-based models (ABMs) are now an established tool to model complex systems. ABMs have succeeded in illuminating system dynamics across many disciplines from chemistry and biology to economics, geography and sustainability sciences (Axtell & Farmer 2022). However, as with any model, ABMs have disadvantages. For example, it remains difficult to produce accurate forecasts because even if a model describes the core dynamics of some system in the past, it might not capture the gradually evolving mechanics over time. Any complex system, particularly complex social systems, are subject to tiny disturbances from a large variety of sources that can result in great differences compared to past behaviour – this is the essence of chaos theory.
With big data emerging as an ubiquitous feature of our time, computational scientists have a tool at hand to constrain their models, and ultimately to control the chaos (at least to a certain degree). This is where data assimilation comes in. Data assimilation is a set of algorithms originally developed in weather forecasting in which real-time observations are integrated into a model on a continuous basis (Kalnay 2003). These real-time observations constrain the model against the evolving true state of the system (Malleson et al. 2020). Examples of the use of agent-based models with data assimilation are extremely rare. Only relatively recent literature applies particle filters (Hu 2022; Lueck et al. 2019; Malleson et al. 2020; Ternes et al. 2022; Wang & Hu 2015), other sequential Monte-Carlo sampling techniques (Tang & Malleson 2022) and varieties of the Kalman Filter (Clay et al. 2021; Ward et al. 2016) to ABMs, typically for crowd simulation or more general population movement.
It is challenging to combine ABMs with data assimilation because the character of the model is distinct from a single equation or a system of equations. In ABMs, agents might possess a diverse set of behavioural parameters including numeric and categorical ones. Data assimilation algorithms however have been developed to optimise continuous numerical variables in weather and climate modelling (Ternes et al. 2022). ABMs are essentially discrete event simulations (Delli Gatti et al. 2018). Entities in the model behave according to rules. The rules are often stochastic and also determine an agents behaviour as a result of interaction with other agents. Hence, ABMs often become more complex at scale, particularly so if scaling up the number of agents implies scaling up the number of interactions. For example, Malleson et al. (2020) found, in their model of pedestrians, that data assimilation with a particle filter became extremely computationally costly because, as the number of agents in the environment increases, exponentially more particles are required to achieve a constant (low) error rate. In addition, Ternes et al. (2022) found difficulties using a particle filter in an agent-based crowd simulation because particle deprivation meant that the algorithm was not able to adequately search the space of possible model trajectories and ruled out models that would ultimately have predicted the system well. Ternes et al. (2022) proposed a resolution to this problem by filtering some parts of the model state space but not others. Variations of the Kalman Filter are potentially more efficient than the particle filter, but cannot estimate categorical parameters, although Clay et al. (2021) propose a ‘reversible jump’ mechanism to get round this drawback. Overall, for this work the particle filter appears to be the most suitable method as the proposed model of international lockdown behaviour only includes a fixed number of 164 agents (countries) and is much quicker to execute than a complex crowd model. Hence it should be possible to include a sufficiently large number of particles to avoid the problems identified by Ternes et al. (2022) without becoming overly computationally expensive and requiring a more efficient algorithm such as Clay et al. (2021).
Model and methods
Model description
The model is a data-driven agent-based model implemented in Python-MESA. The principal idea of the model is that the diffusion of lockdown policy across countries can be described independently of the actual COVID-case numbers across countries, at least for the period of interest which is March 2020. The main diffusion mechanism is that countries take note of which other countries already have adopted a lockdown and, if those include countries sufficiently similar to oneself, then they are likely to adopt a lockdown themselves. In other words, countries mimic countries that are similar. The model makes a simplification in that agents (countries) can either have adopted a lockdown or not, so the dependent variable of interest is binary. In reality, of course, there were varying degrees of lockdown intensity and stringency. However we observe in spring 2020 that only two outcomes really matter matter: ‘no lockdown’ or ‘complete lockdown’. This is described in detail in Section 3.2. There are 164 agents in the model since for 164 countries we were able to collect sufficiently comprehensive data on the COVID policy response as well as country specific variables such as national income and degree of democracy.
The model is purposefully designed to represent only a small number of the potentially huge range of factors that might result in a country entering a lockdown. The degree to which ‘simple’ models are preferable to more complicated models – the KISS (Keep It Simple, Stupid) / KIDS (Keep It Descriptive, Stupid) debate (Axelrod 1997; Edmonds et al. 2019; Edmonds & Moss 2005; Epstein 2008) – is an ongoing area of contention in agent-based modelling. As this paper focuses on the integration of a data assimilation technique with an agent-based model, and because attempts at such an integration are very much in their infancy, we chose a relatively small set of behaviours with which to represent national decision making.
Similarity between countries is measured along three dimensions: national income, degree of democracy and geographical location. National income is captured through Gross Domestic Product per capita in Purchasing Power Parity (World Bank 2022), degree of democracy through the Democracy Index by the Economist Intelligence Unit (Economist Intelligence Unit 2020) and geographical location simply through latitude and longitude of a country’s capital (Techslides.com 2016).
For measuring similarity, we use an equally-weighted average of each of the the three dimensions. In each case, the quantities pertaining to a dimension are normalised on the unit interval \([0, 1]\). We consider this similarity measure as a distance between two countries. The lower the distance between two countries, the more similar they are. In formal terms, the distance, \(d_{ij}\), between country \(i\) and country \(j\) is:
| \[\begin{aligned} d_{ij} = \frac{1}{3} \left( \underbrace{\frac{(x_i - x_j)}{(x_{max} - x_{min})}}_{\text{income similarity}} + \underbrace{\frac{(y_i - y_j)}{(y_{max} - y_{min})}}_{\text{political similarity}} + \underbrace{\frac{H(z_i,z_j)}{H_{max}}}_{\text{geo. proximity}} \right) \end{aligned}\] | \[(1)\] |
At any given time-step, a country can be in one of two lockdown statuses: in “lockdown” or “not in lockdown”. We denote the binary lockdown status of the agent representing country \(i\) at time \(t\) as \(\theta_t (i)\):
| \[ \theta_t(i)= \begin{cases} 1 & \text{if } \text{country i is in lockdown },\\ 0 & \text{if } \text{country i is not in lockdown} \end{cases}\] | \[(2)\] |
There is also a global parameter, \(p\), which denotes how many other countries an agent takes into consideration when evaluating its own average distance to the countries already in lockdown. This parameter, \(p\), has a value of \(p \approx 18\) in model runs calibrated to the empirical data hinting realistic peer group size among countries.
Eventually agent \(i\) evaluates the average of the \(p\) countries with the least distance to themselves and if this average undercuts a country-specific threshold \(s_i\), then the agent adopts a lockdown. This process may be considered a ‘social’ process since agents make the decision conditional on other agents’ decisions. The condition for lockdown adoption based on these social factors is therefore:
| \[ \frac{1}{p} \sum_{j=1}^{p} d_{ij} < s_i \quad \textrm{where} \quad s_i \in [0,1].\] | \[(3)\] |
There is also an a-social adoption-mechanism. This distinction is similar to the classic product-diffusion model by Bass (1969) where the two mechanisms are called ‘innovation’ (a-social) and ‘imitation’ (social). This a-social mechanism basically represents agents taking initiative on their own independently of their peers and is important to represent early adopters. The a-social adoption process is also modelled based on a simple adoption-threshold \(b_i\) which itself is set proportional to the square of the logarithm of population-density as well as the inverse of the degree of democracy (or in other words the anti-democracy). This proportionality captures the variables influencing the ‘base willingness to adopt’ a lockdown in line with what Sebhatu et al. (2020) ascertained statistically. Furthermore, we assume that this ‘base willingness to adopt’ is slightly influenced by the overall number of countries in lockdown. However, we model this global influence via an exponential function such that it remains entirely insignificant at first and only makes a measurable impact when more than \(90\%\) of all countries already have adopted, resulting in a slight push to the laggards who have not adopted due to pure similarity with other adopters. This represents a further pressure by global social majority but it is not related to any similarity measure or group affiliation, so therefore it does not belong to the social mechanism presented in Equations 1 to 3. We implement the a-social mechanism via a random draw from a uniform distribution at every time step. In precise terms, the probability for a-social adoption then is:
| \[ P_{lockdown\,by\,initiative}=P(X < b_i)=b_i \quad \textrm{where} \quad X {\sim} U[0,1] \quad \textrm{and} \quad b_i \in [0,1].\] | \[(4)\] |
| \[ b_i = P^2*\frac{1}{Y_i}* B \quad \textrm{with} \quad 0 \leq b_i \leq 1,\] | \[(5)\] |
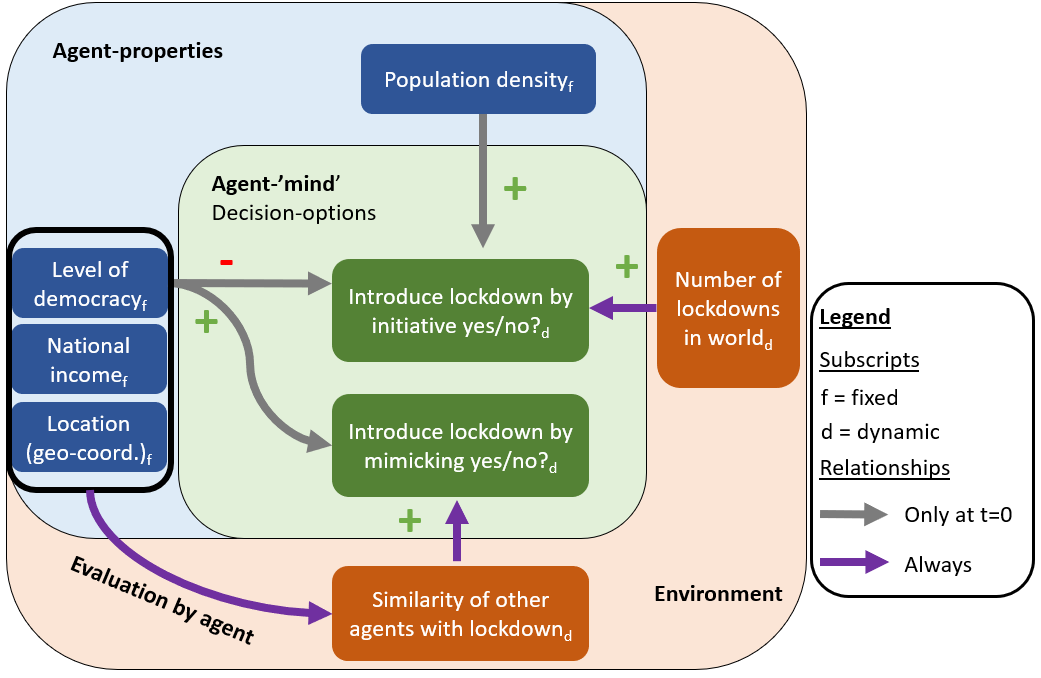
Figure 1 summarizes the model in a high-level manner. There are three layers to the figure: The outer layer represents the environment in which agents are situated, the middle-layer represents the agent with all its properties, and the inner layer the ‘cognitive’ layer of the agent’s decision options. As described above, there are only two decision options (‘adopt lockdown’ or ‘do not adopt lockdown’) and two decision mechanisms (‘initiative’ or through ‘peer pressure’). Finally, the model agent activation works in random yet sequential order.
Policy data description
To test and calibrate our model we employ data provided by Our World in Data (Ritchie et al. 2020) that were originally gathered through the team of the Oxford COVID-19 Government Response Tracker (Hale et al. 2021). Hale et al. (2021) not only gathered the original data but also demonstrated that almost all countries across the world “ramped up” their policies in the same 2-week window despite being affected by the virus to varying degrees. The data follows a variety of COVID-19 policy response measures on the national level, including school closures, workplace closures, face coverings, internal movement restrictions, international movement restrictions, public event cancellation and more.
Each policy is measured on a categorical scale of usually three to five categories, with the exact scale depending on the indicator. The categorical levels represent the stringency of the policy. For example, in terms of school closures there are four levels (no measures, recommended, required only at some level, required at all levels). The indicators mostly ignore sub-national heterogeneity. If at least one sub-national region implemented the strictest measures, then the data classifies the entire country as having implemented this measure. This a substantial simplification and limitation. In Germany, for example, where school policies are generally the authority of the federal states, there was some heterogeneity. Although at a sub-national level the federal states possibly tended to mimic each other too, at the very least the policies were spatially correlated (Fuchs-Schündeln 2022). Our goal is to model and describe (inter-)national policy diffusion, therefore we acknowledge this limitation but do not further deal with regional complexities.
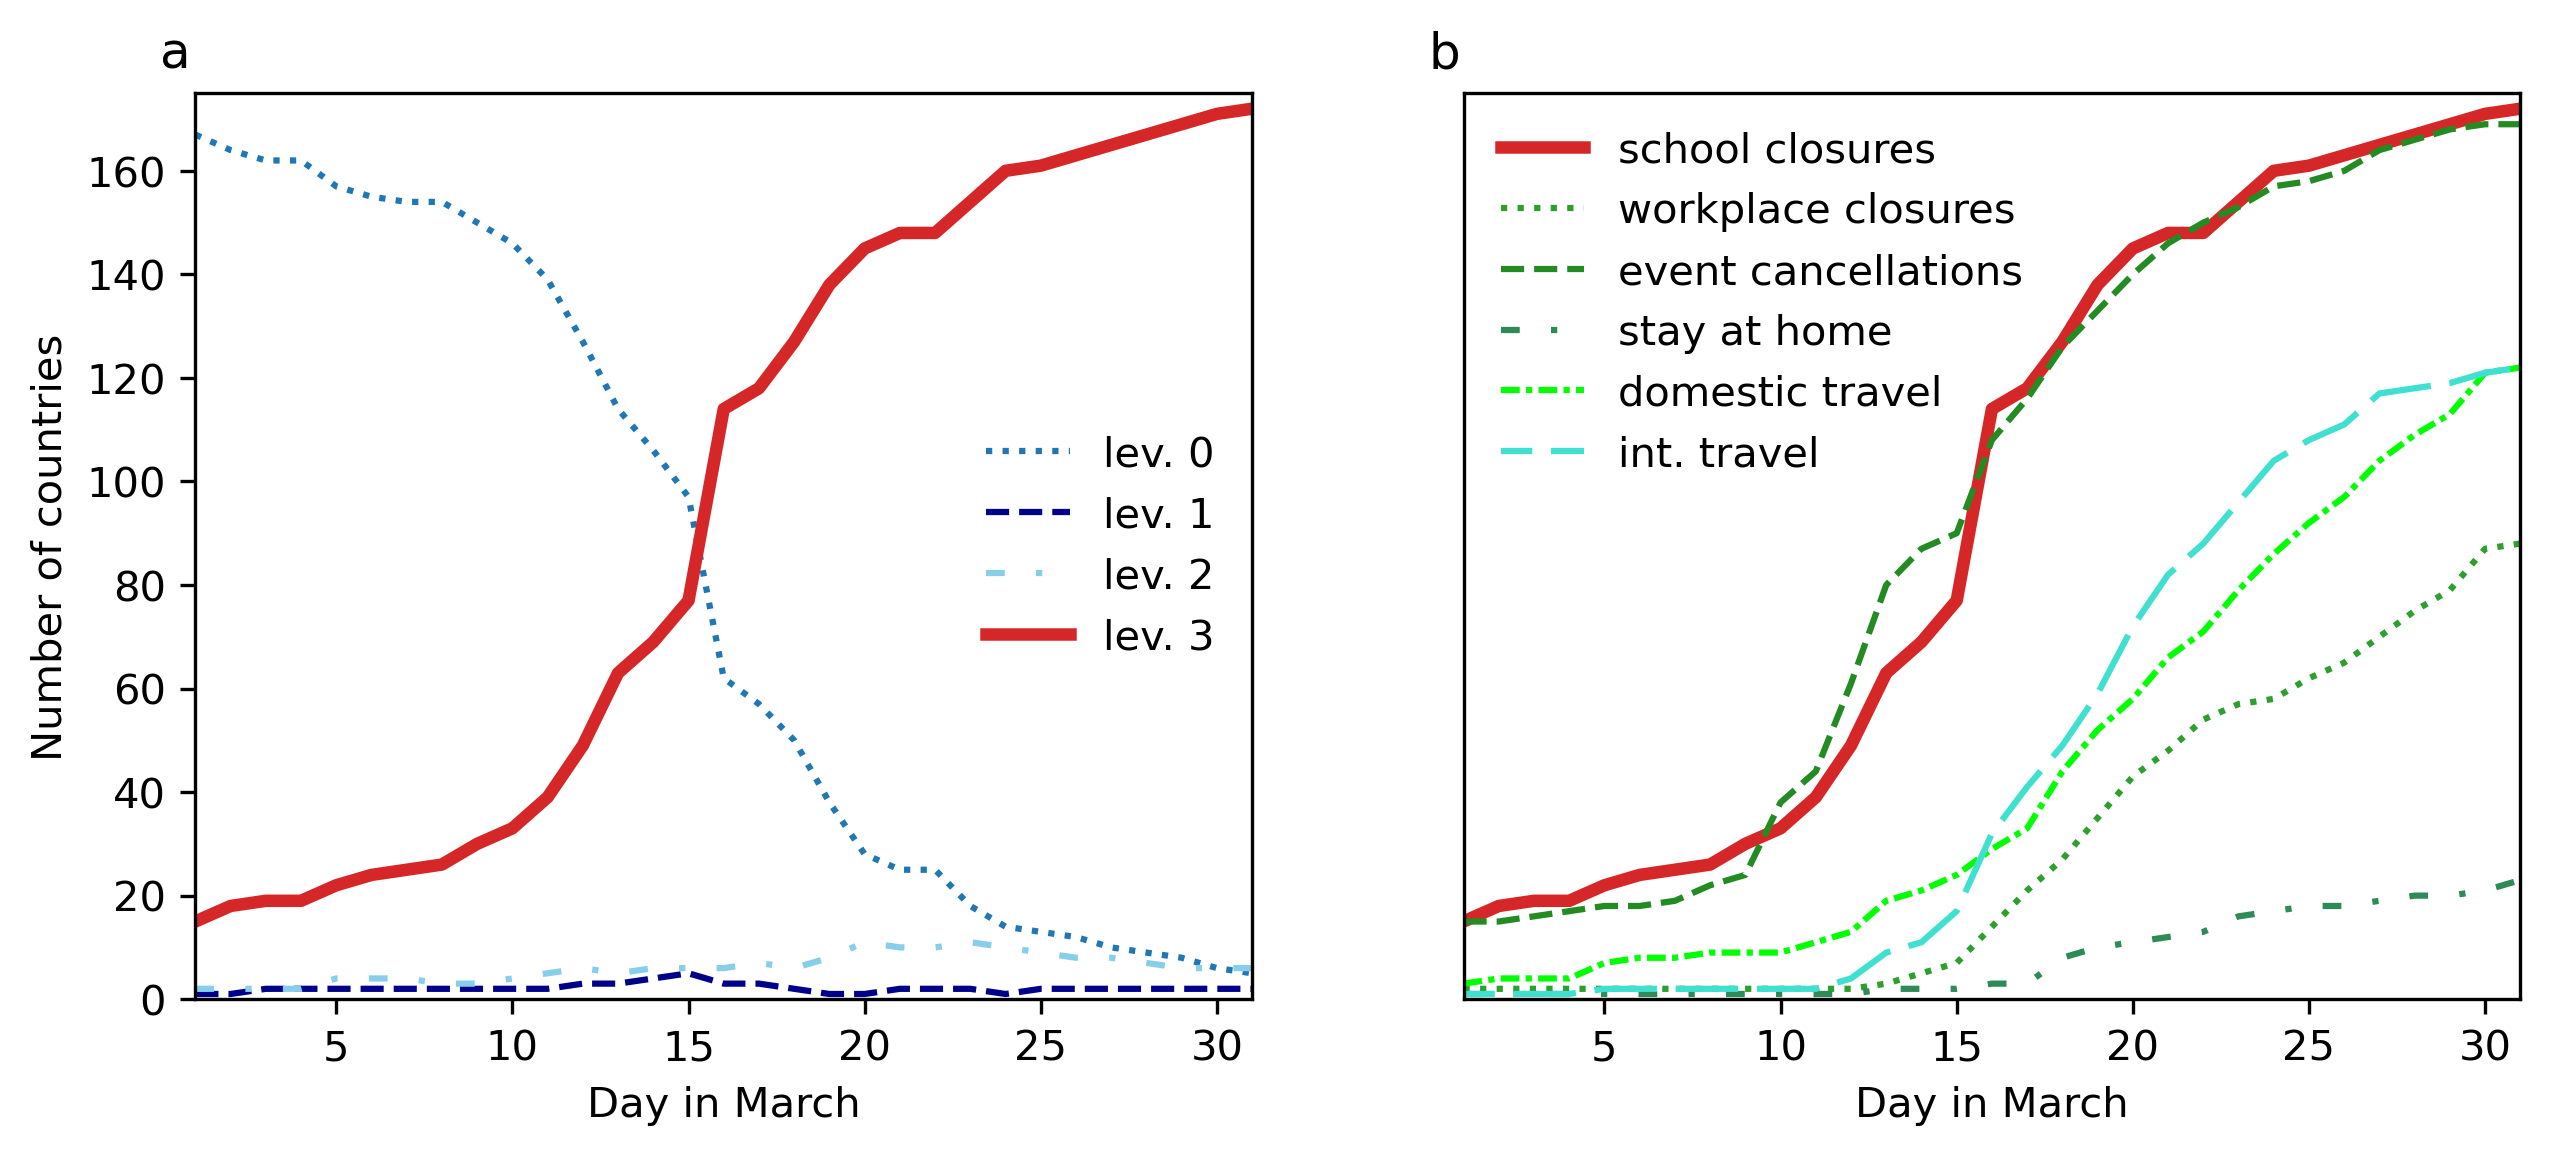
Based on the data, we can observe that for some policies countries did not implement intermediate stringency levels frequently but either went all-in or remained tolerant (of course this is partly influenced by how the measures’ stringency has been interpreted in the first place). In Figure 2a, the diffusion of school closures (red solid line) across countries is depicted in terms of the four possible categories (level 0 to level 3). One can clearly observe the transition from level zero to level three without countries spending any time at level one or two. This implies that as a good first order approximation we might assume a binary policy choice (school closure or not). Secondly, Figure 2b illustrates the diffusion of several policy measures taking on their highest level. Public event cancellations correlate very closely with school closures. Other measures do not follow school closures that closely but still align to a high degree. Partly this is because we only display the highest stringency level and for some metrics intermediate steps are more significant. For instance, workplace closure correlates more closely with school closures and event cancellations if the second highest level “required for some” is also considered. In sum, all policies correlate substantially over time (Pearson’s \(\rho > 0.9\) for all policies). Therefore, for modelling purposes, we assume that the system state “lockdown” is in line with the policy measure “school closure”, which at the very least captures two policies (school closures and event cancellations) and exhibits substantial correlation with other measures.
Particle filter description
We implement a particle filter to constrain the evolution of our model to real-world observations as they emerge. A particle filter is essentially a genetic algorithm on the different simulation runs, which are called the particles, filtering out the ones that do not fit incoming data well enough. Another way of defining a particle filter is that it is a step-wise algorithm to optimally estimate the posterior distribution of the state of a stochastic system, given a description of the system (the model) as well as real-time observations.
A particle filter assigns a weight to each model run based on a specified error metric which compares the model state to the observed system state. The filter can be thus denoted as the following set after Malleson et al. (2020):
| \[ P_k = \Bigl\{(x_k^i,w_k^i): i \in {1,...,N_p} \Bigr\}\] | \[(6)\] |
Our model state can be specified by a vector with 164 cells (one for each country), each set to either zero (‘not in lockdown’) or to one (‘in lockdown’). The observation state vector is the analog for the actual observation. Hence the difference between model estimation and observation for each particle \(i\), that is the error \(e\), can be computed as the fraction of countries to be estimated in their incorrect state, or simply:
| \[ e_k^i = 1 - \frac{c_k^i}{164}\] | \[(7)\] |
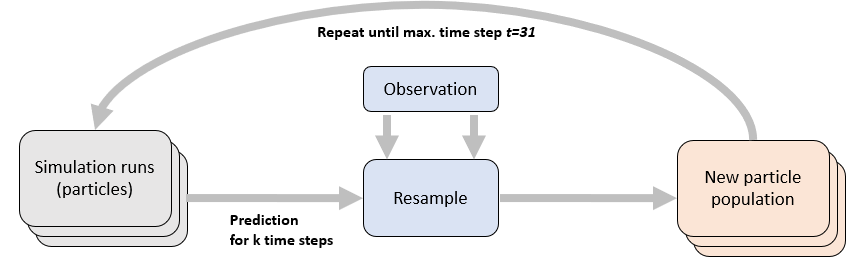
After every reweighting procedure, a resampling of particles is undertaken to optimise the estimation of the system state. Here, Sequential Importance Resampling is used (Doucet et al. 2000). The resampling procedure updates the model ensemble at a specified interval, let us say every fifth time step for example, by discarding the worst performing model runs and replicating the best. During this procedure, the weights are cumulatively counted, so they constitute a cumulative distribution function (CDF). This distribution of weights is compared against a uniformly random partition of the interval [0,1], constituting a uniformly random CDF. Then \(N_p\) points along the uniform distribution are selected, exactly at the mean step size of \(1/N_p\) and compared against the CDF of the weights at that particular point. For example, if there are 10 particles then the uniform CDF is evaluated at \(x = 0.1\), \(x = 0.2\) and so forth. Let us say at \(x = 0.1\) the uniform yields exactly \(y_u = 0.1\) and the weight distribution yields \(y_w = 0.2\). The uniform partition therefore makes a smaller step than the weight distribution. Then the weight of the particle is large, its error small and correspondingly the particle should be resampled. If on the other hand \(y_w = 0.05\) then the particle weight is less than the expected uniform average (which is 0.1) and thus the particle is discarded from the future particle population. Overall by conducting this procedure until 100% of the uniform distribution are reached, it is very likely that particles with small weights are discarded because the ‘room’ they make up in the cumulative weight distribution is very small. In analogy, this procedure might be considered a Roulette in which the ball has exactly uniform probability to end up anywhere on the Roulette, but the Roulette regions are not of uniform size. Clearly then, the probability is higher that the ball lands up on one of the larger regions. The principle applied here is the same. Figure 3 depicts the particle procedure and its iterative nature. A certain number of particles are projected forward in time and then considering new observations, a new particle population is resampled and again this particle population is projected forward.
Experimental setups
Base run and calibration
The first computational experiment we conduct is simply to fit the model to the data. We calibrate the model parameters such that the diffusion curve of national lockdowns over time (see Figure 2) is well approximated by the mean of an ensemble of simulations (where \(N = 100\)). We do minimize the distance of mean prediction and data but without specifying an exact loss function for this experiment because the added merit of the optimal calibration is small. We only require a model that captures the data relatively well before starting our data assimilation experiments. At this stage we measure the fit simply as correlation between mean prediction and data. In this specific calibration, the probability of countries to adopt a lockdown on their own is set to 1% and then further adjusted for each country by their degree of democracy and population density. It ranges from 0.0002 to 0.07 with most values around 0.01 and being roughly log-normally distributed. The social threshold is set to 0.13 and then additionally weighted by the degree of democracy in each country. It ranges from 0.02 to 0.25 and is approximately uniformly distributed in between (although there two notable modes near 0.075 and 0.15). The clique size that countries consider in their decision is set to 18 because it yields the most plausible shape of diffusion curves. We start each model iteration on first of March where 8% of countries, the first movers, already have implemented a lockdown – including China and Italy.
Parameter-variations and more detailed explorations of the behaviour of the model can be found in the Supplementary Note 2. Table 1 provides a brief overview of the calibrated key parameters in the model.
| Parameter name | Value |
|---|---|
| A-social threshold (global) | 0.01 |
| Social threshold (global) | 0.13 | Peer group size | 18 |
Particle filter calibration
We test the particle filter in several ways. First we choose a medium case of the particle filter, that is a specific particle filter configuration with respect to the number of particles considered and the size of the data assimilation window and see how this compares to the model base run. For this purpose, we set the data assimilation window to five days and create 1000 particles. Subsequently we conduct two sensitivity analyses on the filter parameters. First, we test the influence of the number of particles on the filter performance, and second, we test the influence of the data assimilation window size, that is the frequency of applied filtering, on the filter performance.
Results
Experiment 1: Base run, calibration and validation
We test the performance of the model without the support of a particle filter by employing a model ensemble of 100 runs with the above (Section 3.4) specified parameter configuration. Figure 4 presents the ‘macro’ results in panel (a) and the ‘micro’ results in panel (b).
With respect to the ‘macro’ results, the model only needs to estimate the total number of countries in lockdown. To this end it does very well, achieving a very high correlation between data and mean prediction of the model (\(\rho > 0.99\)). The model mean prediction (black solid line in Figure 4a) tracks the data (red dashed line) closely and the data are contained in the 95% confidence interval. Importantly, the mean-squared error (MSE) between data and mean prediction is generally less than ten percentage points on the vertical scale of percentage of countries in lockdown. For instance, in a typical ensemble of 100 model runs (i.e., Figure 4a) the maximum deviation between mean model prediction and data occurs around halfway through the considered period on the 16th of March. Here, the absolute deviation between the percentage of predicted countries in lockdown and actual countries in lockdown reaches on the order of ten percentage points (generally slightly less though).
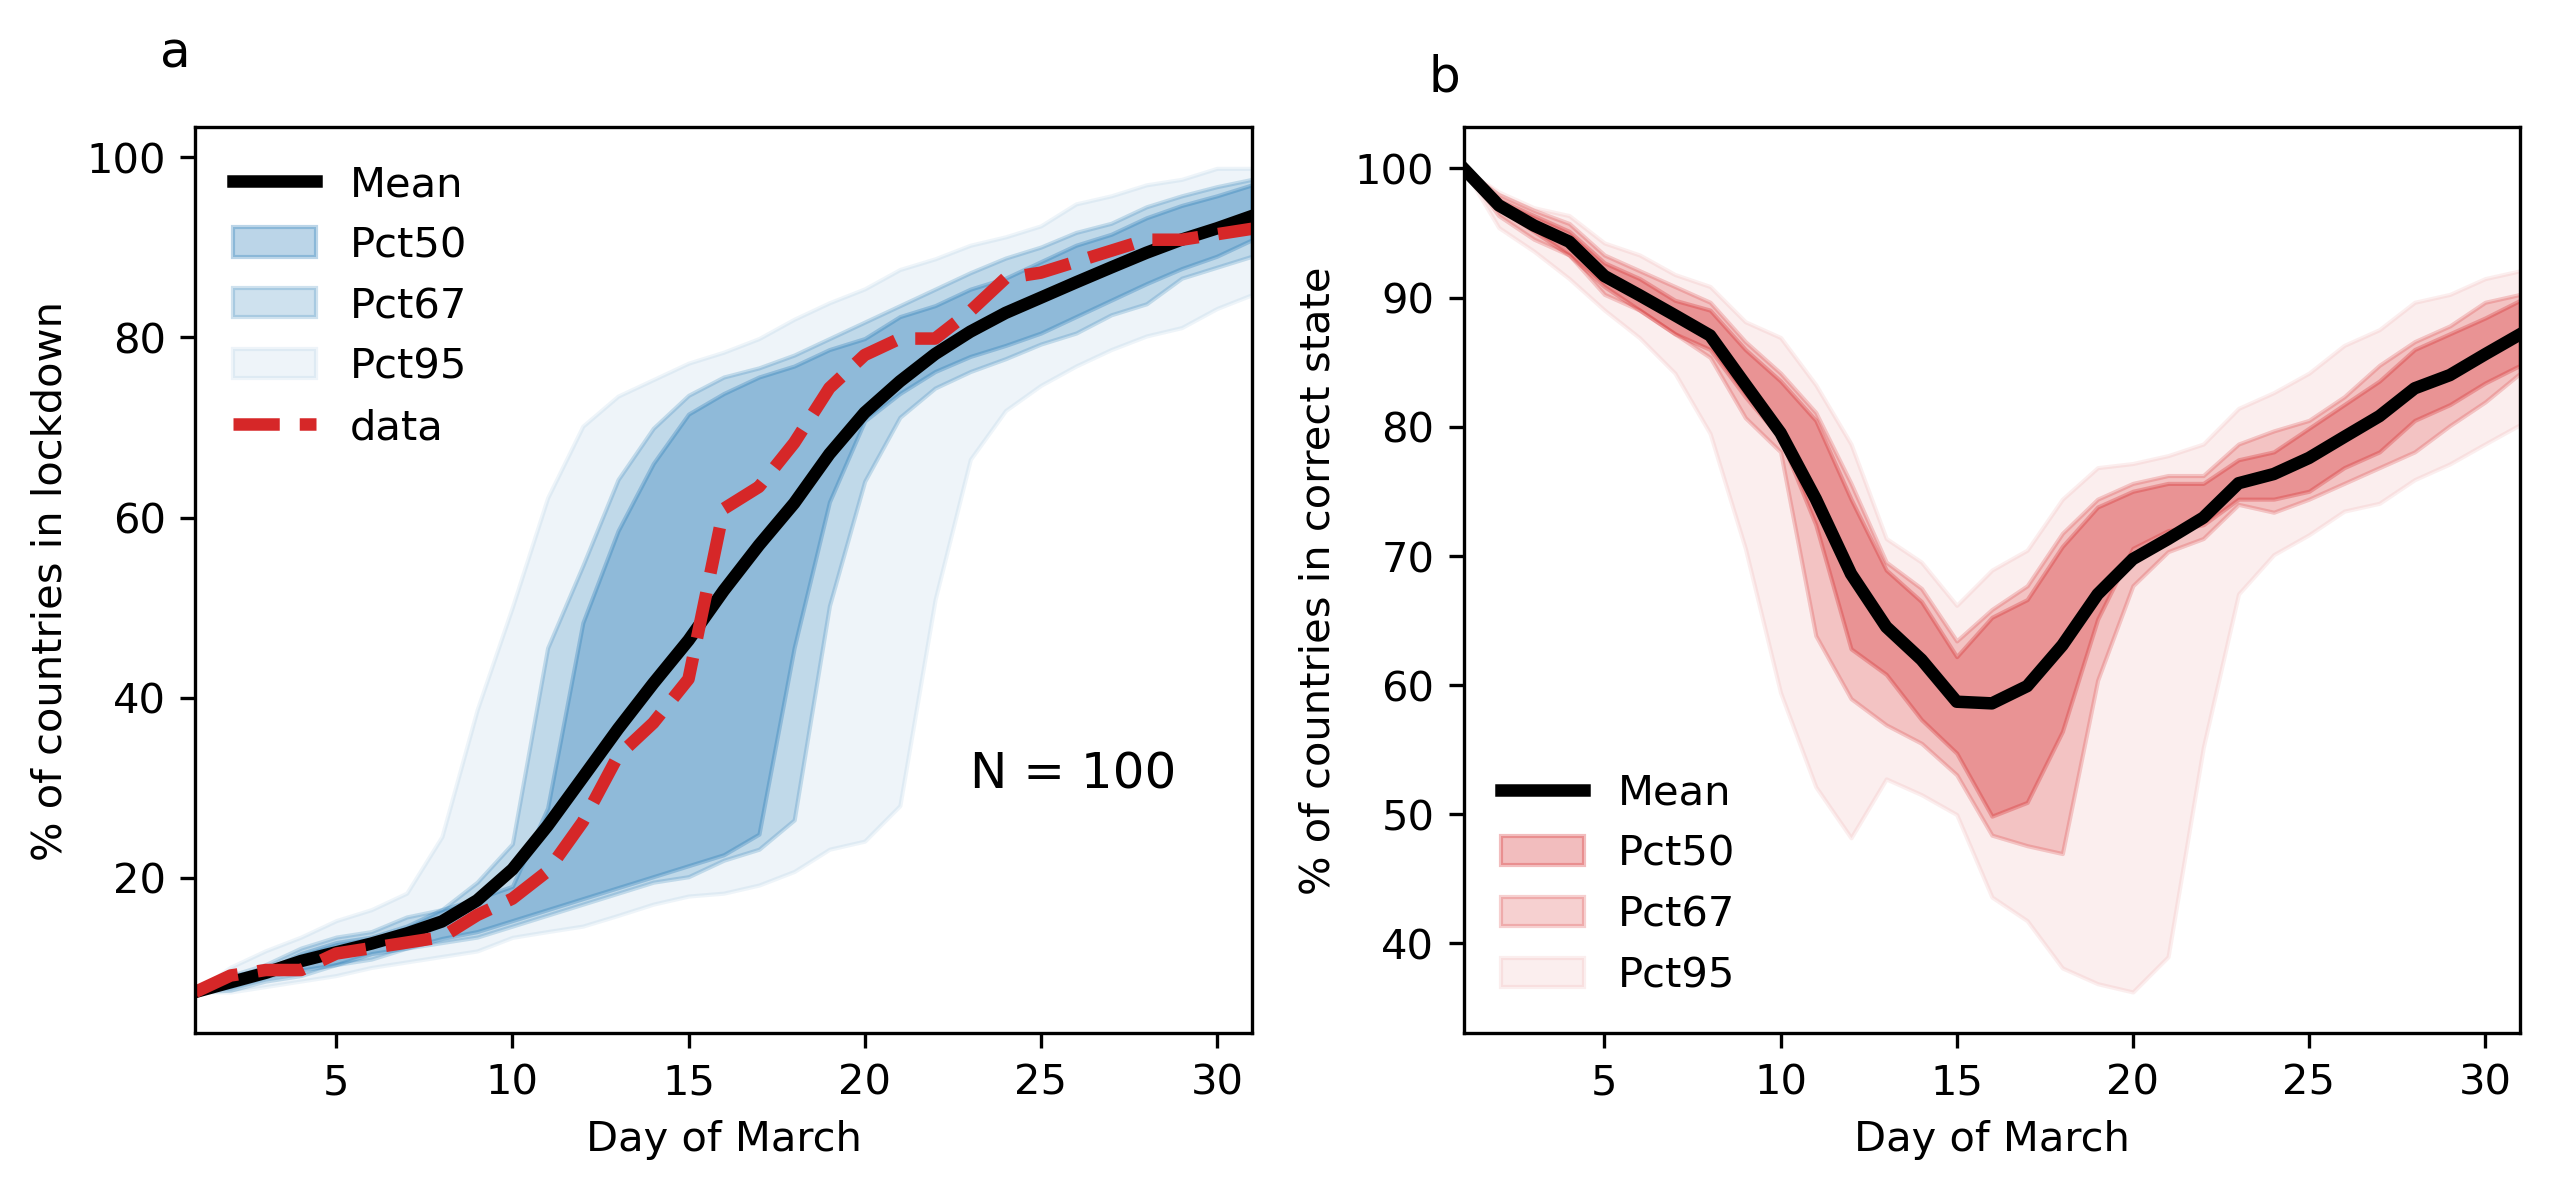
Variance and standard deviation are comparatively large however, even though only one parameter configuration is considered. The standard deviation of the ensemble reaches a maximum during the critical phase of the diffusion curve, roughly half way through March (at 23% of all considered countries).
Considering the ‘micro’ results (Figure 4b), we now determine whether the model is able to predict the lockdown states of the individual countries, rather than just predicting the total number of countries in lockdown. To do this we compare the the 164-dimensional vector (that has either a 0 or 1 in each cell representing whether each country is in lockdown or not) created by the model to that of the real observations. We find that the model performs worse, as expected, but still to a respectable degree. During the critical phase, mid March, the percentage of correctly estimated countries deteriorates to nearly 50% only but recovers towards the end of the simulation. The variance of micro states estimates is generally larger towards the second half of March, and particularly high during the critical phase. This is because a number of simulations get the system state substantially wrong at around the 20th of March. Observing Figure 4a again we see that the 95% interval includes simulations that vastly underestimate the number of countries at that point in time. This is due to the stochasticity in the a-social adoption mechanism. If too few countries adopt a lockdown on their own, no mass-adoption is triggered because not enough countries find a sufficiently similar country that would have done the same. The importance of correctly capturing the behaviour in this ‘critical phase’ highlights the need to update the model with current data, as is the subject of the next section.
Experiment 2: Particle filter
Experiment 2.0: Particle filter compared to model base run
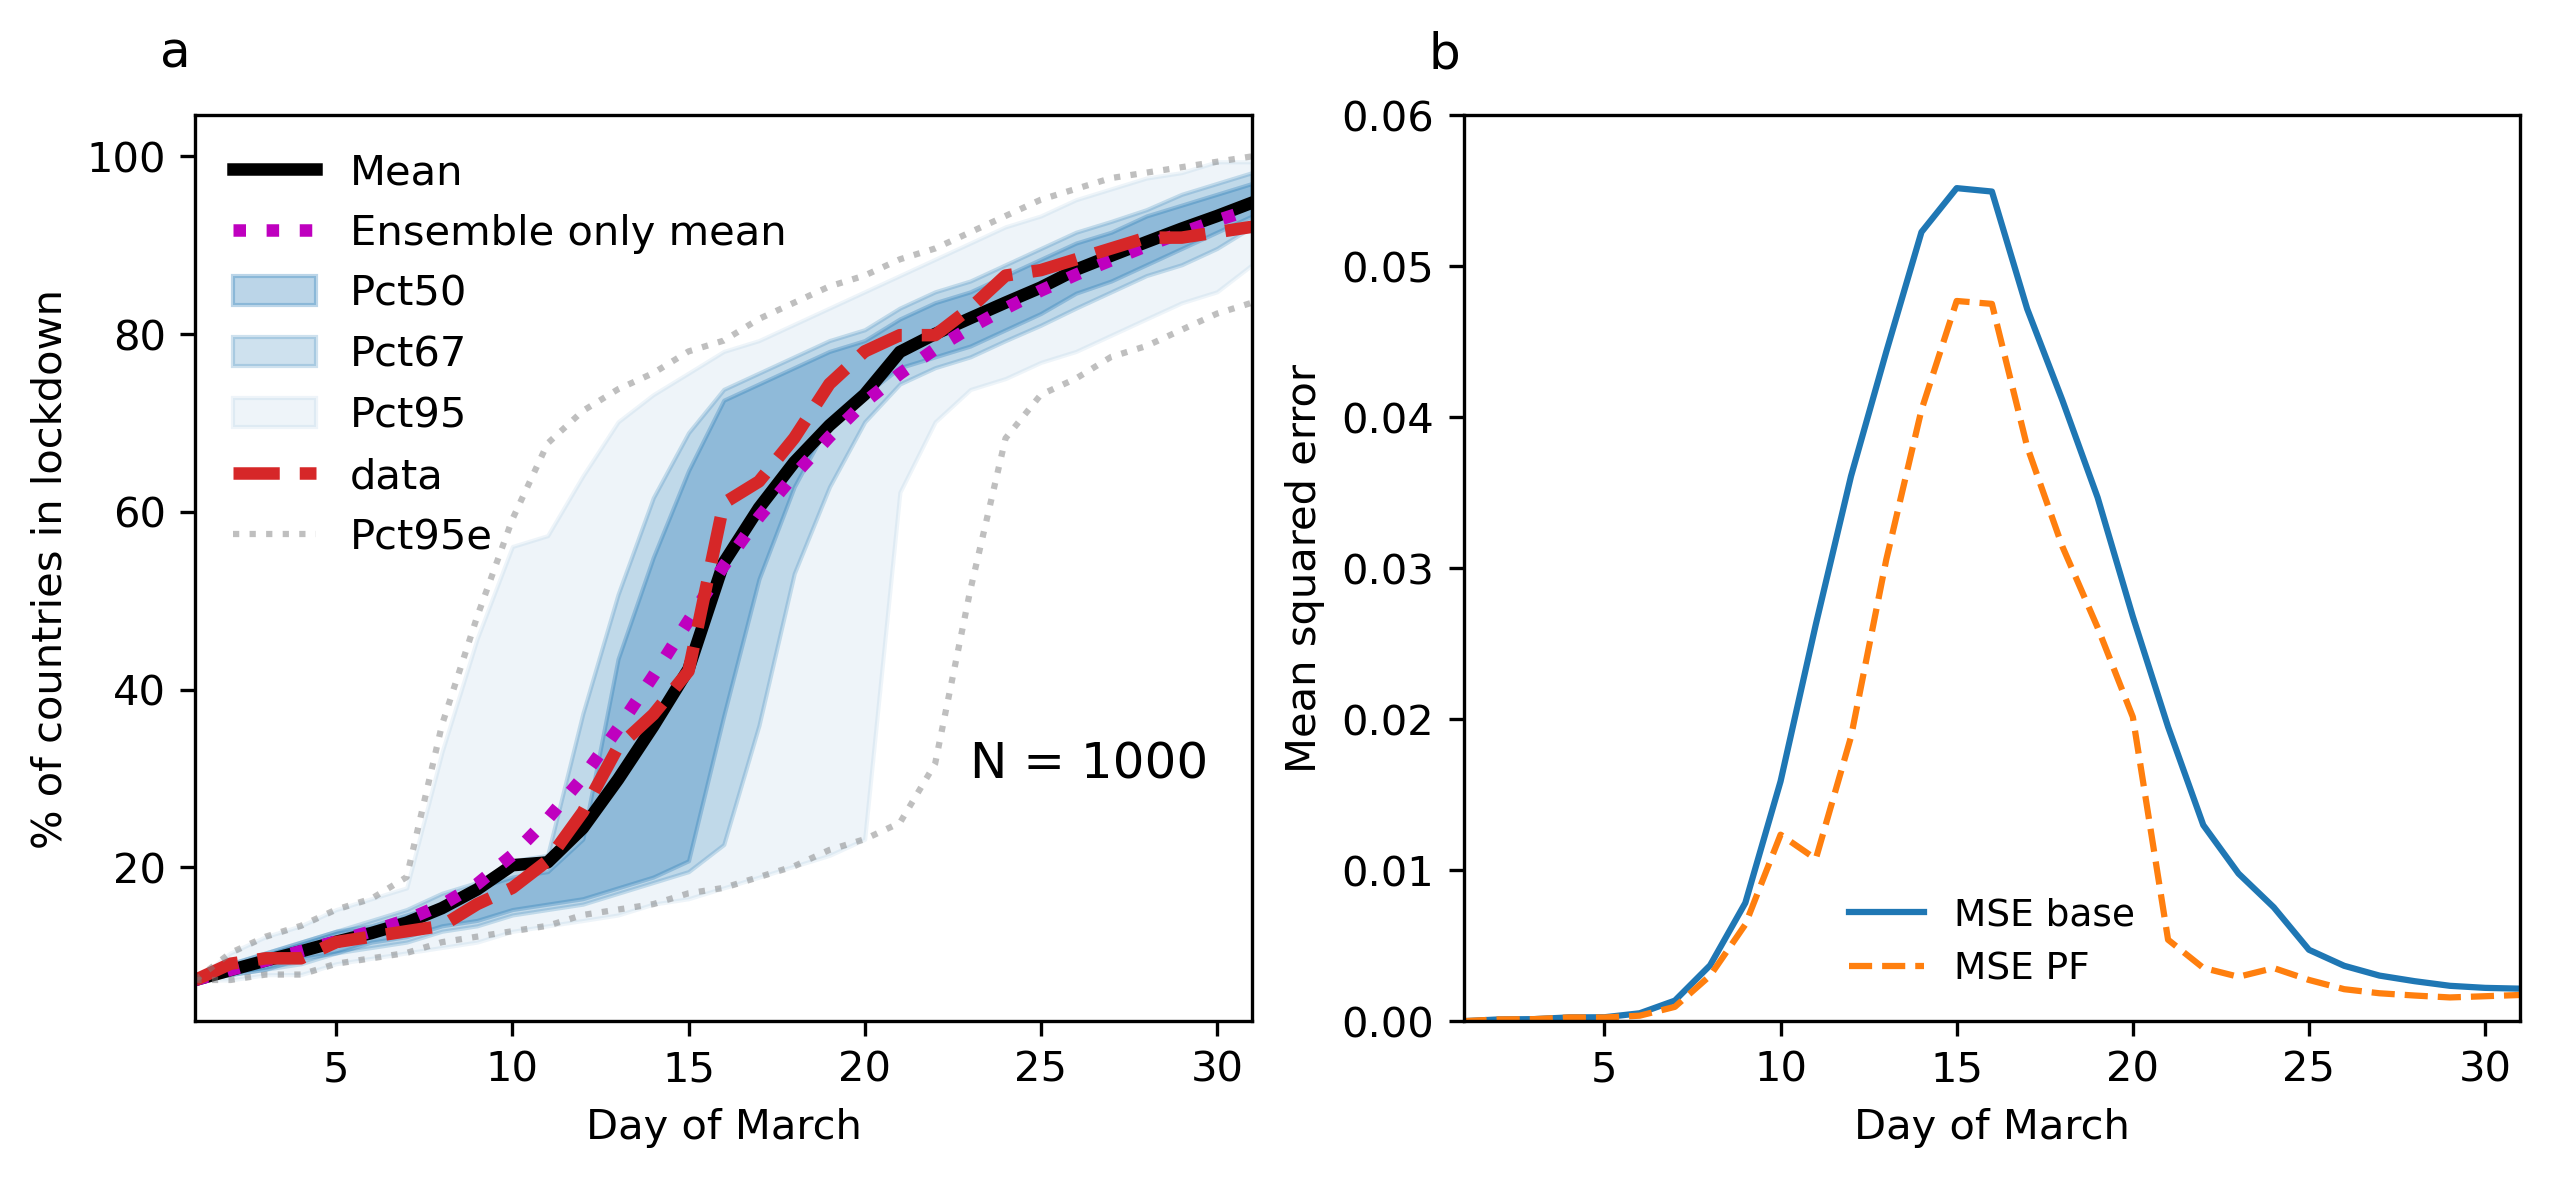
In this experiment, we run both the base model and the model plus particle filter 1000 times. We re-sample particles at every fifth time step; that is, the models are confronted with observations on every fifth day of March 2020. The results are plotted in Figure 5. The particle filter improves the fit of the mean model prediction to the data and lowers the variance in results. Hence it increases the reliability of prediction. In Figure 5, the particle filtered model mean is plotted as solid dashed line and the previous ‘ensemble only’ mean as magenta-colored dotted line. For comparison with the new 95% confidence intervals, the previous ones are illustrated as dotted lines. In particular, the 50% confidence interval is narrowed down and effectively halves along the temporal dimension (dark blue shaded region in Figures 4 and 5). To quantify the particle performance better, we plot the mean-squared error (MSE) over time from the base model run compared to the MSE of the particle filter. At a maximum, the particle filter reduces the MSE by nearly 75%. This happens roughly from 20th to 25th March. During the critical phase between 10th and 20th March, there is a substantial reduction of the MSE on the order of 10% to 40% depending on the exact time point considered.
Experiment 2.1: Number of particles sensitivity
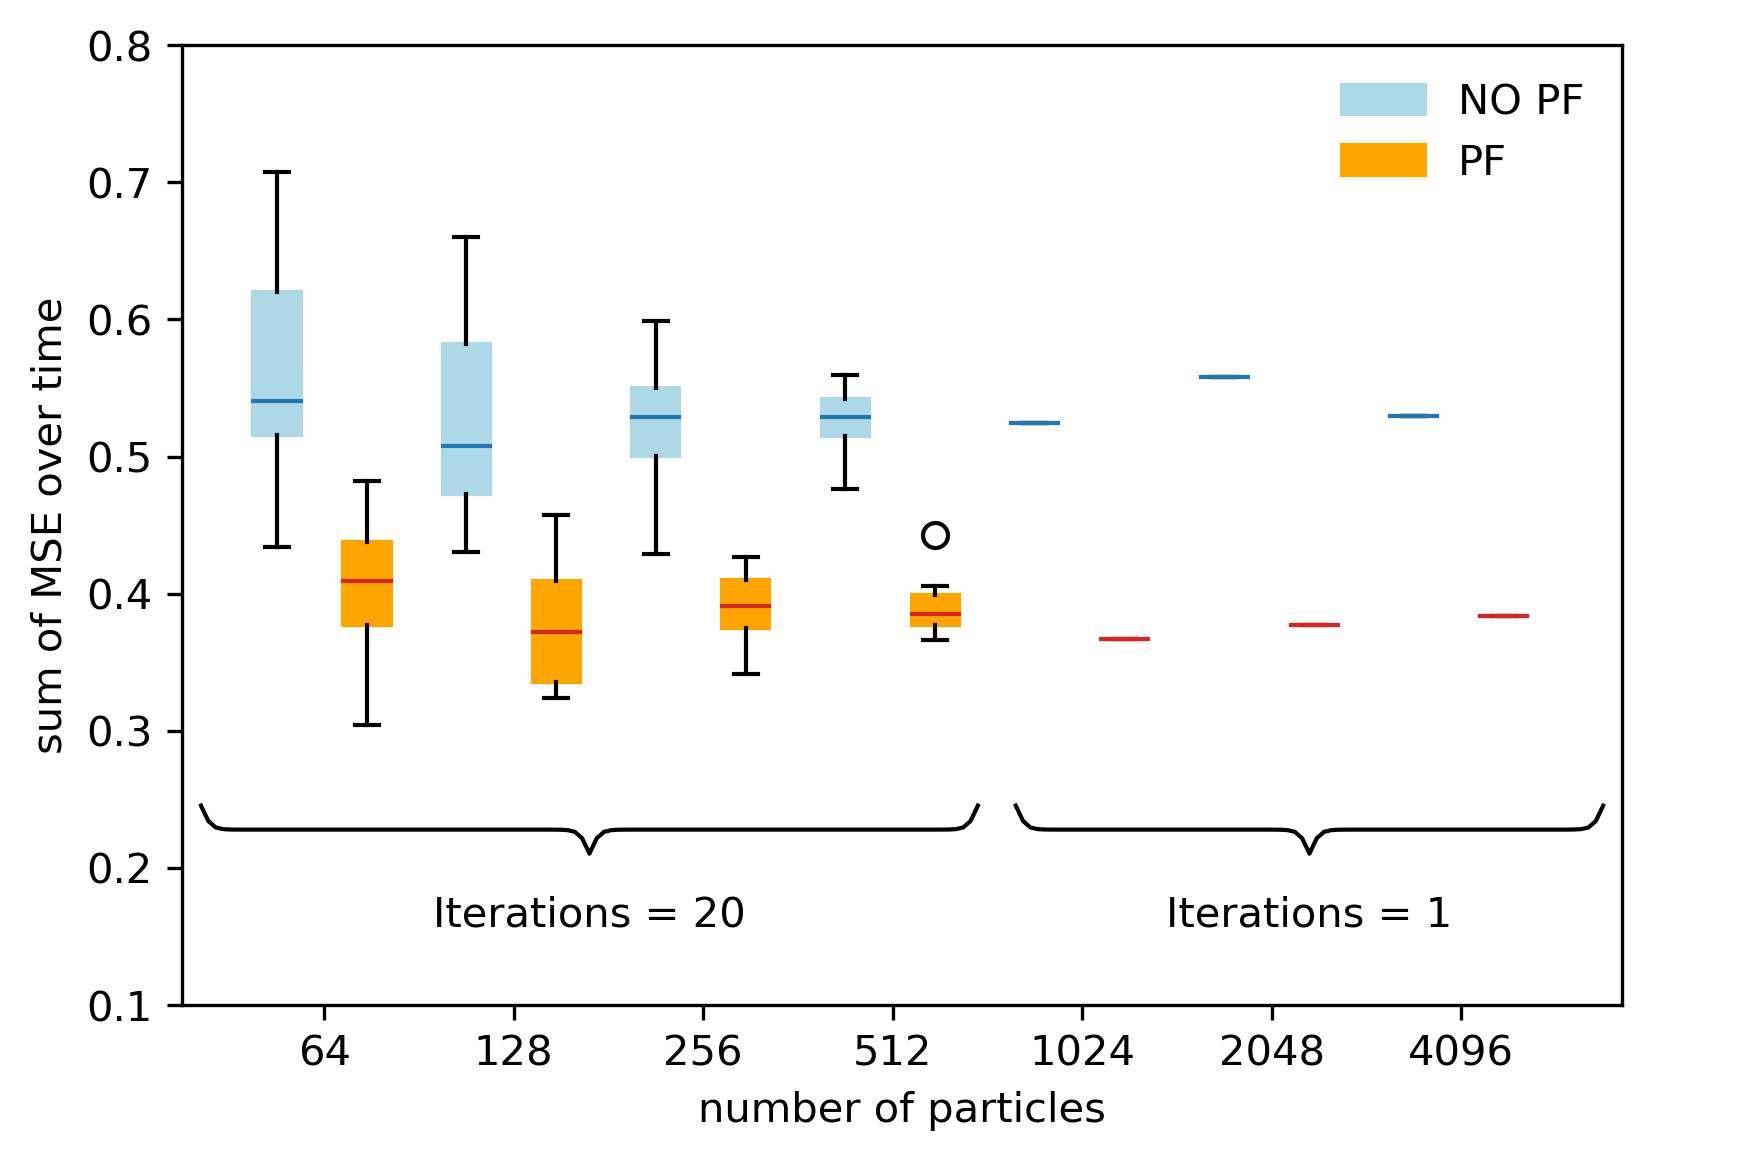
In this experiment, we vary the number of particles \(N\) along the exponential function \(N(x) = 2^{x}\) with \(x \in \mathbb{Z}\). The principal result is that the particle filter performs better than the model alone and this is independent of the particle numbers. The performance metric we have chosen to test is the mean-squared error (MSE) over time but summed up along the time axis. Since the time axis proceeds in unit steps of one day, this metric can be interpreted as numerical integral of the curves in Figure 5b. For lower particle numbers from \(2^{6} = 64\) to \(2^{9} = 512\), we have conducted 20 test runs. This means, for instance, we ran 64 x 20 simulations in total.
At those lower particle numbers, for example 64, the base model may still perform better in a number of cases. The distributions of iterations overlap. As the particle number increases, the distributions clearly separate and the particle filter reliably performs better than the model without particle filter. Hence, for computational efficiency, we have only conducted one iteration from \(2^{10} = 1024\) particles onwards. Taking \(2^{12} = 4096\) particles as a reference, the particle filter reduces the sum of the MSE over time by roughly 30%, which is also the order of improvement in the other cases.
Experiment 2.2: Data assimilation window sensitivity
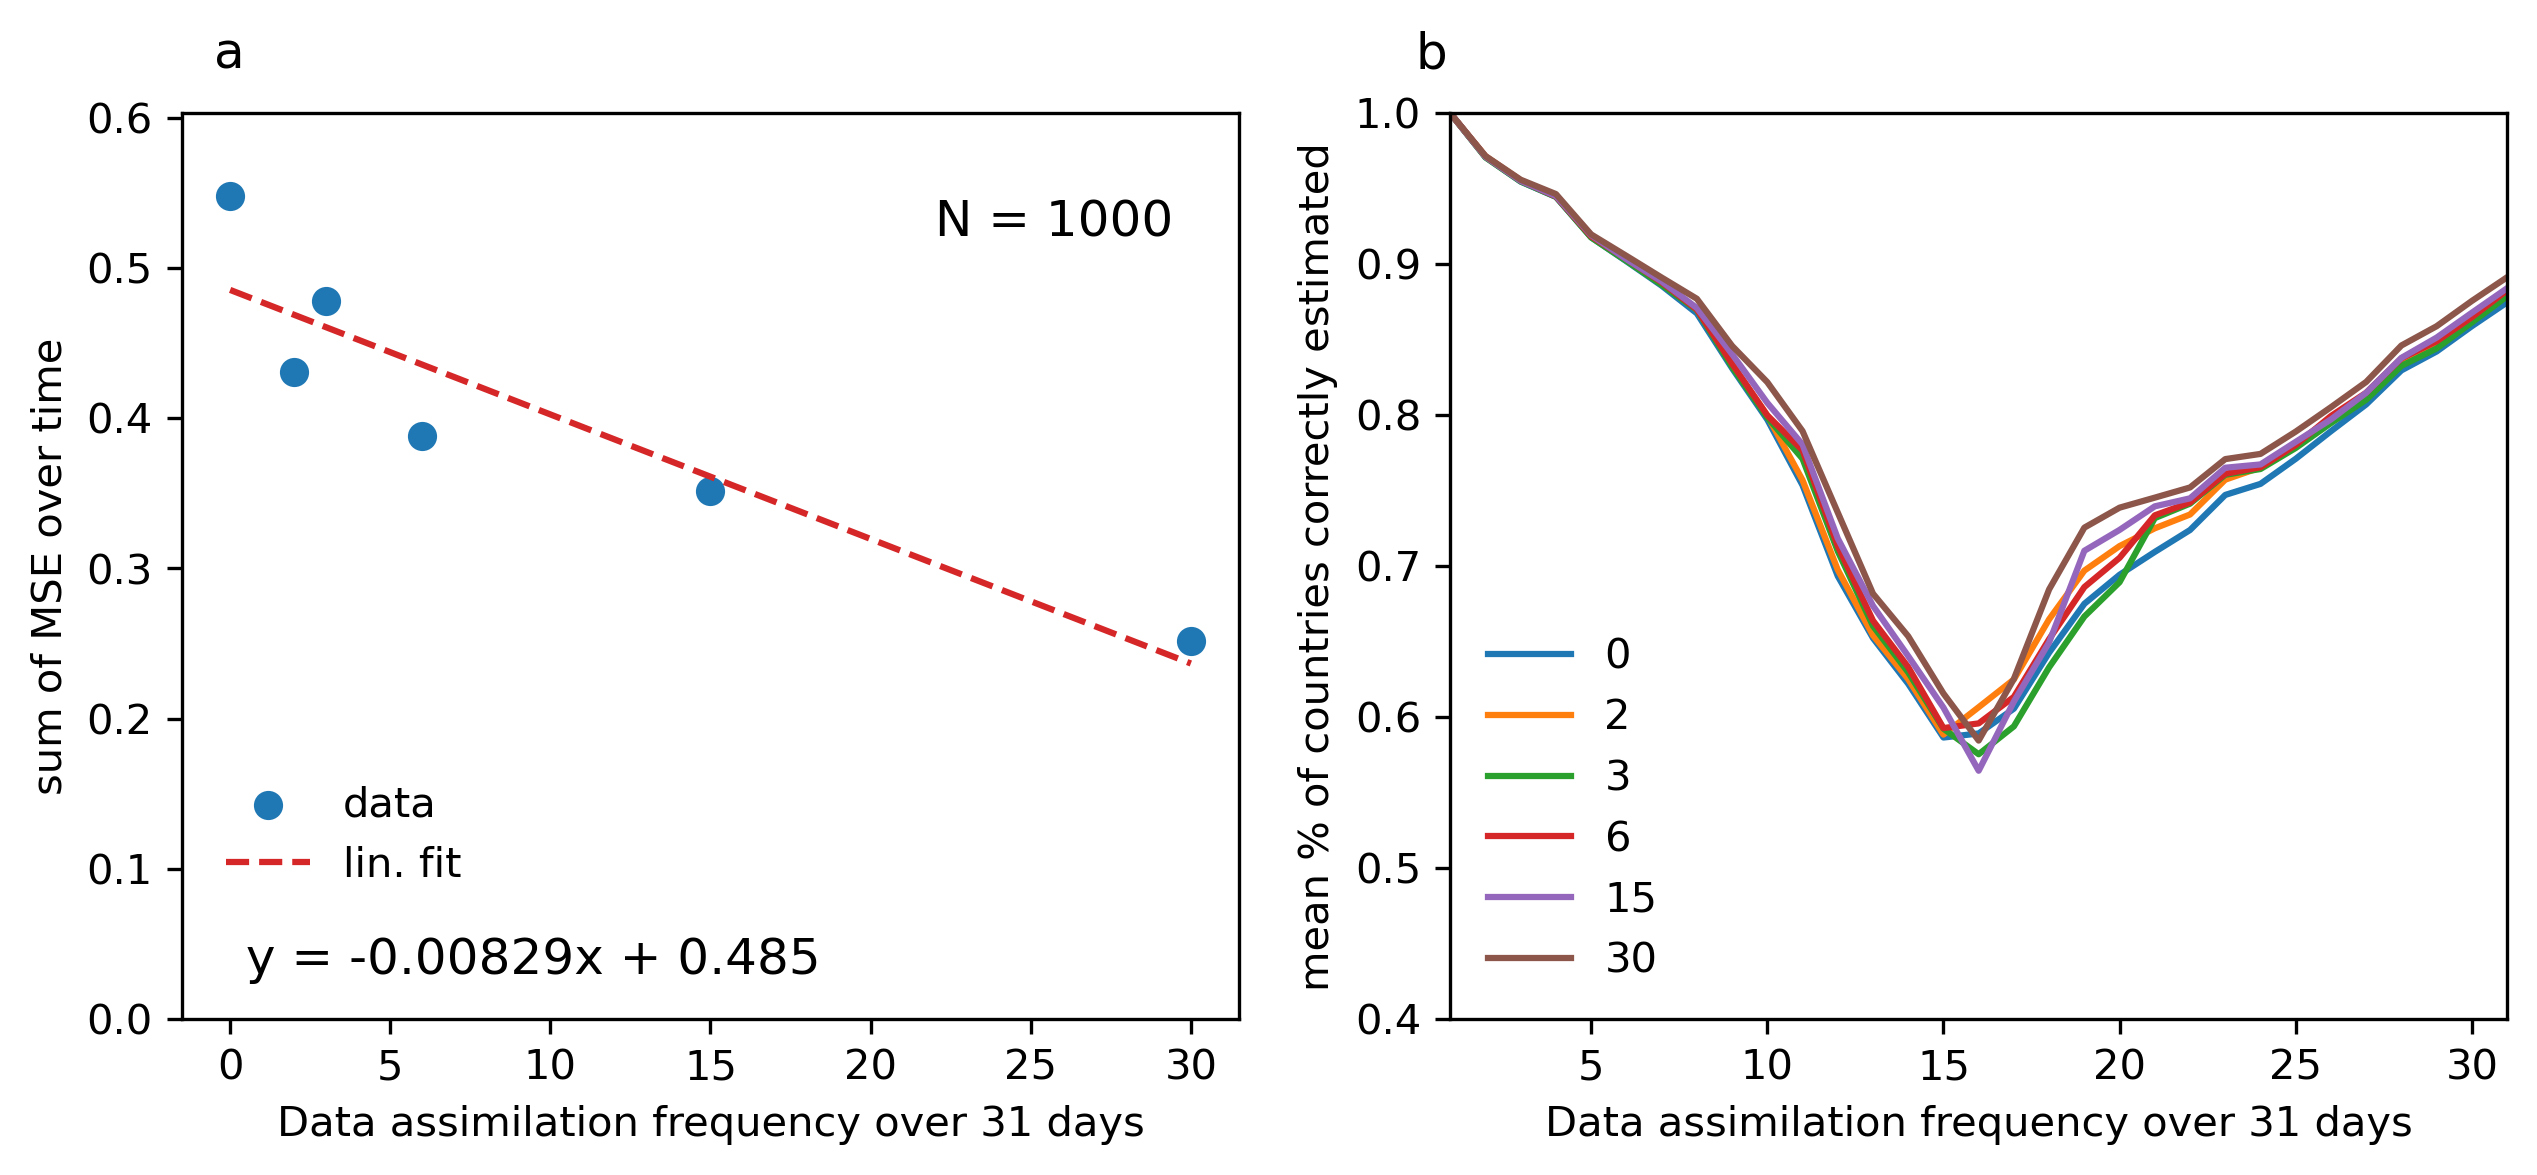
Since we established in Section 4.2 that at a minimum on the order of \(2^{9}\) particles are required to get a reliable filter, here we fix the particle quantity at 1000 but vary the filtering frequency. We test six such frequencies: (i) no filtering; (ii) filtering at every 15th time step, so twice; (iii) at every 10th time step, so three times; (iv) at every 5th time step, so 6 times; (v) at every 2nd time step so 15 times; and lastly (vi) at every time step, so 31 times.
The results indicate a linear relationship between the filtering frequency and the MSE of the aggregate diffusion curve. For every additional five days of filtering, the sum of the MSE over time is reduced by roughly 10% as compared to no filtering. Thus, the aggregate estimation of how many countries out of the global total are in lockdown is significantly improved through the particle filter. The impact on the micro-accuracy is more marginal however. There is no substantial improvement in exactly knowing what country switches when. This means that through the particle filter we do not gain better information on when exactly specific countries switch to lockdown. Increased filtering does still lead to a slightly better micro-performance but not substantially, as seen in Figure 7b. This is likely due to a model limitation rather than a filter limitation. The model does not produce trajectories which perform substantially better than being 60% correct during the critical transition phase from roughly 10th to 20th March (see Figure 4b). The model ensemble simply does not include trajectories that perform substantially better than the average. Consequently, the particle filter cannot find a much improved optimum compared to the average prediction quality.
Discussion and conclusions
Interpretation and generalizability
We have presented a model of the COVID-19 policy response diffusion across nations and optimized the model estimation in ‘real time’ by employing a particle filter. The model is successful in reproducing the observed diffusion pattern based on peer mimicry as an interactive mechanism alone, if calibrated to the data. The model comes with limitations however. We have not tested diffusion proceeding over diverse periods of time, for instance over a year instead of a month. Therefore, the applicability of the model so far is limited to the presented case-study and the robustness of the model needs to be assessed with care. While capturing the particular diffusion phenomenon presented here, it is unclear whether the mimicry mechanism can be generalized at all to other case studies and in particular to slower international policy diffusion patterns, such as the spread of environmental reforms. The COVID-19 policy tipping point remains an extraordinary situation, enabled by great uncertainty and a sense of danger. It might be useful to extend the model with more circumstantial parameters relevant for the pandemic, such as World Health Organization (WHO) recommendations on virus counter measures, which in all likelihood also a had a substantial influence on countries’ decisions. A model appealing to the more general case likely must draw from a greater diversity of diffusion mechanisms, such as those discussed in the literature review Section 2.1. Moreover, even in the particular case of peer mimicry alone, the dimensions considered (income, degree of democracy and geographical position) are far from the only plausible ones. We could have considered, for instance, trade relationships or international connectivity of airports or proceeded in more general terms, employing variables such as “cultural exchange” or “cultural proximity” (whose exact operationalization is challenging). We defer the exploration of further mimicry drivers to future extensions. Furthermore, our model is sensitive to and dependent on the initial-conditions for it to work. On first of March 2020 already 8% of countries had adopted a lockdown. This means while our model is perhaps able to explain the subsequent rapid diffusion, it lacks explanation for the beginning and for the early adopters of lockdown policies. Future work should reconsider this assumption. Ultimately, we have not attempted to construct the best possible national policy diffusion model but to come up with a working first order heuristic that can be optimized by data assimilation. In a real-world and real-time application, let us say another pandemic or another environmental and geopolitical crisis, an ABM could make predictions before an actual great shift in global policy has happened, and be “constrained by the data” as time goes on.
In terms of predicting rapid transitions, we by no means claim to have found a better approach than other prediction approaches, such as for example, Early Warning Signals (EWS) of tipping points. Early Warning Signals is an approach inferring generic signs of tipping points in time series data, such as unusual fluctuations and auto-correlations (Scheffer et al. 2009). Time series data however might not be always available. In our case study, there would have been no sufficiently long time series on countries switching in- and out of lockdowns. And even with the help of EWS it remains difficult to detect transitions. Our agent-based modelling approach, in combination with data assimilation, presents a complementary perspective that combines theory and data for prediction instead of only scanning for statistical anomalies.
Perhaps the most generalizable conclusion from our research is that we delivered a proof-of-concept that social and even political agent-based diffusion models can be combined with data assimilation. Social diffusion contains a large class of phenomena after all, ranging from product-diffusion to the spread of opinion and information in social media. Especially the latter often unfold rapidly and in real-time, on the order of seconds and minutes, with data being made available constantly. And there are numerous ABMs trying to capture these processes (Chen 2019; Kvasnička 2014). Hence, the combination of diffusion oriented ABMs and data assimilation likely offers promising research opportunities.
Outlook
As discussed above, the model performs best at the aggregate level but less so at modelling the micro-level, because the model does not produce particles that are much better than the mean quality of prediction and the particle filter hence can not find any optimum that is substantially beyond. In future work then, it must be imperative to improve the model rather than only the data assimilation algorithms.
Besides, a more nuanced model likely opens manifold new opportunities for data assimilation. We have so far reduced the model state to a binary variable (lockdown or no lockdown), even though the reality of course was far more complex than that. Countries actually implemented diverse sets of policies with varying degrees over specific issues (school closures for instance). Therefore, a first opportunity would be to consider a higher dimensional system state – with more categorical variables operationalizing the actual lockdown policies, possibly even numerical variables. For instance one such natural "complexification" would be to model subnational regions and apply data assimilation not only to the diffusion of policy guidelines but also to the actual behaviour of people - which would be particularly interesting from a data assimilation viewpoint since the data is likely to be more uncertain. For instance, rural regions may behaved differently than urban ones in terms of actual behavioral changes. People perhaps still mixed socially in urban and rural areas, despite officially stringent guidelines, and sometimes the awareness of countermeasures and behavioural guidelines may not have been developed completely. For instance in rural India, up to 20% of people may have not been aware of behavioural guidelines to prevent spread (Ali et al. 2023). A more complex system state however might go beyond what the particle filter can reasonably optimize, since with increasing system complexity, a particle filter becomes rapidly more computational expensive, as evidenced by attempts to apply the method to more complex agent-based models (Malleson et al. 2020; Ternes et al. 2022). Therefore other data assimilation algorithms that do not rely on a plethora of particles, like the Extended Kalman Filter, could be tested next, together with extensions of the model.
Acknowledgements
This project has received funding from the European Research Council (ERC) under the European Union’s Horizon 2020 research and innovation programme (grant agreement No. 757455).Code and Data Accessibility
All code and data relating to this study is open-access at https://github.com/eeyouol/covpol.References
ALI, J., Singh, S., & Khan, W. (2023). Health awareness of rural households towards COVID-19 pandemic in India: Evidence from rural impact survey of the World Bank. Journal of Public Affairs, 23(1), e2819. [doi:10.1002/pa.2819]
AXELROD, R. (1997). Advancing the art of simulation in the social sciences. In R. Conte, R. Hegselmann, & P. Terna (Eds.), Simulating Social Phenomena (pp. 21–40). Berlin Heidelberg: Springer. [doi:10.1007/978-3-662-03366-1_2]
AXTELL, R. L., & Farmer, J. D. (2022). Agent-based modeling in economics and finance: Past, present, and future. Journal of Economic Literature, Forthcoming.
BASS, F. M. (1969). A new product growth for model consumer durables. Management Science, 15(5), 215–227. [doi:10.1287/mnsc.15.5.215]
BAYBECK, B., Berry, W. D., & Siegel, D. A. (2011). A strategic theory of policy diffusion via intergovernmental competition. The Journal of Politics, 73(1), 232–247. [doi:10.1017/s0022381610000988]
BERCOVITCH, J., & Jackson, R. (2009). Conflict Resolution in the Twenty-First Century: Principles, Methods, and Approaches. Ann Arbor, MI: University of Michigan Press. [doi:10.3998/mpub.106467]
BOHLMANN, J. D., Calantone, R. J., & Zhao, M. (2010). The effects of market network heterogeneity on innovation diffusion: An agent-based modeling approach. Journal of Product Innovation Management, 27(5), 741–760. [doi:10.1111/j.1540-5885.2010.00748.x]
BRAUN, D., & Gilardi, F. (2006). Taking ’Galton’s problem’ seriously: Towards a theory of policy diffusion. Journal of Theoretical Politics, 18(3), 298–322. [doi:10.1177/0951629806064351]
BROOKS, S. M. (2004). What was the role of international financial institutions in the diffusion of social security reform in Latin America? In K. Weyland (Ed.), Learning from Foreign Models in Latin American Policy Reform (pp. 53–80). Washington, DC: Woodrow Wilson Center Press and Johns Hopkins University Press.
CHEN, Z. (2019). An agent-based model for information diffusion over online social networks. Papers in Applied Geography, 5(1-2), 77–97. [doi:10.1080/23754931.2019.1619193]
CHETTY, R., Friedman, J. N., Hendren, N., Stepner, M., & The Opportunity Insights Team. (2020). How did Covid-19 and stabilization policies affect spending and employment? A new real-time economic tracker based on private sector data. NBER Working Paper Series. Available at: http://www.nber.org/papers/w27431. [doi:10.1093/qje/qjad048]
CLAY, R., Ward, J. A., Ternes, P., Kieu, L.-M., & Malleson, N. (2021). Real-time agent-based crowd simulation with the Reversible Jump Unscented Kalman Filter. Simulation Modelling Practice and Theory, 113, 102386. [doi:10.1016/j.simpat.2021.102386]
CUEVAS, E. (2020). An agent-based model to evaluate the COVID-19 transmission risks in facilities. Computers in Biology and Medicine, 121, 103827. [doi:10.1016/j.compbiomed.2020.103827]
DALY, M., Ebbinghaus, B., Lehner, L., Naczyk, M., & Vlandas, T. (2020). Oxford Supertracker: The global directory for COVID policy trackers and surveys. Department of Social Policy and Intervention. Available at: https://supertracker.spi.ox.ac.uk/about/.
DELLI Gatti, D., Fagiolo, G., Gallegati, M., Richiardi, M., & Russo, A. (2018). Agent-Based Models in Economics: A Toolkit. Cambridge: Cambridge University Press.
DOBBIN, F., Simmons, B., & Garrett, G. (2007). The global diffusion of public policies: Social construction, coercion, competition, or learning? Annual Review of Sociology, 33, 449–472. [doi:10.1146/annurev.soc.33.090106.142507]
DOUCET, A., Godsill, S., & Andrieu, C. (2000). On sequential Monte Carlo sampling methods for Bayesian filtering. Statistics and Computing, 10(3), 197–208. [doi:10.1093/oso/9780199278657.003.0022]
ECONOMIST Intelligence Unit. (2020). Democracy Index 2019 - A year of democratic setbacks and popular protest. Available at: https://www.eiu.com/topic/democracy-index.
EDMONDS, B., Le Page, C., Bithell, M., Chattoe-Brown, E., Grimm, V., Meyer, R., Montañola-Sales, C., Ormerod, P., Root, H., & Squazzoni, F. (2019). Different modelling purposes. Journal of Artificial Societies and Social Simulation, 22(3), 6. [doi:10.18564/jasss.3993]
EDMONDS, B., & Moss, S. (2005). From KISS to KIDS: An “anti-Simplistic” modelling approach. In P. Davidsson, B. Logan, & K. Takadama (Eds.), Multi Agent Based Simulation (pp. 130–144). Berlin Heidelberg: Springer. [doi:10.1007/978-3-540-32243-6_11]
EPSTEIN, J. M. (2008). Why model? Journal of Artificial Societies and Social Simulation, 11(4), 12.
FUCHS-SCHÜNDELN, N. (2022). Covid-Induced school closures in the US and Germany: Long-Term distributional effects. Economic Policy, 37(112), 609–639.
GAUTIER, L., De Allegri, M., & Ridde, V. (2021). Transnational networks’ contribution to health policy diffusion: A mixed method study of the performance-based financing community of practice in Africa. International Journal of Health Policy and Management, 10(6), 310. [doi:10.34172/ijhpm.2020.57]
GILARDI, F. (2016). Four ways we can improve policy diffusion research. State Politics & Policy Quarterly, 16(1), 8–21. [doi:10.1177/1532440015608761]
HALE, T., Angrist, N., Goldszmidt, R., Kira, B., Petherick, A., Phillips, T., Webster, S., Cameron-Blake, E., Hallas, L., Majumdar, S., & Tatlow, H. (2021). A global panel database of pandemic policies (Oxford COVID-19 Government Response Tracker). Nature Human Behaviour, 5(4), 529–538. [doi:10.1038/s41562-021-01079-8]
HERRE, B., & Roser, M. (2013). Democracy. Available at: https://ourworldindata.org/democracy.
HU, X. (2022). Data assimilation for simulation-Based real-Time prediction/Analysis. IEEE 2022 Annual Modeling and Simulation Conference (ANNSIM). [doi:10.23919/annsim55834.2022.9859329]
KAI, D., Goldstein, G.-P., Morgunov, A., Nangalia, V., & Rotkirch, A. (2020). Universal masking is urgent in the COVID-19 pandemic: SEIR and agent based models, empirical validation, policy recommendations. arXiv preprint. arXiv:2004.13553
KALNAY, E. (2003). Atmospheric Modeling, Data Assimilation and Predictability. Cambridge: Cambridge University Press.
KERR, C. C., Stuart, R. M., Mistry, D., Abeysuriya, R. G., Rosenfeld, K., Hart, G. R., Núñez, R. C., Cohen, J. A., Selvaraj, P., Hagedorn, B., George, L., Jastrzębski, M., Izzo, A. S., Fowler, G., Palmer, A., Delport, D., Scott, N., Kelly, S. L., Bennette, C. S., … Klein, D. J. (2021). Covasim: An agent-based model of COVID-19 dynamics and interventions. PLOS Computational Biology, 17(7), e1009149. [doi:10.1371/journal.pcbi.1009149]
KIESLING, E., Günther, M., Stummer, C., & Wakolbinger, L. M. (2012). Agent-based simulation of innovation diffusion: A review. Central European Journal of Operations Research, 20(2), 183–230. [doi:10.1007/s10100-011-0210-y]
KINGDON, J. W. (1984). Agendas, Alternatives, and Public Policies. Boston, MA: Little.
LORIG, F., Johansson, E., & Davidsson, P. (2021). Agent-based social simulation of the COVID-19 pandemic: A systematic review. Journal of Artificial Societies and Social Simulation, 24(3), 5. [doi:10.18564/jasss.4601]
LUECK, J., Rife, J. H., Swarup, S., & Uddin, N. (2019). Who goes there? Using an agent-based simulation for tracking population movement. Winter Simulation Conference, National Harbor, MD, USA. [doi:10.1109/wsc40007.2019.9004861]
LUNDGREN, M., Klamberg, M., Sundström, K., & Dahlqvist, J. (2020). Emergency powers in response to COVID-19: Policy diffusion, democracy, and preparedness. Nordic Journal of Human Rights, 38(4), 305–318. [doi:10.1080/18918131.2021.1899406]
LUYET, S. (2011). Policy diffusion: An agent-based approach. Available at: https://serval.unil.ch/resource/serval:BIB_2C7230CA9240.P001/REF.pdf.
MALLESON, N., Minors, K., Kieu, L.-M., Ward, J. A., West, A., & Heppenstall, A. (2020). Simulating crowds in real time with agent-Based modelling and a particle filter. Journal of Artificial Societies and Social Simulation, 23(3), 3. [doi:10.18564/jasss.4266]
MISTUR, E. M., Givens, J. W., & Matisoff, D. C. (2020). Contagious COVID-19 policies: Policy diffusion during times of crisis. Review of Policy Research, 40(1), 36–62. [doi:10.1111/ropr.12487]
MORSE, S. S., Mazet, J. A. K., Woolhouse, M., Parrish, C. R., Carroll, D., Karesh, W. B., Zambrana-Torrelio, C., Lipkin, I., & Daszak, P. (2012). Prediction and prevention of the next pandemic zoonosis. The Lancet, 380(9857), 1956–1965. [doi:10.1016/s0140-6736(12)61684-5]
O’LOUGHLIN, J., Ward, M. D., Lofdahl, C. L., Cohen, J. S., Brown, D. S., Reilly, D., Gleditsch, K. S., & Shin, M. (1998). The diffusion of democracy, 1946–1994. Annals of the Association of American Geographers, 88(4), 545–574.
RAPAPORT, O., Levi-Faur, D., & Miodownik, D. (2009). The puzzle of the diffusion of central-Bank independence reforms: Insights from an agent-Based simulation. Policy Studies Journal, 37(4), 695–716. [doi:10.1111/j.1541-0072.2009.00331.x]
RING, J. (2014). An agent-based model of international norm diffusion. Available at: https://myweb.uiowa.edu/fboehmke/shambaugh2014/papers/Ring_Diffusion_of_Norms__ABM_Approach.pdf
SCHEFFER, M., Bascompte, J., Brock, W. A., Brovkin, V., Carpenter, S. R., Dakos, V., Held, H., Van Nes, E. H., Rietkerk, M., & Sugihara, G. (2009). Early-warning signals for critical transitions. Nature, 461(7260), 53–59. [doi:10.1038/nature08227]
SEBHATU, A., Wennberg, K., Arora-Jonsson, S., & Lindberg, S. I. (2020). Explaining the homogeneous diffusion of COVID-19 nonpharmaceutical interventions across heterogeneous countries. Proceedings of the National Academy of Sciences, 117(35), 21201–21208. [doi:10.1073/pnas.2010625117]
SHEN, G. C. (2014). Cross-national diffusion of mental health policy. International Journal of Health Policy and Management, 3(5), 269. [doi:10.15171/ijhpm.2014.96]
SHIPAN, C. R., & Volden, C. (2008). The mechanisms of policy diffusion. American Journal of Political Science, 52(4), 840–857. [doi:10.1111/j.1540-5907.2008.00346.x]
SHUKLA, P. R., Skea, J., Reisinger, A., Slade, R., Fradera, R., Pathak, M., Al, A., Malek, K., Van Diemen, B. R., Hasija, A., Lisboa, G., Luz, S., Malley, J., Mccollum, D., & Some, S. (2022). Climate change 2022 - Mitigation of climate change. Working Group III. Contribution to the Sixth Assessment Report of the Intergovernmental Panel on Climate Change Summary for Policymakers. Available at: www.ipcc.ch.
SIMMONS, B. A., Dobbin, F., & Garrett, G. (2006). Introduction: The international diffusion of liberalism. International Organization, 60(4), 781–810. [doi:10.1017/s0020818306060267]
SIMMONS, B. A., & Elkins, Z. (2004). The globalization of liberalization: Policy diffusion in the international political economy. American Political Science Review, 98(1), 171–189. [doi:10.1017/s0003055404001078]
TANG, D., & Malleson, N. (2022). Data assimilation with agent-based models using markov chain sampling. arXiv Preprint arXiv:2205.01616. [doi:10.12688/openreseurope.14800.1]
TECHSLIDES.COM. (2016). List of countries and capitals. Available at: http://techslides.com/list-of-countries-and-capitals.
TERNES, P., Ward, J. A., Heppenstall, A., Kumar, V., Kieu, L.-M., & Malleson, N. (2022). Data assimilation and agent-based modelling: Towards the incorporation of categorical agent parameters. Open Research Europe, 1. [doi:10.12688/openreseurope.14144.2]
TEWS, K., Busch, P.-O., & Jörgens, H. (2003). The diffusion of new environmental policy instruments. European Journal of Political Research, 42(4), 569–600. [doi:10.1111/1475-6765.00096]
WANG, M., & Hu, X. (2015). Data assimilation in agent based simulation of smart environments using particle filters. Simulation Modelling Practice and Theory, 56, 36–54. [doi:10.1016/j.simpat.2015.05.001]
WARD, J. A., Evans, A. J., & Malleson, N. S. (2016). Dynamic calibration of agent-based models using data assimilation. Royal Society Open Science, 3(4), 150703. [doi:10.1098/rsos.150703]
WORLD Bank. (2022). GDP, PPP (constant 2017 international $). Available at: https://data.worldbank.org/indicator/NY.GDP.MKTP.PP.KD.
XIAO, Y., & Han, J. (2016). Forecasting new product diffusion with agent-based models. Technological Forecasting and Social Change, 105, 167–178. [doi:10.1016/j.techfore.2016.01.019]
ZHANG, Y., & Zhu, X. (2019). Multiple mechanisms of policy diffusion in China. Public Management Review, 21(4), 495–514. [doi:10.1080/14719037.2018.1497695]
ZIMM, C. (2021). Improving the understanding of electric vehicle technology and policy diffusion across countries. Transport Policy, 105, 54–66. [doi:10.1016/j.tranpol.2020.12.012]