Peter Tucker and Isobel Fletcher (2000)
Simulating Household Waste Management Behaviours Part 2: Home Composting
Journal of Artificial Societies and Social Simulation
vol. 3, no. 3,
To cite articles published in the Journal of Artificial Societies and Social Simulation, please reference the above information and include paragraph numbers if necessary
<https://www.jasss.org/3/3/2.html>
Received: 9-Apr-00 Accepted: 13-Jun-00 Published: 30-Jun-00
 Abstract

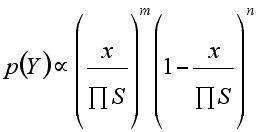
where S are the socio-demographic descriptors and x represents the scale unit (Kg. or strength of attitude etc.). m and n are fixed model parameters, estimated from observational or survey data or set through empirical adjustment. The beta function is assumed throughout. The major socio-demographic descriptors used in the model are housing type, stage in family life cycle, household size and car ownership (Tucker and Smith 1999, ¶2.9).

|
| Figure 1. Compost Model Schematic |
If Have_bin = true thenHave_bin is the facilitating condition of having a compost bin or other home composting facility, such as a heap or box. CA is the set of general pro-composting attitudes which includes gardening attitudes proxied by garden size, L represents specific barriers arising from lifestyle irregularities (holidays, illness, adverse weather etc.), W is the available weight of compostable materials generated, W0 is a threshold weight above which composting is perceived worthwhile, and CB encompasses all the other perceived barriers that might prevent composting, including lack of self-belief. Social pressures to compost are described in terms of the local behavioural norm, N, and the individual's susceptibility c to comply with that norm. Intention expresses the pre-meditated intention to behave (i.e. add materials to the compost heap) during a given week. Intention is converted into behaviour if the facilitating conditions L allow. In developing this rule base, it has been assumed that each of the antecedent factors can be expressed on a common metric (see Tucker and Smith, 1999 (Tucker and Smith 1999, ¶2.28)).
If CA + cN > CB + L then
if W > W0 then Intention = true
Score = o1 x( CA - CB ) + o2 x Wgarden + rnd
Wgarden is the mean weight arisings of garden waste, assumed to be a function of garden size (which is a distributed variable estimated from housing type and housing density). o1 and o2 are scaling constants and rnd is a random increment. The attitudes and barriers CA and CB are drawn randomly from their assumed 'generic' distributions, and scaled according to housing type and the stage in family lifecycle of the residents.
If Have_bin = 0 and CA> CB then:I_Susc is the individual's susceptibility to external stimuli and I_Strength is the strength of the intevention.
If I_Susc x I_Strength + rnd > trigger value, then Have_bin = 1
If DCA > 0 and CA - CB > 0 thenDCA is a positive increment in pro-composting attitude, triggered by background events or through social contact. Such triggering events are programmed to occur randomly around a given frequency of occurrence. DCA is scaled according to the susceptibility of the individual to external influence I_Susc or by the susceptibility to normative influence c, whichever is appropriate.
if ( CA - C) x DCA + rnd > trigger then Have_bin = 1
If I + E > Itrigger then Ignorant = true
Loss through forgetfulness = F x f x rndThe threshold value Itrigger and the scaling factor f are material specific. I is a the general household ignorance level, E is their composting proficiency, and F is their propensity to forget.
W(p) = [ W x CNoptimum - Si ( W(i) x CN(i)) ] / CN(p)where the summation is made over all organic waste categories (i) and CN(i) are the carbon to nitrogen ratios for each individual category i.
T is assumed to vary sinusoidally with time of year, between an average weekly minimum temperature Tmin and an average weekly maximum temperature Tmax according to locality.
It takes a certain critical mass to stimulate the faster exothermic reactions which are important in reducing pathogen levels and in reducing the survival rate of any weed seeds or diseases that might be contained in the input material.
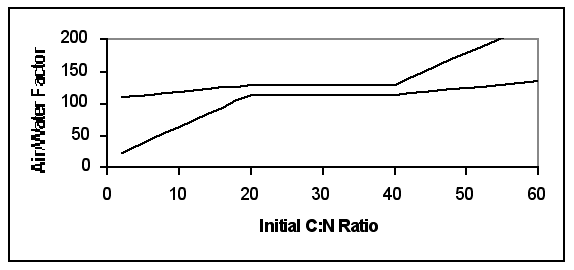
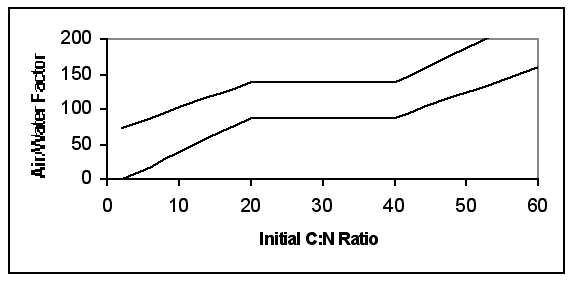
Sufficient oxygen and sufficient but not excessive moisture are both important to progressing the aerobic composting process. Insufficient air, often coupled with excessive moisture, can turn the reaction anaerobic, which is a slower stabilisation process, likely to produce a 'slimy' product and an odour nuisance as well. At the other extreme, insufficient moisture can also inhibit compost degradation. The prototype model does not distinguish separately between air and water requirements, but utilises a combined air/water factor, A. The factor is configured on the arbitrary scale ranging from 0 (no air), through 125 (optimum conditions), to 250 (completely dry).
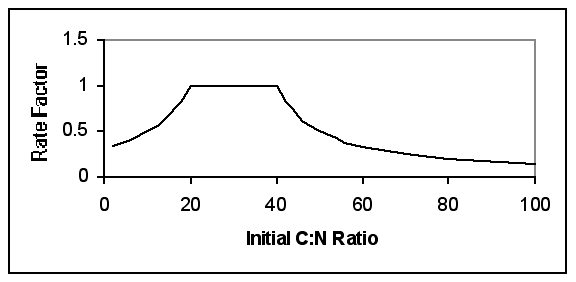
DP / Dt = ( Pf - P ) x ( a1 m + a2 exp [- a3 T b ] ) x fn.( A ) x fn.( CN0 ) x fn.( E )where a1 , a2 , a3 , b are empirical coefficients, and Pf is the progress level relating to fully stable compost. It is implicit in this formulation that the rate of progress decreases with increasing progress, i.e. the later stages of compost maturation will take place much more slowly than the initial stages of degradation.

|

|
| Figure 2. Assumed Empirical Model Rate Functions |
h = E / Etrigger + rnd
fn.( E ) = 1, if h > 1, else fn.( E ) = hEtrigger is the threshold level of proficiency, above which a composter is considered to be proficient.
m = m0 x ( 1 - f P / Pf)where m0 is the total weight initially input into the reaction stage and f is the expected mass ratio of finished compost to its raw materials, typically around 0.5 on a wet weight basis (White et al., 1996).
A = A0 - j P / Pf + rndwhere A0 is the initial air content and j is a fixed constant. A small random term, which can be either negative or positive is also introduced to provide for unexplained variations. The amplitude of the random term is scaled according to proficiency, becoming larger for the less proficient.

|

|
| Figure 3. Assumed Upper and Lower Tolerance Limits for Initial Air/ Water factor Settings (Moderately proficient and Novice Composters respectively) |
The mean frequency of the turning event is linked to composting proficiency, from once every eight weeks (on average) for a proficient composter and at progressively longer intervals with decreasing proficiency.
If E / Etrigger + 2 x rnd > 2 when E < Etriggeror 2 x rnd > 1 when E >= Etrigger
rnd is a random number in the range 0 to 1.
In the model, turning the bin acts to homogenise the three layers, with the whole of the new mixture taking on the weighted mean progress of all the three former layers. The turning of the compost provides aeration. The air/ moisture factor for the mixed compost is set back to the optimum starting value.
The model allows the approximate incidence of problems to be set through a control parameter, Zest, the percentage of households per week that are affected. On each household inspection event, the initial estimate of F is modified to take account of the potential problems flagged in the quality index Q:
Z = ( a1 x a2 / a3 ) x b Zest + ( 1 - b ) Zest x (Family life cycle stage) / 3The multipliers a are set to 1 if no there are no flagged entries in the quality log Q, but are set to a value higher than 1 if specific problems are flagged. a1 refers to the incidence of relatively high quantities of non-fruit and vegetable kitchen waste, which might increase the possibility of attracting vermin. a2 refers to significant levels of 'non-compostable' garden waste which may increase the incidence of disease or give obvious signs of recalcitrant breakdown. a3 reduces the incidence of problems if the compost has passed through a thermophilic phase. The residual components of F refer to the possibility of other (unspecified) problems such as excessive weed growth, fly infestations etc. The partition coefficient b is used to isolate any problems that may be caused through the onset of composters' health problems, as distinct to compost quality problems. Health problems are highlighted in the DETR (1998) survey as a major cause of drop-out. The probability of health-related problems is assumed to increase with age.
If Z > rnd then the recognition of a real problem, of genuine concern, is assumed.On experiencing a problem, the composting household is modelled as taking one of three actions:
If R' x CA x I_Susc x H > s1 x rnd then help is sought and taken,
else if R > Rtrigger composting behaviour continues unchanged,
else the perceived barriers to composting CB are incremented by a factor: s2x R' x rndwhere R' = Rtrigger - R when R < Rtrigger or R' = 1 when R >= Rtrigger
R is the resilience of the household to set-backs. CA is the pro-composting attitude, I_Susc is the susceptibility to external influence, and H is the accessibility to good help. s1 and s2 are scaling factors. The adverse reaction is considered to weaken the resolve to continue home composting. The consequence may be (but will not necessarily be) that the participant discontinues their composting activity. Continuation of participation will be determined by the subsequent computation of the participation rule (If CA < CB then participation is false). The likelihood of this inequality being satisfied will increase each time CB is incremented, that is with a cumulation of experienced problems. Help is considered most likely to be taken where the combination of pro-composting attitudes, resilience, and susceptibility to external influence are high, and if help is easily accessible, e.g. through an official telephone help-line, or professional centre. Reliance on self-help through books and magazines is assumed to be weaker. If help is taken, the model triggers an increase in proficiency and assumes that the current problem is alleviated, by resetting the relevant flags in the quality index Q. Proficiency is also increased by a random increment following the acceptance of the help and advice.
An inspection event is triggered for every composter at random intervals around an average of once per three months. If the progress indicator for the basal layer of compost is above a critical threshold, then the compost is deemed ready for extraction. The model extraction involves the removal of the whole basal layer. If the progress indicator has not yet reached the critical threshold level, the compost is deemed to be not yet ready. Two consequences arise: If R < Rtrigger and E < Etrigger then a random chance is invoked that the individual will perceive slowness to be a problem. If so, the perceived barrier to composting CB is then incremented by a small random amount. This simulates impatience. Repeated findings, by a non-proficient and non-resilient individual, that their compost is not ready could eventually shift their attitude/ barrier balance and lead to their drop-out. If, however, the above inequality is false, the individual is considered to continue composting as before, and the compost is re-inspected at a later date. The quality indicator Q provides a basis for an indicative quality assessment of any extracted compost. The main discriminators available for this assessment are whether the compost passed through a thermophilic stage and whether it turned anaerobic. The quality of the latter is judged to be 'possibly problematic', whilst the quality of the 'thermophilic' compost is judged to be good. If neither problem was flagged, the quality is judged to be 'acceptable'. Whilst these hard and fast boundaries are retained in the current model, extended experience with the model may show that distinctions may need to be made more fuzzy through an addition of a small random element. It is also assumed that if the production of compost that is at least satisfactory, it will generate experiential learning. The composter would remember (at least roughly) what they did this time, and should do it at least as well in the future, unless of course adverse random events stack up less favourably next time. This 'experiential learning' is modelled by adding a small random increment to the proficiency E if acceptable compost is produced, and by adding a larger random increment if good-quality compost is produced. If, however, the quality of the extracted compost is judged to be problematic then, like experiencing running problems, the composter may seek help, continue as before, or sustain an adverse reaction. These consequences are modelled similarly to the consequences of the running problems, as described above.
| Table 1: Organic Flux Classification | ||
| UK Prime Organic Category | UK 33-Category Classification | Model Classification |
| Putrescibles | Kitchen putrescibles | 1. Uncooked Veg & Fruit |
| 2. Cooked food, meat & fish | ||
| Garden putrescibles | 3. Soft green waste | |
| 4. More woody waste | ||
| 5. Non-compostable material* | ||

|
| Figure 4. Model fit to Survey data by Electoral Ward |

|
| Figure 5. Weights diverted into the Compost Bin |

|
| Figure 6. Composition of Materials Composted |

|
| Figure 7. Cumulative Frequency Distribution of the Proportions of Uncooked Kitchen Fruit and vegetable Waste Added |
| Table 2: Reasons for Non-Diversion of Part or All Uncooked Kitchen Fruit and Vegetable Waste | |||
| Model | Survey | ||
| Dominant Control Rule | % | Reason | % |
| Forgetfulness | 46 | Forget | 31 |
| Not enough waste | 23 | Not enough waste | 15 |
| Lifestyle irregularity on a given week | 14 | Inconvenient | 17 |
| Ignorance | 11 | Unsure it can be composted | 11 |
| Reasoned judgement | 6 | Unhygenic or unpleasant Fed to pets Will upset balance of compost | 4 1 1 |
Too much bother | 13 | ||
| Other | 7 | ||
| Table 3: Frequencies of Occurrence of Behavioural Events | |||||
| Model | Survey | ||||
| Behaviour | Time period | % | Behaviour | Time period | % |
| Drop out | 3 yrs | 10 | Lapsed (promotional takers) | 1 - 3 yrs | 6 |
| Never composted (promotional takers) | 1 - 3 yrs | 4 | |||
| Lapsed (non takers) | unknown | 19 | |||
| New recruits (outside promotion) | 3 yrs | 7 | Started in last 3 yrs (non takers) | 3 yrs | 7 |
| Help taken | 3 yrs | 16 | Help taken | 1 - 3 yrs | 15 |

|
| Figure 8. Simulated Net Behavioural Change over Three Years. |
| Table 4: Reasons for Drop-out from Home Composting | |||
| Model | Survey | ||
| Activating Rule | % | Reason | % |
| Household mobility | 34 | Moved house | 30 |
| Problematic finished compost Anaerobic running problem Process to slow | 19 9 3 | Unsuccessful/inefficient/smells | 25 |
| Unspecified reason | 39 | Other | 29 |
| Excess non fruit/vegetable kitchen waste | 6 | Vermin | 2 |
| Insufficient waste | 8 | ||
| Insufficient time | 6 | ||

|
| Figure 9. Relationship between Model Parameters in Model Calibration |

|
| Figure 10. Sensitivity Analysis of the Forgetfulness Scaling Factor on Weight Recovery (Each data point refers to a different model run). |

|
| Figure 11. Sensitivity Analysis of the Perceived Barrier Strength Scaling Factor on Participation Rates. (Each data point refers to a different model run). |
| Table 5: Help needed/available/ taken | ||
| Problems | No problems | |
| Not needed | 36 | 134 |
| Not available/ not sought | 32 | 10 |
| Help taken | 13 | 22 |
| % taking advice | 16 | 13 |

|
| Figure 12. Sustainability of Participation: Model Effects of Increased Positive Stimuli |

|
| Figure 13. Effects of a Weakening of Pro-composting Stimuli |

|
| Figure 14. Long-term Effects of Different Intensities of Promotion |

|
| Figure 15. The Effect of a Promotional Campaign in Communities with Different Levels of Prior Participation |

|
| Figure 16. Total Weight of Material Composted per Participant per Week |

|
| Figure 17. Weights of Paper contributed per Participant per Week |

|
| Figure 18. Weekly Production of Poor Quality Compost as a Function of Levels of Available Help |

|
| Figure 19. Yearly Averages of Poor Quality Compost as a Function of Levels of Available Help |
BAGOZZI, R.P., Baumgartner, H., Youjai, Y. (1992), State versus Action Orientation and the Theory of Reasoned Action: An Application to Coupon Usage. J. Consumer Research, 1992, 18, pp. 505-508.
BOLDERO, J. (1995), The Prediction of Household Recycling of Newspapers: The Role of Attitudes, Intentions and Situational Factors. Journal of Applied Social Psychology, 25(5), pp. 440-462.
DAHAB, D.J., Gentry, J.W., Su, W. (1995), New Ways to Reach Non-recyclers: An Extension of the Model of Reasoned Action to Recycling Behaviourss. Adv Consumer Res., 1995, 22, pp. 251-256.
DAS, K. & Keener, H.M., (1997), Numerical Model for the Dynamic Simulation of a Large Scale Composting System. Transactions American Society of Agricultural Engineers, Vol.40(4), pp 1179 - 1189.
DETR, 1998, Home Composting in England and Wales. October, 1998.
DETR,1999a, A Way with Waste. A Draft Waste Strategy for England and Wales. Part One. June 1999.
DETR, 1999b, Limiting Landfill: A Consultation paper on limiting landfill to meet the EC Landfill Directive's targets for the landfill of biodegradable municipal waste. October 1999.
DOE. 1994, National Household Waste Analysis Programme, Phase 2, Vol 1. Report No. CWM O82/94. Department of the Environment: London, 1994.
ENDS, 2000, Waste Management, "Slim your bin" campaign yet to change consumer behaviour. The ENDS Report No. 301, February 2000.
FLETCHER, I., Durrant, A.P., Tucker, P. (2000), COMPOST MODELLING - A Literature Review of Existing Models and Their Applicability to Domestic Composting. Progress in Environmental Science, 2(2) in press.
FLETCHER, S.I., Speirs, D., Durrant, A.P., Tucker,P. (forthcoming) Recovery and Composition of Kitchen and Paper Wastes in Home Composting. Environmental & Waste Management (submitted).
GOLDENHAR, L.M. and Connell, C.M. (1993), Understanding and Predicting Recycling Behavior: An Application of the Theory of Reasoned Action. Journal of Environmental Systems, 1993, 22(1), pp. 9-103.
GUAGNANO, G.A., Stern, P.C., Dietz, T. (1995), Influences on Attitude-Behavior Relationships. A Natural Experiment with Curbside Recycling. Environment and Behaviour, 1995, 27(5), pp. 699-718.
JONES, R.E. (1990), Understanding Paper Recycling in an Institutionally Supportive Setting: An Application of the Theory of Reasoned Action. Journal of Environmental Systems, 1990, 19(4), pp. 307-321.
PIETERS, R.G.M. (1989), Attitudes and Behavior in a Source Separation Program. A Garbology Approach, Eurobon: Delft, The Netherlands.
PORTER, B.E., Leeming, F.C., Dwyer, W.O. (1995), Solid Waste Recovery: A Review of Behavioural Programs to Increase Recycling. Environment and Behavior, 1995, 2, pp.122-152.
SCHULTZ, P.W., Oskamp, S. Mainieri, T. (1995), Who Recycles and When? A Review of Personal and Situational Factors. Journal of Environmental Psychology, 1995, 15, pp. 105-121.
STOMBAUGH, D.P. & Nokes, S.E., 1996, 'Development of a Biologically Based Aerobic Composting Simulation Model', Transactions American Society of Agricultural Engineers, 1996, Vol.39(1), pp 239 - 250.
TAYLOR, S. and Todd, P. (1995), An Integrated Model of Waste Management Behavior: A Test of Household Recycling and Composting Intentions. Environment and Behaviour, 1995, 27(5), pp. 603-30.
TUCKER, P., (1997-98), Accounting for spatial and temporal variabilities in household waste recycling schemes: a simulation approach. Journal of Environmental Systems, 1997-98, 26(4).
TUCKER, P. (1999a), A Survey of Attitudes and Barriers to Kerbside Recycling. Environmental and Waste Management, 1999, 2(1), pp. 55-63.
TUCKER, P. (1999b), Normative Influences in Household Waste Recycling. Journal of Environmental Planning & Management, 1999, 42(1), pp. 63-82.
TUCKER, P., Smith, D. (1999), Simulating Household Waste Management Behaviour. Journal of Artificial Societies and Social Simulation, 1999, vol. 2, no. 3, https://www.jasss.org/2/3/3.html
TUCKER, P., Murney, G., Lamont, J. (1997), Participation in Recycling: A Comparative Study of Four Kerbside Collection Schemes. J. Waste Management and Resource Recovery, 4(1), pp 11-26.
TUCKER, P., Murney, G., Lamont, J. (1998a), Predicting Recycling Scheme Performance: A Process Simulation Approach. J. Environmental Management, 52, pp 31-48.
TUCKER, P. Murney, G., Lamont, J. (1998b), A Decision Support Model for the Management of Recycling Schemes. J. Environmental Planning and Management, 41(4), pp 445-462.
TUCKER, P., Murney, G., Lamont, J. (1998c), What Newspaper Recyclers Recycle and What they do not Recycle. Environmental and Waste Management, 1(1), pp 33-56.
TUCKER, P., Lamont, J., Murney, G., Smith, D. (1998d), Material Capture Rates in Household Waste Recycling Schemes. Environmental and Waste Management, 1(3), pp 169-181.
TUCKER, P., Speirs, D. & Smith, D. (2000), The Impact of a Change in Collection Frequency on Kerbside Recycling Behaviours. J. Environmental Planning and Management, 43(3), pp 335-350.
TUCKER, P., Speirs, D., Fletcher, D. (forthcoming), Factors Affecting Take-Up and Drop-Out From Home Composting Schemes. Sustainable Development (submitted).
WASTE WATCH. (1998). What People think about Waste. Waste Watch: London.
WERNER, C.M., Turner, J., Shipman, K., Twitchell, S., Dickson, B.R., Brushke, G.V., Von Bismarck, W.B. (1995), Commitment, Behavior and Attitude Change: An Analysis of Voluntary Recycling. J. Env. Psychology, 1995, 15, 197-208.
WHITE, P.R., Franke, M., Hindle, P. (1996). Integrated Solid Waste Management. A Lifecycle Inventory. Blackie Academic & Professional: Bishopbriggs, Glasgow.
Return to Contents of this issue
© Copyright Journal of Artificial Societies and Social Simulation, 1999