© Copyright JASSS

  JASSS logo ----

Michael Möhring and Klaus G. Troitzsch (2001)

Lake Anderson Revisited by Agents

Journal of Artificial Societies and Social Simulation vol. 4, no. 3,
<https://www.jasss.org/4/3/1.html>

To cite articles published in the Journal of Artificial Societies and Social Simulation, please reference the above information and include paragraph numbers if necessary

Received: 19-Mar-01      Accepted: 8-May-01      Published: 30-Jun-01


* Abstract

In our paper, we replicate simulation experiments carried out some 30 years ago by Jay M. Anderson who then tried to find out which measures should be taken to avoid the eutrophication of a lake. In his DYNAMO model, he simulated the development of a lake under cultural eutrophication, i.e. mainly by the discharge of fertilisers from agriculture. He designed a number of policies and applied them as an experimenter. In our model, some of the policies suggested by Anderson are taken by a government (or, alternatively, by a number of regional governments) who are in charge of the region(s) around the lake. We define rules which the authorities apply when they find that some of the variables which describe the state of the lake exceed (or fall below) certain thresholds. In a next step of refinement of the model, authorities will still define thresholds, but will not take all possible measures themselves, but charge the farmers with taxes when they exceed the fertiliser discharge limit. Farmers will then be endowed with rules which tell them whether it is better for them to pay the taxes or take appropriate measures against eutrophication themselves. The rationale of our paper is to show how stepwise refinement of a model can contribute to our understanding of the interactions between water resource decision makers of different levels and the natural environment. It is part of our efforts to develop agent-based models for application to issues of water treatment - as is done in the FIRMA project[1].

Keywords:
Water Management, Stepwise Refinement, Multilevel Modelling

* Replication of experiments carried out by Jay M. Anderson

1.1
We describe "Lake Anderson", a MIMOSE version of Jay M. Anderson's original model[2] in which he modelled a lake which suffers from cultural eutrophication, i.e. the intake of fertilisers from agricultural areas around the lake. The results of this cultural eutrophication are contrasted to natural eutrophication, i.e. the natural production of fertilisers by the biomass itself. Anderson's model was designed to carry out hydrological (limnological) experiments with the computer model of a lake which should respond to a number of measures more or less like a real lake. Anderson's paper is in the tradition of system dynamics, and it "develops an extremely simple formal model for the eutrophication of lakes" (Anderson 1973:121). It identifies four variables which "are necessary to construct an answer to our principal question, how can cultural eutrophication effectively be arrested?" These variables are "a nutrient, a biotic population, decaying detritus, and oxygen" (ibidem).

1.2
The DYNAMO program presented in Anderson's article was more or less exactly translated into MIMOSE, with the main exception that the artificial nutrient discharge increase rate (of normally 2 per cent per year - or, in some experiments, of 0 per cent or -2 per cent per year) was modelled with a differential equation instead of a table function of time.

1.3
In our paper, we do not only want to replicate Anderson's original experiments (which we do only for the sake of calibrating the basic MIMOSE version of the model), but to extend the model in the direction of representing potential polluters and local administrations directly in the model, thus replacing the role of an experimenter with the roles of farmers and government bodies who control the eutrophication and the measures taken against eutrophication. The current section replicates and calibrates the MIMOSE version, while the second section introduces local authorities, the third section introduces farmers and the conclusion gives an outlook to further extensions .

* Variables of the System Dynamics model

2.1
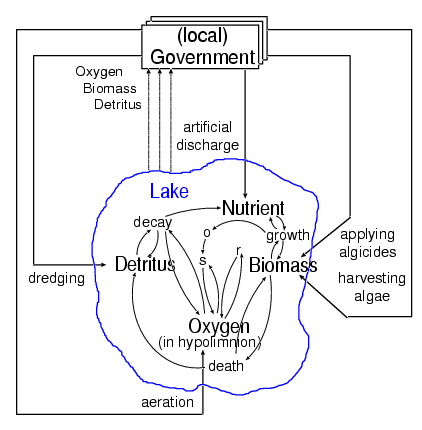
The behaviour of the lake is described in a number of equations for the following main "level" variables:

nutrient: the amount of fertiliser and other nutrients in the lake, increased by fertiliser discharge, by respiration and decay of the biomass, and decreased by the growth of the biomass,
biomass: the amount of algae in the lake, increased by their growth, and decreased by their death rate, by respiration and, possibly, by harvesting algae,
detritus: the amount of sediment at the bottom of the lake, increased by dying algae, and decreased by detritus decay and, possibly, by dredging the lake bottom,
oxygen: the concentration of oxygen available to the algae for their metabolism; this level variable is composed of two parts, the epilimnion oxygen concentration (which is considered to be constant because the epilimnial oxygen is always replenished from the air above the lake surface) and the hypolimnion oxygen concentration which is increased by the diffusion of oxygen from the epilimnion into the hypolimnion, and decreased by the oxygen consumption (due both to the respiration of the algae and to the detritus decay process) and, possibly, by artificial aeration.
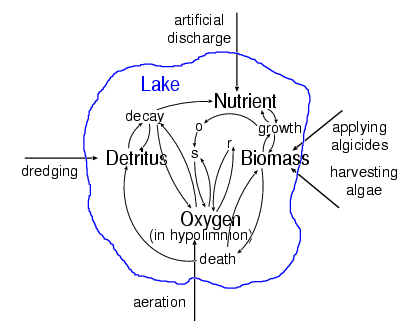
Fig. 1

* Example: detritus

3.1
The difference equation for the 'level" variable D (for detritus) in MIMOSE contains an additional "rate" variable DREDG which decreases the calculated detritus value in each simulation step:

D: real := D_1 + DT * (DR_1 - DEC_1 - DREDG_1);

DR: death rate of the biomass
DEC: decay rate of the detritus

* Policies

4.1
Anderson describes five policies to avoid eutrophication of the lake (see the arrows pointing into the lake in the figure above):

applying algicides: the application of algicides can increase the natural death rate of the algae,
dredging the detritus: the detritus can be dredged from the ground of the lake, which results in a decrease of nutrient (which otherwise would have been produced from the detritus naturally) and in an increase in the hypolimnial oxygen concentration (because less oxygen is consumed in the detritus process),
aeration of the lake: oxygen can be bubbled into the water of the lake, thus increasing the hypolimnial oxygen concentration,
harvesting algae: biomass can be harvested, thus decreasing the biomass (and, in consequence, its oxygen comsumption and its conversion into detritus); the harvested biomass can be used for agricultural purposes,
reducing nutrient (fertilizer) discharge into the lake: Anderson suggests an artificial discharge of fertiliser into the lake which is ten times the natural discharge of nutrient from outside the lake at the beginning of most of his simulation runs; moreover he suggests a yearly increase of the artificial fertiliser discharge of two per cent if no specific measures are taken.
* Experimenter vs. model agents

5.1
In Anderson's model, these policies are applied by the experimenter; in our model, one or more simulated "governments" (later on also individual "farmers") perform the task to apply strategies to avoid or fight eutrophication. Of course, more kinds of entities may be represented in the model in later stages.

5.2
Of the five policies described in Anderson's paper (applying algicides, dredging the detritus, aeration of the lake, harvesting algae and reducing nutrient (fertiliser) discharge into the lake) only the latter three were considered in the experiments so far, but it is easy to define conditions for the other two policies, too.

* Shortcomings of Anderson's System Dynamics model

6.1
Limited correspondence between the modelled part of reality and the model representation itself.

6.2
Mixing hydrological behavior of the lake with policies to avoid eutrophication into an undifferentiated whole.

6.3
Policies are taken by an anonymous authority from the model environment (the "experimenter"). No representation of (maybe different) actors who apply these policies in reality.

6.4
Hydrological behavior and policy actions are based on the same time scale (policies like harvesting algae or aeration will not be taken continously 20 times per year)

6.5
Limited, variable based ('levels', 'rates') architecture of the unique model object 'lake'.

6.6
Model dynamic can only be described by (differential) equations (discrete events are possible by using the in some way artificial clip function)

* Eutrophication for forty years

7.1
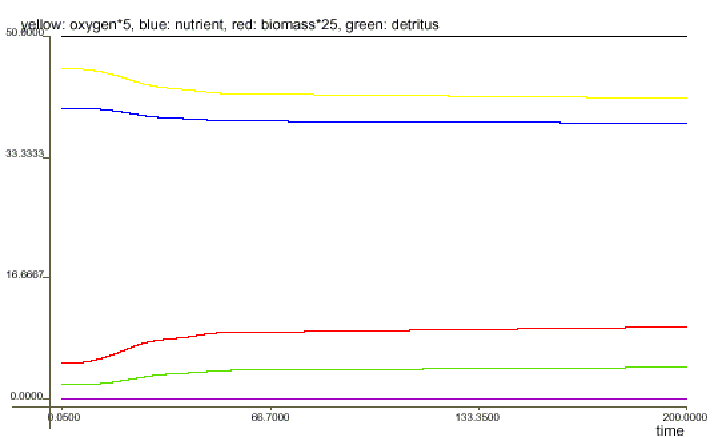
In the first experiment we replicate one of Anderson's standard situations with "cultural eutrophication for forty years, with an enrichment rate of 10µg per liter and year, followed by a return to natural eutrophication" of 1µg per liter and year[his fig. 5-7].

Fig. 2

7.2
The lake does not fully recover, "a new steady state with an elevated biomass B and detritus budget D is achieved".

* No measures taken

8.1
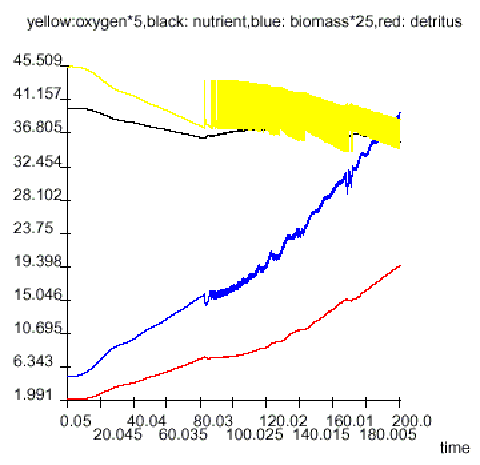
The next experiment starts in an oligotrophic state, but eutrophication begins immediately with an enrichment rate of 7.5µg per liter and year (7.5 times the natural rate), which is afterwards increased by 2 per cent per year (Anderson seems to have used 10 instead of 7.5 in his figure 5-8, but an approximate replication of his figure was only possible with 7.5!).

Fig. 3

8.2
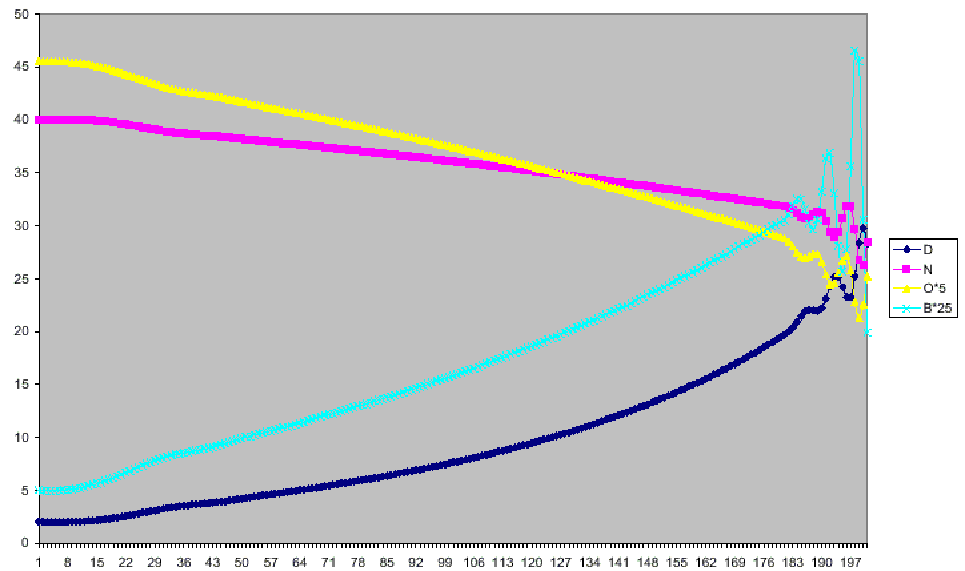
Oxygen is depleted to about 50 per cent of saturation, biomass and detritus grow rapidly (and all four levels end up in chaotic motion). Here we used the original table function while in all the following experiments we have to use an exact increase of 2 per cent per year or 0.099062171 per cent per simulation step (DT = 0.05). In all the following experiments we start with 10µg-1 yr-1. The reason for the numerical difference between Anderson's result and our replication (done with Personal Dynamo, but MIMOSE yields the same result) might lie in the different precision between 1972's Dynamo and Personal Dynamo run on a more modern machine!).

* Nutrient discharge decreased

9.1
Nutrient discharge is reduced (by 2 per cent per year) while oxygen is less 7.5 (and increased by 2 per cent per year while oxygen is greater 7.5).

Fig. 4

9.2
As soon as the oxygen concentration falls below the threshold, artificial nutrient discharge is reduced - which leads to an immediate increase of the oxygen concentration, which in turn increases the natural nutrient. Moreover, the artificial nutrient discharge reduction policy is given up (immediately, in this experiment!). More nutrient makes the algae consume more oxygen, so the oxygen concentration falls below the threshold ...

* ... and algae are harvested: Harvesting depends on biomass

10.1
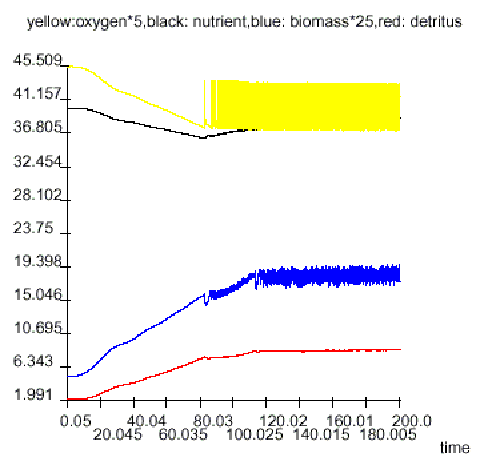
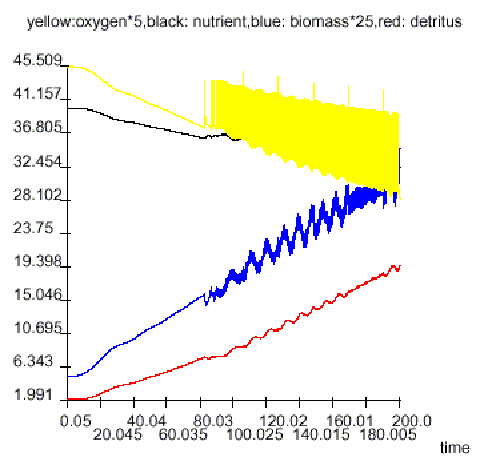
Nutrient discharge is reduced (by 2 per cent per year) while oxygen is less 7.5 (and increased by 2 per cent per year while oxygen is greater 7.5), but harvesting is also done while biomass is over 0.75 (and not done while it is less).

Fig. 5

10.2
After 84 years, the oxygen concentration has dropped to 7.5, aeration and nutrient discharge reduction start. The biomass concentration continues to rise (a little more slowly). After 115 years, biomass exceeds 0.75, and harvesting is started which always keeps biomass below or only slightly above this threshold.

* First Extension: Introducing Local Governments

11.1
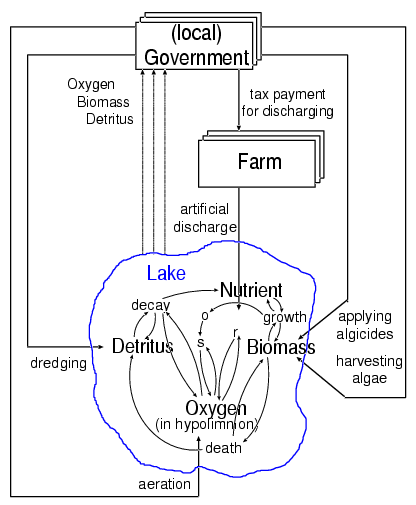
In the following experiments we assume that instead of by the experimenter, the different policies are taken by local governments. In the following graph, a number of instances of the government type are added (stacked rectangles on top of the lake). Broken arrows pointing from the lake to the governments symbolise the information the governments receive on the state of the lake. Solid arrows representing measures taken by the government start now from the government objects.

11.2
This allows for

Fig. 5

Local Government (MIMOSE)

11.3
Thus we have to extend the MIMOSE model by the following object description:
govt := {
/* Farming Rate: farming algae if biomass greater Bthresh */
FARM: real := max(0.0, FARMF * thisLake.B) if thisLake.B > Bthres 
else 0.0;
Bthres : real;
/* Dredging Rate: dredging detritus if oxygen less Othres */
DREDG: real := DRDGF * thisLake.D if thisLake.O < OTHRES 
ELSE 0.0;
/* DEATH RATE: APPLYING ALGICIDES IF OXYGEN LESS OTHRES */
K2: REAL := K2B if thisLake.O < Othres else K2A;
/* Aeration Rate: aeration if oxygen less Othres */
KA: real := KAER if thisLake.O < Othres else 0.0;
/* nutrient discharge increase rate */
NDIR : real := NDIR1 if thisLake.O > Othres else NDIR2;
thisLake : list of lake;
}

11.4
This means that a government has defined two thresholds for itself (Bthresh, Othresh). When the biomass threshold is exceeded, algae farming starts, when the oxygen concentration decreases below the oxygen threshold, dredging, applying algicides or aeration starts and/or the artificial nutrient discharge increase rate is lowered - in the initialisation, constant attributes such as K2A and K2B can be set appropriately (K2A=K2B means that the algicides policy is not changed.

Four regional authorities around the lake: All behave equally

11.5
In this experiment, governments behave the same as the experimenter in Anderson's original model, but with four regional authorities around the lake which behave exactly the same. The result is, of course, the same as before.

11.6
The behaviour of the four local governments is as follows:

Nutrient discharge: reduced/increased (by 2 per cent per year) while oxygen is less/greater 7.5 - this makes it necessary to model the nutrient discharge in a more elaborated manner than with a table function
Harvesting: done/not done while biomass is over/less 0.75
Aeration: done/not done while oxygen is less/over 7.5 The total nutrient discharge, harvesting and aeration rates are calculated by the averages of the respective four government rates.
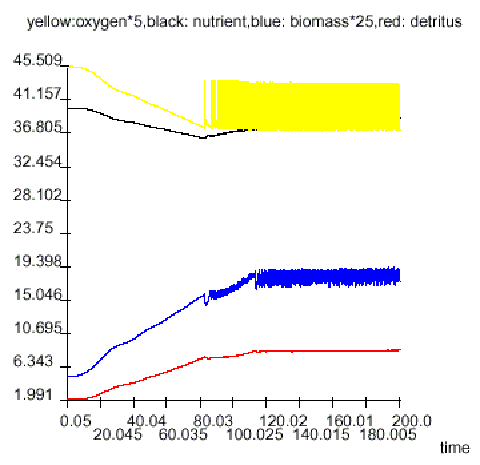
Fig. 7

Two behave differently

11.7
In this experiment, two governments behave differently than the other two. The result is similar as in the experiment before, with the exception that the deviations of biomass and detritus are much smaller as harvesting of two governments starts earlier.

11.8
The behaviour of the four local governments is as follows:

Nutrient discharge: reduced/increased (by 2 per cent per year) while oxygen is less/greater 7.5
Harvesting: done by two governments while biomass is over 0.5, done by the other two governments while biomass is over 0.75 (which is never reached in this experiment, so the two lazy governments never harvest)
Aeration: done/not done while oxygen is less/over 7.5
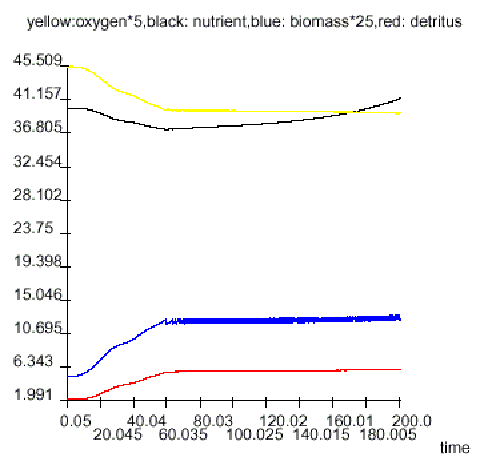
Fig. 8

* Second Extension: Introducing Farmers

12.1
In the second extension of our model we assume that the amount of nutrient is influenced by fertilisers which the farmers living along the lakeside discharge. So we need to introduce objects representing individual farmers.

12.2
This extension allows for

Fig. 8

Farmer (MIMOSE)

12.3
The explicit description of the farmer objects is rather short:
farm:= {
/* nutrient discharge increase rate */
NDIR : real := NDIR1 if TAXthres > auth.TAX else NDIR2;
/* individual tax threshold */
TAXthres : int;
auth : list of govt;
}

30 farmers discharge fertilisers, controlled by government tax policy

12.4
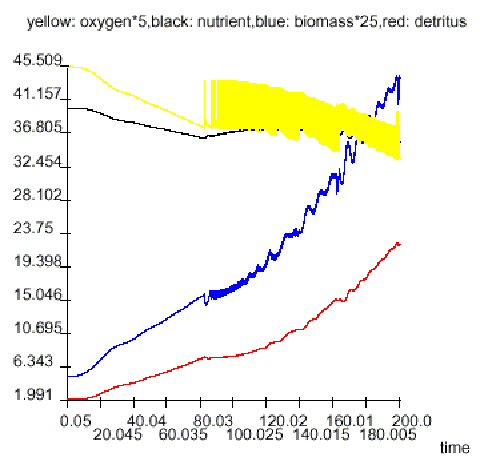
In the next experiment, we have only one government in whose region we have 30 farmers. The result shows that aeration and a tax controlled decrease of nutrient discharge by approximately half of the farmers is not enough, because biomass and detritus are increasing very rapidly at the end of simulation run.

12.5
The government policy can be described as:

Tax raising: done (TAX=5)/not done (TAX=0) while oxygen is less/greater 7.5
Aeration: done/not done while oxygen is less/over 7.5

The behaviour of the thirty farmers is as follows:
Nutrient discharge: reduced/increased (by 2 per cent per year) if the government tax is higher/lower than the individual threshold each farmer can pay.
12.6
The individual tax threshold (TAXthres) is normally distributed between 1 and 10. The effect of this modelling strategy is that approximately half of the farmers decide to reduce their fertiliser discharge if the oxygen is less than 7.5).

Fig. 10

Using a different time scale for aeration policy

12.7
Aeration is always done for a certain time period, no matter what values the variables might have been during this period. This policy tends to stabilise the hydrological system - better than in the former experiments.

Fig. 11

12.8
Local government (1):

Tax raising: done (TAX=5)/not done (TAX=0) while oxygen is less/greater 7.5
Aeration: done while oxygen is less 7.5 and not done otherwise (aeration is restricted to a period of approximately two months at the beginning of a year).

12.9
Farmers behave as in the former experiment.

Using different time scales for aeration and tax policy

12.10
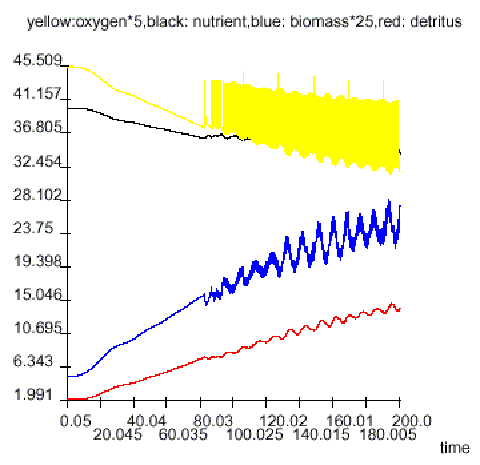
The next experiment was also done with only one local government. Two changes as compared to the former experiment were introduced:

Tax raising: done (TAX=5) while oxygen is less than 7.5 and not done (TAX=0) otherwise (but if the tax is ever raised it is never abrogated - which seems quite natural for real governments: the Imperial Government of Germany introduced a tax on champagne for funding the Imperial Navy before World War I, this tax still exists).
Aeration: done while oxygen is less 7.5 and not done otherwise, but aeration is restricted to a period of approximately two months at the beginning of a year.
12.11
The behaviour of the farmers was again not changed.

12.12
Maintaining the tax stabilises the hydrological system even better:
Fig. 11

* Conclusion

Agents in MIMOSE?

13.1
MIMOSE allows the creation of well-structured multi-level models, with structural correspondence between the model representation and the modelled part of reality. It supports the explicit representation of actors from reality in the model. This allows for application of simulation models for concrete decision support and at the same time for easier model maintenance and model refinement.

13.2
But in our model, farmers and local governments still are only provided with a limited actor architecture using state variables, with equation and rule based actions (state transition functions), and a simple interaction mechanism, restricted to actors of different types, directly using attribute values of objects of other types (which means for instance that the government reacts on the actual amount of oxygen, biomass, and detritus of the lake, instead of being notified with a message sent from the lake to the government).

13.3
What abilities must model entities have to behave like real actors?

Future research

13.4
The entities defined in our lake model give only an impression of what an agent might be. The following list summarises some aspects of an "agentification" of the lake model (partly achievable by using MIMOSE) which supports a more realistic view on this part of reality:

13.5
To analyse the effect of different behaviour at different places around the lake it might be necessary to split the hydrological part of the model into submodels, so that (as in reality) farmers discharge fertilisers on different locations around the lake.

13.6
This might be less important in our lake example but probably extremely relevant in flow models of rivers, where the discharge of pollutant can have a lot of consequences downstream.

13.7
Implementing learning strategies for governments and farmers necessitates further empirical research as to how real stakeholders learn from the changes they perceive in their environment.

Interactions representable

13.8
In classical models (System Dynamics) interactions between real-world entities can only be represented as interactions between variables.

13.9
In multi-level and multi-agent models interactions between real-world entities can be represented as interactions between programming language objects, which is much more intuitive (e.g. for stakeholders).

13.10
And it is possible to represent interactions between real-world entities of different kinds, e.g. between the individual farmer and the population of all farmers: thus a collective opinion formation process can be modelled.

More complex models possible

13.11
A multi-level and, more so, a multi-agent model allows the representation of meta-strategies:

13.12
Multi-level and multi-agent models can and will be modular models - models which consist of a number of separate submodels which can be tested (validated?) separately so that in the end they must only be plugged together (and the plugging must be validated instead of the whole model).


* Notes

1 FIRMA - Freshwater Integrated Resources Management with Agents is a project under the Fifth Framework (Contract No. EVK1-CT-1999-00016, www.cpm.mmu.ac.uk/firma/). The aim of the FIRMA project is to improve water resource planning through the use of multi-agent models that integrate hydological, social and economic aspects of water resource management through the representation of stakeholder decision making.

2 Jay M. Anderson: 'The Eutrophication of Lakes', in: Dennis and Donnella Meadows: Toward Global Equilibrium, Cambridge MA (Wright Allen) 1973, pp. 171-140

3 Stephen Carpenter, William Brock and Paul Hanson: 'Ecological and Social Dynamics in Simple Models of Ecosystem Management' Conservation Ecology 3 (2):4 1999, URL: http://www.consecol.org/vol3/iss2/art4

----

ButtonReturn to Contents of this issue

© Copyright Journal of Artificial Societies and Social Simulation, 2001