© Copyright JASSS

  JASSS logo ----

Loet Leydesdorff (2001)

Technology and Culture:
The Dissemination and the Potential 'Lock-in' of New Technologies

Journal of Artificial Societies and Social Simulation vol. 4, no. 3,
<https://www.jasss.org/4/3/5.html>

To cite articles published in the Journal of Artificial Societies and Social Simulation, please reference the above information and include paragraph numbers if necessary

Received: 5-Nov-00      Accepted: 11-Apr-01      Published: 30-Jun-01


* Abstract

How do technological innovations change the patterns of their cultural diffusion in socio-economic networks? Cellular automata enable us to show Arthur's (1988) model of a potential 'lock-in' of a new technology in terms of dominant colours on the screen. The 'lock-in' effects can be combined with local learning, network effects, and more complex dynamics. Recursive and interaction terms can thus be declared separately in the construction of a simple, but non-linear model of technological development and innovation. This enables us to specify conditions for a 'break-out' or a 'deadlock' between competing technologies. Using Axelrod's (1997) simulation model of 'cultural dissemination' as another network effect, it will be shown that the cultural assimilation of a new technology can co-evolve with the 'lock-in' of a dominant technology. This effect can be annihilated by the further development of the communication with an emerging dimension. Implications for technology and innovation policies will be specified.

Keywords:
Culture; Dissemination; Innovation; Lock-in; Technology

* Introduction

1.1
Rapid substitution processes of technologies with the character of avalanches have been noted (e.g., Fisher & Prey, 1971) as well as rigidities during long periods of time along 'technological trajectories' (Nelson & Winter, 1982). 'Lock-in' into a dominant technology (Arthur, 1988) and the function of niche formation (e.g., Bruckner et al., 1994) have been studied extensively. The role of networks in diffusion processes are complex and the simulation results are sometimes counter- intuitive (e.g., Arthur et al., 1997; Plouraboue et al., 1998).

1.2
Since technological innovations are taking place at interfaces, contributions from different research traditions can be expected. In accordance with the differing perspectives on the relevant interfaces, the basic assumptions underlying these studies can also be very different (Sahal, 1982). For example, social historians will discuss the social construction of a technology and its impact on relevant environments along a time axis, while economists tend to focus on optimization problems in the present. These specific windows imply different codifications. One can expect incommensurabilities among these discourses. The terms (e.g., 'selection') may have different meanings in different contexts.

1.3
Can formalization help us to solve the puzzles thus generated, by creating more transparency about the assumptions of the different models? Are we able to trace the consequences of their possible interactions? The resulting dynamics is often too complex for the intuitive understanding, since it is composed of several interacting subdynamics. Technological innovations, for example, can be considered as the results of non- linear interactions among
  1. the knowledge production systems,
  2. markets or more generally 'selection environments' (Nelson & Winter, 1982), and
  3. the political system (e.g., government regulation and legislation).[1]
The analytical task, however, is to specify the mechanisms underlying the complex and observable results of their interactions.

1.4
In this study, I focus on the interaction of two subdynamics of technological development and innovation which are relatively well understood:
  1. the occurrence of 'lock-in' of a single technology in the case of two competing technologies (Arthur, 1988) and
  2. the dissemination of 'technological' culture understood in terms of the simulation model proposed by Axelrod (1997).
Arthur's and Axelrod's models have been formalized into computer programs for the simulation. However, their approaches to the problem of diffusion and dissemination of new technologies lead to different predictions.

1.5
The 'lock-in' of a potentially sub- optimal technology is well known in the case of the QWERTY-keyboard. Although more efficient keyboards were and are available, it has been impossible to change the keyboard layout because of social network and learning effects (David, 1985). In other words, a 'lock-in' stimulates the diffusion of a single variant to the extent that this technology becomes completely dominant at the global level.

1.6
Niches can be expected to counteract 'lock-ins' by providing locally different environments, i.e., with potentially different trade-offs and optimalizations (Bruckner et al., 1994). When niches are stabilized as market segments, regionalization may occur. Regional patterns and regional dominance have been studied mainly in relation to the question of the dissemination of culture (Axelrod, 1997a and b). Axelrod's thesis of the emergence of stable patterns of differentiation has also been studied in terms of 'balkanization' (Van Alstyne and Brynjlofsson, 1996) or the emergence of 'small worlds' in partially connected networks (Watts and Strogatz, 1998; Watts, 1999).

1.7
According to these studies, dissemination in a complex environment can be expected to 'deadlock' the patterns of diffusion so that a global optimum (or sub-optimum) cannot be reached (cf. Pearl, 1988). Using cellular automata as a method for the simulation, one would in this case expect to find regions with different colours on the screen, while in the case of a global (sub)optimum--as predicted by Arthur (1988)--one would expect a single colour to prevail.

* The Appreciation of Simulation Results as a Methodological Problem

2.1
Simulation studies enable us to study a phase space of possible combinations, but substantive theories are needed for limiting the number of possible states. The positive theories can then be reformulated as negative selections on the variation. In the abstract, the computer model is not constrained by the selection pressures of 'real life' events. However, the number of possible states in a complex dynamics explodes without theoretical specification.

2.2
In general, the algorithmic model can be considered as more complex than the reality. In the observable reality only special cases are expected to occur, since selection pressure prevails. The 'instantiations' (Giddens, 1984) build recursively upon previous events, and they can also be the results of interactions. The specification of observables in (geometrical) metaphors can be used to update the (algorithmic) expectations. The discourses allow for theoretical specification, while the simulation model may enable us to generalize beyond specific instantiations (Leydesdorff, 2001).

2.3
Since the computer model can contain more complexity than the system to be modeled, correspondence with the data is no longer a sufficient criterion for validation. The observable data can be simulated by playing with the parameter values of the model. The modeller may be able to reproduce patterns that resemble 'real life' phenomena by making the code more complex. Resemblance with 'real life phenomena' (even if significant) can therefore no longer be considered as a criterion for the theoretical appreciation of the underlying dynamics that is codified in the computer language.

2.4
How can one improve then on the simulation model? The quality of the model can only be controlled in relation to the quality of the understanding. The algorithmic model cannot explain the data, but the narrative about the data may help to appreciate the model. Given the expected complexity of the simulation results, the understanding requires transparency about the translation of the geometrical metaphor(s) into the computer code, and vice versa.

2.5
This transparency tends to be obscured by the technical drivers of coding processes in computer languages. The programmer is inclined to fine- tune the code so that the resemblance between phenomena observable on the screen and the recognizable events is optimal. Object-oriented computer programming enables the programmer to improve the graphical representations, yet at the price of potentially increasing the complexity of the code. The user-oriented interfaces tend to hide the analytical understanding in favour of providing visual appreciation at the user end. Is the complexity which one observes (on the screen) a result of the complexity of the computer programs or a result of the analytical complexity of the interactions among the hypothesized subdynamics? Which part of the observable variation is to be attributed to which source of uncertainty?

2.6
In my opinion, one should give priority to the clarity of the reasoning above the attractiveness of the representations in order to enhance further theorizing. How does the code represent a formalization of the theories involved? The translation between the theoretical understanding, that is, the conceptual model, and the algorithmic coding has to be made precise, so that the researcher can follow the changes in the theoretical expectation. The introduction of a new parameter always changes the phase space, and therefore, requires a precise explanation.

2.7
By using theoretically specified subdynamics--specified in the previous section--I wish to show how a series of simulations can be composed into a complex dynamics. The claim that I can thus construct a model engine that allows me to recombine other simulation models, will be demonstrated by showing the advantages in the reconstruction of these sophisticated models of technological dissemination from the literature.

2.8
Note that my recodification (in standard BASIC) implies a simplification of the models that are reconstructed. While the reconstructed models were developed originally in order to search the respective phase spaces systematically, the simplified reconstructions enable me to assess only the theoretical results and their relative relevance for appreciative theorizing. Furthermore, reducing the complexity provides us with a focus on theoretically crucial assumptions, since the code can be kept relatively simple. The addition of small subroutines (like a degree of freedom) can be controlled as specifiable changes in the expectations. The counter-intuitive results of combining different perspectives can be traced back to specific lines of code.

* Evolutionary and Meta-biological Dynamics

3.1
The two basic subdynamics of evolution were formulated by Darwin (1856) as 'variation' and 'selection.' However, the variation which one observes can also be considered as the deselected cases (that is, the ones which have survived hitherto). From this 'neo-evolutionary' perspective, the two concepts are related: the observable variation can be considered as a result of the co-variation between randomness and the selecting mechanisms. Although the selection is structural, it cannot be observed other than by its effects on the variation.

3.2
In evolution theory, the selection mechanism was initially hypothesized as 'natural selection', but in meta-biological theorizing (e.g., in evolutionary economics) only randomness can be considered as a given (Andersen, 1994).[2] I shall use the generation of randomness as the initial operator and specify the selecting mechanisms as hypotheses.

Random Variation

3.3
As a baseline for my simulations, let me begin with the generation of a screen exhibiting a random pattern, using the program specified in Table 1. This program first defines (in line 10) a screen in the CGA-mode (320 x 200 pixels). (This screen provides a convenient format since the pixels are larger than in other modes and therefore the results are more visible.)


10 SCREEN 1: WINDOW (0, 0)-(320, 200): CLS
20 RANDOMIZE TIMER

30 FOR I = 1 TO 500000
40 y = INT(RND * 200)
50 x = INT(RND * 320)
60 IF RND < .5 GOTO 70 ELSE GOTO 80
70 PSET (x, y), 1: GOTO 90
80 PSET (x, y), 2
90 NEXT I

100 END

Table 1. Program for picturing a screen randomly using two colours
This code may be downloaded from here and run under Windows

3.4
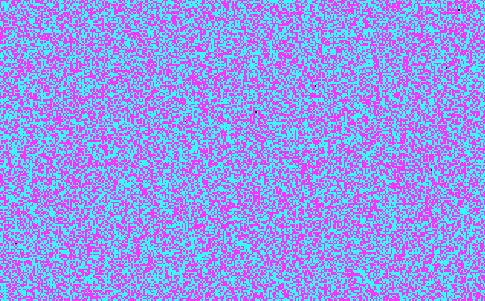
The program generates a random number on the basis of the clock of the system (in line 20); it uses the next two seed numbers (RND-function) for the attribution of an x- and a y-value to a pixel with one of the two corresponding colours on the screen. The value for the total number of points (in this case 500,000) is arbitrarily large. A resulting screen (with a random pattern) is exhibited in Figure 1.

Figure 1. Screen (320 x 200) pictured randomly in two colours

The Network Effects of Local Neighbourhoods

3.5
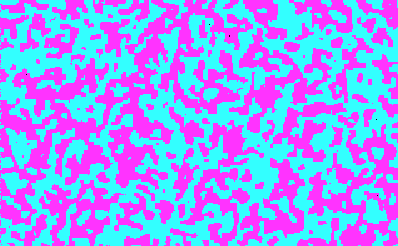
A network effect can be considered as a specific selection mechanism operating on the variation in local neighbourhoods. This selection environment, however, has to be specified. In the programme exhibited in Table 2, for example, each point, when (randomly) selected, first evaluates its 'Von Neumann'- environment, that is, its four immediate neighbours in terms of their colour. The value of the colours can be stored in an array with the same size as the screen (320 x 200). For convenience the values were set at plus one for one colour and minus one for the other (lines 130-140).

3.6
If the majority of the neighbours has one colour, then the selected cell (in the center) is given this colour (line 110).[3] Otherwise (line 120), the cell will be given a colour using the random procedure described in the previous case.


1 REM network model with Von Neumann environment
2 REM and spatial representation on the screen
10 SCREEN 1: WINDOW (0, 0)-(320, 200): CLS
20 RANDOMIZE TIMER

30 ' $DYNAMIC
40 DIM scrn(321, 201) AS INTEGER

50 FOR I = 1 TO 500000
60 y = INT(RND * 200)
70 x = INT(RND * 320)
80 IF (x = 0 OR y = 0) GOTO 120 ‘ prevention of errors at the margins
90 z = scrn(x - 1, y) + scrn(x + 1, y) + scrn(x, y - 1) + scrn(x, y + 1)

100 IF z = 0 GOTO 120 ‘ use random attribution in this case
110 IF z > 0 THEN GOTO 130 ELSE GOTO 140 ‘ evaluation of neighbours if z <> 0
120 IF RND < .5 THEN GOTO 130 ELSE GOTO 140

130 PSET (x, y), 1: scrn(x, y) = 1: GOTO 150
140 PSET (x, y), 2: scrn(x, y) = -1

150 NEXT I
160 END

Table 2. Program for network effect of a ‘Von Neumann environment’ using two colours
This code may be downloaded from here and run under Windows

Figure 2. The network effect in the case of a 'Von Neumann environment' using two colours

3.7
The extension from a Von Neumann environment to a (one step more complex) Moore-environment, which includes the four corner cells as well, can be achieved, for example, by inserting one line (after line 90) of the following format:

91 z = z + scrn(x-1,y-1) + scrn(x-1,y+1) + scrn(x+1,y-1) + scrn(x+1,y+1)

The resulting pattern of this simulation is not essentially different from the previous one upon visual inspection. Note that this extension of the hypothesis is modelled as a subroutine which can be achieved with a single line of code.

* Complex Dynamics

4.1
While the evolutionary selection mechanism on the variation operates at each moment in time, some selections can be selected for stabilization over time. Darwin's 'survival of the fittest' can from this perspective be considered as the special case of a single historical clock and a single ('natural') environment. As environments can be different, systems may also contain different clocks or, in other words, evolve at different speeds.

4.2
The two axes of variation and selection at each moment in time, on the one hand, and change and stabilization over time, on the other, are formally equivalent, but one can expect them to be substantively different. Let us now focus on the mechanism of stabilization and 'lock-in' of a new technology along the time axis without the assumption of differentiation in the local environments.

The Simulation of 'lock-in'

4.3
Arthur (1988 and 1989) specified a mechanism for 'lock-in' in the case of two competing technologies with random arrivers and 'marginal increasing returns.' The gradual aggregation of 'network externalities,' for example, may lead to a 'lock-in' at the level of the network system. The author used the example of VCR-technologies: if a standard (e.g., VHS) is increasingly accepted, one passes a point of 'no return' since video-stores will only have the dominant type of tapes. Using Arthur's model, Leydesdorff & Van den Besselaar (1998) showed that 'lock-ins' can be robust against changes in the parameters of orders of magnitude, but that 'break-out' and 'return to equilibrium' remain possible, under specifiable conditions (cf. Bruckner et al., 1994).

4.4
A lock-in occurs for analytical reasons in the case of a random walk with positive marginal returns (the so-called Pólya urn model; Arthur et al., 1987). Lock-in can be considered as a selection over time by an emerging system. This network 'system' emerges when the drift passes an absorbing barrier. In other words, the noise of the random walk can become a signal for the emerging system because it surpasses a threshold generated by the positive feedback in the generating routine. A new interface is then 'evoked.' Note that this is an effect at the global system's level, while a network effect as specified in the previous case is generated locally. The local network effect can occur at each moment in time, whereas the increasing returns build up over time.

4.5
Let me briefly recapitulate the formalization of Arthur's (1988) model: two competing technologies are labeled A and B. These are cross-tabled with two types of agents, R and S, with different 'natural inclinations' towards the respective technologies. In Table 3, aR represents the natural inclination of R-type agents towards type A technology, and bR an (in this case, lower) inclination towards B. Analogously, one can attribute parameters aS and bS to S-type agents (bS > aS).

Table 3. Returns to adopting A or B, given nA and nB previous adopters of A and B. (The model assumes that aR > bR and that bS > aS. Both r and s are positive.)

4.6
The network effects of adoption (r and s) are modeled as coefficients to the number of previous adopters, but differently for R-type agents and S-type agents. The global appeal of a technology is increased by previous adopters with a term r for each R-type agent, and s for S-type agents. If R-type and S-type agents arrive on the market randomly, the theory of random walks predicts that this competition will lock-in on either side (A or B) in the case of network effects.

4.7
Table 4 provides the algorithm for this model. The parameters (aR, bR, aS, bS, r, and s) can be varied, and different scenarios can thus be tested. Given the indicated parameter values the screen will eventually turn into one colour or the other.


1 REM original model of W. Brian Arthur (1988)
2 REM with spatial representation on the screen
20 SCREEN 1: WINDOW (0, 0)-(320, 200): CLS
30 ar = .8: br = .2: sa = .2: bs = .8: na = 1: nb = 1: s = .01: r = .01

40 RANDOMIZE TIMER
50 FOR I = 1 TO 500000
60 y = INT(RND * 200)
70 x = INT(RND * 320)
80 IF RND < .5 GOTO 90 ELSE GOTO 120

90 returna = ar + r * na: returnb = br + r * nb
100 IF returna > returnb THEN na = na + 1 ELSE nb = nb + 1
110 IF returna > returnb GOTO 150 ELSE GOTO 160

120 returna = sa + s * na: returnb = bs + s * nb
130 IF returna > returnb THEN na = na + 1 ELSE nb = nb + 1
140 IF returna > returnb GOTO 150 ELSE GOTO 160

150 PSET (x, y), 1: GOTO 170
160 PSET (x, y), 2

170 NEXT I
180 END

Table 4. Code for the simulation of Arthur's (1988) model (cf. Leydesdorff & Van den Besselaar, 1998)
This code may be downloaded from here and run under Windows

Combining the Network- and the Lock-in Effects

4.8
Let us now combine the two routines by writing them into a single program with an (hypothesized) interaction. In Table 5, lines 100-130 are equivalent to the network routine specified above in Table 2, that is, the network effects with reference to the Von Neumann environment.[4] Lines 140-200 are equivalent to the lock-in as exhibited by the program in Table 4. If the (Von Neumann) network environment remains indecisive with respect to a choice between the two technologies (colours), the selection is no longer made randomly, but according to the routine of increasing returns at the global level (the 'GOTO 140' in line 120).


1 REM original model of W. Brian Arthur (1988)
2 REM with network effect of the Von Neumann environment
3 REM added in lines 100-130

20 SCREEN 1: WINDOW (0, 0)-(320, 200): CLS
30 ar = .8: br = .2: sa = .2: bs = .8: na = 1: nb = 1: s = .01: r = .01
40 ' $DYNAMIC
50 DIM scrn(321, 201) AS INTEGER
60 RANDOMIZE TIMER

70 FOR I = 1 TO 500000
80 y = INT(RND * 200)
90 x = INT(RND * 320)

95 REM first evaluate the network environment (Table 2)

100 IF (x = 0 OR y = 0) GOTO 140
110 z = scrn(x – 1, y) + scrn(x + 1, y) + scrn(x, y - 1) + scrn(x, y + 1)
120 IF z = 0 GOTO 140
130 IF z > 0 THEN GOTO 210 ELSE GOTO 220

135 REM if not decisive proceed with the lock-in model (Table 4)

140 IF RND < .5 GOTO 150 ELSE GOTO 180
150 returna = ar + r * na: returnb = br + r * nb
160 IF returna > returnb THEN na = na + 1 ELSE nb = nb + 1
170 IF returna > returnb GOTO 210 ELSE GOTO 220

180 returna = sa + s * na: returnb = bs + s * nb
190 IF returna > returnb THEN na = na + 1 ELSE nb = nb + 1
200 IF returna > returnb GOTO 210 ELSE GOTO 220

210 PSET (x, y), 1: scrn(x, y) = 1: GOTO 230
220 PSET (x, y), 2: scrn(x, y) = -1

230 NEXT I
240 END

Table 5. Code for the combination of a local network effect with the global lock-in effect
This code may be downloaded from here and run under Windows

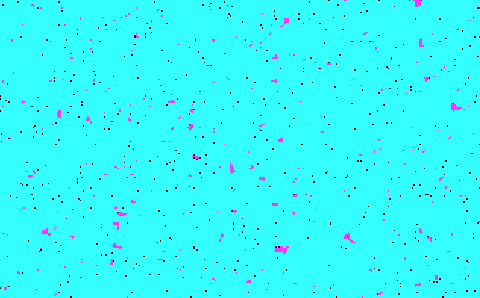
Figure 3.Temporary network effects with a prevailing lock-in after appr. 250,000 adopters

4.9
Figure 3 shows that the network effect leads in this case to islands of a different colour in a sea of the already 'locked-in' and therefore dominant technology. However, the black dots indicate potential adopters who have not yet been drawn by the random process, for example, after 250,000 adopters. The islands are not stable over time; at the edges of the islands newly arriving adopters tend to buy the dominant technology, and eventually (for example, after 500,000 adopters) a one-sided lock-in will prevail (given the increasing returns upon adoption at the global level).

An Additional Routine for the Simulation of 'Learning' by Returning Adopters

4.10
In order to achieve stability against 'lock-in' one has to add one more (sub-)dynamics to the network effect. I shall use 'learning' by the previous adopters as this additional dynamics. Let us assume that 'learning' occurs whenever one adopts. Thus, the value of the array element can further be augmented if one returns to the network for a second time.

4.11
In Table 6 - an extension of the simple network program of Table 2 - the value of the corresponding array element is increased or decreased by one unit count upon each local adoption (see the boldfaced additions to lines 130 and 140). This means that an adopter who buys the same technology for the second time will now be attributed a value of (plus or minus) two in the corresponding array element, etc. The network thus becomes more stable over time. The resulting patterns, however, are similar to the network effects as exhibited above in Figure 2.


1 REM network model with Von Neumann environment
2 REM and spatial representation on the screen
3 REM ‘learning’ added (to Table 2) by extension of lines 130 and 140

10 SCREEN 1: WINDOW (0, 0)-(320, 200): CLS
20 RANDOMIZE TIMER

30 ' $DYNAMIC
40 DIM scrn(321, 201) AS INTEGER

50 FOR I = 1 TO 500000
60 y = INT(RND * 200)
70 x = INT(RND * 320)

80 IF (x = 0 OR y = 0) GOTO 120 ‘provision in order to prevent effects at the margins
90 z = scrn(x - 1, y) + scrn(x + 1, y) + scrn(x, y - 1) + scrn(x, y + 1)
100 IF z = 0 GOTO 120
110 IF z > 0 THEN GOTO 130 ELSE GOTO 140
120 IF RND < .5 THEN GOTO 130 ELSE GOTO 140

‘specification of the learning effect
130 PSET (x, y), 1: scrn(x, y) = scrn (x, y) + 1: GOTO 150
140 PSET (x, y), 2: scrn(x, y) = scrn (x, y) – 1

150 NEXT I
160 END

Table 6. Code for the extension of a network effect with local learning
This code may be downloaded from here and run under Windows

4.12
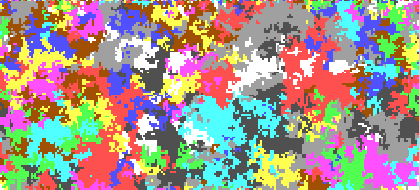
If this routine is also combined with the Arthur-routine, as specified in Table 5, the islands of the ('locked-out') alternative technology indeed become stable. This result is exhibited in Figure 4.

Figure 4. Stable network effects based upon learning with prevailing lock-in after 500,000 adopters

4.13
This 'lock-in' can also be considered as a deadlock between the dominant technology and the niches in which the alternative technology is able to survive. Some actors will increasingly augment the value of their array element and thus tip the balance for the new arrivers at the borders in favour of the alternative (i.e., non-dominant) technology. The 'hills' and the 'valleys' of the 'landscape' can thus become increasingly 'rugged' (cf. Kauffman, 1993). The transitions at the borders are steep when compared with the previous case, so that a situation of 'market segmentation' may no longer be reversible within this model.[5]

4.14
Note that only the combination of the three (sub-)routines leads to the new configuration of a 'deadlock.' In summary, I have wished to show with these simulations that the complexity of the dynamics can be constructed in a controlled fashion. While the one model studied local effects, the other focussed on global ones. Let me now extend my reasoning by addressing the issue of the complex dynamics of a social system by using a model specified by Axelrod (1997b).

* The Dissemination of Technological Culture

5.1
Axelrod's (1997a and 1997b) research question concerns 'the dissemination of culture' in a complex multi-agent model based on considerations from game theory. The problem formulation is somewhat analogous to that of the diffusion of technology, with the difference that a new technology can be considered as an emerging feature of an evolutionary system (Etzkowitz & Leydesdorff, 2000). Axelrod's model can be considered conservative from this perspective since the number of dimensions is specified ex ante. I shall extend the model in one of the following sections with an emerging dimension in order to capture the specificity of a culture which can be transformed by the introduction of new technologies.

5.2
The crucial claim of Axelrod's model is that complex processes of dissemination of culture may lead to regionalization or 'Balkanization' (Van Alstyne & Brynjlofsson, 1996; cf. Watts & Strogatz, 1998; Watts, 1999). I shall first exactly reconstruct Axelrod's model, then assume an emerging dimension, and finally discuss how this relates to the lock-in models that were simulated above.

The Reconstruction of Axelrod's (1997a) Model

5.3
Let me quote from Axelrod's (1997a, at p. 153f.) formulation of the model for the precise understanding:

Culture is taken to be what social influence influences. For present purposes, the emphasis is not on the content of a specific culture, but rather on the way in which any culture is likely to emerge and spread. Thus, the model assumes that an individual's culture can be described in terms of his or her attributes, such as language, religion, technology, style of dress, and so forth.

5.4
To this end, Axelrod distinguished between the features of a culture and traits which can be attributed to features. Features can be modeled as variables that may have different values (that is, traits). In the model, Axelrod declared five features each with ten traits. The agents were organized on a 10 x 10 grid, that is, a world of one hundred actors. I extended the size of this 'world' (for pragmatic reasons)[6] to 100 x 220 (that is, 22,000) actors during the following simulations.


1 REM Axelrod's ‘Disseminating Culture’ (1997, pp. 154 ff.)
2 REM five features, ten traits

10 SCREEN 7: WINDOW (0, 0)-(320, 200): CLS
20 ' $DYNAMIC 'technical limitation of
30 DIM scrn(221, 101, 5) AS INTEGER 'array size in QBasic 4.5
40 RANDOMIZE TIMER

50 FOR z = 0 TO 4 'five features
60 FOR y = 0 TO 99 'fill array and paste screens
70 FOR x = 0 TO 219
90 w = INT(10 * RND) 'ten random traits
100 IF z = 4 THEN PSET (x, y), (w + 6): scrn(x, y, z) = w

'use colours 6 to 15 (see note 7); show fifth screen
110 NEXT x
120 NEXT y
130 NEXT z

140 DO 'continue to exhibit the screen for z = 4
150 y = INT(RND * 100) 'select a random array element
160 x = INT(RND * 220)

170 zz = INT(RND * 4) 'attribute relevant neighbourhood elements randomly
180 IF zz = 0 THEN x2 = x - 1: y2 = y
190 IF zz = 1 THEN x2 = x + 1: y2 = y
200 IF zz = 2 THEN x2 = x: y2 = y - 1
210 IF zz = 3 THEN x2 = x: y2 = y + 1
'repair effects at the margins
220 IF x2 = -1 THEN x2 = 219: IF x2 = 220 THEN x2 = 0
230 IF y2 = -1 THEN y2 = 99: IF y2 = 100 THEN y2 = 0

240 c = 0 'compute relative similarity with selected neighbour
250 FOR z = 0 TO 4
260 IF scrn(x2, y2, z) = scrn(x, y, z) THEN c = c + 1
270 NEXT z
280 p = .2 * c 'degree of similarity
290 IF RND > p THEN GOTO 360 'only interact with probability p; otherwise loop

300 noneq = INT((5 - c) * RND) 'adjust a randomly chosen trait
310 FOR z = 0 TO 4 'in the case of dissimilarity using five features
320 IF scrn(x2,y2,z) <> scrn(x,y,z) THEN GOTO 330 ELSE noneq = (noneq+1)
330 IF noneq = z THEN scrn(x,y,z) = scrn(x2,y2,z)

'adjust colour, that is, trait, in this case only
340 NEXT z

350 PSET (x, y), (scrn(x, y, 4) + 6) 'repaint the screen
360 LOOP WHILE INKEY$ = ‘‘ 'make it possible to exit
370 END

Table 7. A reconstruction of Axelrod's (1997) 'Disseminating Culture'
This code may be downloaded from here and run under Windows

5.5
Technically, I use the fifth array of a three- dimensional array for painting the screen. The five layers are equivalents to Axelrod's five cultural features; the traits are the ten possible cell values (which correspond to the colours on the screen). This three-dimensional array is randomly filled (lines 50-130) with the numbers 0 to 9 as equivalents of the ten traits each feature may have, again strictly analogous to Axelrod's simulation model.

5.6
The simulation proceeds in two steps in a loop (line 140-360). First, an active site is selected randomly (lines 150-160). One of the four neighbours is also randomly selected (lines 170-210). (Lines 220 and 230 are technical; they serve to repair unwanted effects at the margins of the window on the screen.) The degree of cultural similarity between the active cell and its randomly selected neighbour, in terms of the five features sharing a similar trait, is evaluated in lines 240-280. Line 290 attibutes this similarity as a probability to the interaction.

5.7
As Axelrod, (ibid., at pp. 154f.) formulated: 'The interaction consists of selecting at random a feature on which the active site and its neighbour differ (if there is one), and changing the active site's trait on this feature to the neighbour's trait on this feature.' This is simulated in lines 300-340, by first selecting a random value among the features that are unequal in terms of the trait-values among these two cells (line 300), and by then making the evaluation (310-340). The pixel is repainted in line 350,[7] and then the system proceeds with a next loop.

5.8
Note that the core of this program is only 23 lines of code (lines 140-360). An additional ten lines or so (lines 30-130) are needed to fill the three-dimensional array with random numbers. The original PASCAL version of this program, however, contained more than 300 lines of code.[8] Furthermore, each step could here be expressed in a few lines of code, and our procedures, therefore, remain highly transparent.

5.9
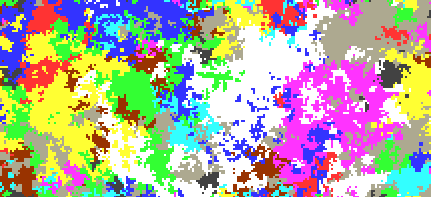
As can be expected, the results are similar to those of Axelrod, notably that the system produces regions of shared culture. This is illustrated in Figures 5 and 6. Figure 5 exhibits simulation results after a few hours of simulation, and Figure 6 shows that the regionalization is also present after running the simulation for a number of days. Although still dynamically changing, the system becomes regionally compartmentalized. One can perhaps compare this to a 'steady state': the system is not able to break out of the 'lock-in' of the compartmentalization. The situation can also be considered as a 'deadlock' or an example of 'Balkanization.'

Figure 5. Small worlds simulation based on Axelrod's (1997) 'Disseminating Culture' (after a few hours of simulation)

Figure 6. Small worlds simulation based on Axelrod's (1997) 'Disseminating Culture' (after 72 hours)

The Addition of an Emerging (sixth) Dimension

5.10
Using this same simulation one can vary both the number of features and the number of traits. Axelrod (1997a, at p. 159) concluded from his simulations that 'increasing the number of traits per feature has the opposite effect of increasing the number of features. (...) Having more features (i.e., dimensions) in the culture actually makes for fewer stable regions, but having more alternatives on each feature makes for more stable regions.'

5.11
In our program, the number of features can be increased, for example, by adding further layers to the third dimension (z) of the array, and the number of traits can be increased by extending the number of colours beyond ten. Axelrod's results can then be corroborated. Our interest, however, is from the perspective of the diffusion of technologies and the cultural changes which an emerging technology may generate by providing the cultural system with a new dimension of communication.

5.12
Table 8 captures this phenomenon by declaring a sixth feature as initially non-existent, i.e., by (technically) setting all values of array-elements in this dimension to minus one (lines 100-101). When a cell performs an adjustment, the emerging dimension is activated as in a learning process (line 331). (Some of the routines have to be made sensitive to whether or not the emergence has already occurred by declaring a help variable (e.g., in line 161).) The emerging dimension can be made visible in the upper half of the screen (line 351), while the lower half exhibits the further development of an already existing layer as in the previous case.


1 REM five features, ten traits, sixth feature emerging
10 SCREEN 7: WINDOW (0, 0)-(320, 200): CLS

20 ' $DYNAMIC 'technical limitation of
30 DIM scrn(221, 101, 6) AS INTEGER 'array size in QBasic 4.5
40 RANDOMIZE TIMER

50 FOR z = 0 TO 5 'five initial features
60 FOR y = 0 TO 99 'fill arrays and paste screens
70 FOR x = 0 TO 219
90 w = INT(10 * RND)
100 IF z = 5 THEN scrn(x,y,z) = -1 ELSE scrn(x, y, z) = w
101 IF z = 4 THEN PSET(x, y), (w+ 6) 'show fifth screen
110 NEXT x
120 NEXT y
130 NEXT z

140 DO
150 y = INT(RND * 100)
160 x = INT(RND * 220)

161 IF scrn(x, y, 5) = -1 THEN helpvar1 = 4 ELSE helpvar1 = 5

170 zz = INT(RND * 4) 'attribute relevant neighbourhood elements randomly
180 IF zz = 0 THEN x2 = x - 1: y2 = y
190 IF zz = 1 THEN x2 = x + 1: y2 = y
200 IF zz = 2 THEN x2 = x: y2 = y - 1
210 IF zz = 3 THEN x2 = x: y2 = y + 1

'repair effect at the margins
220 IF x2 = -1 THEN x2 = 219: IF x2 = 220 THEN x2 = 0
230 IF y2 = -1 THEN y2 = 99: IF y2 = 100 THEN y2 = 0

240 c = 0 'compute relative similarity with relevant neighbour
250 FOR z = 0 TO helpvar1
260 IF scrn(x2, y2, z) = scrn(x, y, z) THEN c = c + 1
270 NEXT z
280 IF helpvar1 = 4 THEN p = .2 * c ELSE p = .1666 * c
290 IF RND > p THEN GOTO 360 'only interact with probability p
300 IF helpvar1 = 4 THEN noneq = INT((5 - c) * RND) ELSE noneq = INT((6 - c) * RND)
310 FOR z = 0 TO helpsvar1 'in the case of dissimilarity
320 IF scrn(x2, y2, z) <> scrn(x, y, z) THEN GOTO 330 ELSE noneq = (noneq + 1)
330 IF noneq = z THEN scrn(x, y, z) = scrn(x2, y2, z)

'adjust colour
331 IF (noneq = z and scrn(x,y,5) < 9) THEN SCRN(X, Y, 5) = scrn(x, y, 5) + 1

'emerging dimension
340 NEXT z

350 PSET (x, y), (scrn(x, y, 4) + 6) 'repaint the screen
351 IF scrn(x, y, 5) > -1 THEN PSET (x, y + 100), (scrn(x, y, 5) + 6)
360 LOOP WHILE INKEY$ = ‘‘ 'make it possible to exit
370 END

Table 8. Emergence of a sixth feature feeding into the culture; changes in relation to the previous simulation model are in boldface
This code may be downloaded from here and run under Windows

5.13
Note that this model contains an evolutionary dynamics, since the emerging dimension can further develop. In this case, it will drift towards a situation in which the new dimension is increasingly saturated, that is, all cells tend towards the maximum value (that is, 9) for the overlay (at z = 5). Yet, this situation (corresponding to a completely white screen) will never be reached because of the ongoing processes of adaptation in the underlying layers.

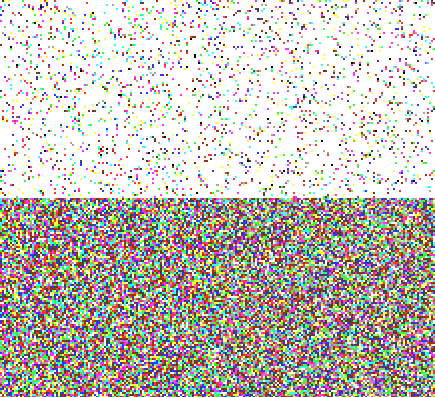
Figure 7. Emergence of a sixth dimension (steady state situation after a number of hours); no regionalization occurring.

5.14
The resulting patterns after a few hours of simulation are exhibited in Figure 7. No regionalization is expected to occur, since the system can communicate using the additional (that is, sixth) degree of freedom. This super-structure can be considered as a result of--or perhaps even as a cultural achievement produced by--the dynamics of the underlying systems' random actions. It reflects the interactions at the lower layers, but only temporarily since it further develops on the basis of subsequent interactions among them.

5.15
In other words, the emerging system's extra dimension can be considered as a reflection of the underlying dynamics, yet at the level of an overlay. One may wish to compare this overlay in the communication with a 'language' among the previously existing subdynamics. It can also be noted that this simulation provides us with a cellular automaton for exhibiting various system's level at the screen during the same simulation. For example, this design enables us to model the further development of 'structure' at the top-level and the generation of 'structure' by 'action' underneath.

5.16
The results of this model are robust over long periods of time against extending the number of features (to 16) or against limiting the number of dimensions (e.g., to 4). According to Axelrod (1997) both these changes by themselves would enhance regionalization. But in these simulations regionalization never occurred. In other words, the disturbances can be accommodated in the network overlay.

5.17
Furthermore, one may wish to add subroutines like the various neighbourhood effects specified above as further dynamics of the emerging dimension itself. For example, the initially scattered points in the sixth dimension can be attributed to an accommodation to their Von Neumann environments as specified in Table 2. One can also increase the speed of learning in line 331, either linearly or also recursively, for example, by using Arthur's rules of increasing marginal returns (from Table 5).

'Lock-in' and its Effect on Culture

5.18
Let us now assume that the emerging dimension as modeled above represents not a rich 'language' (with many values to each variable), but that a competition between two alternative technologies prevails. We will use Arthur's (1988) routine (as specified in Table 5), only for the case that interaction fails to occur for stochastic reasons (as specified in line 290 of Table 8).

5.19
While in the previous simulation a local misfit would lead immediately to a next round in the loop (line 290), we will now assume- following Arthur's routine-that the new technology is evaluated by arriving adopters at the global level (lines 360-420). Thus, the adopters are locally involved in the process of the dissemination of culture and globally subjected to the dynamics of the diffusion of a new technology. Can the global dynamics have a feedback on the cultural pattern formation?

5.20
The resulting program is listed in Table 9; the changes in relation to the previous model are again in boldface, and the results of a simulation confirming the occurrence of 'lock-in' is exhibited in Figure 8.


1 REM five features, ten traits, sixth feature emerging
10 SCREEN 7: WINDOW (0, 0)-(320, 200): CLS

20 ' $DYNAMIC 'technical limitation of
30 DIM scrn(221, 101, 6) AS INTEGER 'array size in QBasic 4.5
40 RANDOMIZE TIMER
41 ar = .8: br = .2: sa = .2: bs = .8: na = 1: nb = 1: s = .01: r = .01

'additional declaration for Arthur routine (see Table 2)
50 FOR z = 0 TO 5 'five initial features
60 FOR y = 0 TO 99 'fill arrays and paste screens
70 FOR x = 0 TO 219
90 w = INT(10 * RND)
100 IF z = 5 THEN scrn(x,y,z) = -1 ELSE scrn(x, y, z) = w
101 IF z = 4 THEN PSET(x, y), (w+ 6)
110 NEXT x
120 NEXT y
130 NEXT z

140 DO
150 y = INT(RND * 100)
160 x = INT(RND * 220)
161 IF scrn(x, y, 5) = -1 THEN helpvar1 = 4 ELSE helpvar1 = 5

170 zz = INT(RND * 4) 'attribute relevant neighbourhood elements randomly
180 IF zz = 0 THEN x2 = x - 1: y2 = y
190 IF zz = 1 THEN x2 = x + 1: y2 = y
200 IF zz = 2 THEN x2 = x: y2 = y - 1
210 IF zz = 3 THEN x2 = x: y2 = y + 1

'attribute relevant neighbours randomly
br> 'repair effect at the margins
220 IF x2 = -1 THEN x2 = 219: IF x2 = 220 THEN x2 = 0
230 IF y2 = -1 THEN y2 = 99: IF y2 = 100 THEN y2 = 0

240 c = 0 'compute relative similarity with relevant neighbour
250 FOR z = 0 TO helpvar1
260 IF scrn(x2, y2, z) = scrn(x, y, z) THEN c = c + 1
270 NEXT z
280 IF helpvar1 = 4 THEN p = .2 * c ELSE p = .1666 * c
290 IF RND > p THEN GOTO 360 'only interact with probability p;

'otherwise use routine for ‘lock-in’ (Table 2)
300 IF helpvar1 = 4 THEN noneq = INT((5 - c) * RND) ELSE noneq = INT((6 - c) * RND)
310 FOR z = 0 TO helpsvar1 'in the case of dissimilarity
320 IF scrn(x2, y2, z) <> scrn(x, y, z) THEN GOTO 330 ELSE noneq = (noneq + 1)
330 IF noneq = z THEN scrn(x, y, z) = scrn(x2, y2, z)

'adjust colour
331 IF (noneq = z and scrn(x,y,5) < 1) THEN SCRN(X, Y, 5) = scrn(x, y, 5) + 1

'two values only !
340 NEXT z

350 PSET (x, y), (scrn(x, y, 4) + 6) 'repaint the screen
351 IF scrn(x, y, 5) > -1 THEN PSET (x, y + 100), (scrn(x, y, 5) + 6)
352 goto 460 'loop

360 IF RND < .5 GOTO 370 ELSE GOTO 400
370 returna = ar + r * na: returnb = br + r * nb
380 IF returna > returnb THEN na = na + 1 ELSE nb = nb + 1
390 IF returna > returnb GOTO 430 ELSE GOTO 440

400 returna = sa + s * na: returnb = bs + s * nb
410 IF returna > returnb THEN na = na + 1 ELSE nb = nb + 1
420 IF returna > returnb GOTO 430 ELSE GOTO 440

430 PSET (x, y), 6: scrn(x, y,5) = 0: GOTO 460
440 PSET (x, y), 7: scrn(x, y,5) = 1

460 LOOP WHILE INKEY$ = ‘‘ 'make it possible to exit
470 END

Table 9. Emergence of a technology feeding into the culture, with the potential of ‘lock-in’
This code may be downloaded from here and run under Windows

5.21
The result is that, indeed, both types of lock-in occur. A 'lock-in' is not destabilized by cultural assimilation or learning (given these parameter values). When a 'sub-optimal lock-in' has occurred as the one associated with a value of zero for scrn(x,y,5), this situation cannot be changed by the upward drift in the emerging (cultural) dimension towards a value of one at the overlay level.

5.22
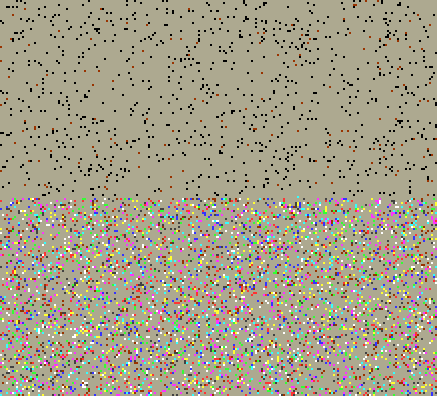
Even more interesting than the observation of sub-optimal 'lock-in' is the effect a 'lock-in' (on either side) has on the underlying culture. The colour of the 'lock-in' penetrates rapidly into the underlying culture because of the ongoing dissemination mechanism. This effect is independent of the side of the 'lock-in' and it is fast, that is, it is significant before the alternative technology has disappeared.

Figure 8. Simulation of the dissemination of culture under the condition of 'lock-in'

5.23
How can one understand this cultural 'anticipation' of a dominant technology? In the case of pending 'lock-in,' the technological regime first pervades the cultural dissemination by suppressing variation. The main difference from the previous case is that the model then allowed for 10 values attributable to the emerging trait, while in this case there are only two values. Thus, the difference between a complex dynamics enriching culture and one impovering it can be specified in terms of the semantic space available to adopters at the level of the emerging system.

* Conclusion

6.1
Our interest in the cultural diffusion of technological innovations has led us to recombine Arthur's (1988) model of potential 'lock-in' in the case of competing technologies with Axelrod's (1997b) model for the dissemination of culture. The resulting model enabled us to specify that 'lock-in' between two competing technologies tends to reduce cultural variety, while a single technological development with a progressive development of new variants tends to enrich the underlying culture. Furthermore, the emerging overlay counteracts regional compartmentalization in both these models.

6.2
For the understanding we have used the concepts of 'lock-in' versus 'deadlock.' The 'lock-in' of a single dominant technology can 'deadlock' cultural development, unless the cultural dimension provides room to develop a variety among technologies along the time axis, for example, by developing next generations of the new technology. From the policy perspective, the crucial question seems to be whether innovation is gaining momentum along a trajectory. Without a specific trajectory 'upsetting the movement towards equilibrium' (Schumpeter, 1939; Nelson & Winter, 1982), the cultural system can be expected to remain regionally compartmentalized. A lack of development in the technology (for example, because of 'lock-in') may also depress the cultural variety. Thus, the technological and cultural dynamics may inhibit each other to the extent that the type of the technology determines the culture that prevails (Figure 8).

6.3
At the methodological level, I have wished to show that the translation of positive theories into selective conditions which can be formalized in computer code enables us to combine very different types of theories in the simulation as subdynamics of a complex dynamics. The advantage of using a simple language (like BASIC) was mainly didactical, since the parsimony of the language prevents a digression into the complexities of more complex computer coding. The computer coding remains theoretically guided, and the results can therefore be appreciated with reference to these theoretical contexts (Leydesdorff, 1995).

6.4
The interactive recombination adds surplus value to the theoretical debate: the visual patterns on the screens are not only an illustration of the theoretical points, but the simulation results can be used to stimulate trans-paradigmatic communication in an analytically retractable way. Thus, complex system modeling and complex systems theorizing can perhaps be made more integrated.

Notes

1In another context, I have used the metaphor of a Triple Helix of university-industry-government relations to describe the evolutionary complexities involved when innovations are considered as a consequence of the interactions among knowledge production, wealth generation, and (public and private) control (Leydesdorff & Etzkowitz, 1998).

2'Selection environments' of 'technological trajectories' (Nelson & Winter, 1982) cannot be considered as 'naturally given.' For example, selection environments may contain 'market' or 'non-market' elements and to varying degrees. The empirical referents of these concepts have to be specified on the basis of theorizing.

3The model described here is equivalent to the cellular automata majority rule and the behaviour is exactly what one would expect from such a cellular automaton (Gilbert & Troitzsch, 1999, at pp. 130 ff.; cf. Toffoli & Margolus, 1987).

4I used the Von Neumann neighbourhood for reasons of parsimony. The Von Neumann neighbourhood is simpler than the Moore neighbourhood, whereas the effects of the two neighbourhoods were rather similar in the case elaborated above.

5However, all species of chaotic behaviour (including crises) can be contained in a model of three interacting subdynamics (Leydesdorff, 2000).

6This size is convenient because of system's limitation (in QBasic 4.5), and because it will allow us in a next simulation to picture two representations above each other on the same screen. In other (commercial) variants of Basic (e.g., PowerBasic) it is possible to circumvene the system's limitation and thus to simulate these models using full screens.

7The colours 6 to 15 of the BASIC palette are used because they are brighter than the colours associated with lower sequence numbers.

8See for this code at <http://pscs.physics.lsa.umich.edu/Software/CC/CC7/CULTURE.P.html>


* References

ANDERSEN, Esben Slot (1994). Evolutionary Economics: Post-Schumpeterian Contributions. London: Pinter.

ARTHUR, W.B., ERMOLIEV, Y.M., KANIOVSKI, Y.M. (1987). 'Path dependent processes and the emergence of a macrostructure,' European Journal of Operational Research, 30: 294-303.

ARTHUR, W. Brian (1988). 'Competing technologies.' In: Dosi, G., Freeman, C., Nelson, R., Silverberg, G., and Soete, L. (Eds.), Technical Change and Economic Theory, London: Pinter, pp. 590-607.

ARTHUR, W. Brian (1989). 'Competing Technologies, Increasing Returns, and Lock-In by Historical Events,' Economic Journal, 99: 116-31.

ARTHUR, W. Brian (1994). Increasing Returns and Path Dependence in the Economy. Ann Arbor: University of Michigan Press.

ARTHUR, W. Brian, DURLAUF, Steven N., LANE, David A. (1997). The Economy as an Evolving Complex System II : Proceedings Santa Fe Institute Studies in the Sciences of Complexity, Vol. 27. Redwood, CA: Addison-Wesley.

AXELROD, Robert (1997a). The Complexity of Cooperation: agent-based models of competition and collaboration. Princeton: Princeton University Press.

AXELROD, Robert (1997b). 'The Dissemination of Culture: A Model with Local Convergence and Global Polarization,' Journal of Conflict Resolution, 41:203-26.

BRUCKNER, Eberhard, EBELING, Werner, JIMENEZ, Miguel A. , Montaño and SCHARNHORST, Andrea (1994). 'Hyperselection and Innovation Described by a Stochastic Model of Technological Evolution.' In: Leydesdorff, L., and Van den Besselaar, P. (Eds.), Evolutionary Economics and Chaos Theory: New directions in technology studies, London and New York: Pinter, pp. 79-90.

DARWIN, Charles (1856). The Origin of Species. London. [The Origin of Species by means of natural selection, or The preservation of favoured races in the struggle for life. 6th ed., London: Murray, 1876.]

DAVID, Paul A. (1985). 'Clio and the Economics of QWERTY,' American Economic Review, 75: 332-7.

ETZKOWITZ, Henry, and LEYDESDORFF, Loet (Eds.) (1997). Universities and the Global Knowledge Economy: A Triple Helix of University-Industry-Government Relations. London: Cassell Academic.

ETZKOWITZ, Henry, and LEYDESDORFF, Loet (2000). 'The Dynamics of Innovation: From National Systems and 'Mode 2' to a Triple Helix of University-Industry-Government Relations,' Research Policy, 29(2): 109-123.

FISHER, J. C., and R. H. Pry (1971). 'A Simple Substitution Model of Technological Change,' Technological Forecasting and Social Change, 3, 75- 88.

FRENKEN, Koen, and LEYDESDORFF, Loet (2000). 'Scaling Trajectories in Civil Aircraft (1913-1997),' Research Policy, 29(3): 331-348.

GIDDENS, Anthony (1984). The Constitution of Society. Cambridge: Polity Press.

GILBERT, Nigel G., and TROITZSCH, Klaus G. (1999). Simulation for the Social Scientist. Buckingham/Philadelphia: Open University Press.

KAUFFMAN, Stuart A. (1993). The Origins of Order: Self-Organization and Selection in Evolution. New York: Oxford University Press.

LANGTON, Christopher G. (Ed.), (1989). Artificial Life. Redwood City, CA: Addison Wesley.

LEYDESDORFF, Loet (1995). The Challenge of Scientometrics: The development, measurement and self-organization of scientific communications. Leiden: DSWO Press, Leiden University; at <http://www.upublish.com/books/leydesdorff-sci.htm>

LEYDESDORFF, Loet (2000). 'The Triple Helix as an Evolutionary Model of Innovations,' Research Policy 29 (2):243-255.

LEYDESDORFF, Loet (2001). A Sociological Theory of Communication: The Self- Organization of the Knowledge-Based Society. Parkland, FL: Universal Publishers, 2001; at <http://www.upublish.com/books/leydesdorff.htm>

LEYDESDORFF, Loet, and VAN DEN BESSELAAR, Peter (1998). 'Competing Technologies: Lock-ins and Lock-outs.' In: Dubois, Daniel M. (Ed.), Computing Anticipatory Systems, Proceedings of the American Institute of Physics 437. Woodbury, NY: American Institute of Physics, pp. 309-23.

LEYDESDORFF, Loet, and ETZKOWITZ, Henry (1998). 'The Triple Helix as a model for innovation studies,' Science and Public Policy. 25(3):195-203.

NELSON, Richard R., and WINTER, Sidney G. (1982). An Evolutionary Theory of Economic Change. Cambridge, MA: Belknap Press.

PEARL, Judea (1988). Probabilistic Reasoning and Artificial Intelligence: Networks of Plausible Inference. San Mateo, CA: Morgan Kaufmann.

PLOURABOUE, Franck, STEYER, Alexandre and ZIMMERMAN, Jean-Benoît (1998). 'Learning Induced Criticality in Consumers' Adoption Patterns: A Neural Network Approach,' Econ. Innov. New Techn., 6:73-90.

SAHAL, Devendra (1982). 'Alternative conceptions of technology,' Research Policy 10:2- 24.

SCHUMPETER, Joseph ([1939] 1964) Business Cycles: A Theoretical, Historical and Statistical Analysis of Capitalist Process. New York: McGraw-Hill.

TOFFOLI, Tommasso, and MARGOLUS, Norman (1987). Cellular Automata Machines. Cambridge, MA: MIT Press.

VAN ALSTYNE, Marshall, and BRYNJLOFSSON, Erik (1996). 'Could the Internet Balkanize Science?' Science 247 (29 November): 1479-1480.

WATTS, Duncan J. (1999). Small Worlds: The Dynamics of Networks between Order and Randomness. Princeton: Princeton University Press.

WATTS, Duncan J. and STROGATZ, Steven H. (1998). 'Collective dynamics of 'small-world' networks,' Nature 393 (4 June): 440-442.

----

ButtonReturn to Contents of this issue

© Copyright Journal of Artificial Societies and Social Simulation, 2001