©
Copyright JASSS


David Brichoux and Paul E. Johnson (2002)
The Power of Commitment in Cooperative Social Action
Journal of Artificial Societies and Social Simulation
vol. 5, no. 3
<https://www.jasss.org/5/3/1.html>
To cite articles published in the Journal of Artificial Societies and Social Simulation, please reference the above information and include paragraph numbers if necessary
Received: 22-Apr-2002
Accepted: 14-Jun-2002
Published: 30-Jun-2002
 Abstract
-
This paper presents an agent-based simulation model of protest activity. Agents are located in a two dimensional grid and have limited ability to observe the behavior of other agents in the grid. The model is used to explore questions inspired by research on different theories of individual motivation and the so-called theory of critical mass. The simulations describe individuals who support an effort to change a policy, but acting in support of that effort is costly. When the marginal effect of participation reaches a certain level, people are more likely to get involved. With certain configurations of parameter values, the simulations produce no sustained widespread participation in protest regardless of the presence of activists; under other conditions high levels of protest are usually sustained, even without activists. However, the addition of a surprisingly small group of activists radically changes the aggregate behavior of the model under some conditions, making high and sustained protest possible when it otherwise would not have been.
- Keywords:
-
Critical Mass; Protest; Simulation; Social Movements; Swarm
-
"Only a few were our people; the rest just seemed to come
from nowhere. You could tell by the way they acted that it was all
new to them. They sure weren't hard-core demonstrators" (Agapito
Aquino, quoted in Johnson 1987, 83).
Introduction
- 1.1
-
On the night of February 22, 1986, Agapito Aquino, brother of slain
Philippine opposition leader Benigno Aquino, and Jaime Sin, archbishop
of Manila, broadcast calls over Manila's Catholic radio station asking
for volunteers. They wanted citizens to march to Camp Aguinaldo, and
there to form a human wall of defense, protecting Defense Minister
Juan Ponce Enrile and his group of rebels from the Philippine military.
- 1.2
-
At 11:00 p.m. Aquino waited at the arranged meeting point with a group
of six followers. People began to arrive at 11:15. It took fifteen
minutes for the group to grow from 200 to 2000; by 11:45 it was 10,000
strong, and 15,000 marched to the camp shortly after midnight (Johnson
1987).
- 1.3
-
The group was not devoid of activists; Aquino was a leader of several
demonstration groups and Sin deployed Manila's legions of nuns. These
nuns and veteran demonstrators formed the core of what became a four-day
series of street protests that involved millions of people and helped
to overthrow one of the world's most durable regimes. But the vast
majority of people involved were ordinary citizens who belonged to
no organization at all. Further, so far as we know, they did not receive
any personal incentive in return for participating.
- 1.4
-
In this paper, we attempt to ascertain the conditions under which
protest actions of that sort can develop. We begin with a discussion
of the literature on protest. To explore our ideas, we create a computer
simulation model of individual beliefs and behaviors. The results
indicate that, under certain settings of the parameters, a small group
of agents whose only resource is commitment, or the propensity to
protest and keep protesting, can lead by example, producing a large
and sustained protest in which most participants are not members of
the original group. In our simulation, the conditions that make this
possible are those that pertained in Manila in 1986: sufficient population
density and communications to enable each person to observe the behavior
of a fairly large group of others, and relatively high resistance
by the regime to the protesters' demands.
Framing the Problem
- 2.1
-
One of the most significant problems for theoretical and empirical
research into social protest and revolution is the collective action
problem (Olson 1965). Protest movements face a free-rider problem.
Even though all members of a society might want to get rid of their
government, or significantly change it in some way, the Olsonian logic
seems to predict that nothing will happen, unless a leader appears
who can offer people something selective in return for participating.
Gordon Tullock was one of the first political economists to extend
this logic to its fullest: "The public good aspects of a
revolution are of relatively little importance in the decision to
participate" (Tullock 1971, p. 92). Instead, Tullock contended
that the effort to obtain private goods--a personal share of the benefits
of political change--was the prime motivation.
- 2.2
-
Many scholars have been reluctant to accept this explanation for the
willingness of individuals to participate. Some of the reluctance
is based on empirical grounds (Muller and Opp 1986). Partly because
of the empirical shortcomings of the private goods explanation for
protest, other theorists have proposed models that emphasize a social
``success motivation'' that individuals might hold. The success
motivation theories claim that people act because they think their
participation will have an impact on the end result (Fireman and Gamson,
1979; Finkel, Muller, Opp 1989; Obershall 1980). Oberschall contends
that the probability of success in a protest movement has an S-shaped
curve which depends on the number of protesters (1980). When the number
of participants is either very small or very large, the individual
impact is small because the collective effort is very likely either
to fail or to succeed without an additional contributor. In the middle
ranges, however, individuals think the chances that they will tip
the scale are higher and they are therefore more likely to participate.
- 2.3
-
Marwell and Oliver pursued this notion in a series of studies using
computer simulation. They advanced the ``theory of the critical
mass.'' Their fundamental assumption was that the collective action
problem could be overcome if (1) individual impact is rising in some
portion of the ``production function'' and (2) a ``critical
mass'' of highly resourceful and interested individuals exists whose
contributions push the collectivity into the ``right part'' of
the curve, thus making it profitable for others to join. The ``critical
mass'' studies explored the effects of different production functions,
interest and resource heterogeneity (Oliver, Marwell and Teixeira
1985), group size (Oliver and Marwell 1988), characteristics of social
networks (Marwell, Oliver, and Prahl 1988), selection strategies (Prahl,
Marwell and Oliver 1991), cliques (Marwell and Oliver 1991), and all of the above (Marwell and Oliver 1993).
- 2.4
-
The theory of the S-shaped curve implies that protest can occur if
the dynamical sequence of events is ``just right.'' This is one
of the major points in the theory proposed by Timur Kuran. Kuran proposes
a threshold model (Granovetter 1973; Schelling 1978) of preference
revelation, one in which people reveal their disapproval of a regime
only when they believe that a sufficiently high percentage of other
people in the society also disapprove (Kuran 1989, 1991, 1995). One
of Kuran's contentions with which we agree strongly is that objective
social conditions can set the stage for protests to arise, but they
do not in any substantial way help us to understand when and how discontent
is eventually manifested. Rather, discontent is eventually manifested
through a complicated chain of individual interactions which cannot
be predicted with a high degree of precision.
- 2.5
-
Kuran leaves open several questions for analysis. First, there is
the problem of limited information. Kuran contends, quite rightly,
that an unpopular political regime ``has an incentive to discourage
independent polling and discredit surveys that reveal unflattering
information'' (1991, p. 21). However, in his formal analysis, Kuran
proceeds to propose a protest model in which citizens have complete
information about the views expressed by others. We propose to develop
an alternative perspective, one in which individuals are only able
to perceive the discontent expressed by others within a well-demarcated
field of vision (neighborhood). It is interesting to ask whether this
new assumption that agents are ``myopic'' will significantly change
the prediction of the model. Second, through a computer analysis,
we want to offer some insights into the conditions into which a ``prairie
fire'' of discontent can be started and propagated. Like Kuran, we
believe that protests can be triggered by the introduction of a relatively
small number of activists who behave differently. This is a person
for whom the cost of ``dissent may be outweighed by the satisfaction
he derives from being true to himself'' (1991, p. 19). The computer
model yields some new insights into the dynamics of the process.
- 2.6
-
There is an alternative explanation of protests based on ``information
cascades.'' Most notable is Lohmann's (1994) study of political upheaval
in East Germany between 1989 and 1991. The information cascade model
claims that citizens are unsure whether their government is bad or
not. As they observe discontent, they increasingly think that their
political regime is undesirable. The details of the East German case
are not our main point of interest, but we have some serious doubts
about the empirical relevance of that account. Our model supports
an alternative treatment offered by Przeworski (1991). The collapse
of the East European regimes was not caused by the diffusion of information
about the unattractiveness of the regimes; many people already thought
the regimes were bad. What diffused was information about the probability
that the regime would give in. People were "updating their
probabilities of success" (Prezworski 1991, pp. 3-4). The
information cascade model, like Kuran's threshold model, presupposes
that people can observe the behavior of all other people in coordinating
their actions. Our model of behavior with myopic agents is, of course,
based on quite a different view of the situation.
- 2.7
-
The model we present has a number of novel features. We implement
an agent-based model in which individual behavior inherits the S-shape
of the ``success motivated'' models. We explore the impact of
limited information about the behavior of other people. We explore
the background possibilities of success-motivated protest, and then
explain the conditions under which the addition of a small group of
dedicated activists who lead only by example can make a difference.
In our emphasis on heterogeneity in an agent-based framework, the
research strategy has an element in common with other recent projects
on social construction (Lustick 2000; Lustick and Miodownik 2000).
- 2.8
-
While the implications of the model are rich and point in many directions
for future study, the most important points are the following. First,
because success-motivated protest occurs when individuals perceive
the probability of success as being in its mid-range, all parameters
that affect it have nonlinear and interactive effects. Second, the
introduction of heterogeneity in the types of agents--including some
agents who protest consistently regardless of the behavior of others--can
have a dramatic impact on the level of collective action observed.
Sometimes, when a society of discontented people exhibits no tendency
to express its discontent, the addition of a few consistently active
individuals can lead to widespread protest.
An Agent-Based Simulation Model
- 3.1
-
One strength of the agent-based modeling approach is that one can
consider rich, empirically meaningful theories of individuals as well
as various conditions under which they might interact. Nevertheless,
to preserve some theoretical clarity, we pitch the model at a rather
abstract level. The agents are located in two-dimensional space that
might roughly be thought of as the map of a city or state. We have
typically considered models that are represented by a 40-by-40 grid
of cells. In this report, we allow the grid to ``wrap around''
to form a torus (as a result, no agent is ``on the outside edge''
of the world). The model diverges from a typical cellular automata
model in one vitally important way. Although each cell of the grid
has eight neighboring cells, each cell can hold any number of agents,
or it might hold none at all.
- 3.2
-
In our model, time passes in discrete steps. At each iteration, each
agent has the opportunity to join or withdraw from a collective protest
action. To avoid peculiar effects due to repetition of the model,
we have taken two modeling strategies. First, the order in which agents
act is randomly shuffled after each iteration. Second, each agent's
action is registered in the environment immediately. (That is to say,
the models we describe here are all asynchronous in nature). The code
for the model is freely available under the terms of the GNU Greater
Public License.
The computer model was written in Objective-C using libraries from
the Swarm Simulation System version 2.1.1. It is available at http://lark.cc.ukans.edu/~pauljohn/Swarm/MySwarmCode/activists-20020412.tar.gz
- 3.3
-
An agent's behaviors consist of observing all the cells within a specified
radius in order to measure the proportion of other agents that are
contributing to a collective action, and then contributing (or not).
Each agent performs both of its behaviors before the next agent, rather
than all agents looking, then all agents acting.
- 3.4
-
Activists are agents who will protest no matter what happens. Their
propensities are quite simple as a result.
- 3.5
-
The ordinary citizens, however, are a bit more interesting. Our plan
is to focus on the impact of individual perceptions and interdependence
without imposing too many distracting ad hoc assumptions. In this
pursuit, we are adhering to the kiss principle (``keep it
simple, stupid!'' Axelrod 1997, p.5). The intention is to lay bare
the assumptions and implications of the ``success motivation''
theories. Our objective is to understand enough about political upheaval
in the world of ordinary agents and then to appreciate the introduction
of activists at a later stage.
- 3.6
-
Suppose that all of these ordinary agents desire the same goal and
all are motivated by the desire to help the movement succeed. As proposed
by Oberschall (1980), they believe that the probability of success
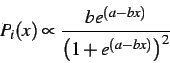
is an S-shaped curve, which we have represented by the logistic relationship:
|
Probability of success= |
|
(1) |
|
Probability of success= |
|
(2) |
We assume that b>0, indicating that the proportion of agents
who are participating (X), has a positive effect on the probability
of success. The effect of adding a protester is maximized when the
proportion of agents protesting is a/b, so the constraint that
0 < a/b < 1 assures that the maximum does not exist at either
extreme. This assures that the curve is thus S-shaped.
- 3.7
-
The spatial element of the simulation arises because we believe that,
during times of political upheaval, people don't typically have comprehensive
information about the state of the political situation. Rather, they
can observe the behavior of people within a limited neighborhood of
their personal experience. In this project, we explore the implications
of the idea that agents project from their local observations to formulate
expectations about the larger political framework. The agent lacks
the information to make the calculations described in Equation 1 with
perfect accuracy; its information is strictly local. The agent does
not know how many agents are currently protesting throughout the society,
but rather has knowledge only of people within a given radius of vision.
The agent is able to gauge the proportion of others who are taking
action within that radius.
- 3.8
-
We proceed with the hypothesis that each agent assumes that its locality
is typical. In doing so, the agent estimates the probability of successful
collective action as described in Equation 1, except that the proportion
of visible agents protesting (x) is put in place of the aggregate
proportion protesting (X).
- 3.9
-
Since each agent is motivated solely by the desire to help the movement
succeed, the agent's probability of protesting is the greatest in
the mid-ranges of this relationship, where the individual's marginal
impact is the greatest. This implies that the probability of individual
participation, Pi(x) , is proportional to the slope of the
relationship that the individual perceives between the level of protest
and the probability of success:
|
|
|
(3) |
In the simulation models described below, we suppose there is a constant
of proportionality, k , such that
|
|
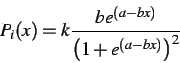
|
(4) |
The constant of proportionality k is constrained
to assure that Pi(x)<1 , making this model of individual
behavior probabilistic.
Parameters of the ordinary success-motivated agent
- 3.10
-
The grid on which the agents are randomly arranged is 40-by-40. As
we explore the model of ordinary success-motivated agents, we can
adjust the population level (the number of agents distributed over
the 1600 cells), the vision radius of the agents (which determines
the number of cells in all directions that are taken into account
by the agent), as well as the parameters which govern the response
of the political regime, a and b , and the constant of
proportionality, k.
- 3.11
-
The parameter a is a ``nuisance'' parameter, in the sense
that none of our results hinge on its particular value. That parameter
determines the probability that the political regime will give the
protesters what they want, even if no level of protest action manifests
itself. That is to say, even if the level of participation is 0, there
is still a possibility, however small, that the goal desired by the
agents will be achieved. The probability of that occurring is 1/1+ea .
In all of the experiments recorded here, we held a constant
at 8, implying that agents believe the probability of success when
no one visible is protesting is 0.0003.
- 3.11
-
The responsiveness or resistance of the political regime is one of
the parameters in which we are interested. The parameter, b,
is important because it determines how rapidly the probability of
success responds to changes in protest participation. In particular,
we have focused on the idea of ``regime resistance,'' which is
represented by the ratio a/b. If the level of protest equals
a/b, then the probability of success is 0.5, and the impact
of adding an additional protester is at its maximum. If a/b
is a very small number, the political system is acutely responsive,
while if the number is higher, it means that the regime ignores protest
until it rises to a higher level. Our experiments used values of 1/20,
1/14, 1/8, and 1/2. The individual's effort makes the most difference
for success at this protest level, and thus it is here that each agent's
likelihood of protesting is at its maximum.
- 3.12
-
We adjusted the free parameter k so that the maximum probabilities
of protesting remained the same in all experiments. For each value
of a/b, k was set so that the maximum probability of
protesting for any agent at any time would be 0.99. The agent's probability
of protesting when there are no visible protesters was the same across
all experiments: it is 0.0013.
Summary of the Model Design
- 3.13
-
The code for this model is freely available and we encourage readers
to inspect it. The sequence of events in the model is orchestrated
as follows.
-
The regime resistance coefficient is set at a constant value.
- A sample of N agents is created and assigned at random (uniform distribution)
to positions in the grid.
- At each time step, the following occurs:
-
The list of agents is shuffled.
- Each agent measures protest within its vision radius, calculates the
proportion of people who are protesting, and decides whether to protest
(see 4).
- Each agent's behavior is immediately registered in the environment
of all succeeding agents.
In the model we report here, the agents never move about in the grid
and new agents are never created after the simulation has begun.
Results
-
The Behavior of Ordinary Agents
- 4.1
-
We have observed may interesting patterns while exploring the behavior
of agents in this model. At its core, the success-motivation has a
confounding sort of nonlinearity: agents will not join if it is ``too
hot'' or ``too cold,'' but rather ``just right'' (with apologies
to Goldilocks). Because agents are most likely to protest when they
believe they will make a difference, the probability of success cannot
be too high or too low, or they will refuse to act. Vision radius
and population both determine the number of others an agent can see.
If an agent can see too few others, then even a small number of visible
protesters has an inordinate effect on the agent's visible proportion
protesting and thus on the perceived probability of success, moving
it far above the range of highest protest propensity for the agent.
If the agent sees too many others, one or two protesters are too small
a proportion of the visible total to bring the probability of success
up into its mid-range, and again the agent is reluctant to contribute.
- 4.2
-
Because the aggregate patterns of protest depend on a complicated
interplay of individual perceptions and social behaviors, a great
deal of variety is observed across a set of simulations. In many runs
of the model, ``nothing happens.'' There are small seeds of social
action, but nothing beyond random individual expressions of discontent.
In other runs, however, it is apparent that there are quite complicated
dynamics, as a protest movement grows rapidly. The results are difficult
to summarize neatly, but we have settled on the strategy of running
the model for 1000 iterations and then calculating the summary statistics,
such as mean and maximum levels of protest observed across that time
period.
- 4.3
-
Regime resistance values tested were 1/20, 1/14, 1/8, and 1/2. Variations
in two other parameters were considered as well. We used different
population sizes ranging from 200 to 1000 by increments of 200. And
while we gave all agents in any single experiment the same vision
radius, we experimented with seven different radii ranging from one
to seven by increments of one. Thus in some experiments agents were
very myopic, seeing only nine of the 1600 cells on the grid; in others
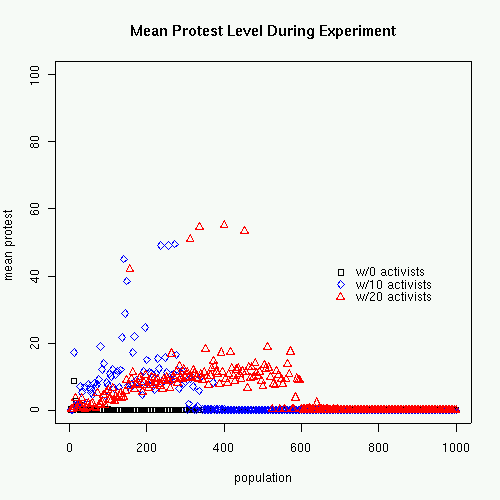
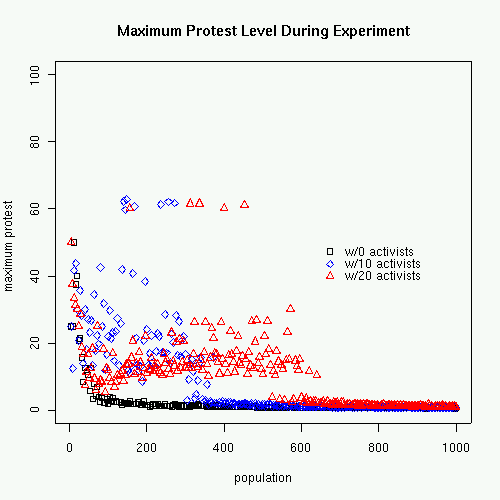
they were fairly far-sighted and capable of seeing 225 cells, with
the remainder of experiments in between the two extremes. There are
140 combinations of these parameter values, and we started our investigations
by running five experiments with different random seeds at each configuration,
creating a total of 700 experiments. Each experiment lasted for 1000
iterations.
- 4.4
-
In order to convey the relationship between the parameters and the
outcomes of the simulations, we begin with a meta analysis of the
results. Table 1 shows ordinary least squares regression results for
a model in which the dependent variable is the mean protest level
during a 1000-iteration experiment and the independent variables are
these parameters and interactions among them. Population, vision radius,
and regime resistance all have positive effects on the level of protest
if those parameters are set at small values, while the signs of the
squared terms indicate that the effect diminishes and then turns negative.
Table 1: Effects of Regime Resistance (
a/b), Population, and Vision
on Mean Protest Level
|
| Variable |
OLS estimate |
t-stat |
|
| a/b |
161.799 |
17.829 |
| Population |
0.027 |
8.478 |
| Vision Radius |
9.593 |
22.229 |
| (a/b) Squared |
-250.362 |
-17.926 |
| Population Squared |
-0.00000606 |
-2.682 |
| Vision Radius Squared |
-0.661 |
-15.132 |
| (a/b)*Population |
-0.039 |
-5.951 |
| (a/b)*Vision Radius |
-8.537 |
-8.806 |
| Population * Vision Radius |
-0.004 |
-10.378 |
| (a/b)*Population * Vision Radius |
0.007 |
4.885 |
| Constant |
-27.254 |
-18.195 |
| R2 |
.71 |
|
| N |
700 |
|
|
- 4.5
-
The complicated and nonlinear logic of success-motivated protest is
seen plainly in the effect of the regime resistance parameter. Regime
resistance has an effect similar to population and vision. If the
parameter b is very small, then no amount of protest will matter,
and people don't join, since the regime is highly resistant to the
forces of change. As b is increased, then resistance (a/b)
goes down, and the willingness to join rises. However, once resistance
drops to a certain level, then only a small number will ever protest.
When the agents perceive that even a small percent protesting might
succeed, then many agents will not join the effort. On the other hand,
if regime resistance is too high, the agent perceives success as too
remote, even if he or she sees some others protesting.
- 4.6
-
Predictably, the effects of population level (which determines density)
and the agent's vision radius (which is, in effect, perceived density)
interact with one another. Suppose agents can see only a few other
agents. Then a single act of protest will convince all agents within
vision that the level of protest, as a proportion of citizens, is
high. If regime resistance is low, others do not protest because they
think that their contribution would be unnecessary. Adding additional
agents, however, causes the density of local environments to rise.
A single agent's expression of discontent is not enough to convince
the others that the regime will respond favorably without their additional
contribution. In this middle range of population, then, we have the
possibility that protest can spread by drawing new participants who
believe they are making a difference. When the population becomes
extremely dense, however, then individual agents again conclude that
their personal contribution would be insufficient to affect the regime.
- 4.7
-
In the following sections, we restrict our attention to a setting
in which the agents are limited in their vision. However, we have
conducted simulations in which the agents have a full vision of the
grid. For example, suppose each agent has a vision radius of 19. If
there are no activists, and the population in the grid exceeds 2000,
then the average level of protest observed is never greater than one
percent. That is to say, the protest observed reflects the occasional
individual outburst, but no self-sustaining pattern of protest develops.
At the lowest level of regime resistance, 1/20, then, a densely populated
society of agents with high vision radius is not likely to exhibit
much protest.
- 4.8
-
From these simulations, we have formulated some opinions about the
conditions under which the addition of a few activists ought to make
a difference. Since the presence of activists can only increase but
not decrease the other agents' estimates of the probability of success,
activists should help to promote protest only when the perceived probability
of success is too low. This happens when agents can see too many other
agents or when the regime is too resistant to protester demands. We
would not expect activists to make a difference when the population
or vision radius is low, or when the regime is prone to giving the
protesters what they want.
Just a few activists can have a major impact, if conditions are right.
- 4.9
-
To verify the reasoning above we create a new type of agent, the activist,
that protests during every iteration. The activist is otherwise identical
to the other agents, meaning that it can influence others only by
example, not by reward or punishment. We experimented with a number
of models, but we found some of the most interesting results when
just a few activists were introduced as a tightly concentrated group,
so we placed them all in the same cell in the center of the grid.
To begin, we ran 700 new experiments with the same parameter values
as in our original simulations, but now with ten activists in the
center cell. Then we repeated these experiments with twenty activists,
giving us a total of 2100 experiments to compare, including the original
set. For ease of presentation, we held population constant at 600
to create Table 2, which shows the difference that twenty activists
make at each level of vision and regime responsiveness.
Table 2: Means of Average Protest Level During Each Experiment
|
| |
|
|
Vision |
| Regime Resistance |
N. of Activists |
|
1 |
2 |
3 |
4 |
5 |
6 |
7 |
|
| 1/2 |
0 |
|
0.9 |
0.0 |
0.0 |
0.0 |
0.0 |
0.0 |
0.0 |
| 1/2 |
20 |
|
0.8 |
00.1 |
01.0 |
02.7 |
05.1 |
17.8 |
01.5 |
| 1/8 |
0 |
|
0.2 |
18.2 |
19.6 |
19.9 |
19.7 |
18.1 |
3.8 |
| 1/8 |
20 |
|
0.2 |
18.1 |
19.2 |
19.3 |
19.1 |
16.2 |
16.0 |
| 1/14 |
0 |
|
0.0 |
4.9 |
14.1 |
13.4 |
13.6 |
13.5 |
13.6 |
| 1/14 |
20 |
|
0.0 |
4.6 |
13.8 |
13.0 |
13.0 |
12.7 |
13.0 |
| 1/20 |
0 |
|
0.0 |
0.1 |
10.8 |
10.1 |
10.5 |
10.4 |
10.9 |
| 1/20 |
20 |
|
0.0 |
0.0 |
11.0 |
9.9 |
10.2 |
09.9 |
10.0 |
|
Entries are means of average protest levels observed
across 5 experiments, each of which lasted 1000 iterations. Population
is fixed at 600. Regime resistance is a/b,
the protest level that makes probability of success = 0.5.
- 4.10
-
As expected, activists make a difference when the regime is highly
resistant to protester demands and when vision radius is high, in
the upper right cells of the table. At these values the agents think
the probability of success is too low, and a few activists can raise
it into the region where they think their own effort will be worthwhile.
However, activists do seem to be more effective at vision radius 6
than 7, provided regime resistance is very high. This indicates that
their ability to overcome perceptions of a low probability of success
is somewhat limited as well.
Illustration of the impact of activists.
- 4.11
-
To better illustrate the dynamics of a model with some activists,
we present a comparison of the graphs of protest growth and snapshots
of the grids from several runs of the model. During our research,
we conducted many simulations with varying population, regime resistance,
and vision radius. For illustration purposes, we have selected a series
of runs of the model in which the population is 688, regime resistance
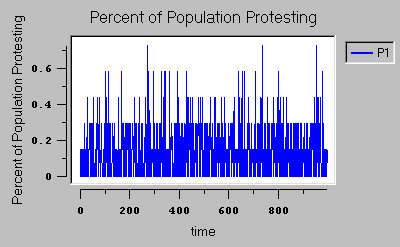
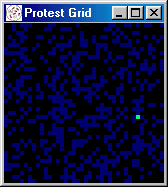
is 1/20, and the vision radius of the agents is 6. Figure 1a shows
the graph of protest growth during 1000 iterations of that model when
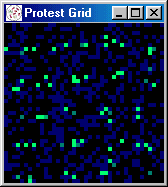
there are no activists. Figure 1b is a snapshot of the grid during
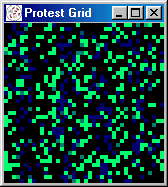
iteration 269 of the same experiment. It is color coded so that black
cells are empty, dark blue represents an occupied cell with low protest,
and bright green indicates high protest levels.
Figure 1: Low Regime Resistance (
a/b = 1/20 )
[ Protest Levels]
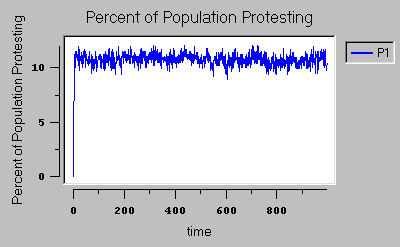
[Grid Snapshot]
- 4.12
-
The low regime resistance in Figure 1 produces a saturation
effect; even a small amount of visible protest is sufficient to make
agents believe that the probability of success is too high to make
their contribution worthwhile. The result is small clusters of protest
distributed fairly evenly across the grid.
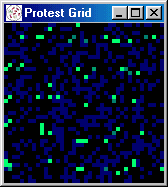
Figure 2: Effect of Activists with Low Regime Resistance (
a/b = 1/20
)
[Protest Level]
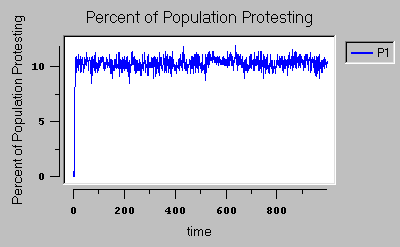
[Grid Snapshot]
- 4.13
-
The snapshot in Figure 1 is not atypical; the individual
protesters change constantly, but the general pattern does not. If
we add activists into a world with a very responsive government, the
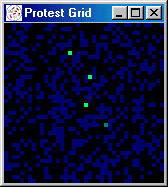
impact is not too great. Figure 2 illustrates
what happens when we run the same experiment again, but this time
with 20 activists added to the center cell. (Again, the picture of
the grid in panel b was taken on iteration 269, a representative iteration.)
The activists make almost no difference. Protest does not grow because
the regime is too responsive to the protesters' wishes and the probability
of success rises too quickly in response to protest; adding activists
actually exacerbates this problem slightly. Individuals who might
join and pitch in are discouraged because only a small amount of collective
effort is needed and because others appear willing to provide it.
The region around the center cell in panel b has lower protest than
it otherwise would, because agents there have no interest in helping
a cause that seems almost sure to succeed anyway.
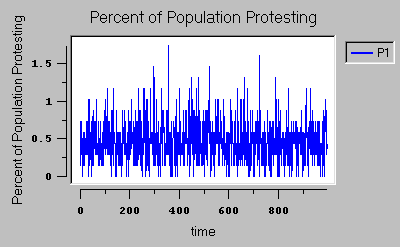
Figure 3: High Regime Resistance (
a/b = 1/2)
[Protest Levels]
[Grid Snapshot]
- 4.14
-
Activists are more likely to make a difference if the regime's resistance
to the protesters' demands is increased. Figure 3
illustrates a sample run in which there are no activists and regime
resistance is increased to 1/2. There is almost no protest activity
at all. There are occasional individual agents who randomly express
their opinions, but they are not sufficient in number to persuade
others to join up. The protest seems a lost cause.
- 4.15
-
When regime resistance is high, adding a few activists can make a
big difference because activists raise the probability of success
significantly in their neighborhood, and the new, more hopeful estimation
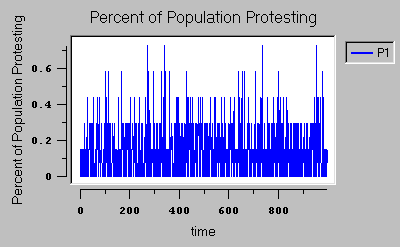
spreads. In Figure 4, we present
a graph which shows the level of protest rises in a way that is indicative
of contagion. This model is the same as the one represented in 3,
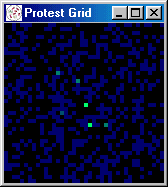
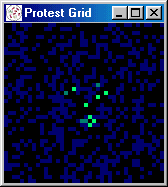
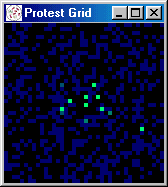
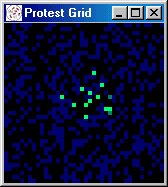
but it introduces 20 activists in the center cell. For 240 iterations
the presence of the activists has almost no effect. Then (apparently
at random) protest begins to spread, growing in spurts to 60 percent.
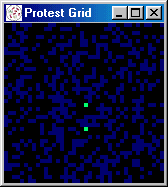
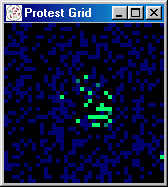
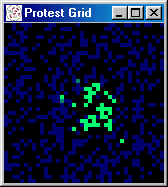
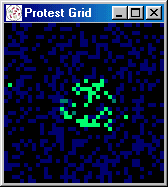
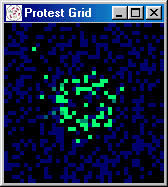
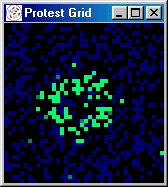
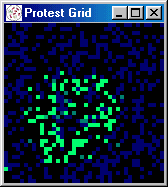
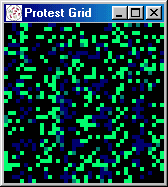
Figures 5 and 6 present a series of snapshots of the protest grid during iterations 251-260, 300, 450, 500, and
1000.
Figure 4: Effect of Activists with High Resistance (
a/b = 1/2)
[Protest Levels]
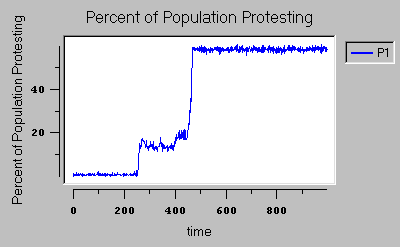
Figure 5: Grid Snapshots Illustrating Role of Activists
[iteration: 251]
 |
[iteration: 252]
 |
[iteration: 253]
 |
[iteration: 254]
 |
[iteration: 255]
 |
[iteration: 256]
 |
[iteration: 257]
 |
[iteration: 258]
 |
[iteration: 259]
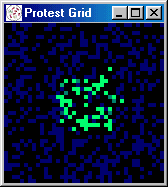 |
Figure 6: Grid of Snapshots Illustrating Role of Activists (cont)
[iteration: 260]
 |
[iteration: 300]
 |
[iteration: 450]
 |
[iteration: 500
] |
[iteration: 1000]
 |
|
| |
|
|
- 4.16
-
There are limits to what the activists can overcome, however. Raising
the vision radius discourages the development of protest because the
apparent probability of success remains low and the agents fail to
respond to the activists. In Figures 7
and 8, we illustrate one run of the model
in which the vision radius is raised to 7, while holding regime resistance
at the already high value of 1/2. Again, we took snapshots of the
grid at iteration 269. The run without activists is shown in Figure
7. In Figure 8,
we illustrate the result of inserting 20 activists to the center cell.
It has no apparent effect. This run is representative of a broader
set of simulations.
Figure 7: High Vision Radius
[Protest Levels]
[Grid Snapshot]

Figure 8: Activists in a Model with High Vision Radius
[Protest Levels]
[Grid Snapshot]
Variability Across Model Runs
- 4.17
-
The level of observed protest depends on a complicated pattern of
individual interactions. As such, one should expect that repetition
of the model under a particular set of parameters will produce a variety
of observed behaviors. Sometimes the protest movement coalesces at
the beginning of the timeline, sometimes at the end, and sometimes
never at all.
- 4.18
-
To convey a sense of the variability of results across runs, and to
highlight the impact of activists on the observed level of unrest,
we have collected the results of a final set of replications. We have
fixed the vision radius of the agents at 7 and regime resistance at
1/2. We vary the population level between 4 and 1000, and assign three
different values for the number activists: 0, 10, or 20. There are
thus 250 runs of the model, one at each population level, for each
of the three settings for the activists variable, resulting in a total
of 750 runs. To summarize each simulation, we collected the average
level and the maximum observed level of protest.
- 4.19
-
The scatterplots summarizing these results are presented in figures
9 and 10. Note that the observed levels
of political unrest for low and medium population values are quite
variable across runs. Random variations in the positioning of agents
and the detailed sequencing of individual behaviors accounts for the
observed variation.
- 4.20
-
Some additional points are worth emphasizing. Success-motivated protest
movements do not materialize when the level of population density
is high. When density is high, citizens can see many other citizens
and they are never convinced that the level of existing protest is
high enough to cause them to feel personal efficacy and join in. Random
expressions of protest do not cause a bandwagon effect to commence.
It is not likely that an agent will decide to protest simply because
a few others are doing so. In order to generate self-sustaining levels
of protest with these levels of population and vision, the level of
regime resistance must be significantly lower.
- 4.21
-
In the middle ranges of population density, however, the addition
of some activists can make a big difference some of the time.
Note, for example, that when the population is 400, then the addition
of 20 activists can cause high levels of unrest some of the time.
With no activists protest means never exceed 5 percent at populations
over 20; with twenty activists means of 10 percent or more are common
if the population is no higher than 550. Protest maxima tell the same
story, but do a better job of revealing the dampening effect of population.
Conclusion.
- 5.1
-
The purpose of this research project is to develop theory and explore
its implications. The conditions of the simulation are simplified
and abstracted to focus attention on a few key variables. We are motivated
to pursue the S-shaped curve hypothesis and the importance of activists
by some notable anecdotal accounts of protest movements, such as the
events in Manila in 1986. We do not think the predictions of these
simulation models will map one-for-one onto any particular historical
sequence of events. Moreover, since one of the major points of emphasis
has been the unpredictable nature of individual interaction which
drives political protest, we think it would be inappropriate to try
to make such an empirical stretch.
- 5.2
-
Our simulation results show that when the probability of favorable
government response is in a middle range, a few consistent activists
can make the difference in a society of success-motivated individuals.
We discussed a number of parameters in the agent-based model that
can make the recipe ``just so.'' The effects of key parameters
such as regime resistance, vision, and population are nonlinear and
highly interactive, but they contribute to dynamics that provide a
simple explanation for when activists make a difference and when they
will have no effect.
- 5.3
-
Success-motivated individuals will contribute to success only when
their effort can be expected to matter. Sometimes the individuals
can see too many others, or the regime is too resistant to change,
and individuals who do see a few protesters will conclude that their
own effort would be wasted in a losing cause. Under such conditions,
a few activists can make a big difference. But their power to overcome
perceptions of hopelessness is not without limits.
- 5.4
-
As a final contribution and spur to further research, our study invites
investigation of situations where success-motivated collective action
is stymied by an overly responsive regime. The idea that raising the
probability of success can cause collective action to grow is well-established
(e.g. Przeworski 1991, 3-4). This frequently occurred in our simulations.
But what about the opposite dynamic? Are there situations where reducing
regime responsiveness actually increases collective action? Do religious
or environmental groups experience easier recruitment during the ascendancy
of their political opponents, for example? Our study predicts that,
at least some of the time, they should do so.
References
-
-
[1]
- AXELROD R (1997) The Complexity of Cooperation: Agent-Based
Models of Competition and Collaboration. Princeton, NJ: Princeton
University Press.
- [2]
- FINKEL S E, Muller E N and Opp K (1989) Personal Influence, Collective
Rationality, and Mass Political Action. American Political Science
Review, 83(3), pp. 885-903.
- [3]
- FIREMAN B and Gamson W A (1979) ``Utilitarian Logic in the Resource
Mobilization Perspective.'' In Zald, M N and McCarthy J D (Eds.),
The Dynamics of Social Movements, Cambridge, MA: Winthrop.
- [4]
- GRANOVETTER M (1973) Threshold Models of Collective Behavior. American
Journal of Sociology 83, pp. 1420-43.
- [5]
- JOHNSON B (1987) The Four Days of Courage: The Untold Story
of the People Who Brought Marcos Down. New York: The Free Press.
- [6]
- KURAN T (1995) Private Truths, Public Lies: The Social Consequences
of Preference Falisification. Cambridge, MA: Havard University Press.
- [7]
- KURAN T (1989) Sparks and Prarie Fires: A Theory of Unanticipated
Political Revolution. Public Choice 61(1), pp. 41-74.
- [8]
- KURAN T (1991) Now out of Never: The Element of Surprise in the Eastern
European Revolution of 1989. World Politics 44(1), pp. 7-48.
- [9]
- LOHMANN S (1994) The Dynamics of Informational Cascades: The Monday
Demonstrations in Leipzig, East Germany, 1989-91. World Politics
47, pp. 42-101.
- [10]
- LUSTICK I S (2000) Agent-Based Modeling of Collective Identity: Testing
Constructivist Theory. Journal of Artificial Societies and Social
Simulation 3(1) (https://www.jasss.org/3/1/1.html).
- [11]
- LUSTICK I S and Miodownik D (2000) Deliberative Democracy and Public
Discourse: The Agent-Based Argument Repertoire Model. Complexity
5(4), pp. 13-30
- [12]
- MARWELL G and Oliver P E (1991) ``A Theory of the Critical Mass.
VI. Cliques and Collective Action." In Kreutz H and Bacher
J (Eds.) Disciplin und Kreativitat, Opladen: Leske and Burdich,
pp. 49-62. .
- [13]
- MARWELL G and Oliver P E (1993) The Critical Mass in Collective
Action: A Micro-Social Theory. Cambridge: Cambridge University Press.
- [14]
- MARWELL G P, Oliver P E, and Prahl R (1988) Social Networks and Collective
Action: A Theory of the Critical Mass. III. American Journal
of Sociology 94 (3), pp. 502-534.
- [15]
- MULLER E N and Opp, K (1986) Rational Choice and Rebellious Collective
Action. American Political Science Review 80(2), pp. 473-487.
- [16]
- OBERSCHALL A (1980) "Loosely Structured Collective Conflict:
A Theory and an Application." In Kriesberg L (Ed.), Research
in Social Movements, Conflict, and Change, vol. 3, Greenwich, CN:
JAI Press, pp. 45-68. .
- [17]
- OLIVER P E, Marwell G, and Teixeira R (1985) A Theory of the Critical Mass. I.
Interdependence, Group Heterogeneity, and the Production of Collective
Action. American Journal of Sociology 91 (3), pp. 522-556.
- [18]
- OLIVER P E and Marwell G (1988) The Paradox of Group Size in Collective
Action: A Theory of the Critical Mass. II. American Sociological
Review 53, pp. 1-8.
- [19]
- OLSON M, Jr (1965) The Logic of Collective Action. Cambridge:
Harvard University Press.
- [20]
- PRAHL R, Marwell G, and Oliver P E (1991) Selectivity as Strategies
of Recruitment for Collective Action: A Theory of the Critical Mass,
V. Journal of Mathematical Sociology 16, pp. 137-164.
- [21]
- PRZEWORSKI A (1991) Democracy and the Market: Political and
Economic Reform in Eastern Europe and Latin America. Cambridge: Cambridge
University Press.
- [22]
- SCHELLING T C (1978) Micromotives and Macrobehavior. New York:
WW Norton.
- [23]
- TULLOCK G (1971) The Paradox of Revolution. Public Choice 11, pp.
91-99.
 Return to Contents of this issue
©
Copyright Journal of Artificial Societies and Social Simulation,
[2002]