Guillaume Deffuant, Frédéric Amblard, Gérard Weisbuch and Thierry Faure (2002)
How can extremism prevail? A study based on the relative agreement interaction model
Journal of Artificial Societies and Social Simulation
vol. 5, no. 4
<https://www.jasss.org/5/4/1.html>
To cite articles published in the Journal of Artificial Societies and Social Simulation, please reference the above information and include paragraph numbers if necessary
Received: 17-Jul-2002 Accepted: 20-Sep-2002 Published: 31-Oct-2002
 AbstractThe Relative Agreement model
|
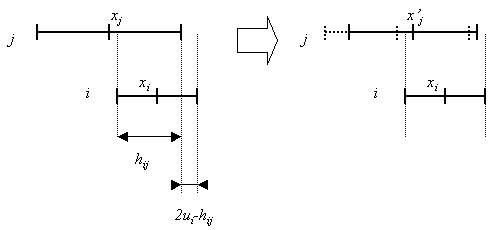
| Figure 1. agent i (opinion xI and uncertainty uI) influences agent j (opinion xj and uncertainty uj). hij is the overlap between i and j and 2ui-hij is the part of i non-overlapping with j. On the right, the dotted lines represent the position of the segment before the interaction, and plain lines after. |
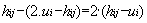
The overlap hij is given by:
The non-overlapping width is:
(Eq. 1)
The agreement is the overlap minus the non-overlap:
(Eq. 2)
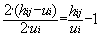
The relative agreement is the agreement divided by the length of segment si:
(Eq. 3)
(Eq. 4)
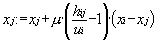
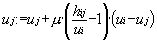
(Eq. 5) where µ is a constant parameter which amplitude controls the speed of the dynamics. If hij ≤ ui, there is no influence of i on j.
(Eq. 6)
|
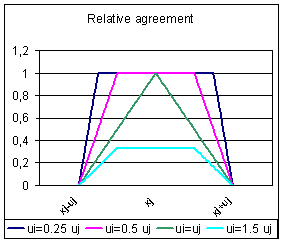
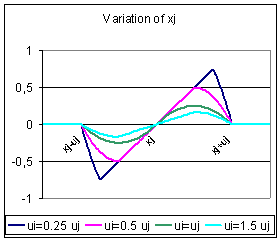
| Figure 2. On the left, plot of the relative agreement of i with j as a function of xi, for different values of ui. On the right, plot of the variation of xj as a function of xi, for different values of ui. When ui tends to 0, the relative agreement tends to be a window. When ui > 2uj the relative agreement is 0 and i has no influence on j. The variation of xj is null when xi and xj are equal. When the distance between xi and xj increases, the variation of xj increases until a maximum and then decreases. |
|
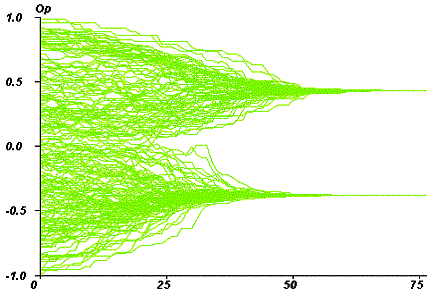
| Figure 3. Time chart of opinions for an initial uniform uncertainty of 0.4. The time scale is the average number of iterations per agent. N, the agents umber is 200. |
|
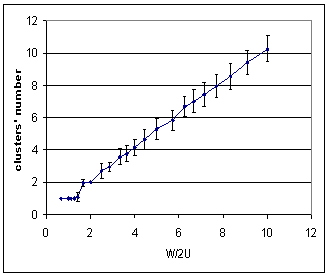
| Figure 4. Plot of the average cluster number as a function of w/2u (w is the width of the initial distribution and u is the uncertainty of the agents). Each dot represents the final number of clusters averaged over 50 simulations (an isolated agent is not considered as a peak). The number of clusters is close to w/2u (r2=0.99), whereas it is close to the integer part of w/2u in the BC model. |
The RA model with extremists: convergence types
(Eq. 7)
|
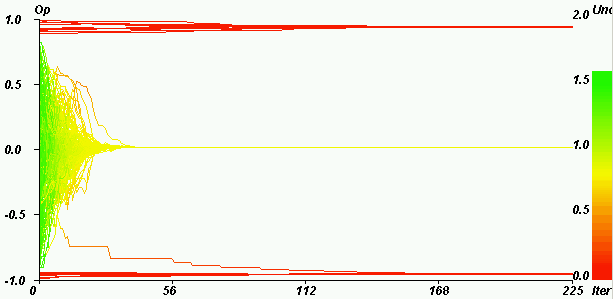
| Figure 5. Example of central convergence. Horizontal axis: iterations. Vertical axis: opinions. Coloured axis: uncertainties. pe = 0.2, u = 0.4, µ = 0.5, delta = 0, ue = 0.1, N = 200. The majority (96%) of the moderate agents (initially green, between the two extremes) are not attracted by the extremes. The convergence indicator value (defined in section 4) is 0.03. |
|
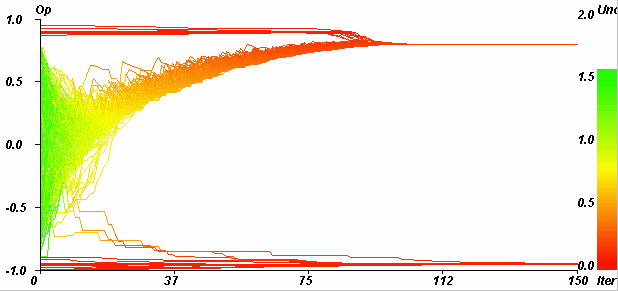
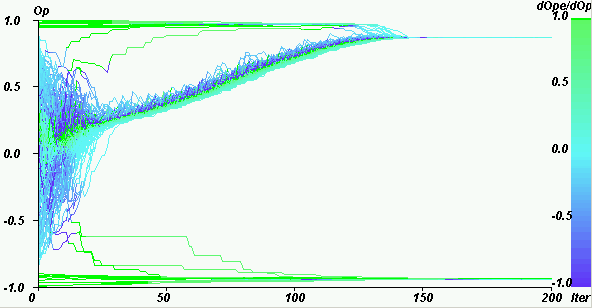
| Figure 6. Example of both extremes convergence. Horizontal axis: iterations. Vertical axis: opinions. Coloured axis: uncertainties. pe = 0.25, u = 1.2, µ = 0.5, delta = 0, ue = 0.1, N = 200. The initially moderate agents (initially green, between the two extremes) split and become extremists (43% on the positive side, 56% on the negative side). The convergence indicator value (defined in section 4) is 0.49. |
|
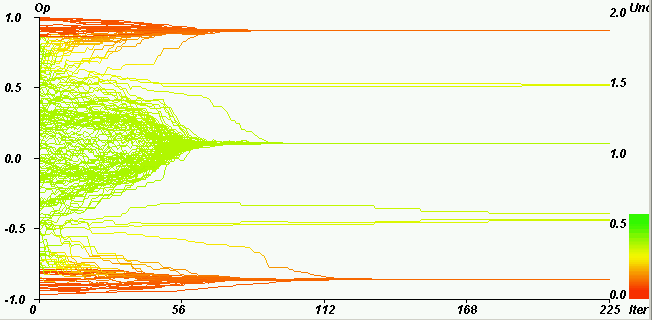
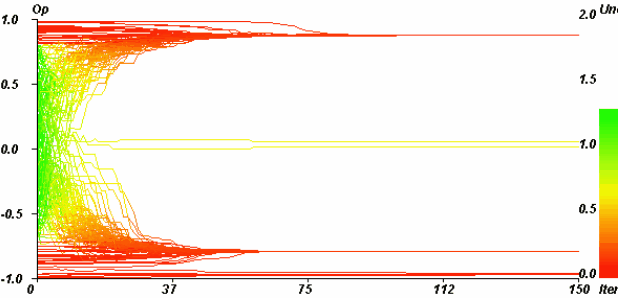
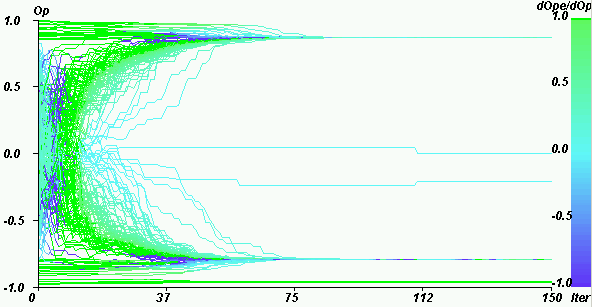
| Figure 7. Example of single extreme convergence. Horizontal axis: iterations. Vertical axis: opinions. Coloured axis: uncertainties. pe = 0.1, u = 1.4, µ = 0.5, delta = 0, ue = 0.1, N = 200. The majority (98.33%) of initially moderate agents (initially green, between the two extremes) is attracted by the negative extreme. The convergence indicator value is 0.97. |
|
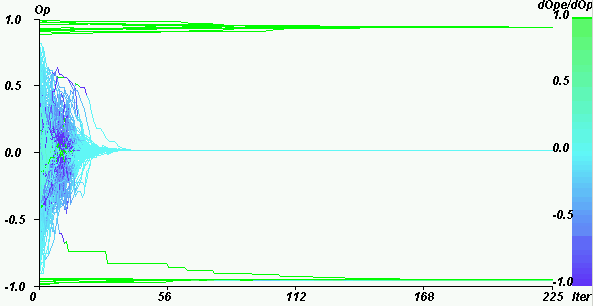
| Figure 8. Central convergence for the same parameters as in figure 7. Horizontal axis: iterations. Vertical axis: opinions. Coloured axis: uncertainties. pe = 0.1, u = 1.4, µ = 0.5, delta = 0, ue = 0.1, N = 200. The majority stays at the centre (Only one agent joins the negative extreme). The convergence indicator value is 3.0 e-5. |
General results of the parameter space exploration
 |
(Eq. 8) |
| The intermediate values of the indicator correspond to intermediate situations. | |||
| Value of y | 0 | 0.5 | 1 |
| Type of convergence | Central | Both extremes | Single extreme |
|
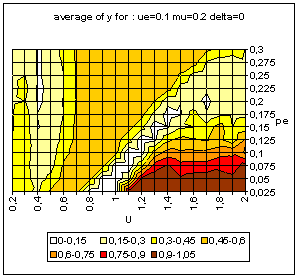
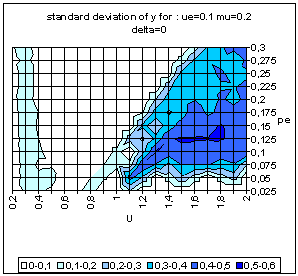
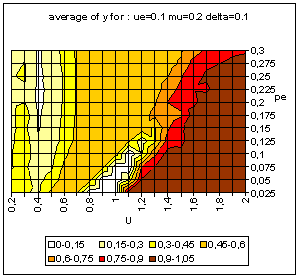
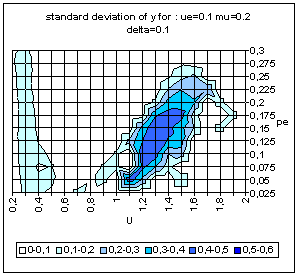
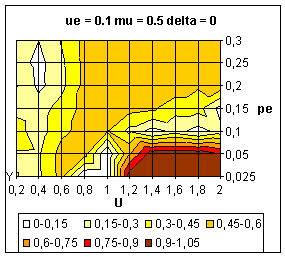
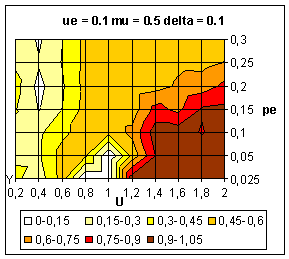
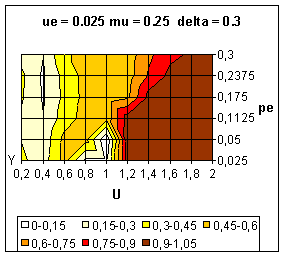
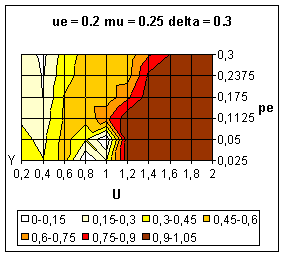
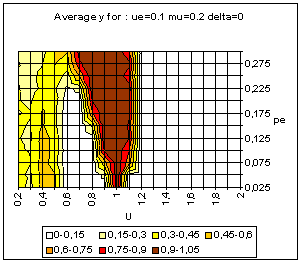
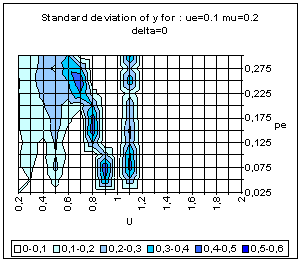
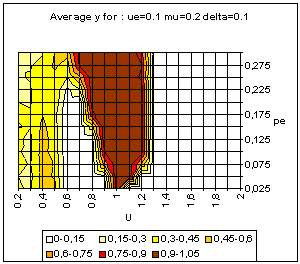
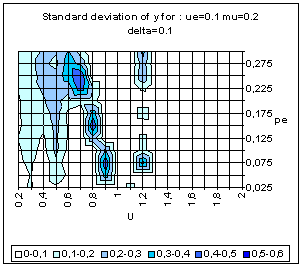
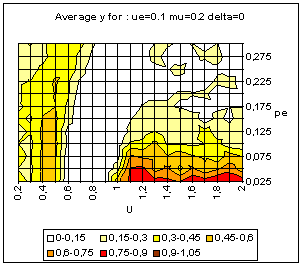
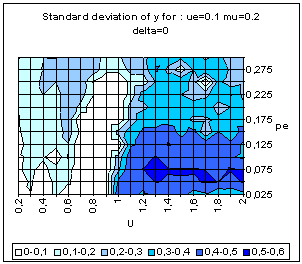
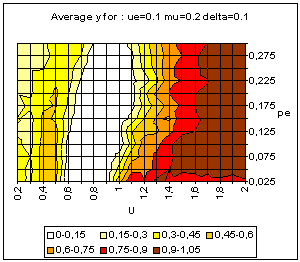
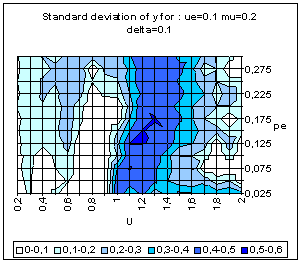
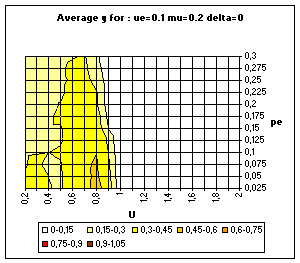
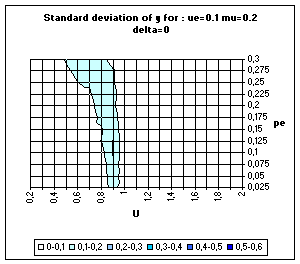
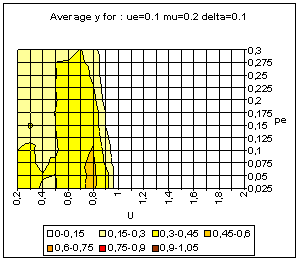
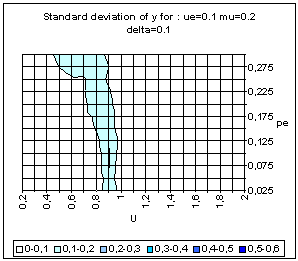
| Figure 9. Typical pattern of average and standard deviation of indicator y (50 simulations at each point of the graph) as a function of the uncertainty of the moderate agents (U) and the global proportion of extremists (pe) for delta = 0 (top) and delta = 0.1 (bottom). The other parameters are fixed: uncertainty of the extremists ue = 0.1, intensity of interactions µ = 0.2, initial relative difference between the extremists, delta = 0.1. On the graph of average y, the yellow or white zones on the left part correspond to central convergence, the orange, typically in the upper middle part to both extremes, and brown at the bottom right to single extreme. |
|
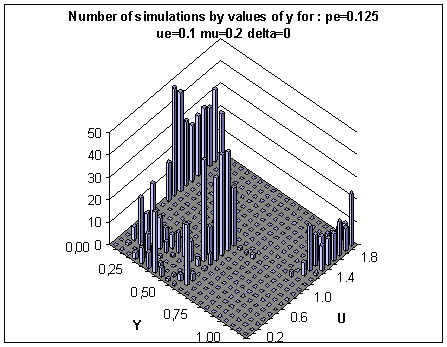
| Figure 10. Histograms of the values of the y indicator taken along the line pe = 0.125 of figure 9 with δ = 0. In the large u crossover region (u > 1) the same parameters lead to either central or single extreme clustering (y close to 0 or close to 1). In the medium u (0.5 < U < 1) we only get both extremes clustering (y close to 0.5). In the small u crossover region (u below 0.5), the histogram shows different convergences which are intermediary between central and double extremes (with varying proportions of agents having joined the extremes). |
| Description | Symbol | Tested values | ||
| Global proportion of extremists | pe | 0.025, 0.5, 0.1, 0.15, 0.2, 0.25, 0.3 | ||
| Initial uncertainty of the moderate agents | U | 0.2, 0.4, 0.6, 0.8, 1, 1.2, 1.4, 1.6,1.8, 2 | ||
| Initial uncertainty of the extremists | ue | 0.05, 0.1, 0.15, 0.2 | ||
| Relative difference between the proportion of positive and negative extremists:
| δ | 0, 0.1, 0.2, 0.3, 0.4, 0.5 | ||
| Intensity of interactions | µ | 0.1, 0.2, 0.3, 0.4, 0.5 |
|
| Figure 11. Average value of y over 10 simulations. Influence of intensity parameter (µ) on the dynamics. These figures must be compared with figure 9. |
|
| Figure 12. Average value of y over 10 simulations. Influence of the bias between the extremes (delta) on the dynamics. |
|
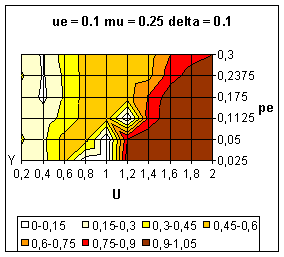
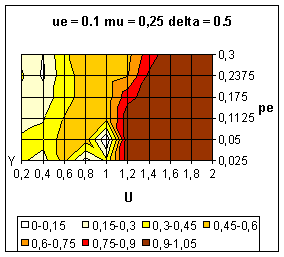
| Figure 13. Average value of y over 10 simulations. Influence of the extremists' uncertainty (ue) on the dynamics. |
Analysis of the convergence process
(Eq. 10)
|
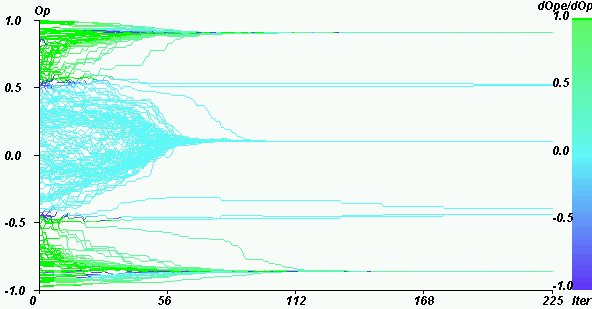
| Figure 14. Weight of the extremists in the mean influence on the opinion for U = 0.4, pe = 0.2, delta = 0, N = 200. Green points close to the both extremes indicate that the influence is mainly the effect of the extremists. Turquoise points in the middle indicate that the the influence of the extremists is negligible. Blue points, just in between, indicate that the influence of the extremists is contrary to the global influence. |
|
| Figure 15. Mean influence in a case of both extreme convergence. The values of the parameters are: pe = 0.15, U = 0.8, µ = 0.5, delta = 0, N = 200. We note that the extremists have no significant influence on the closest to the extremes (dark blue points). On the contrary, the extremists have a preponderant influence in a zone of more initially moderate opinions (green parts). |
|
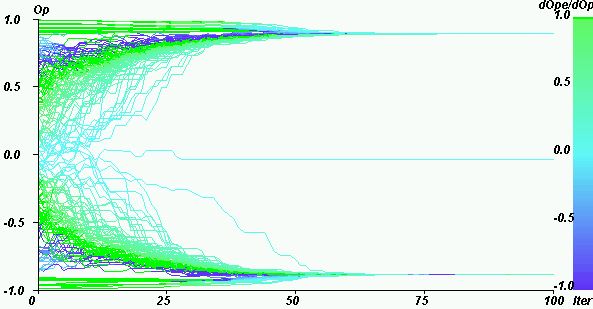
| Figure 16. Weight of the extremists in the mean influence for U = 1.6, pe = 0.2, µ = 0.5, delta = 0, N = 200. At the very beginning, the extremists have a low influence and the population tends to cluster at the centre. Then, a competition between the extremists' influence and the central clustering tendency occurs (because the uncertainty of the agents decreased). |
|
| Figure 17. Weight of the extremists in the mean influence for U = 1.4, pe = 0.1, µ = 0.5, delta = 0. Case of single extreme convergence. |
|
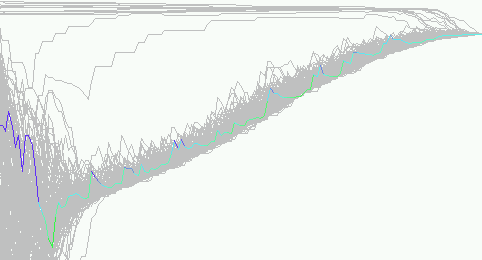
| Figure 18. Zoom on an individual trajectory in the run of figure 17, all the trajectories are in grey, except one, for which the colour indicate the weight of the extremists in the mean influence. After the central clustering process, the agents fluctuate during the drift to the extreme. From times to times they go suddenly up under the influence of an extremist. Then they go down under the attraction of the close majority. This leads to the progressive drift of the clustered majority to the extreme. |
|
| Figure 19. Weight of the extremists in the mean influence for U = 1.4, pe = 0.1, µ = 0.5, delta = 0. For the same parameters as on figure 17, we obtain a central convergence. |
Convergence patterns for BC model variants
 the influence of x' on x is given by:
(Eq. 11)
|
| Figure 20. Simple BC model. Average and standard deviation of y for 50 simulations on each point of the grid, for delta = 0 (above) and delta = 0.1 (bottom). |
 |
(Eq. 12) |
|
| Figure 21. BC model with averaging uncertainties. Average and standard deviation of y for 50 simulations on each point of the grid, for delta = 0 (above) and delta = 0.1 (bottom). |
(Eq. 13)
(Eq. 14)
|
| Figure 22. BC model with uncertainty based on variance estimation. Average and standard deviation of y for 50 simulations on each point of the grid, for delta = 0 (above) and delta = 0.1 (bottom). |
Discussion and conclusion
2Integer and vector opinions dynamics have also been studied in the literature, especially as "cultural dynamics", see e.g. Axelrod R. (1997) "Disseminating cultures" pp. 145-177, in Axelrod R., The complexity of cooperation, Princeton University Press.
3We don't use here uncertainty with the idea that it represents some maximum discrepancy between the agent opinion and some objective reality as it is done in the literature on information cascade. We here use uncertainty since agents with high uncertainty easily change opinion (while those with low uncertainty on the contrary almost never change their opinion). However, this choice is not totally satisfactory because the interpretation of the model includes also the notions of conviction, confidence, tolerance or openness to others influence. Unfortunately, there is no word mixing together all these notions, we chose the one which appeared the most general. Since the model is explicitly defined here, we expect that wording is of less importance than in the traditional sociological literature.
4A difference with the approach of Hegselmann and Krause (2002) and our is that they use a parallel updating of opinions as if at each time step, all agents would survey the opinions of all the others to whom they are connected and average over these opinions. We use random sequential updating based on the idea of pair interactions. Several variants can be imagined for the updating process, random sequential updating seeming a natural one. The only rationales we can imagine for parallel updating is that at the origin (Chatterjee and Seneta 1977; Cohen et al. 1986) the model was built to describe decisions in committees and that the linear (no threshold) model is soluble via matrix techniques.
COHEN, J., KAJNAL, J. and NEWMAN, C.M. 1986. Approaching consensus can be delicate when positions harden. Stochastic Processes and their Applications, 22, 315-322.
DEFFUANT, G., NEAU, D., AMBLARD, F. and WEISBUCH, G. 2000. Mixing beliefs among interacting agents. Advances in Complex Systems, 3, 87-98.
DEFFUANT, G. 2001. Final report of project FAIR 3 CT 2092. Improving Agri-environmental Policies: A Simulation Approach to the Cognitive Properties of Farmers and Institutions. <http://wwwlisc.clermont.cemagref.fr/ImagesProject/default.asp>
DITTMER, J.C. 2001. Consensus formation under bounded confidence. Nonlinear Analysis, 47, 4615-4621.
FAURE, T., Deffuant, G., Amblard, F. and Weisbuch, G. 2002. Master equation implementation of the relative agreement model: when does extremism prevail? Communication to the Sociophysics Conference. Bielefeld, Germany.
FRIEDKIN, N.E. and JOHNSEN, E.C. 1990. Social influence and opinions. Journal of Mathematical Sociology, 15, 193-206.
FRIEDKIN, N.E. and JOHNSEN, E.C. 1999. Social influence networks and opinion change. Advances in Group Processes, 16, 1-29.
GALAM, S. 1997. Rational Group Decision Making: a random field Ising model at T=0. Physica A, 238, 66-80.
GALAM, S. and WONCZAK, S. 2000. Dictatorship from Majority Rule Voting. European Physical Journal B, 18, 183-186.
HEGSELMANN, R. and KRAUSE, U. 2002. Opinion Dynamics and Bounded Confidence Models, Analysis and Simulation. Journal of Artificial Societies and Social Simulation, 5, 3. <https://www.jasss.org/5/3/2.html>
KACPERSKY, K. and HOLYST, J. 2000. Phase transition as a persistent feature of groups with leaders in models of opinion formation. Physica A, 287, 631-643.
KRAUSE, U. 2000. A discrete nonlinear and non-autonomous model of consensus formation. In: S.Elaydi, G.Ladas, J.Popenda, J.Rakowski (eds.), Communications in Difference Equations. Amsterdam: Gordon and Breach, 227-236.
LATANE, B. and NOWAK, A. 1997. Self-Organizing Social Systems: Necessary and Sufficient Conditions for the Emergence of Clustering, Consolidation, and Continuing Diversity. In: G.A. Barnett and F.J. Boster (eds.), Progress in Communication Sciences. Ablex Publishing Corporation, 1-24.
WALLEY, P. 1991. Statistical Reasoning with Imprecise Probabilities. Chapman and Hall, London.
WEISBUCH, G., DEFFUANT, G., AMBLARD, F. and NADAL, J.-P. 2002. Meet, discuss and segregate! Complexity, 7, 3, 55-63.
 Return to Contents of this issue
© Copyright Journal of Artificial Societies and Social Simulation, [2002]