© Copyright JASSS

  JASSS logo ----

Hiroshi Takahashi and Takao Terano (2003)

Agent-Based Approach to Investors' Behavior and Asset Price Fluctuation in Financial Markets

Journal of Artificial Societies and Social Simulation vol. 6, no. 3
<https://www.jasss.org/6/3/3.html>

To cite articles published in the Journal of Artificial Societies and Social Simulation, please reference the above information and include paragraph numbers if necessary

Received: 31-Oct-2002      Accepted: 1-Jun-2003      Published: 30-Jun-2003


* Abstract

In this paper, we use Agent-Based Approach to analyze how asset prices are affected by investors and investment systems that are based on Behavioral Finance. We build a virtual financial market that contains two types of investors: fundamentalists and non-fundamentalists. As a result of intensive experiments in the market, we find that (1) the traded price agrees with the fundamental value and the fundamentalists survive according to the principle of natural selection in the case that the market contains the same number of fundamentalists and trend predictors (investors who make trend prediction), (2) the traded price largely deviates from the fundamental value and the non-fundamentalists frequently obtain excess returns and therefore the fundamentalists are eliminated according to the principle of natural selection in the case that the proportion of trend predictors is extremely high or in the case that the investment ratio of the risk asset is restricted, and (3) the traded price largely deviates from the fundamental value in the case that the non-fundamentalists estimate the losses excessively, as pointed in Prospect Theory. These results indicate that the non-fundamentalists affect the traded prices and obtain excess returns also in real markets.

Keywords:
Agent-Based Approach; Behavioral Finance; Financial Engineering; Natural Selection; Self-organizing Systems And Emergent Organization; Society Dynamics

* Introduction

1.1
In this paper, we use an Agent-Based Approach to analyze how asset prices are affected by investors' behavior that is rational (based on traditional financial theories) and/or irrational (based on Behavioral Finance). Applying an Agent-Based Approach to finance allows us to explore the price fluctuation mechanism by clearly understanding the relation between investors' behavior and price fluctuations[1].

1.2
Traditional financial theories, including Capital Asset Pricing Model (CAPM), derive the equilibrium asset price on the assumptions of rational investors, homogeneous expectations, and perfect markets. These traditional theories can be evaluated as normative theories[2]. However, the traditional financial theories including CAPM have been criticized in terms of their explanatory power and the validity of their assumptions.

1.3
The Behavioral Finance recently got into the limelight and many reports indicate that the deviation from rationality in decision-making can ravel the anomalies, which cannot be explained with the traditional financial theories. While the traditional asset pricing theories are normative, the behavioral financial theories are more descriptive. It is very important for both academic and business purposes to elucidate the mechanisms of price fluctuations in real markets.

1.4
Similarly to the traditional asset pricing theories, some of the reports in Behavioral Finance attempt to analytically derive the influences of investors' behavior on pricing (Barberis 2001, Kyle 1997). However, the decision-making rules of investors based on Behavioral Finance are much more complicated than the ones in traditional finance, and it is also difficult to derive asset prices analytically in Behavioral Finance.

1.5
In the areas of complex systems and computer science, much recent research reports that complex phenomena emerge from interactions between micro-rules and macro-behavior (Arthur 1997, Wolfram 1994). In the context of financial markets, the micro-rules correspond to investors' behavior and the macro-behavior corresponds to the fluctuation of asset prices. The influences of investors' behavior on pricing are not necessarily derived with analytical methods so that complex macro-behavior may emerge in real markets. We need to introduce a different method to analyze the systems that shows complex macro- behavior.

1.6
In computer science, the Agent-Based Approach is proposed as an effective method to analyze the relation between micro-rules and macro-behavior (Axtell 2000, Russel 1995). The Agent-Based Approach is an attempt to explain the macro-behavior of systems by local rules. As a result of applying this approach to social science, it is found that a variety of macro- behavior emerges bottom-up from local micro-rules (Epstein and Axtell 1996, Levy 2000). An artificial market is one of the good applications of the Agent-Based Approach to financial markets[3] (Arthur 1997). However, the most research in artificial markets makes the micro-rules as simple as possible in accordance with Axerlod's (1997) KISS (Keep It Simple, Stupid) principle , or sometimes the rules are too much mechanical. These micro-rules are different from investors' behavior in real markets.

1.7
In this paper, we apply the Agent- Based approach to traditional and behavioral finance and verify two propositions: (1) the traditional financial theories believe that "rational pricing is achieved if a handful rational investors exist in the market", and (2) Friedman (1953) reported that "irrational investors are eliminated and rational investors survive according to the principle of natural selection" [4]. We verify these propositions under simplified conditions[5].

1.8
In section 2, we describe the studies related to this paper. Section 3 explains the model we use for the analyses and Section 4 illustrates the price fluctuations when irrational investors exist in the market. Then we conclude our discussion in Section 5.

* Related Work

2.1
This section describes related work in the following three categories: (1) rational decision-making, (2) decision-making of human being in real markets, and (3) Agent-Based Approaches.

Studies on Rational Decision-Making

2.2
In traditional financial theories, asset pricing models are built on the assumption that investors make rational decisions to maximize their expected utilities. Ingersoll et al. (1987) assume the several forms of utility functions such as power, logarithmic, and exponential utilities, and they solve nonlinear or dynamic optimization problems to derive the asset prices and the multi-period optimal consumption strategies. Most of the conventional asset pricing theories derive the asset prices on the assumptions of ideal market environments and rational investors. In this sense, the conventional theories represent the ideal situations of markets and asset prices. In the case of using analytical approaches to derive macro-behavior (asset prices) from micro-rules (investors' behavior), the analytic solution is obtained explicitly and there is no possibility that the complex behavior emerges from micro- macro loops.

2.3
Ingersoll et al. have also made analyses under conditions that are one step closer from the perfect investment environment to the real investment conditions[6]. However, only limited analyses are available for the range that analytic solutions can be obtained, so that the analyses do not sufficiently reflect the real investment conditions. Additionally, most of the conventional asset pricing theories (Sharpe 1964, Ingersoll 1987, Fama 1970) do not explicitly deal with updates of investors' dynamic belief on the assumption that new information is immediately reflected to the price. This point also differentiates the assumptions in those theories from real investors' behavior[7].

2.4
The investors in real markets behave according to their belief, and the belief is updated every second based on new information. To explore the mechanisms of real markets, we need to deepen our understanding of the updating process of human belief in the markets.

2.5
Most of the conventional financial theories have not dealt with this dynamic updating process of belief. This is because they assume that new information is immediately reflected in the prices and this can be adequately handled with static decision-making theories. In recent years, Behavioral Finance has been in the limelight and people have shifted their focus to biases in the information processing of investors. This situation raises the need to identify "how the rational information processing or the belief updating process works?" Howson et al. (1993, Berger 1985) report that, in the case of belief updating processes, Bayesian methods should be the standard for rational decision-making . The model proposed by Black et al. (1992), hereafter referred to as the "bayes correction model", is one of the examples of applying Bayesian methods to the financial area . This model assumes that every investor determines the deviation width from the benchmark based on the expected rate of return on the stock[8]. In this paper, we adopt the bayes correction model to represent investment behavior[9].

Studies on Investors' Decision-Making in Real Markets

2.6
Traditional financial theories (Sharpe 1964, Ingersoll 1987, Fama 1970) typically consider that the theoretical price can be derived from fundamental value. On the contrary, Shiller (2000) points out that "in real markets, new theories are created to justify the current stock prices" . Although this kind of investors' behavior is different from the assumptions in conventional financial theories, the recent history of stock prices have large impact on the future prices under the situation that the mechanism Shiller pointed out works.

2.7
Most conventional financial theories build the models by assuming representative rational investors based on the hypothesis that "even if each investor has different future prospects, these errors are canceled out as a whole and do not affect the prices". However, the participants of real markets only have limited information and they do not necessarily process the obtained information appropriately. There is a good possibility that the market participants have a common bias that deviates from rationality. If this is the case, the deviation from rationality will not be canceled out and will have a large impact on the prices. To unravel the mechanism of price fluctuation in real markets, it is quite important to understand the difference between the decision-making in the real world and the one based on the maximization of expected utility and to clarify how the prices are affected by the deviation from rationality on decision-making.

2.8
In the area of cognitive psychology, Kahneman and Tversky (1979) propounded the Prospect Theory of decision-making and reported that people tend to make decision to maximize the value function, not expected utility. The Prospect Theory clarify several characteristics of decision-making in the real world, such as that people make decisions based on the changes from a certain reference point, people react differently when decision-making for profits and for losses, and people cognize losses twice as large as profits (Kahneman and Tversky 1979, Tversky and Kahneman 1981, Kahneman and Tversky 1992, Kagel 1995). The form of the value function (V(x), x: changes from the reference point) is expressed as follows (Kahneman and Tversky 1992):

2.9
The major characteristics of the value function are: (1) it contains the reference point and (2) the decision-making of human being is divided into positive and negative sides[10].

2.10
Other types of deviation from rationality are reported in addition to the ones suggested in Prospect Theory. For example, Over Confidence is to have excessive confidence in one's own decisions and capability, Under Reaction is to make too small updates in one's belief in comparison with Bayes when information is obtained, and Self-Serving Bias is a tendency to interpret information as to one's advantage[11] (Kahneman and Tversky 1982, Kahneman and Tversky 2000, Bazerman 1998).

2.11
These reports describe the decision-making in the real world, while the decision-making based on maximization of expected utility represents the norm on decision-making. This paper models some of the investors' behaviors reported in Behavioral Finance and analyzes how prices are affected by the behavior of each investor type. In this paper, we refer to the investors who make prediction based on fundamental values as "fundamentalists".

Studies on Analyses using the Agent-Based Approach

2.12
Since Wolfram et al. (1994) reported that complex behavior, such as fractals or chaos, emerges from simple local micro- rules , various reports have been made on the relations between micro- rules and macro-behavior, especially in the area of social science.

2.13
An example of applying the Agent- Based Approach to economics and finance is the analysis based on artificial markets that are mainly proposed by artificial intelligence researchers. This approach explicitly deals with the price emergence mechanism and this point differentiates it from the conventional finance engineering approaches.

2.14
Epstein and Axtell (1996) applied the Agent-Based Approach to economics. They built an artificial society where ants move around in a field and trade sugar and spice with the other ants around them. Based on analyses of the artificial society, they reported that laissez-faire economic policy, which considers "the equilibrium price is automatically brought as long as we leave it up to the market mechanism", has been put into a difficult theoretical position. Their analyses reach suggestive and interesting conclusions, even though some of the conditions they assumed are different from the ones in real markets (for example, multiple prices for sugar and/or spice exist at the same time).

2.15
Arthur et al. (1997) created a price determination mechanism that is closer to the real one . They analyzed price fluctuations by setting heterogeneous investors who change behavior adaptively in the artificial market, and they found that bubbles and crashes of asset prices emerge in the market[12]. They also found the robust phenomenon that the traded price deviates from the fundamental value. However, in most of the conventional analyses based on artificial markets, the agents' behavior is described in accordance with the KISS principle (Axelrod 1997) so that it is different from the behavior of real investors.

2.16
One of the novelties of this paper is that our models of the bounded rational agents are grounded in real theories, such as the ones of trend chasers, over confident investors, and Prospect theory[13]. Another novelty is that we analyze, based on our investor models, how the behavior of each investor type and the investment environments are associated with the price fluctuations.

2.17
The next section describes the financial market model we built on a computer.

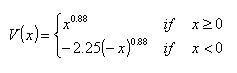
* Design of the Virtual Financial Market

3.1
We built a virtual financial market on a personal computer with Pentium III 1GHz, RAM 512M. The market consists of a thousand investors and allows them to trade two types of assets: a stock and a risk-free asset. In this market, multiple types of investors exist and conduct transactions based on the investment rules defined for each type. The market operates in three steps: accrual of corporate profit taking, the formation of investors' predictions, and determination of the traded price. In the following sections, we explain in detail how the financial market operates. See the appendices at the end of this paper for the details of the rules of the natural selection principle and for the major parameters of the models used in this paper. Also refer to Appendix D for the sample pseudo-code showing how the model works[14].

Assets Traded in the Market

3.2
This virtual market contains a risk- free asset and a risk asset, and the risk asset is a security that pays the entire profit to the shareholders as a dividend for each period (Arthur 1997, Shleifer 2000). The corporate profit accrues according to the process of yt=yt-1 + εt , where ε ∼ N(0, σ2y) (O'Brien 1988, Palepu 1996), and the stock is traded after the corporate profit of current period is announced. The investors in the market can borrow or lend the risk-free asset unlimitedly in principle[15], and the initial asset amount of every investor is 1,000 in stock and 1,000 in risk-free asset.

Modeling of Investors' Behavior

Common Framework for Investors' Behavior

3.3
The investors in this market determine the deviation width from the benchmark based on the expected rate of return on the stock (Black/Litterman 1992)[16]. The investors in this model adopt the same benchmark[17] and use the historical volatility (σht) as the estimated value of volatility (σst) in principle (σst = σht) . The following sections explain the methods of calculating the expected rate of return on the stock.

3.4
At every simulation step, the investors determine its asset allocation based on its prediction described below. Because we use the Bayes correction model, or Black and Litterman's model (Black/Litterman 1992), the stock ratio of the investors shows almost same of the total stock ratio in the market. The investor is allowed to short sell. The excess returns of the investors are relatively measured based on the buy-and-hold strategy, that is, the strategy the investor will never make trades on the market. The performance of the investors are evaluated by the excess returns.

Calculation Methods for Predicted Stock Price

Fundamentalists

3.5
In this paper, we refer to the investors who make investment decisions based on fundamental values as "fundamentalists". We adopt the dividend discount model, which is the most basic derivation model for the fundamental value of stocks. The fundamentalists are supposed to know that the corporate profit accrues according to Brownian motion. They calculate the predicted stock price (Pft+1) and the predicted corporate profit (yft+1) from the profit of current period (yt) and the discount rate of the stock (δ) as Pft+1 = yt / δ respectively.

Trend Predictors

3.6
The conventional asset pricing theories insist that the fundamentals are reflected in the prices so that the prices in the past do not affect the current price. However, the real markets and societies are flooded with information about the prices, and the price itself may have the meaning in real markets as Shiller pointed (Shiller 2000). Furthermore, the analyses of the experiments on human being indicate that the people tend to find out the trends from a random sequence (Kahneman/Tversky 1982, Bazerman 1998), which means there are good chances that investors find out some trends from the random fluctuation of stock prices.

3.7
Against this background, we formulate a model of the investor who finds out the trends from randomly fluctuate stock prices. This type of investor predicts the stock price of the next period by extrapolating the most resent trends. As the actual investors use various investment period from one day to medium or long period, we deal with three types of trend measurement period: short (one day), medium (10 days), and long (20 days). The trend predictors calculate the predicted stock price and the predicted corporate profit from the trend at t-1 (at-1) as Pft+1 = Pt-1 · (1 + at-1)2 and yft+1 = yi · (1 + at-1), where at-1 = (Pt-1/Pt-2 - 1) [short trend], at-1 = (1/10)Σ10i=1 (Pt-1/Pt-i-1 - 1) [medium trend], at-1 = (1/20)Σ20i=1 (Pt-1/Pt-i-1 - 1) [long trend], respectively. Predicted price (Pft+1) and profit (yft+1) are different when the trend measurement period is different.

Investors based on Prospect Theory

3.8
Kahneman et al. pointed in the Prospect Theory that people make decisions based on the maximization of the value function, not the expected utility (Kahneman 1979, Kahneman 1992). The form of the value function (V(x)) is different depending on whether the change from the reference point (x) is in the range of profit or in the range of loss, and the gradient of the value function in the range of loss is twice as steep as the one in the range of profit (Kahneman 1992). This indicates that people tend to estimate losses twice as large as profits.

3.9
We formulate the model of the investors based on Prospect Theory in accordance with the one characteristic of decision- making, which is that people tend to cognize losses twice as large as profits. When the most recent price (Pt-1) is lower than the price at the reference point (Preft), this type of investor calculates the ultimate predicted price (Pft+1) by converting the original predicted price (Pbef,ft+1) using the formula (Pft+1 = 2.25 · Pbef,ft+1 - 1.25·Preft)[18]. As for the price at the reference point (Preft), we analyze the market using three types of stock prices: short (two days ago), medium (ten days ago), and long (twenty days ago). And as for the original predicted price (Pbef,ft+1), we use two types of prices that are predicted based on the fundamental values and based on the trends.

Overconfident Investors

3.10
Bazerman reported that human being tends to be overconfident in his/her own ability (Bazerman 1998). In the area of Behavioral Finance, Kyle analyzed the influence of the overconfident investment behavior on the markets with the analytical method (Kyle 1997). Also in real markets, we often find that each investor talks about different future prospects with confidence. It seems like all investors tend to have overconfidence in varying degrees.

3.11
Against this background, we formulate the model of investors who are overconfident in their own predictions by assuming that they underestimate the risk of the stock. The risk of the stock estimated by an overconfident investor (σs) is calculated from the historical volatility (σh) and the adjustment factor to determine the degree of overconfidence (k : 0 < k ≤ 1) as (σ)2 = k · (σh)2 .

Calculation Method for Expected Rate of Return on Stock

3.12
The investors in this virtual market predict the stock price and the corporate profit at the term t+1 (Pft+1 and yft+1) based on the corporate profit at the term t (yt) and the stock prices at and before the term t-1 (Pt-1, Pt-2,Pt-3, … ). In this paper, we represent the predicted values of the stock price and the corporate profit by the investor i (i = 1, 2, 3, … ) as (Pf,it+1) and (yf,it+1 respectively. The expected rate of return on the stock for the investor i (rint,it+1) is calculated as:
Refer to Black (1992) for the detail of the bayes correction model[19].

Determination of Traded price

3.13
The traded price of the stock is determined at the price the demand meets the supply (Arthur 1997). Both of the investment ratio (wit) and the number of the stock held by investors 
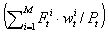
are the decreasing function of the stock price, and the total number of the stock issued in the market (N) is constant. We derive the traded price as 
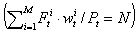
by calculating the price (Pi) where the total amount of the stock retained by investors , which is the demand, meets the total market value of the stock, which is the supply[20].

* Analyses of Price Fluctuation

4.1
The traditional financial theories analyze the asset prices by considering the behavior of representative investors only. We analyze the influences of investors' behavior on the asset prices through the experiments in a virtual market that contains various types of investors. As explained in the previous section, we explicitly describe only the movement of fundamentals (the corporate profit) and the rules of investors' behavior in this virtual financial market, and the asset prices are determined bottom-up as a result of trading. The prices in real markets are also determined as a result of the autonomous behavior of each investor. In this context, our virtual market has the price determination mechanism that is closer to the real one than the other models in financial engineering.

4.2
In this section, we verify the points we mention in section 1 such as "whether rational pricing is achieved if a handful rational investors exist in the market?" or "whether irrational investors are eliminated according to the principle of natural selection?" using the simplified model described in the previous section[21]. We firstly analyze the case that every investor makes prediction based on the fundamental values, and then we analyze the influences in the case that the trend predictors are contained in the market. We also analyze the price fluctuation when there is a certain investment restriction in order to consider the real situation where the investment ratio of risk assets is limited. At last, we analyze how the asset prices are influenced by the investors' behavior reported in Behavior Finance, such as the investors who are overconfident or are based on Prospect Theory.

When Every Investor is Fundamentalist

4.3
First of all, we analyze the price fluctuation when every investor in the market is fundamentalist. This case assumes the rational investors and the perfect market so that we expect the results conform to the traditional financial theories.

4.4
Figure 1 shows the history of the stock price (the fundamental value and the traded price) obtained as a result of experiments in the financial market. This chart indicates that the fluctuation of the traded price agrees with the one of the fundamental value[22]. Under this condition, we have ascertained that the experimental result conforms to the traditional financial theories.

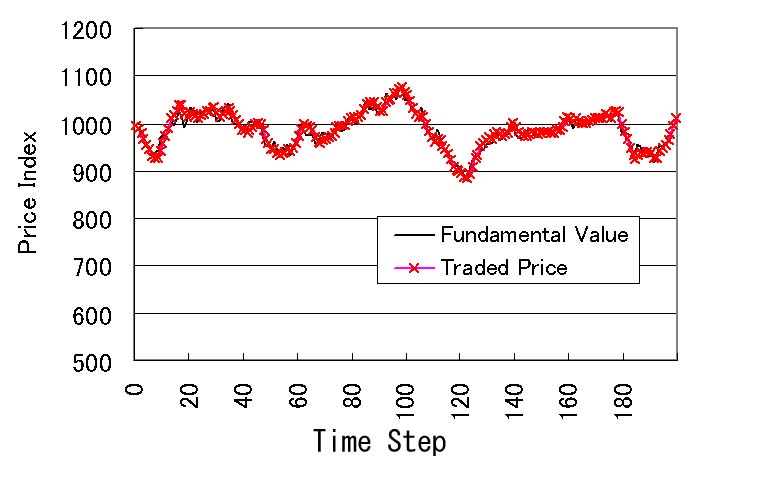
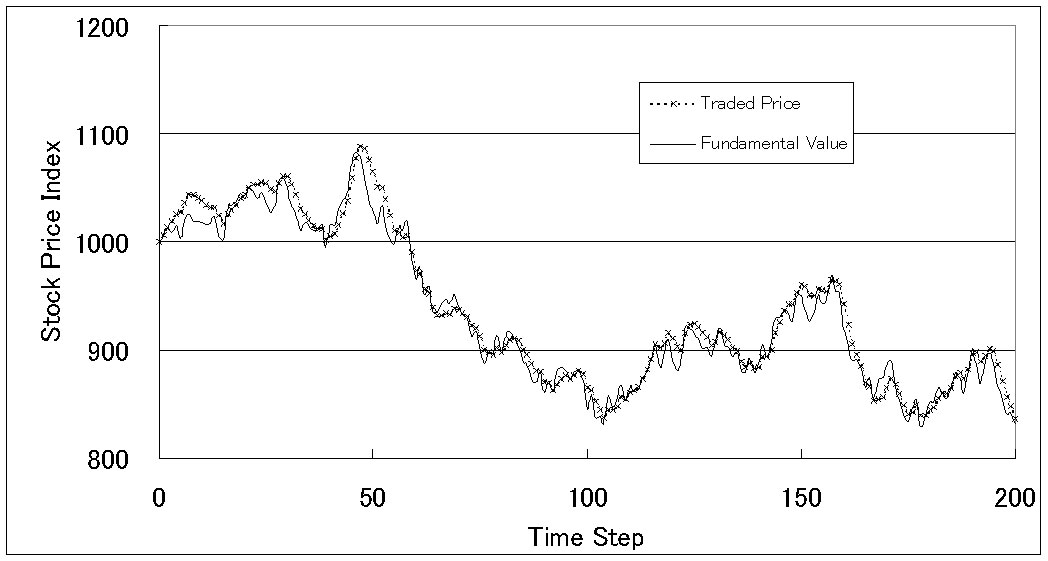
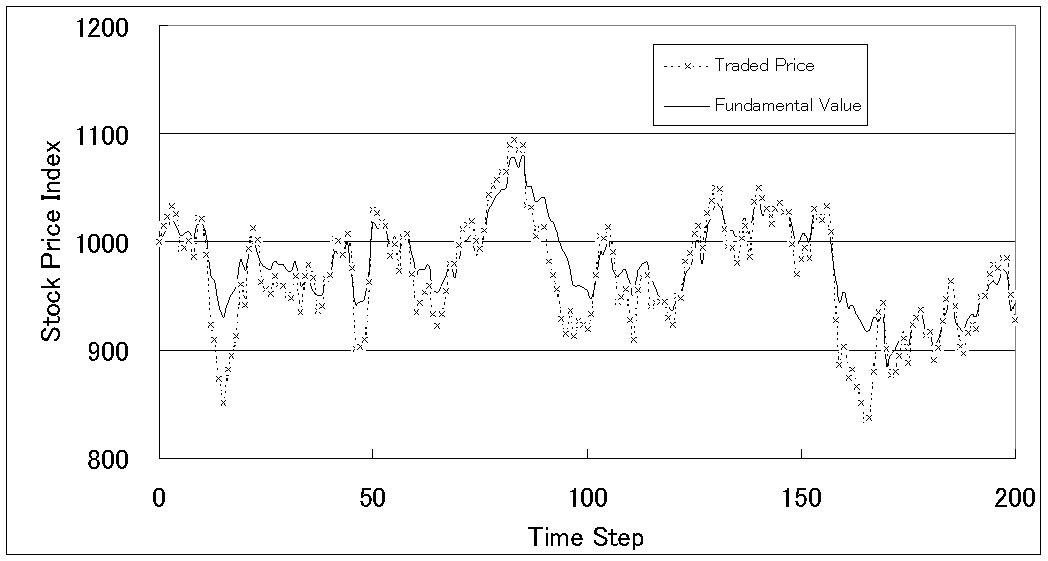
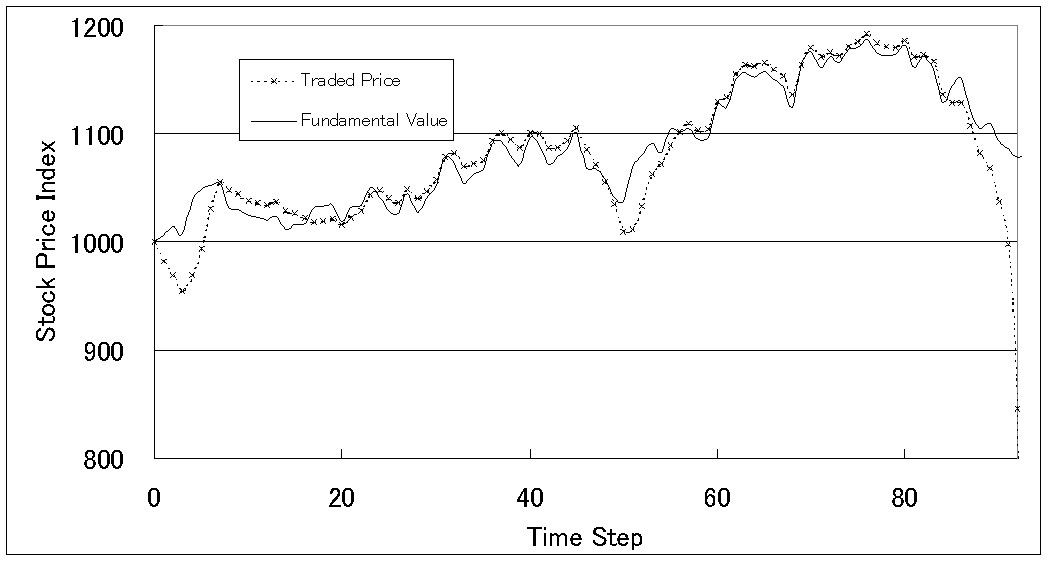
Figure 1. Price history (when 100% of investors predict based on the fundamental value)

When Trend Predictors Exist in the Market

4.5
We analyze the cases that the market contains both investors who make predictions based on the fundamental value and who make trend predictions. In accordance with the traditional financial theories, irrational investors shall be eliminated from the market according to the principle of natural selection, which means that the trend predictors highly likely to be eliminated. This section attempts to verify the conventional theories through the experiments on the cases that the natural selection principle works in the market.

When Fundamentalists : Trend Predictors = 500 : 500

4.6
We analyze the price fluctuations when the same numbers of fundamentalists and trend predictors (10 days) exist in the market. Figure 2 shows the history of the fundamental value and traded price, and Figure 3 shows the history of the cumulative excess return of each investor[23]. The excess returns of the investors are relatively measured based on the buy-and-hold strategy. Under this condition, the traded price almost agrees with the fundamental value and the fundamentalists obtain the cumulative excess returns[24]. We obtain the same result even when we increase the ratio of the trend predictors up to 70%. These are the conformable results to the traditional financial theories. We expect that the fundamentalists who obtain excess retunes shall survive if we introduce the natural selection principle into the market.

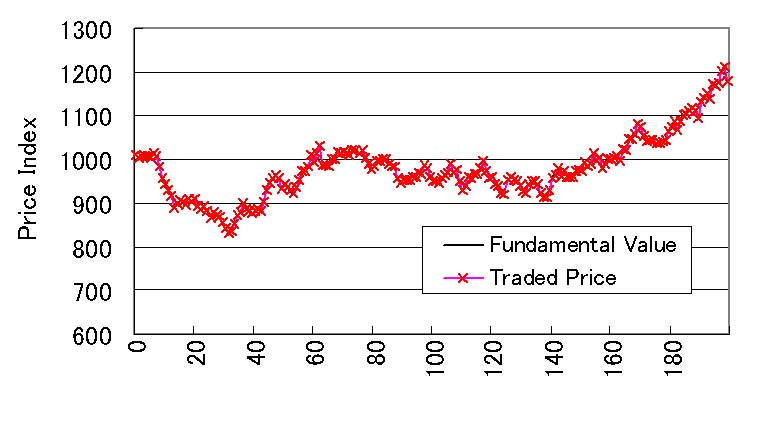
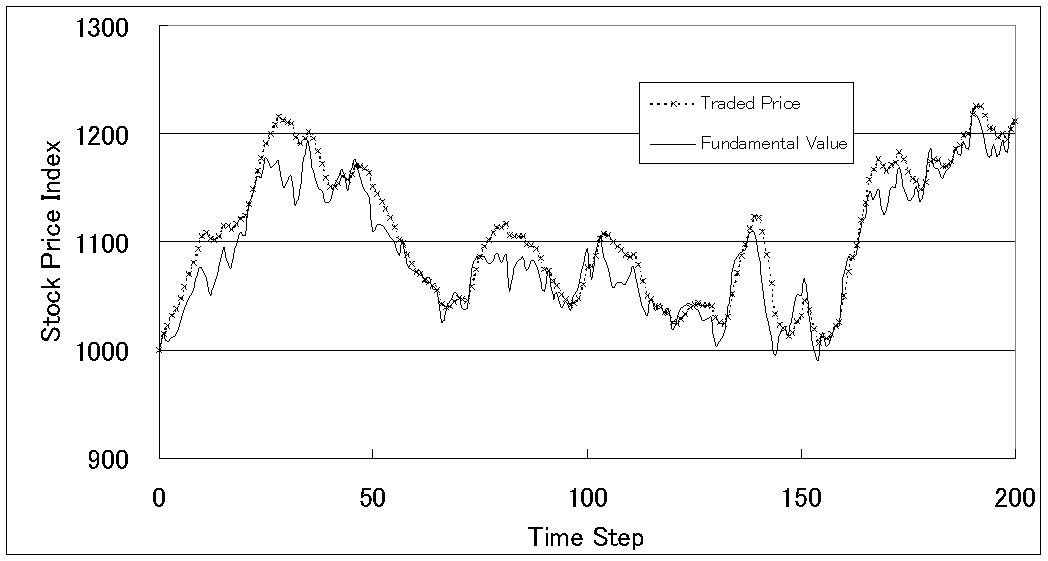
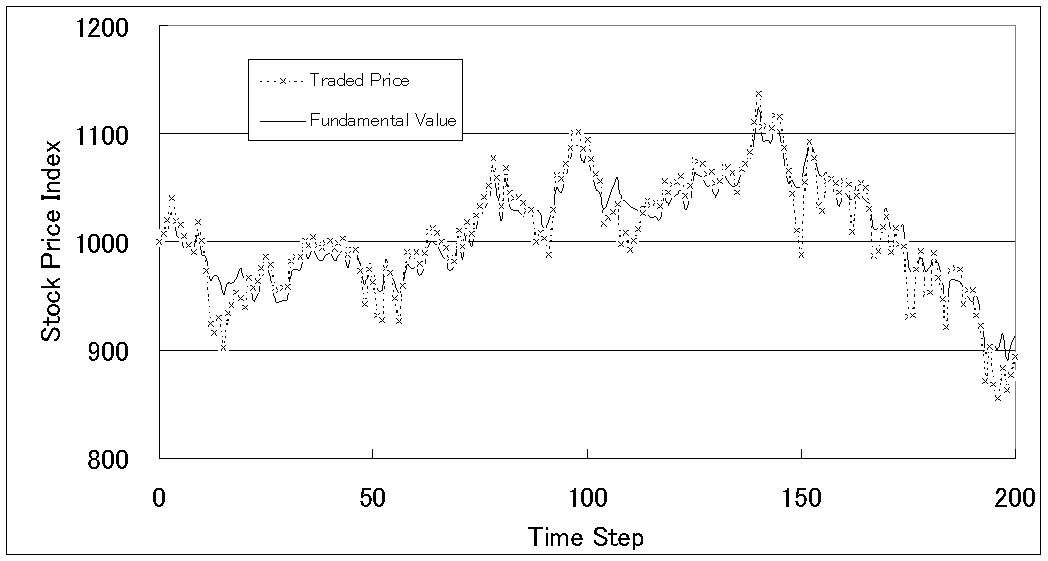
Figure 2. Price history (fundamentalists : trend predictors = 500 : 500)

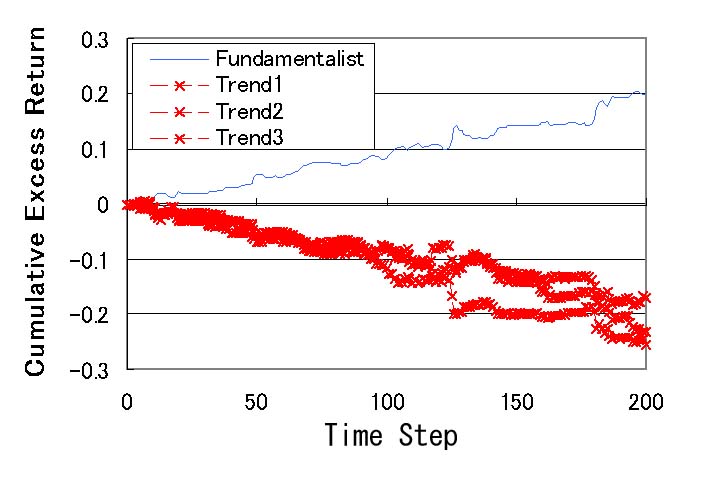
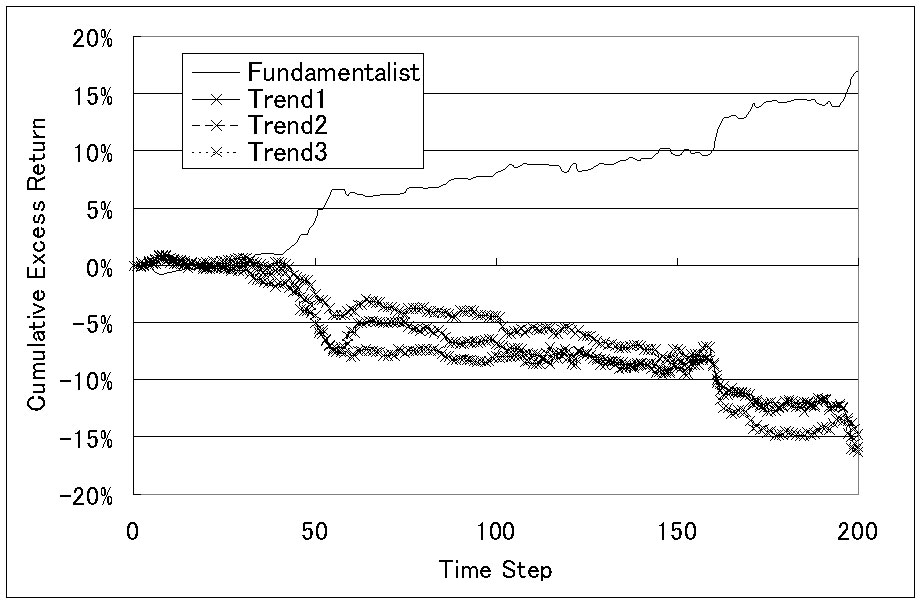
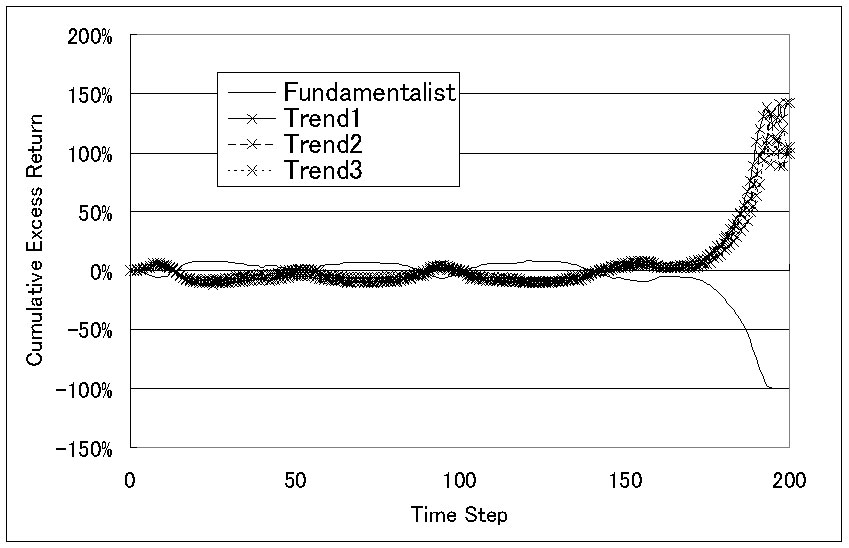
Figure 3. Cumulative excess returns (fundamentalists : trend predictors = 500 : 500)

4.7
Figure 4 and Figure 5 show the histories of the prices and the number of investors in the case that the natural selection principle works in the market. The same number of the fundamentalists (Rational) and the trend predictors (Non-Rational) exist in the market at the initial state, the trend predictors are eliminated and the number of fundamentalists increases as time passes. We repeat the same experiment a hundred times and Figure 6 and Figure 7 show the distributions of the number of fundamentalists after 200 terms and 500 terms. Under this condition, the trend predictors are eliminated from the market and most of the investors become fundamentalists after 500 terms. This result conforms to the reports based on the traditional financial theories and exemplifies the validity of these reports using Agent- Based Approach[25].

Figure 4. Price history when natural selection works (fundamentalists : trend predictors = 500 : 500)

Figure 5. History of the number of investors when natural selection works (fundamentalists : trend predictors = 500 : 500)

Figure 6. Distribution of the number of fundamentalists (t=200)

Figure 7. Distribution of the number of fundamentalists (t=500)

When Fundamentalists : Trend Predictors = 100 : 900

4.8
Then we change the proportion of the investors and analyze the price fluctuation when the trend predictors occupy 90% of the market. The experiment shows different behavior from the reports on the conventional financial theories. Figure 8 and Figure 9 show histories of the prices and the cumulative excess return of each investor type. Under this condition, the traded price vastly deviates from the fundamental value and the trend predictors obtain the excess returns[26]. Even though each investor can unlimitedly borrow or lend the risk-free asset, the traded price deviates from the fundamental value because the adjustment power of the fundamentalists is too small when the proportion of them in the market is extremely low[27]. Moreover, the trend predictors obtain the excess returns in this case as shown in Figure 9. Under this condition that the proportion of trend predictors is extremely high in the market, the fundamentalists are highly likely eliminated according to the principle of natural selection, which goes counter to the conventional financial theories.

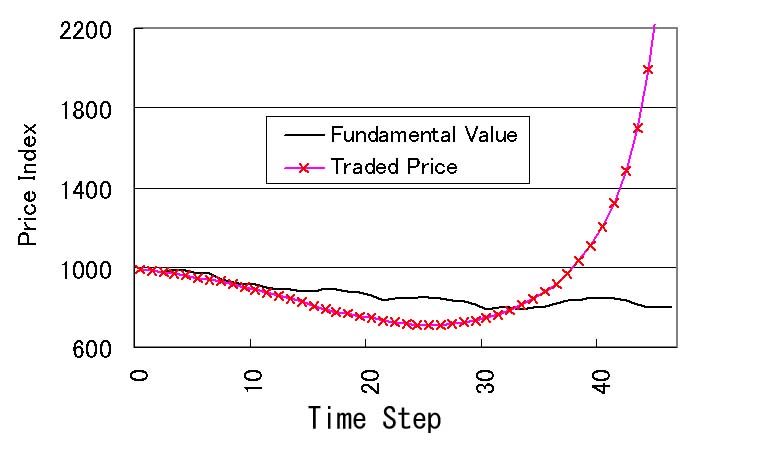
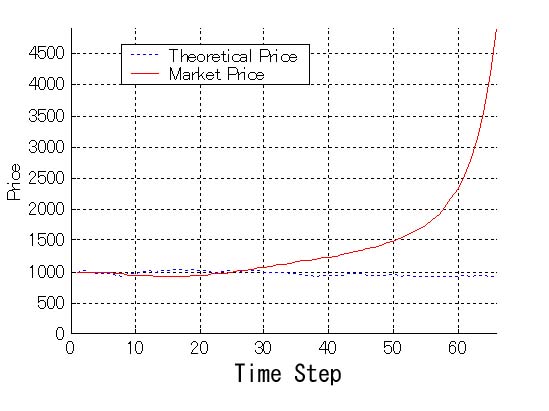
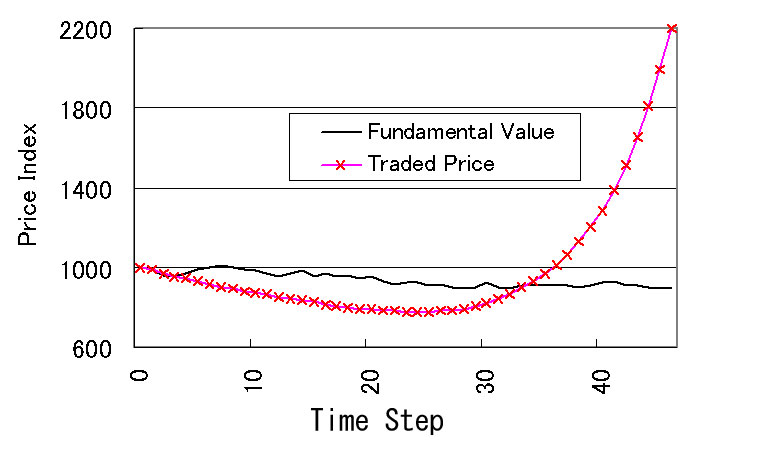
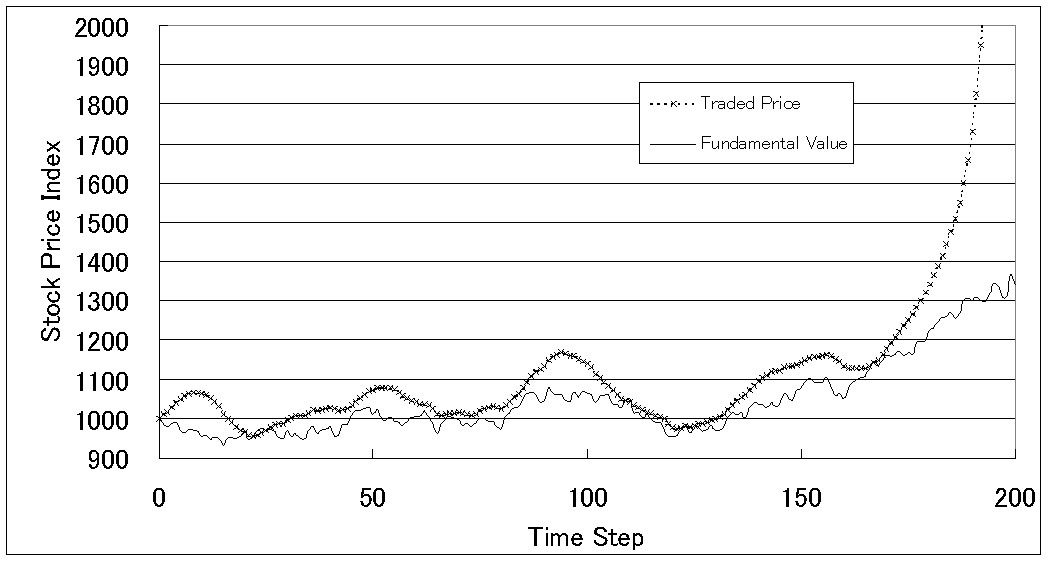
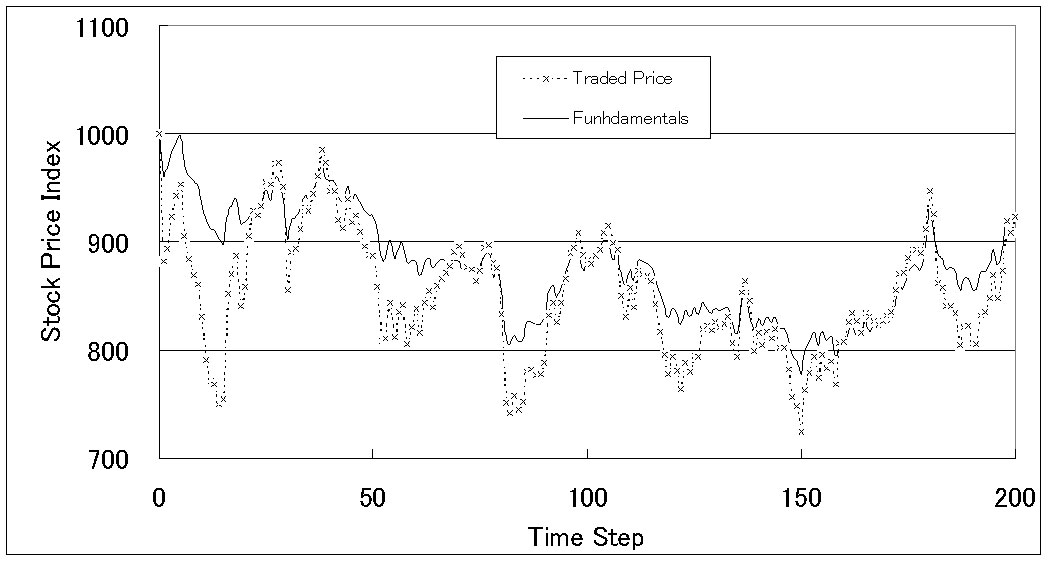
Figure 8. Price history (fundamentalists : trend predictors = 100 : 900)

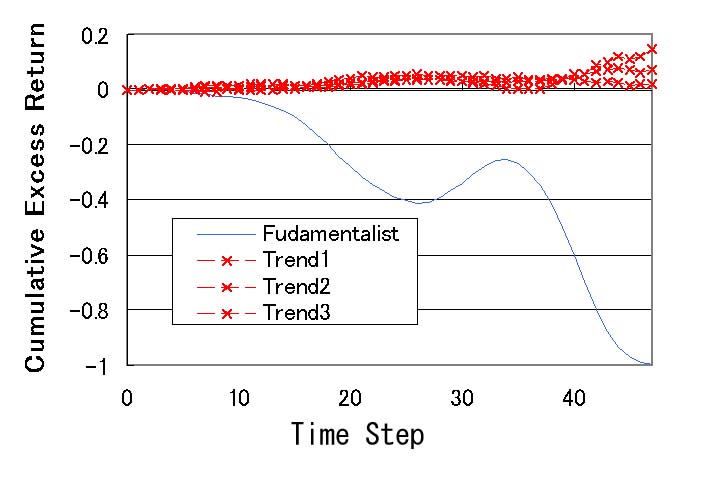
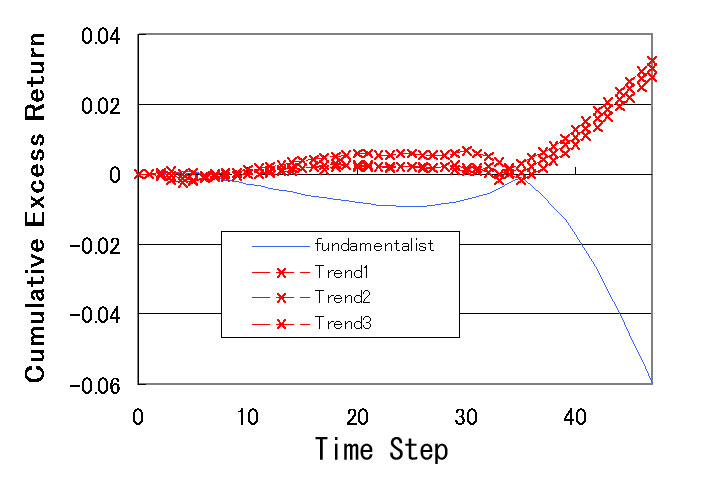
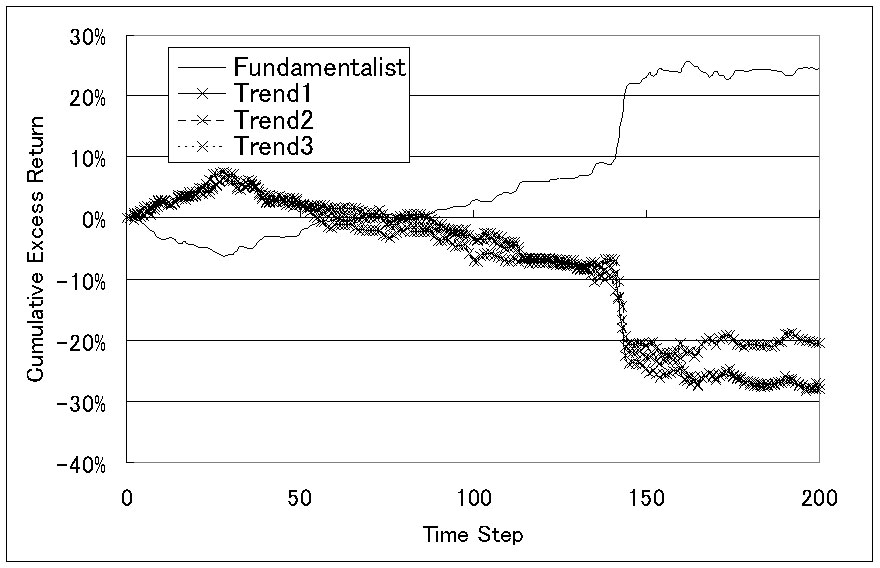
Figure 9. Cumulative excess returns (fundamentalists : trend predictors = 100 : 900)

4.9
We again conduct the experiments in the case that the natural selection principle works in the market. Figure 10 and Figure 11 show the histories of the traded price and the number of investors. In this case, the traded price deviates vastly from the fundamental value and the fundamentalists are eliminated from the market. We repeat the same experiment a hundred times and Figure 12 and Figure 13 show the distributions of the number of fundamentalists after 50 and 100 terms. From these charts, we confirm that the fundamentalists are often eliminated from the market according to the principle of natural selection[28]. Although this result does not conform to the traditional financial theories, it is very interesting on the point that the behavior of irrational investors may have large impact on financial markets.

Figure 10. Price history when natural selection works (fundamentalists : trend predictors = 100 : 900)

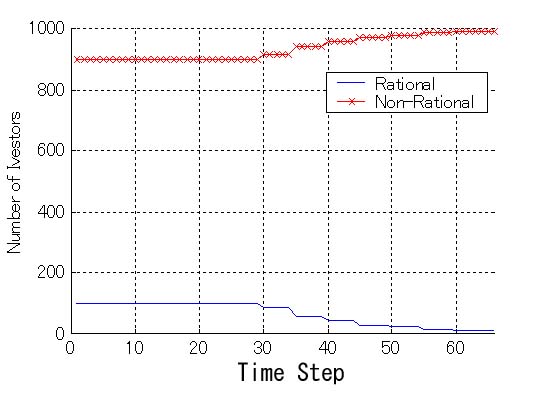
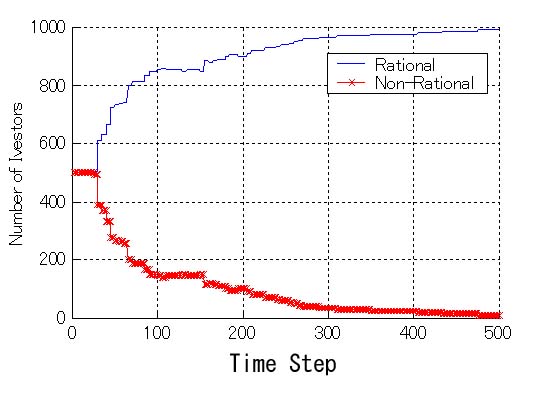
Figure 11. History of the number of investors when natural selection works (fundamentalists : trend predictors = 100 : 900)

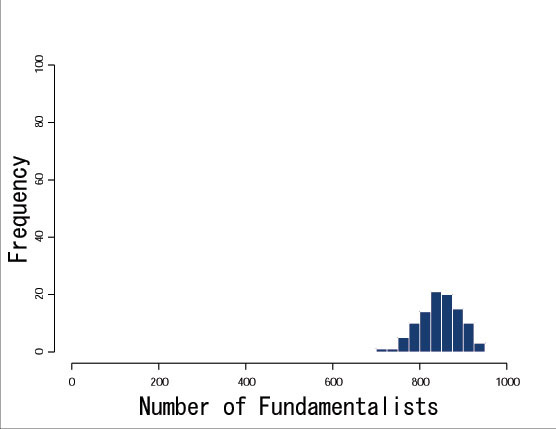
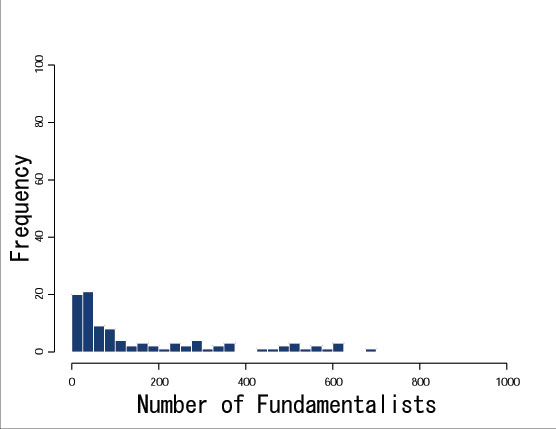
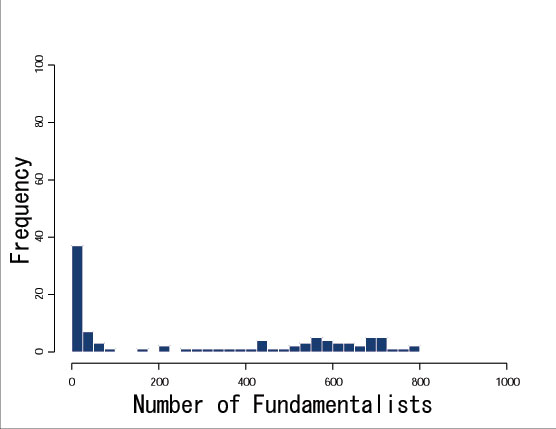
Figure 12. Distribution of the number of fundamentalists (t=50)

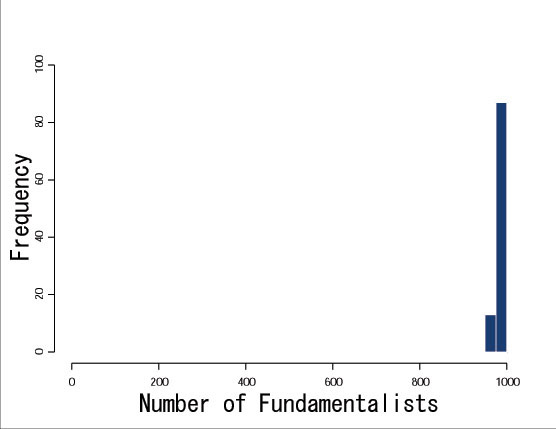
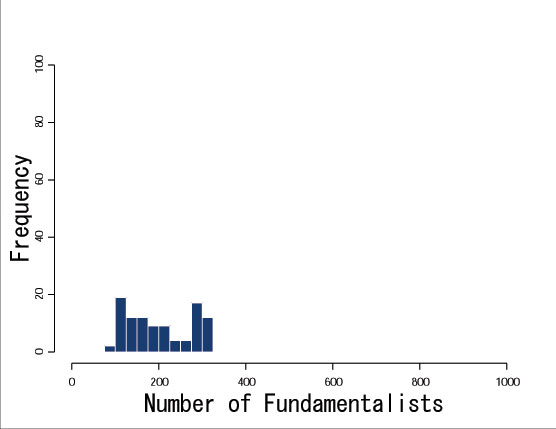
Figure 13. Distribution of the number of fundamentalists (t=100)

When Risk Asset Investment Ratio Is Restricted

When Every Investor is subject to the Restriction

4.10
In the experiments in the previous sections, the investors can unlimitedly raise the ratio about risk asset, or stocks. In real markets, however, investors make investments by setting a certain constraint limit on the holding ratio of stocks. Thus, in this section, we carry out experiments in the case that the investment ratio of the stocks is restricted. The ratio of the number of fundamentalists and trend predictors (10 days) is equal to 300 : 700[29], and each investor is subject to the restriction that "the investment ratio of the stock must be ±5% of the ratio in the previous term"[30].

4.11
Even in the experiments with the investment restriction, we again identify the behavior that does not conform to the traditional financial theories. Figure 14 and Figure 15 show the histories of prices and the cumulative excess return of each investor type. In this case, the trend predictors who have pricing power obtain the excess returns as shown in Figure 15. When the investment restriction exists, the influence of fundamentalist on pricing is limited so that the traded price largely deviates from the fundamental value. Since the trend predictors obtain excess returns in this case as well, it is highly possible that the fundamentalists are eliminated from the market according to the principle of natural selection.

4.12
Similarly to the previous section, we carry out the experiments in the case that the natural selection principle works in the market. Figure 16 and Figure 17 show the distributions of the number of fundamentalists after 50 and 100 terms. Under this condition, we also find the cases that the fundamentalists are eliminated from the market, which goes counter to the conventional financial theories.

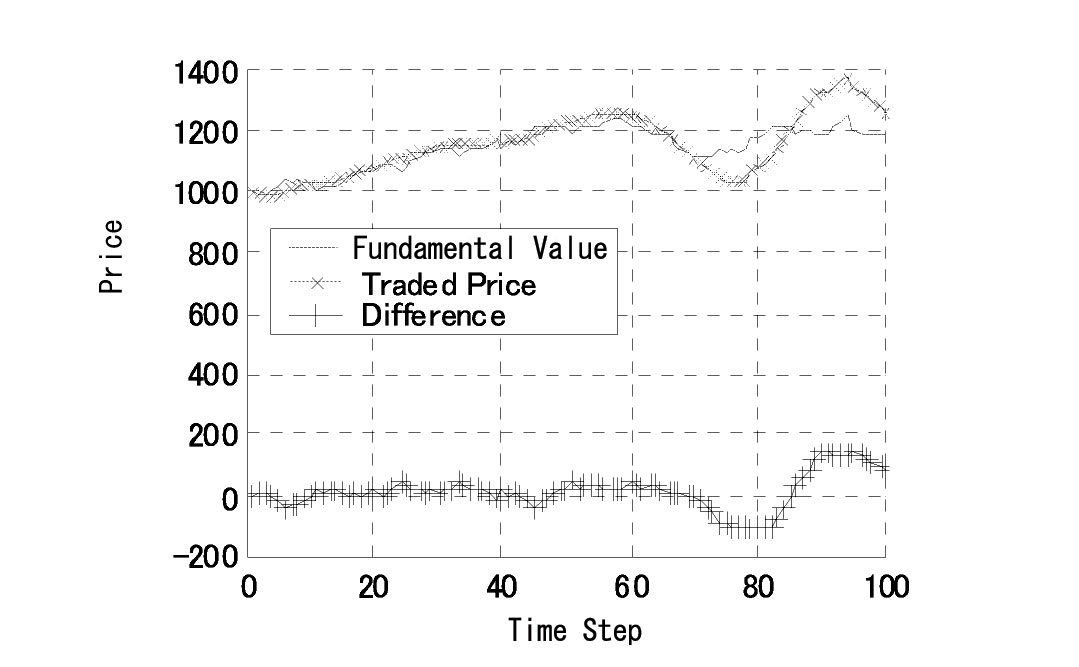
Figure 14. Price history (with the investment restriction)

Figure 15. Cumulative excess returns (with the investment restriction)

Figure 16. Distribution of the number of fundamentalists (with the investment restriction, t=50)

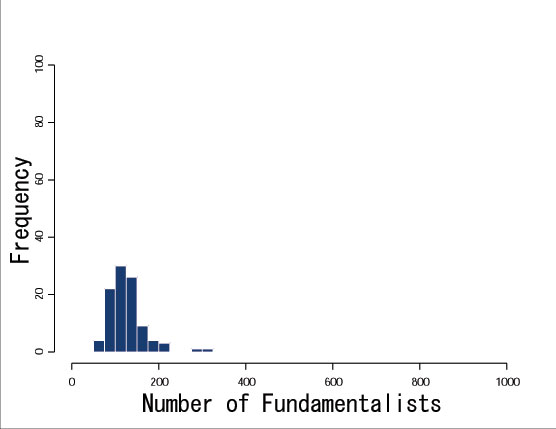
Figure 17. Distribution of the number of fundamentalists (with the investment restriction, t=100)

4.13
Many of investors in real markets place restraints on the holding ratio of risk assets. The result of this experiment suggests that such investment restriction may be one of the factors in a certain situation to deviate asset prices from the fundamental values.

4.14
In recent years, people are recognizing the importance of risk management, and financial institutions make investments based on the risk management using all kinds of risk indices such as market and credit risks. The rigorous risk management must be effective to limit the risk for each institute. However, the risk management has a practical effect to impose restrictions on investments and this may have a side effect to weaken the power to pull the traded price back to the fundamental value. Especially when the fundamental value is in downward trend, the risk management tends to be more rigorous so that the positive feedback between the price decline and the strengthening of risk management may enlarge the deviation from the fundamental value.

When Small Part of Investors Have No Investment Restriction

4.15
We find the totally different market behavior when we let only ten fundamentalists (1% of the total) in the market to make investment without the restriction (other conditions are the same as the ones in the previous section). Under this condition, the deviation between the traded price and the fundamental value as shown in the previous section dramatically narrows, and the fundamentalists without the restriction obtain large excess returns (see Figure 18 and Figure 19). This result indicates that the investors who make large amount of investments have immense influence on the market when many of other investors make investments under the explicit (or implicit) restrictions. It is possible in real markets that the deviation from the fundamental value narrows considerably if the market contains a small number of fundamentalists who only have little investment restrictions.

Figure 18. Price history (when some investors have no restriction)

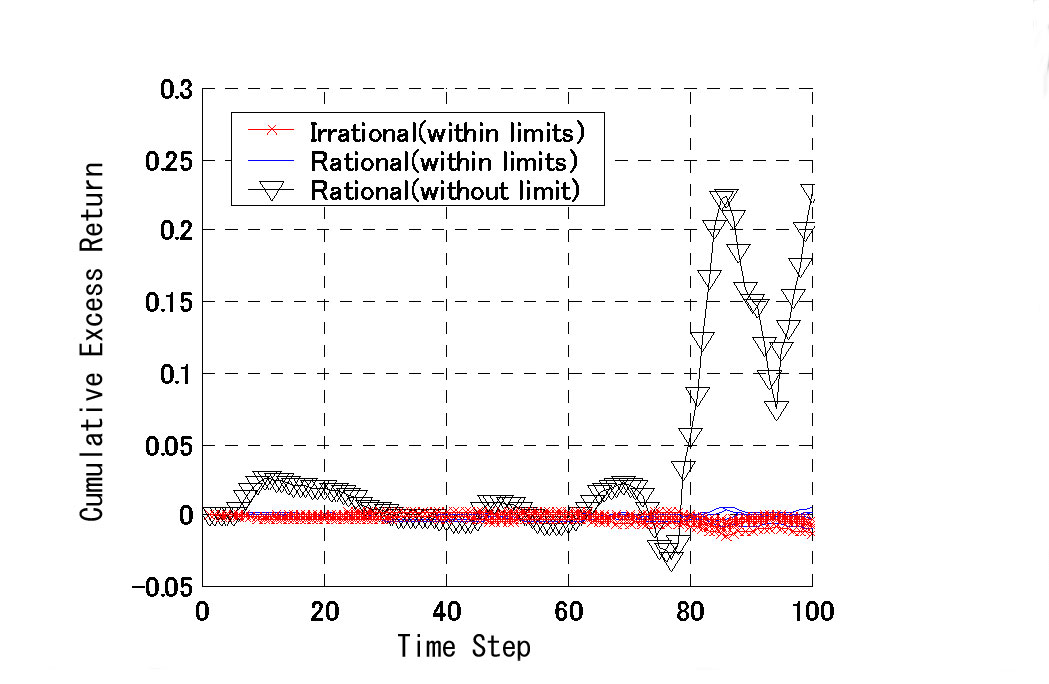
Figure 19. Cumulative excess returns (when some investors have no restriction)

When Market Contains Investors Who Are Overconfident or Who Are Based on Prospect Theory

4.16
We conduct the experiments in the cases that the market contains the investors who are overconfident or who are based on Prospect Theory and we find that they sometimes obtain excess returns. The overconfident investors make trend predictions. Such investors show over confident behaviors against their own stock price prediction. Thus, they will be over confident about both increasing and decreasing returns. Because trend followers forecast stock price by extrapolating latest stock price, the effect of trend followers with over confident aren't cancelled out.

4.17
As for the investors based on Prospect Theory, we deal with two types: fundamental predictors (investors who make prediction based on fundamental value) and the trend predictors.

4.18
We will analyze the effects of prediction bias of the investors in the market, when the effect of trend followers with overconfident aren't cancelled out and when the number of the investors with Prospect theory is large.

When overconfident investors exist in the market

4.19
Figures 20, 21, 22, 23, 24 and 25 show the histories of the prices and the cumulative excess returns when the ratio of the number of fundamentalists and overconfident investors (who make trend prediction [10 days]) is equal to 500 : 500. The smaller the value of k becomes, the higher the degree of overconfidence grows. When the market contains the overconfident investors, the traded price vastly deviates from the fundamental value and the overconfident investors sometime obtain excess returns[31]. The overconfident investors tend to make excessive behavior in comparison with the fundamentalists so that they have larger influence on the prices. This must be the main factor of the price deviation.

Figure 20. Price history (when overconfident investors [k=0.9] exist)

Figure 21. Cumulative excess returns (when overconfident investors [k=0.9] exist)

Figure 22. Price history (when overconfident investors [k=0.8] exist)

Figure 23. Cumulative excess returns (when overconfident investors [k=0.8] exist)

Figure 24. Price history (when overconfident investors [k=0.6] exist)

Figure 25. Cumulative excess returns (when overconfident investors [k=0.6] exist)

When investors with prospect theory exist in the market.

4.20
Then we carry out the experiments on the market that contains Type I: fundamentalists, Type II: fundamentalists with Prospect Theory and Type III: trend predictors with Prospect Theory. At first experiment, Market contains Type I and Type II investors. Figure 26 shows the price history when the ratio of the number of fundamentalists and fundamentalists with Prospect Theory (10 days) is equal to 300 : 700[32]. Under this condition, the trade price sometime deviates slightly downward from the fundamental value. When the reference point is the maximum stock price during the measurement span, the degree of deviation grows widely (Figure 27). And in this case when the measurement span becomes longer, the degree of deviation grows more widely (Figure 28).

Figure 26. Price history (when fundamental predictors based on Prospect Theory [10 days] exist)

Figure 27. Price history (when fundamental predictors based on Prospect Theory [max 10 days] exist)

Figure 28. Price history (when fundamental predictors based on Prospect Theory [max 20days] exist)

4.21
At second experiment, Market contains Type I and Type III investors. Figure 29 shows the price history when the ratio of the number of fundamentalists and trend predictor (10days) with Prospect Theory (10days) is equal to 800 : 200. Under this condition, the trade price deviates downward from the fundamental value too. In this case, the trend predictors based on Prospect Theory have both of two biases: (1) loss aversion and (2) trend prediction. The result of this case shown in Figure 29 suggests that the mixture of multiple characteristics of investment behavior may have larger impact on the market than the one supposed from a single characteristic. When investors in real markets predict the stock price from the past trend and tend to estimate the losses excessively, the traded price may largely deviate from the fundamental value as indicated by the experiments in this paper.

Figure 29. Price history (when trend predictors based on Prospect Theory exist)

* Conclusion

5.1
In this paper, we have analyzed, using Agent-Based Approach, how asset prices are affected by investors and investment systems that are based on Behavioral Finance. We have built a virtual financial market that contains two types of investors: fundamentalists and non-fundamentalists, and have conducted intensive experiments in the market. As a result of the analyses, we have found that (1) the traded price agrees with the fundamental value and the fundamentalists survive according to the principle of natural selection in the case that the market contains the same number of fundamentalists and trend predictors (investors who make trend prediction), (2) the traded price largely deviates from the fundamental value and the non- fundamentalists frequently obtain excess returns and therefore the fundamentalists are eliminated according to the principle of natural selection in the case that the proportion of trend predictors is extremely high or in the case that the investment ratio of the risk asset is restricted, and (3)the traded price largely deviates from the fundamental value in the case that the non-fundamentalists estimate the losses excessively, as pointed in Prospect Theory. These results indicate the possibility that the non-fundamentalists who have pricing power in real markets deviate the traded prices from the fundamental value and obtain excess returns. The major contribution of this paper is to indicate, using Agent- Based Approach, that the traditional financial theories may not be effective when their assumptions are extended to the ones closer to the reality.

5.2
The models in this paper are simple in the sense that we have implemented very small parts of decision-making strategies and investment environments in the real world. Our future work is to take into consideration the many other deviations from rationality in decision-making and the differences in the amount of funds investors initially have.


* Notes

1Analytical methods such as econometrics and time-series analyses focus attention on the relations between macroscopic indices. On the other hand, Agent-Based Approach tries to explain macro-behavior by micro-rules and is very different from traditional analytical approaches.

2Even when CAPM was suggested, Simon already pointed that the rationality of human being is bounded (Simon 1955). However, an asset price in financial markets is considered to be priced based on the fundamental value for the reasons that "irrational investors behave random and their behaviors are canceled out" and "arbitrage transactions adjust the market price to the fundamental value". Friedman also insisted that even if the assumptions are unrealistic, the traditional finance is valid while it has enough explanation power (Friedman 1953). On the other hand, Behavioral Finance casts some doubt on the assumptions of traditional financial theories by pointing "there are good reasons to believe that the behavior of irrational investors is biased" and "the capability of arbitrage is limited".

3Hirshleifer (2001)describes how Agent-Based Approach is effective to analyze financial markets.

4Several articles including our paper analyze artificial markets in which investors change their strategies based on their own rules (Kirman and Teyssiere 2001, Lux and Marchesi 1999). Our work focuses the temporal change of the number of investors during the simulation (e.g. see fig. 5-7).

5It is also reported that rational investors adopt the optimal strategy in consideration of irrational investors' behavior. However, in the interests of simplicity, we make analyses based on the investors who do not consider other investors' behavior and always follow the pre-defined rules.

6For example, they try to derive the optimal portfolio strategy under the condition that the lending and borrowing interest rates are different.

7The investors in real markets collect the information from media and information terminals and update their belief based on it.

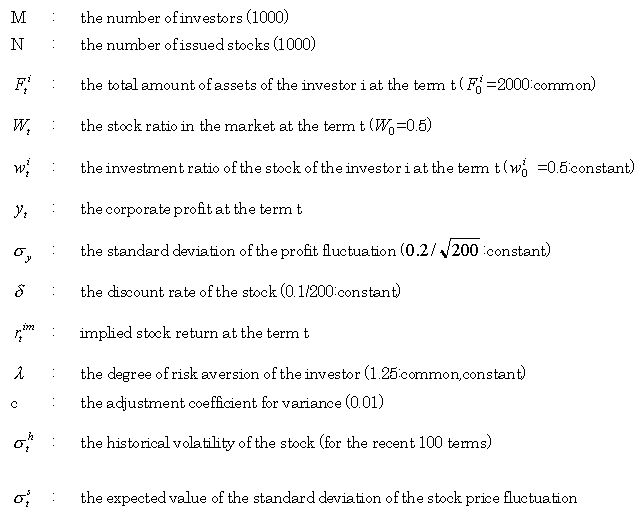
8Every investor adopts the same benchmark that is buy-and-hold of the portfolio consists of 1,000 CASH and 1,000 STOCK at the initial state (t=0).

9It is conventionally pointed that the typical means-variance models have a problem that "the slight difference in return makes large difference in assets allocation". The bayes correction model has resolved this problem and is closer to the investors' real behavior.

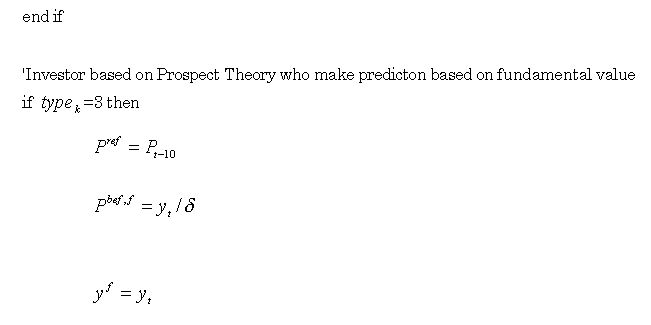
10When a loss arises as against the reference point, the investor estimates the loss larger than the actual and tends to behave more like a risk taker. This behavior vastly differs from the decision-making based on maximization of expected utility. On the other hand, when a profit arises as against the reference point, the form of the value function convexes upward, which is similar to the form of the conventional maximization of expected utility.

11The models for biases on decision-making are proposed in De Long (1990a), De Long (1990b), Barberis and Shleifer (1998), Kyle (1997), and Hong and Stein (1999). Although Behavioral Finance is sometimes considered ad hoc, it may be not in accordance with the reports that say that the emotion plays a key role in decision-making of human being (Damasio 1994, LeDoux 1996, Loewenstein 1996).

12Chiarella (1992) and Lux (1998) analyze the influences of heterogeneous investors with differential equations formulation, but the analyses lack the constraints assumptions about investors. On the other hand, agent-based approach deal with various kinds of analysis hard to analyze with differential equations. This is one of the advantages of our agent-based approach to financial market analysis.

13Behavioral finance tries to explain non-standard investors, such as trend followers, noise traders, overconfident investors, and loss avert investors from psychological view points. Several researchers have analyzed the effects of trend predictors and noise traders on asset prices with agent-based approach (Kirman and Teyssiere 2001, Lux and Marchesi 1999). In our paper, we deal with trend predictors, overconfident investors, and loss avert investors. One of the novelties of this research is to analyze the effects of overconfidence and loss aversion.

14See http://www.rr.iij4u.or.jp/~taishi/research

15We also analyze the case that the investment ratio of the risk asset is restricted (see section 4).

16For the simplicity, the investor models in this paper make investment decisions based on single period model. The analysis based on investors who consider multi- period is one of our future works. It is reported that rational investors adopt the strategy in consideration of irrational investors' behavior. However, for the simplicity, we assume that the behavior of each investor does not change according to the other investors' behavior. The analysis of the market that contains the investors who consider other investors' behavior is also one of our future works.

17Every investor adopts the same benchmark that is buy-and-hold of the portfolio consists of 1,000 cash and 1,000 stock at the initial state (t=0).

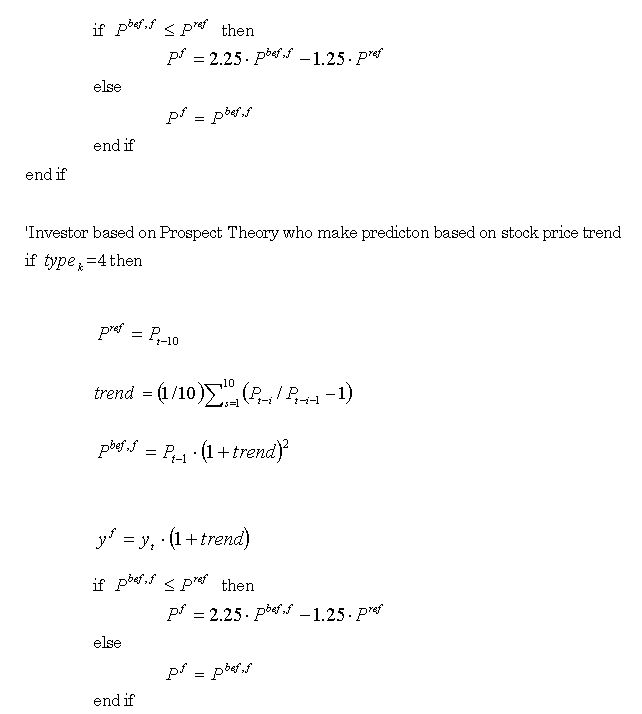
18When the most recent price is higher than the price at the reference point, the original predicted price remains as the ultimate predicted price.

19Appendix B at the end of this paper shows the outline of the bayes correction model.

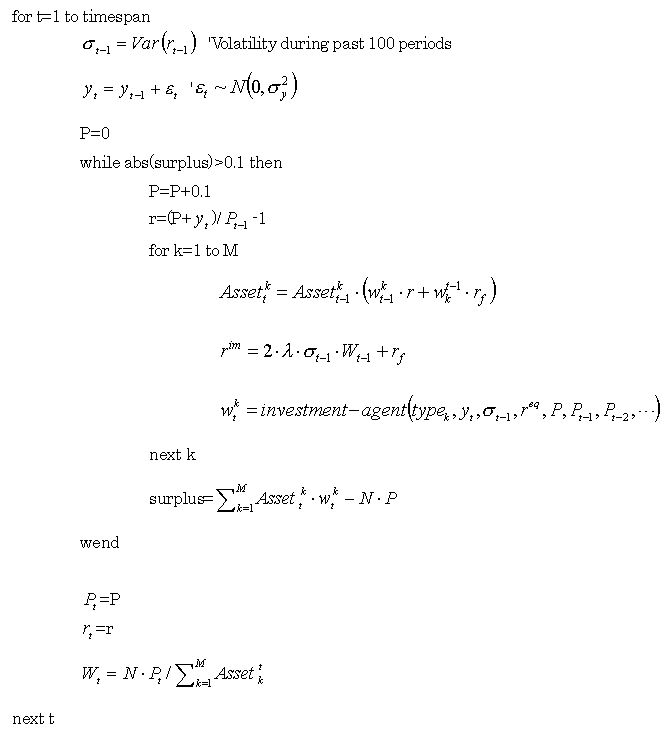
20Although there are other determination methods of traded prices, we adopt the simplest method in accordance with Arthur et al. (1997). We expand traditional financial theory such as CAPM by adopting an equation based price determination because, in this paper, we will explore the limitation of conventional financial theory by Agent-Based Simulation. Elaboration of the price determination method is one of our future works. At the price determination, we change the value of (Pt) in increments of 0.1 and search the price to satisfy the equality condition. Although we adopt the simplest price determination method, consideration of other methods is also one of our future works.

21Every experiment described in this paper is repeated more than fifty times in each condition so that the reproducibility of the results is confirmed. We also analyzed the volatility of this market including the comparison of simulation data with empirical data. The detail is discussed elsewhere Takahashi and Terano (2002).

22When every investor is fundamentalist, the valuation of the asset price completely agrees among all investors. Therefore, the stock price fluctuates according to the fluctuation of the corporate profit, but the number of stock held by each investor does not change and no transaction occurs.

23As for the trend prediction investor, we have illustrated typical three trend investors (Trend1, Trend2, Trend3).

24Even if the traded price deviates from the fundamental value, it is adjusted by the fundamentalists.

25We obtain the same result even when we increase the ratio of the trend predictors up to 70%.

26At the beginning, the price fluctuation does not show the extreme trend so that the influence of fundamentalists is relatively large and the traded price fluctuates around the fundamental value. After a certain terms, however, the price fluctuation shows the extreme trend in many cases so that the traded price largely deviates from the fundamental value. Note that we abort the experiment when the traded price becomes fivefold or fifth part of the fundamental value because the computation takes too long and the extreme deviation of the prices is unrealistic.

27In this paper, every investor initially has the same amount of assets. It is also one of our future works to analyze the cases that each investor initially has different amount of assets.

28This experiment shows two types of results: one is the case the fundamentalists are eliminated and another is the case they are not. The main factor that brings different results is how the situation of excess returns was when the natural selection principle worked for the first time. For example, the fundamentalists tend to be eliminated from the market if the trend predictors obtain excess returns when the natural selection principle works for the first time.

29In the experiments on this investor ratio without the investment restriction, we have obtained the results that conform to the conventional financial theories.

30For example, if the ratio of the stock to the total market value at the term t-1 is 50%, the investment ratio of the stock at the term t must be 50%±5%. Such both over and lower risk limits are usually found in the business area of asset management of pension.

31This tendency is accelerated when the degree of overconfidence is increased.

32We set the reference point of Prospect Theory at ten days before.

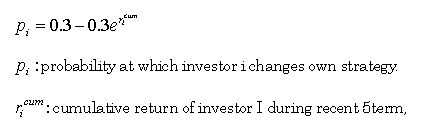
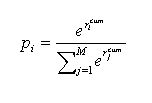
33 ericum corresponds to the fitness of genetic algorithm.


* Appendix A: Rules of the Natural Selection Principle

This appendix explains the principle of natural selection. The principle used in this paper is composed of two steps: (1) selection of investors who change their investment strategies and (2) selection of new strategy. Each step is described in the following sections:

A.1 Selection of investors who change their investment strategies

After 25 terms pass since the market has started, each investor makes decision at regular interval (every five terms) whether he/she changes the strategy. The decision is made depending on the cumulative excess return during the recent five terms and the investor who obtain smaller return changes the strategy at higher probability. To be more precise, the investor who obtain negative cumulative excess return changes the strategy at the following probability:

A.2 Selection of new strategy

We apply the method of genetic algorithm to the selection rule of new strategy. The investors who change the strategy tend to select the strategy that has brought positive cumulative excess return[33]. The probability to select Si as new strategy is given as:


* Appendix B: Outline of Bayes Correction Model

The investors in our model decide the investment ratio through the optimization based on the expected rate of return and the risk of the stock. The calculation of the expected rate of return on the stock is composed of three steps: (1) calculation of the implied stock return, (2) calculation of the short term expected rate of return, and (3) integration of the implied stock return and the short term expected rate of return.

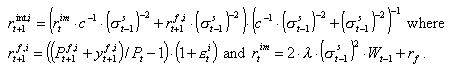
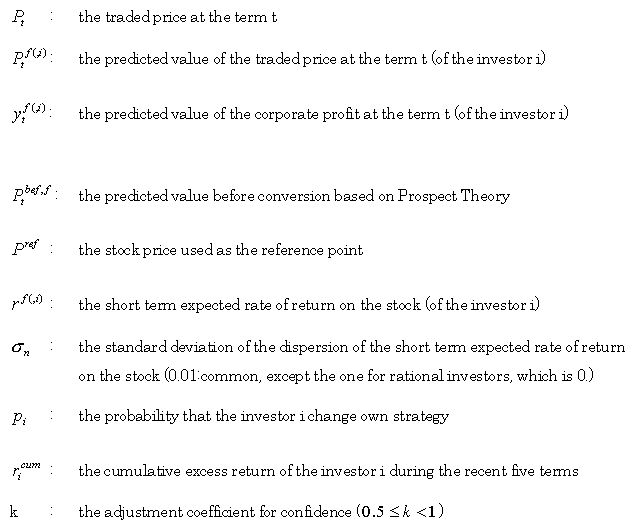
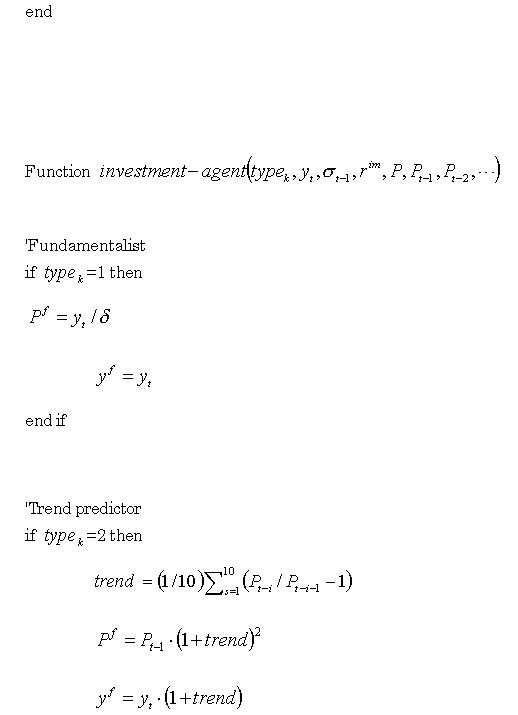
The short term expected rate of return of the investor i is calculated from the predicted stock price and the current stock price Pt as
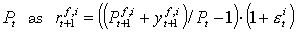
 , where 
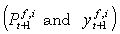
are the stock price and the predicted return of the investor respectively. The short term expected rate of return contains the error term 
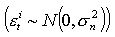
to reflect the fact that the in-depth prospects are different even among the investors of the same prediction type.

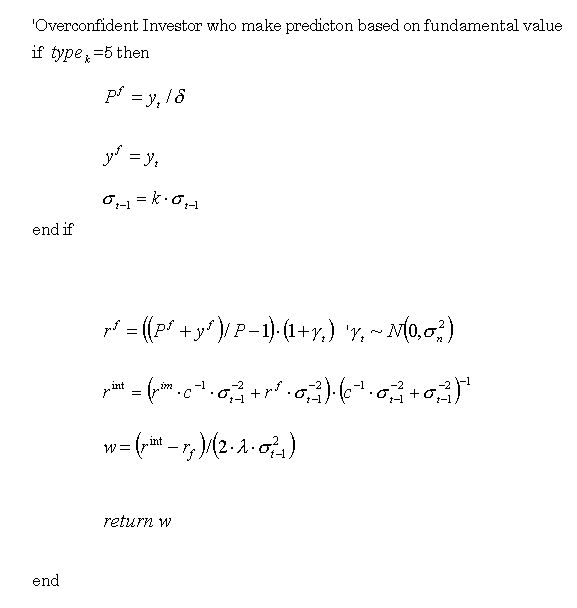
The expected rate of return on the stock is calculated as . As described above, the expected rate of return on the stock can be calculated based on the corporate profit at the term t and the information (such as prices) available from the market at and before the term t-1.


* Appendix C: List of Parameters

The parameters used in this paper are as follows:


* Appendix D: Sample program code


* References

AXELROD, R. (1997), The Complexity of Cooperation -Agent-Based Model of Competition and Collaboration, Princeton University Press.

ARTHUR, W.B., HOLLAND J.H., LEBARON B., PALMER R.G. AND TAYLOR, P. (1997),"Asset Pricing under Endogenous Expectations in an Artificial Stock Market," The Economy as an Evolving Complex System II, Addison-Wesley, pp.15-44.

AXTELL, R. (2000),"Why Agents? On the Varied Motivation For Agent Computing In the Social Sciences," the Brookings Institution Center on Social and Economic Dynamics Working Paper November No.17. Barberis, N., Shleifer A. and Vishny, R. (1998),"A model of Investor sentiment, ", Journal of Financial Economics 49, pp.307-343. BARBERIS, N., HUANG, M. and SANTOS, T. (2001), "Prospect Theory and Asset Prices, " The Quarterly Journal of Economics 116, pp.1-53.

BAZERMAN, M. (1998), Judgment in Managerial Decision Making, John Wiley & Sons.

BARBERIS, N. AND SHLEIFER, A., "Style Investing, " Journal of Financial Economics forthcoming.

BERGER, J.O. (1985), Statistical Decision Theory and Bayesian Analysis, Springer.

BLACK, R., AND LITTERMAN, R. (1992), "Global Portfolio Optimization, " Financial Analysts Journal September-October, pp.28-43.

CHIARELLA, C. (1992), "The dynamics of speculative behaviour, " Annals of Operations Research, 37, pp.101-123.

DAMASIO, A.R. (1994), Descartes' Error: Emotion, Reason, and the Human Brain, New York: G.P. Putnam.

DELONG, J.B., SHLEIFER, A., SUMMERS, L. AND WALDMANN, R. (1990a), "Noise trader risk in financial markets," Journal of Political Economy 98,pp.703-738.

DELONG, J.B., SHLEIFER, A., SUMMERS, L. AND WALDMANN, R. (1990b),"Positive feedback investment strategies and destabilizing rational speculation," Journal of Finance 45, pp.375-395.

EPSTEIN, J. M. AND AXTELL, R. (1996), Growing Artificial Societies Social Science From The Bottom Up, MIT Press.

FAMA, E. (1970),"Efficient Capital Markets: A Review of Theory and Empirical Work," Journal of Finance 25,pp.383-417.

FRIEDMAN, M. (1953), Essays in Positive Economics, University of Chicago Press.

Goldberg, D. (1989), Genetic Algorithms in Search, Optimization, and Machine Learning, Addison-Wesley.

HOWSON, C. AND URBACH, P. (1993), Scientific Reasoning, Open Court Publishing Company.

INGERSOLL, J. E.(1987),Theory of Financial Decision Making, Rowman & Littlefield.

HIRSHLEIFER, D.(2001),"Investor Psychology and Asset Pricing," Journal of Finance 56,1533-1597.

HONG, H. AND STEIN, J.C. (1999),"A Unified Theory of Underreaction, Momentum Trading, and Overreaction in Asset Markets, " Journal of Finance 54,pp.2143-2184.

KAGEL, J.H. AND ROTH., A.E.(eds.) (1995), The Handbook of Experimental Economics, Princeton University Press.

KAHNEMAN, D. and TVERSKY, A. (1979), "Prospect Theory of Decisions under Risk," Econometrica 47,263-291.

KAHNEMAN, D., SLOVIC, P. AND TVERSKY, A. (1982), Judgment under uncertainty: Heuristics and biases, Cambridge University Press.

KAHNEMAN, D., AND TVERSKY, A. (1992), "Advances in. prospect Theory: Cumulative representation of Uncertainty," Journal of Risk and Uncertainty 5.

KAHNEMAN, D. AND TVERSKY, A. (2000), Choices, Values, and Frames, Cambridge University Press.

KIRMAN, A. AND TEYSSIERE, G. (2001), "Microeconomic Models for Long-Memory in the Volatility of Financial Time Series," CeNDEF Working Paper, 5a.4.

KYLE, A.S. and Wang, A. (1997),"Speculation Duopoly with Agreement to Disagree: Can Overconfidence Survive the Market Test? , "Journal of Finance 52,pp.2073-2090.

LEDOUX, J. (1996), The emotional Brain: The Mysterious Underpinnings of Emotional Life, Academic Press.

LEVY, M., LEVY, H. AND SOLOMON, S. (2000), Microscopic Simulation of Financial Markets, Academic Press.

LOEWENSTEIN, G. (1996), "Out of control: visceral influences on behavior," Organizational Behavior and Human Decision Processes 65,pp.272-292.

LUX, T. (1998), "The socio-economic dynamics of speculative markets:interacting agents, chaos, and the fat tails of return distributions," Journal of Economic Behavior & Organization, 33, pp.143-165.

LUX, T. AND MARCHESI, M. (1998), "Scaling and criticality in a stochastic multi-agent model of a financial market, " Nature, 397, pp.498-500.

O'BRIEN, P. (1988), "Analysts' Forecasts as Earnings Expectations," Journal of Accounting and Economics January, pp.53-83.

PALEPU, K.G., BERNARD, V.L. AND HEALY, P.M. (1996),Introduction to Business Analysis & Valuation, International Thomson Publishing.

RUSSEL, S.J. AND NORVIG, P. (1995), Artificial Intelligence, Prentice-Hall.

SHARPE, W.F. (1964), "Capital Asset Prices: A Theory of Market Equilibrium under condition of Risk, "The Journal of Finance 19,pp.425-442.

SHARPE, W.F. (1987), "Integrated Asset Allocation," Financial Analysts Journal September-October.

SHILLER, R.J. (2000), Irrational Exuberance, Princeton University Press.

SHLEIFER, A. (2000), Inefficient Markets, Oxford University Press.

SIMON, H.A. (1955),"A behavioral model of rational choice," Quarterly Journal of Economics 69, pp.99-118.

SIMON, H.A. (1996), The Sciences of the Artificial, MIT Press.

TAKAHASHI, H., AND TERANO, T. (2002), "Bridging GARCH Model and Prospect theory in Financial Market behaviors via Agent-Based Simulation", 8th international conference of the society for computational economics Computing in Economic and Finance.

TVERSKY, A AND KAHNEMAN, D. (1981), "The Framing Decisions and the Psychology of Choice, " Science 211, pp. 453-458.

WOLFRAM, S. (1994),Cellular Automata and Complexity, Addison Wesley.

----

ButtonReturn to Contents of this issue

© Copyright Journal of Artificial Societies and Social Simulation, [2003]