©Copyright JASSS

JASSS logo ----


* Appendix: The VIR-POX Algorithm

A.1
The VIR-POX simulation model employed here builds on the platform of Lustick's ABIR model of identity formation and social interaction. ABIR is described at length in Lustick's previous work, and thus summarized only briefly in Section 1 below (in particular see "A Time Step in the Life of One ABIR Agent," available online here). VIR-POX adds to this foundation a model of infectious disease spread tailored to smallpox, laid out in Section 2.

1. The Agent-Based Identity Repertoire Model (ABIR)

A.2
ABIR operates within the context of an x by y rectangular or toric matrix composed of discrete agents. Each agent is primarily described by its coordinate address, its identity repertoire (a finite set of affiliations, represented by integers, to which the agent is "subscribed," less than or equal to the total spectrum of identities available in the world - e.g., [0,4,5,10]), and its currently activated identity (the one identity in its repertoire which is currently most salient - e.g., [4]). In more complex formulations of the model, agents can vary in their influence levels and other attributes as well, but none of those variations are employed here. At each time-step, every agent in the matrix knows its own identity repertoire, its own activated identity, and the activated identities of each of its 8 Moore neighbors (north, east, south, west, and diagonals). An agent X then acts as follows, excluding one factor, "biases," to be discussed below. Where S is the set of agents consisting of agent X and its 8 neighbors, a is X's currently activated identity, and R is X's repertoire:
  1. If some identity i in R other than a is activated by more agents in S than is a, and this difference is greater than some fixed threshold z1, X deactivates a and activates i instead.
  2. If some identity i not in R is activated by more agents in S than is a, and this difference is greater than some fixed threshold z2, X adds i to R.
  3. If some identity i not in R is activated by more agents in S than is a, and this difference is greater than some fixed threshold z3, X simultaneously adds i to R, deactivates a, and activates i instead.

A.3
In order to introduce pseudo-random parametric variation into the virtual world, punctuating its evolution over time, the frequency calculations outlined above are modulated by a stream of time-dependent random "bias" scores generated for each identity. These biases, which range from some negative integer to some positive integer (usually symmetric), are added to the count of each identity's representation in set S, such that a positively biased but less prevalent identity might trump a negatively biased but more prevalent one.

2. The Virtual Smallpox Model (VIR-POX)

A.4
VIR-POX adds additional data to each of the agents in the matrix, and appends several additional steps to the state transition rule operating between time-steps. Each agent includes information describing whether it is normal, vaccinated, infected, and/or empty[1], as well as a time-code variable used to vary an infected agent's virulence and presentation over time in accordance with the natural history of smallpox. Important parameter settings are listed below:


Contagion Factor (CF)10Base Neighborhood Risk Score increment for each infectious agent during pustular rash phase.
Prodrome Multiplier (M1)0.5Coefficient applied to CF during prodrome phase.
Peak Multiplier (M2)2Coefficient applied to CF during peak phase.
Social-Similarity Additive (S)30Neighborhood Risk Score increment for infected agents that share the central agent's activated identity.
Incubation Period (P0)10Number of time-steps before an infected agent becomes contagious.
Prodrome Period (P1)3Number of time-steps spent in prodrome phase.
Peak Period (P2)4Number of time-steps spent in early rash phase.
Virulent Period (P3)16Number of time-steps spent in pustular rash period.
Prodrome Detection Rate (D1)15%Probability of emptying an infected cell during prodrome phase.
Early Rash Detection Rate (D2)40%Probability of emptying an infected cell during early rash phase.
Rash Detection Rate (D3)80%Probability of emptying an infected cell during pustular rash phase.

A.5
Agents with one or more infectious neighbors are assigned a "neighborhood risk score" on a given time-step equal to:

Equation

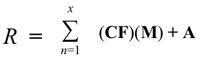
where x is the number of infectious neighbors, M is whichever multiplier (M1, M2, or neither) applies in the case of infectious neighbor n, and A equals zero if infectious neighbor n does not share the central agent's activated identity, or S if it does.

A.6
This risk score R is then compared to a randomly generated number ranging from 1 to 100, Q. If Q < R, the agent becomes infected before the next time-step. Thus any R ≥ 100 results in certain infection, and any R < 100 results in an "R out of 100 chance" of infection. It is noteworthy here that we do not construe the probability of infection as the result of x serial interactions with individual neighbors, i.e. as independent but cumulative trials of a probabilistic function. Instead, we choose to work from the stance of the eight-agent neighborhood and perform only one trial per central agent per time-step, based on a risk score that incorporates all the relevant variables for that agent's neighborhood (number of infected contacts, whether each shares its activated identity with the central agent, and stages of the disease). This in effect views all eight neighbors as equal potential contributors to the overall risk of the neighborhood, where an alternative model might view the neighbors as successive sources of contagion (such that each additional infected neighbor contributes less to the overall probability of the central agent becoming infected). It is our view that such an alternative model would yield only slightly different quantitative results than those reported here, and the same qualitative relationships.

A.7
Infected agents progress through the disease stages of incubation (P0), prodrome (P1), early rash or peak (P2), and pustular rash (P3). All cells containing infected agents have a probability of being emptied each time-step, equal to D1, D2, or D3 depending on the agent's current phase of the disease (this probability is zero during the incubation period).


* Notes

1“Empty cells” indicate agents that were infected and subsequently removed from their social environment, either by death, by isolation, or by relocation to a medical facility.

© Copyright Journal of Artificial Societies and Social Simulation, [2004]