©Copyright JASSS

JASSS logo ----

Chung-Yuan Huang, Chuen-Tsai Sun, Ji-Lung Hsieh and Holin Lin (2004)

Simulating SARS: Small-World Epidemiological Modeling and Public Health Policy Assessments

Journal of Artificial Societies and Social Simulation vol. 7, no. 4
<https://www.jasss.org/7/4/2.html>

To cite articles published in the Journal of Artificial Societies and Social Simulation, reference the above information and include paragraph numbers if necessary

Received: 26-May-2032    Accepted: 29-Aug-2004    Published: 31-Oct-2004


* Abstract

The authors propose a novel small-world model that makes use of cellular automata with the mirror identities of daily-contact social networks to simulate epidemiological scenarios. We established the mirror identity concept (a miniature representation of frequently visited places) to acknowledge human long-distance movement and geographic mobility. Specifically, the model was used to a) simulate the dynamics of SARS transmission in Singapore, Taipei, and Toronto and b) discuss the effectiveness of the respective public health policies of those cities. We believe the model can be applied to influenza, enteroviruses, AIDS, and other contagious diseases according to the various needs of health authorities.

Keywords:
SARS, Epidemiological Model, Cellular Automata, Mirror Identity, Small World Network, Public Health Policy

* Introduction

1.1
In anticipation of the next outbreak of Severe Acute Respiratory Syndrome (SARS) (Peiris et al. 2003), molecular biologists, epidemiologists, sociologists, private laboratories, and public health agencies are committing considerable amounts of time and resources to confirming viral structure, developing vaccines and antidotes, establishing faster inspection methods, and revising public health policies (Anand et al. 2003; Chowell et al. 2003; Donnelly et al. 2003; Guan et al. 2003; Lipsitch et al. 2003; Marra et al. 2003; Ng et al. 2003; Nishiura et al. 2003; Riley et al. 2003; Rota et al. 2003). The last topic on this list - specifically, the efficacy of various public health policies - is the focus of the present paper.

1.2
Identifying the best possible suite of public health policies requires detailed knowledge of SARS transmission dynamics based on the limited amount of data collected during the 2002-2003 SARS outbreak (Sebastian and Hoffmann 2003; World Health Organization [WHO] 2003). This information can be used to establish a SARS transmission model (Dye and Gay 2003) for balancing the social costs and resource expenditures required for controlling future outbreaks (WHO 2003). Policies that were implemented in 2002-2003 included the wearing of masks (by the general public or by health care/hospital workers), hand washing, quarantining, restrictions on hospital visitations, and wide-scale efforts to take the body temperatures of individual citizens. Unfortunately, improper implementation and inappropriate timing occasionally produced such secondary impacts as disease concealment, social discrimination against SARS patients and health care workers, and the panic buying of masks.

1.3
Computational modeling is increasingly being used to match public health policies with the characteristics of local populations. In addition to information on disease transmission, suitable SARS simulation models require accurate data on how social networks operate in modern societies (Dye and Gay 2003) - for instance, human clustering behavior, the potential for multiple contacts, and long-distance movement. The model that we will describe in this paper uses a combination of cellular automata (for the direct simulation of individual interactions) (Boccara et al. 1994) and a concept that we have developed and named mirror identities, which allows the model to consider low degrees of separation, long-distance movement, and daily visits to fixed locations. Combined, these factors assist in the creation of a realistic SARS simulation platform with small-world characteristics; we believe the model also has potential utility for simulating other infectious diseases (e.g., influenza, enteroviruses, and HIV/AIDS) as well as social issues (e.g., communication problems).

* Related Epidemiological Models

Compartmental SIR Model

2.1
Among physicists and epidemiologists, the most common approach to studying the spread of infectious diseases entails the use of differential equations (Kermack and Mckendrick 1927; Edeletein-Keshet 1988) or stochastic processing to build simulation models. Typical of the differential equations approach is the SIR compartmental model developed by Kermack and McKendrick (Fig. 1). These kinds of models can be easily processed with a set of mathematical equations and functions; a second strength is that they allow for the simplification of the factors and variables being considered. In addition to simulating the transmission dynamics of infectious diseases, these models have been used to establish numerical analytical methods and tools for calculating critical threshold values for determining disease spread potential - that is, the case reproduction number R0 which is considered a fundamental epidemiological parameter (Anderson and May 1982). R0 provides a picture of infectious disease transmission patterns and potential social problems, which allows public health agencies to develop policies and enact epidemic prevention strategies.

Figure 1
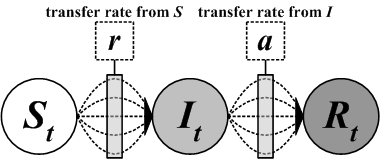
Figure 1. General transfer diagram for the Compartmental SIR model with susceptible class S, infective class I, and recovered class R

2.2
The SIR acronym represents three sub-populations in any society: Susceptible individuals who can become infected; Infectious individuals who enter a refractory state following a period of infection; and Removed individuals who have recovered, died, or who otherwise are incapable of transmitting the disease. A set of differential equations (e.g., Equation 1) is used to track individual movement dynamics between sub-populations. These models are suitable for simulating infectious disease transmission dynamics, but since they categorize individuals in terms of populations, they often fail to consider social phenomena associated with human interactions. Infectious disease epidemics result from countless contacts, interactions, and transmissions, yet most SIR-like models ignore many of the spatial, heterogeneous, interactive, and local characteristics of the spreading process. This limits their utility for studying public health policies and epidemic prevention strategies. Still, some aspects of these models (especially R0) are useful for verifying and comparing disease parameters; we therefore incorporated them into our model for purposes of improving accuracy.

Equation 1 (1)

Cellular Automata Models

2.3
Researchers have used cellular automata (CA) to study dynamic and/or non-equilibrium systems and to explore epidemic infection and transmission mechanisms in animals, plants (Martins et al. 2001), and humans (Ahmed and Agiza 1998; Ahmed and Elgazzar 2001; Benyoussef et al. 2003; Fuentes and Kuperman 1999). Due to their ability to provide intuitive network models, cellular automata are used to identify the local clustering and social characteristics (e.g., spatiality, heterogeneity, and interactivity) considered essential for studying transmission dynamics. As shown in Figure 2, social space in cellular automata can be represented as a two-dimensional lattice, which makes it easier to describe the properties of neighborhoods. Each intersecting point in a lattice represents a heterogeneous individual and links represent their interactions.

Figure 2
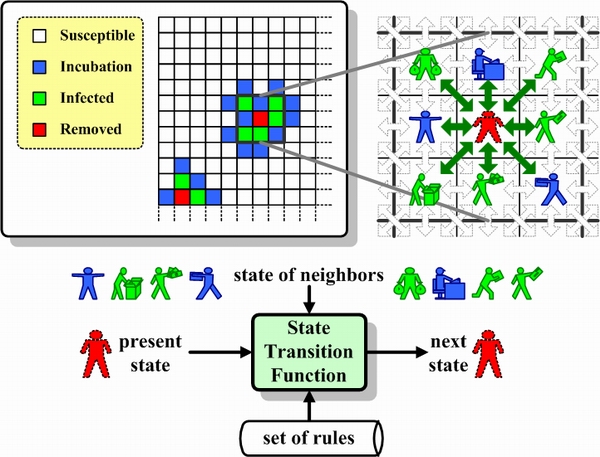
Figure 2. Cellular Automata, state transition function, and Moore neighborhood concept

2.4
Individuals possess attributes (e.g., disease progress, gender, age) that determine their current statuses. Equations 2 and 3 demonstrate that a synchronous change occurs in the status of each lattice point at every discrete time step, based on its current status, the status of neighboring lattice points, and a set of uniformly applied transition function rules. System status is defined as the aggregate status of all lattice points. Epidemiologists use this representation and a set of specific transmission rules to apply cellular automata when studying regional infection phenomena and the spreading mechanisms of infectious diseases. Still, despite the imperative social characteristics they possess, cellular automata generally fail to exhibit a "small-world" effect (Wang and Chen 2003). Without this characteristic, a model cannot accurately simulate real transmission dynamics nor the public health policies associated with epidemic diseases.

Equation 2 (2)

Equation 3 (3)

Small-World Social Network Model

2.5
In 1998, Watts and Strogatz (1998a) used psychologist Stanley Milgram's (1967) ideas on small-world phenomena in multiple interactions among social individuals to create an abstract disordered network model. Today it is generally accepted that the topological structure of social networks that they described exerts a strong influence on the development and consequences of social issues - for example, how public opinions and social norms are formed, how wealth is distributed, how new concepts and cultural traits lead to fashionable trends, and how a single case of an infectious disease can escalate into a large-scale epidemic (Keeling 1999; Moore and Newman 2000; Newman 2002; Wang and Chen 2003; Watts 1998b). Accordingly, the small-world characteristic is considered an important parameter for validating social and epidemiological simulation models.

2.6
Due to such human characteristics as clustering, low degrees of separation, multiple activity locations, and long-distance movement, actual geographic location and distance are considered secondary disease transmission factors in societies with small world properties. However, we have found that most studies that utilize a variant of Watts and Strogatz's small-world social network model to explore the transmission dynamics of infectious diseases (examples include Boccara and Cheong 1992, 1993; Boccara et al. 1993; Boccara et al. 1994; Eguiluz and Klemm 2003; Kleczkowski and Grenfell 1999; Kuperman and Abramson 2001; Miramontes and Luque 2002; Moreno et al. 2002; Newman 2000, Newman 2002; Newman et al. 2002; Sirakoulis et al. 2000) are limited in terms of how they consider the effects of social networks. Specifically, we have noticed a lack of realistic small-world network models and simulation platforms that can be used to represent daily contact relationships for a wide range of contagious diseases; most research efforts have been limited to individual diseases with special transmission dynamics (e.g., HIV/AIDS). Our goal was to construct a small-world social network model based on daily life contacts that public health officials can use to quickly establish epidemic prevention strategies for a broad range of contagious diseases.

* The Proposed Model

3.1
Our proposed model consists of two layers (Fig. 3). The upper layer is a multi-agent system used to simulate real-world heterogeneous cohorts. The lower layer consists of two-dimensional cellular automata (i.e., two-dimensional toric periodic lattices) used to demonstrate real-world activity spaces. The mirror identity concept connects the two layers, resulting in a small-world network model for analyzing the transmission dynamics of epidemic diseases and social issues.

Figure 3
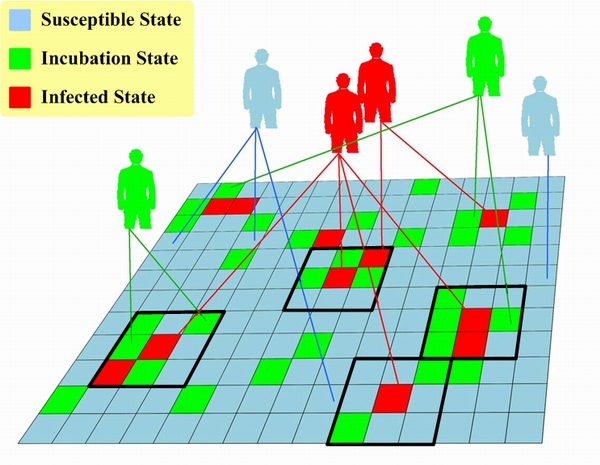
Figure 3. Cellular automata with mirror identity model (CAMIM)

Cellular Automata with Mirror Identities Model (CAMIM)

3.2
The abstract mirror identity concept is based on human interactions and daily routines within the confines of a modern society. It specifies an individual's social attributes - for instance, long-distance movement, daily visits to fixed locations, and multiple-activity locations. In our proposed model, individuals are viewed as single agent entities of an upper-layer multi-agent system; the places that an individual visits on a regular basis are defined as mirror identities.

3.3
We will use Andy, a retired senior citizen who lives alone, as an example. Every morning at 8:00 a.m. he rides his motor scooter to a suburban nursing home, where he serves as a volunteer. He helps a nurse named Cindy to provide care for three residents named Bob, Dick, and Eric. Every evening at 6:00 p.m. he eats at an inexpensive Japanese restaurant, where he usually chats with the owner, the chef, and several other regular customers. After dinner, he goes home, changes clothes, then goes to a neighborhood tavern to spend some time with his friends Frank and Gerry. Andy rarely deviates from this routine. According to our proposed model, Andy, Bob, Cindy, Dick and Eric are upper-layer agents, and Andy's home, the nursing home, the Japanese restaurant and the tavern are lower-layer mirror identities. Note that his motor scooter is considered an extension of his home instead of an activity node, since he rarely rides with others.

3.4
Each agent in the upper layer has a set of attributes describing its epidemiological progress and social mobility states (Table 1 and Fig. 4). Each mirror identity, which can freely access agent attributes, has a group of private attributes that represent its current status and local data (Table 2). Agents can freely access the attributes of any mirror identity they are connected to. Furthermore, agents can use their mirror identities to form clusters with other agents. For example, Andy belongs to three groups - one each at the nursing home, the tavern, and the Japanese restaurant. In formal terms, all of an agent's mirror identities are connected through that agent; they form a star-shaped topology with the agent at the center and the mirror identities at the vertices.

Figure 4
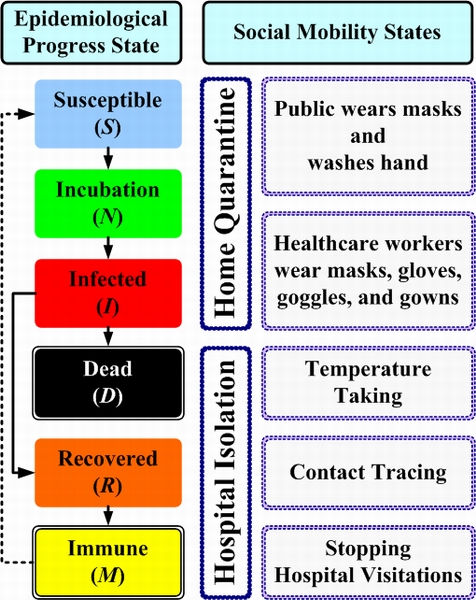
Figure 4. Epidemiological states and two social mobility states


Table 1: Agent Attributes

AttributeTypeDescriptionValue
IDIntegerUnique serial number that identifies virtual society agent; sequence not considered critical. 1~P
ESymbolWhen the PopulationAgent parameter is set, the configured RateForeverImmune determines the rate of agents classified as M (Immune) in the epidemiological progress state E - that is, the population of permanently immune agents. All remaining agents are classified as S (Susceptible), meaning “not yet infected but prone to infection.” Susceptible, Incubation,
Infected,
Recovered,
Immune,
Dead
MobilitySymbolWhen the PopulationAgent parameter is set, the Mobility status of every agent is preset as “free” - that is, these agents have no restrictions in terms of interacting with the mirror identities of neighboring agents. When an agent is placed under home quarantine or hospital isolation, its Mobility status is respectively changed to Quarantined or Isolated. This means the agent is restricted to its rooted mirror identity (e.g., home, hospital, or dormitory), and the activities of all mirror identities are temporarily suspended.Free,
Quarantined,
Isolated
CountIntegerRecords the number of an agent's mirror identities; every agent has a minimum of one and a maximum of M. These numbers are normally distributed. 1~M
MirrorIdentitySetData structure for containing mirror identities; each contains at least one.
AgeSymbolIn the proposed model, agents are divided according to three age levels: young (1 to 20), prime (21 to 60); and old (61 and higher). When a simulation system is initiated, agent ages are randomly set based on the RateYoung, RatePrime, and RateOld parameters.Young,
Prime,
Old
SuperBooleanDenotes whether an agent is a super-spreader. If yes, set Super to “true”; if no, to “false”. When simulation system is initiated, the RateSuper parameter is used to determine which agents are super-spreaders.true,
false
ImmunityPermanentBooleanDenotes whether an agent is permanently immune. If yes, set ImmunityPermanenty to “true”; if no, to “false”. When simulation system is initiated, the RatePermanentImmunity parameter is used to determine which agents are permanently immune.true,
false
DayIntegerNumber of days for the three epidemiological progress states. If an infected agent has not yet recovered, Day is used to indicate the number of infected days; for recovered agents, Day is used to indicate the number of days since full recovery. If a recovered agent has temporary antibodies, Day is used to indicate the number of immune days.
RateContactRealRate of contact with other agents. For all agents, RateContact is normally distributed.0~1
WearingMaskBooleanDenotes whether agent wears a mask. If yes, set WearingMask to “true”; if no, to “false”. When simulation system is initiated, the WearingMask attribute for all agents is preset to “false”. When a mask wearing policy is enacted (for the general public or healthcare workers), the RateParticipation parameter is used to determine which agents wear masks.true,
false
MaskTypeRealRepresents average prevention grade of agent masks. The higher the number (close to 1), the greater the efficacy.0~1
QuarantinedDayIntegerNumber of home quarantine days, with a range of 0 to Policy.Parameter.DayQuarantined.


Table 2: Mirror Identity Attributes

AttributeTypeDescriptionValue
RootBooleanEach agent has one mirror identity whose Root = true; for all other mirror identities, Root = false. The root mirror identity is used to mimic special activity locations - e.g., homes, hospitals, and dormitories.true,
false
SuspendBooleanWhen the simulation system is initiated, Suspend = false for all agent mirror identities, denoting that all mirror identities are free to move about without any restrictions. Except for its rooted mirror identity, Suspend = true for all of the mirror identities of an agent in home quarantine or hospital isolation. This represents the idea that the agent cannot move about until the end of the home quarantine or recovery period. If the agent dies, Suspend = true for all mirror identities (including the rooted mirror identity), representing the idea that the agent can no longer visit any other locations.true,
false
Location(Integer, Integer)The first number represents the x-axis coordinate and the second number the y-axis coordinate for the location of a mirror identity in the two-dimensional lattice. Each mirror identity is mapped to a single coordinate location; in other words, each coordinate location contains a single mirror identity of only one agent.
NeighborSetRepresents the coordinate locations of an agent's eight mirror identities. Moore or von Neumann neighborhood relationships are used in most simulation systems. Under the Moore system, each mirror identity is defined as having eight neighbor agents; under the von Neumann system the number is four. We adopted the Moore neighborhood definition for our SARS simulation experiments.

3.5
The majority of agents have between 2 and 5 mirror identities, with the number of mirror identities connected to an agent representing a normal distribution. In our proposed model, the more mirror identities an agent has, the larger the number of activity nodes and the greater the agent's influence. Using an epidemic disease as an example, the greater the number of lattices connected to an agent, the greater the chances that the agent will become infected and/or transmit the disease to other agents. Lattices that surround each other in cellular automata represent neighbors - for example, the mirror identities of Andy, Cindy, Bob, Dick, and Eric are adjacent to each other, and Andy's tavern mirror identity is adjacent to Frank and Gerry's.

3.6
In our model, one discrete time step is the equivalent of one day in the real world. The states of agents and their mirror identities change simultaneously during each discrete time step, and each agent's mirror identity comes into contact with its surrounding mirror identities. The attributes of the agent, its mirror identity, and surrounding mirror identities vary according to the interaction rules described in sections 3.2 and 3.3, simulation and epidemic parameters (Table 3), public health policy parameters (Table 4), input data tables (Table 5), and various random values. Accordingly, our combination of cellular automata and mirror identities is capable of displaying multiple social network characteristics: fixed locations visited daily, long-distance movement, local clustering, high degrees of clustering, and low degrees of separation.

Table 3: Simulation System and Epidemic Infection Parameters

AttributeTypeDescription
PopulationAgentSetStores total agent population in the simulation system; maximum capacity is P agents.
PIntegerTotal number of agents.
MIntegerUpper limit of an agent's mirror identities.
HIntegerHeight of the two-dimensional lattice used in the cellular automata.
WIntegerWidth of the two-dimensional lattice used in the cellular automata.
NIntegerTotal number of usable lattice H ◊ W in the cellular automata.
DayIncubationIntegerAverage number of incubation days.
DayInfectiousIntegerAverage number of infectious days.
DayRecoveredIntegerAverage number of recovered days.
DayImmuneIntegerTemporarily immune to the disease; average number of incubation days.
RateSuperRealPercentage of super-spreaders among total population.
RateYoungRealPercentage of young (0 to 20 years) agents in total population.
RatePrimeRealPercentage of prime (21 to 60 years) agents in total population.
RateOldRealPercentage of old (60 years and above) agents in total population.
RateForeverImmunityRealPercentage of permanently immune agents in total population.
RateInfectionRealAverage infection rate.
RateDeathRealAverage death rate.


Table 4: Public Health Policy Parameters

PolicyAttributeTypeDescriptionValue
WearingMaskInGPRateParticipationRealPolicy participation rate.0~1
RatePreventionRealInfectious disease prevention rate.0~1

WearningMaskInHWRateParticipationRealPolicy participation rate.0~1
RatePreventionRealInfectious disease prevention rate.0~1

TemperatureMeasuringRateDetectionRealFever detection success rate.0~1
RateParticipationRealMeasurement participation rate.0~1

HomeQuarantineClassSymbolA- and B-class quarantines.A, B
DayQuarantinedIntegerNumber of home quarantine days.0~1
RateParticipationRealPolicy participation rate0~1

RestrictingAccessToHospitalsRateParticipationRealPolicy participation rate.0~1

ReducingPublicContactRateParticipationRealPolicy participation rate.0~1


Table 5: Input Data for Simulating SARS Epidemic Curves in Taiwan, Singapore, and Toronto

CategoryAttributeTypeDescriptionValue
Imported CasesTime PointDateDate when the imported case occurred.
AmountIntegerNumber of patients.0~999
PhaseSymbolImported during incubation or illness periodIncubation,
Infected
Super-spreaderBooleanDetermine whether the imported patient is a super-spreader. true,
false
Public Health PolicyRelated AttributesSee Table 4
RunDayIntegerNumber of execution days.0~99

Modeling Epidemiological Features

From Contact to Infection to Symptom

3.7
Based on an adjusted contact rate (Agent.Parameter.RateContact) and a random number c, the mirror identities of each agent determines whether or not it will interact individually with the mirror identities of eight adjacent neighbors. If the c is lower than the contact rate, the mirror identity of agent A comes into contact with the mirror identity of neighbor agent B. The contact rate Agent.Parameter.RateContact depends on whether a "reducing public contact" policy or other parameter settings have been enacted. Throughout this section, we will express these concepts in pseudo-code; here the pseudo-code is

Code 1

3.8
Assume that agent A has a mirror identity that is adjacent to a mirror identity of agent B, that agent A has been infected and is contagious, and that agent B is both susceptible and prone to infection. When the two agents come into contact, a combination of infection rate (System.Parameter.RateInfection) and a random number n determines whether or not agent B is infected by agent A. If the n is lower than the infection rate, agent B's epidemiological state becomes N (incubation) and the period attribute (Agent.AttributeDay) becomes 1 (denoting that symptoms have not appeared and that agent B cannot transmit the disease). The infection rate System.Parameter.RateInfection is determined by such factors as immunity rate - that is, whether agent A is a super-spreader (CDC 2003b; Sebastian and Hoffmann 2003), in home quarantine, in hospital isolation, etc.

Code 2

3.9
Agent A's epidemiological state will automatically change from N to I (Infected) once it has exceeded the incubation period System.Parameter.DayIncubation.

Code 3

3.10
When agent A's epidemiological state is I and it has exceeded the infectious period System.Parameter.DayInfectious, a combination of the adjusted death rate (System.Parameter.RateDeath) and a random number d determines whether the agent enters the D (Death) or R (Recovered) state. Death rates are determined by such factors as age, whether the agent was placed under home quarantine throughout its incubation and infective periods, whether it received treatment in hospital isolation, and its public activities (if any) during the period of illness.

Code 4

3.12
When agent A's epidemiological state is R and it has exceeded recovery period System.Parameter.DayRecovered, it automatically enters an M (Immune) state.

Code 5

3.13
In the M state, the Agent.AttributeForeverImmune parameter is used to determine whether agent A's immunity is permanent or temporary - that is, whether complete recovery or renewed susceptibility occurs following System.Parameter.DayImmune.

Code 6

Families and Hospitals

3.14
Our proposed model can also be used to represent such concepts as homes, dormitories, and hospitals. As shown in Table 2, all mirror identities have two private attributes: root and suspend. For most agents, one mirror identity's root attribute is designated as true but the root attributes of its other mirror identities are designated as false. In contrast, the suspend attributes of all mirror identities of an agent are designated as false. To facilitate later discussion, we will assume the presence of a rooted mirror identity - that is, a mirror identity whose root attribute is always designated as true. The rooted mirror identity can be used to represent such unique (e.g., one-of-a-kind) units as homes, dormitories, and hospitals.

Code 7

3.15
If a health authority enforces a home quarantine of agent A, then the suspend attributes of all its mirror identities (workplace, school, bus stations, and so on) are marked as true; the one exception is agent A's rooted mirror identity - that is, its home. The lattice points surrounding agent A's rooted mirror identity represent the mirror identities of the agent's family members or cohabitants. Once the home quarantine is lifted, the suspend attributes of these mirror identities (except for that of the rooted mirror identity) return to false, indicating a resumption of normal agent A activities.

Code 8a
Code 8b

3.16
We believe another advantage of the model is that it does not require fixed areas of lattice points representing hospitals. Assume that agent B, with a confirmed epidemiological state of I, enters isolation voluntarily. Similar to the preceding example, the suspend attributes of all agent B mirror identities are changed to true, with the exception of its rooted mirror identity. This represents a scenario where agent B is receiving treatment in hospital isolation, and where all of the agent's outside activities cease. The lattice points surrounding agent B's rooted mirror identity represent medical staff, nurses, healthcare workers, and perhaps family members. If agent B recovers, the suspend attributes of the affected mirror identities return to false, indicating a resumption of agent B's normal activities. If the agent dies, the suspend attributes of all agent B mirror identities (including its root mirror identity) are permanently changed to false, indicating the permanent cessation of all of the agent's activities.

Code 9a
Code 9b

Modeling Public Health Policies

Mask Policy - General Public vs. Healthcare Workers

3.17
A mask-wearing policy for the general public has two parameters: participation rate and prevention efficiency. Participation rate refers to the percentage of individuals in the total population who actually wear masks, and prevention efficiency represents the protection grade of the masks being used. Both parameters are adjustable. When this policy is enacted, the simulation system uses the participation rate to randomly assign a number of individuals who abide by wearing masks. If agent A in a simulation system has an S status but wears a mask, its infection probability decreases in accordance with the prevention efficiency parameter. The chances of an I-status agent A infecting others decreases if the simulated agent wears a mask before and after the outbreak of symptoms; this potential is also affected by the prevention efficiency parameter.

Code 10

3.18
The same process used to represent hospitals can also be used to simulate a mask-wearing policy. Once the policy is enacted, agents surrounding the rooted mirror identity of agents in hospital isolation either wear or don't wear masks based on the participation rate parameter; the prevention efficiency parameter also determines whether or not the infection probability of neighboring agents is reduced.

Code 11

Taking Body Temperature

3.19
If a temperature measurement policy is enforced, the mirror identities of each agent will be claimed by its surrounding agents collectively whether it should taken body temperature before it comes into contact with them. This decision is made based on a combination of a participation rate parameter and a random number n. An n that is lower than the participation rate means that neighboring agents are abiding by the policy of measuring the temperatures of agents that want to come into contact with them. Results depend on the detection rate parameter - in other words, the higher the detection rate and the more accurate the thermometers being used, the lower the rate of spreading the disease.
Reducing Public Contact

3.20
At the end of the 2002-2003 SARS epidemic, there were many reports (e.g., Sebastian and Hoffmann 2003; WHO 2003) describing the reduction of public contact as an effective means of controlling the spread of the disease. After this policy was enacted in our simulation, the combination of the participation rate parameter and a random number n determined whether or not the mirror identities of two agents interacted before coming into physical contact. An n higher than the participation rate indicated that either an agent had decided against coming into contact with agents surrounding a particular mirror identity, or simply had no reason for mirror identity interactions.
A/B Class Home Quarantines

3.21
According to an A-class home quarantine policy, if agent C is identified as being ill after such a policy is enacted, all agents surrounding agent C's mirror identities must decide whether they should go into home quarantine based on the participation rate parameter. As in the hospital isolation example described above, all mirror identities of neighboring agents that decide to enter home quarantine immediately stop all activities until the separation period is completed, as determined by a public health policy parameter. This requirement does not apply to rooted mirror identities, which are still allowed to come into contact with other agents.

3.22
A B-class home quarantine policy is similar to an A-class policy, but it affects a slightly larger number of agents than the A-class policy. If one mirror identity of agent C is adjacent to a particular mirror identity of agent D (e.g., agents C and D are a cohabiting couple), this represents one degree of separation; if one mirror identity of agent D is adjacent to a particular mirror identity of agent E (e.g., coworkers in the same office), this represents two degrees of separation between agents E and C. Accordingly, when agent C is diagnosed with the disease, both D and E face the risk of infection, meaning that both D and E must enter home quarantine.
Controlling Hospital Access

3.23
During the actual SARS epidemic, Singaporean and Taiwanese health authorities imposed strict rules concerning hospital visitations (Sebastian and Hoffmann 2003); we simulated this "controlling hospital access" policy using our proposed model. We assumed that agent A showed symptoms of the disease and was admitted to a hospital for treatment in isolation. If agent B's rooted mirror identity is adjacent to agent A's rooted mirror identity, it indicates that agent B may be a member the hospital staff, a nurse, a healthcare worker, or a very close relative; if agent C's non-rooted mirror identities are adjacent to agent A's rooted mirror identity, it indicates that agent C is a distant relative, friend, classmate, or coworker. If a strict visitation policy is enacted, agent B is allowed to visit agent A, but agent C is not.

* Simulating Sars With Camim

Comparing Simulation Results with Actual Cases

4.1
After initializing the model and establishing parameters according to SARS disease information disseminated by the Centers for Disease Control (CDC)(2003a, 2003c, 2003f, 2003h) and World Health Organization (WHO)(2003) (Table 5), we ran simulations of SARS transmission dynamics in various geographic areas and compared the effectiveness of various public health policies and disease prevention strategies (Figs. 5 and 6). SARS originated in Guangdong, in southern China, therefore in all other countries it is considered an imported virus. We therefore used imported cases announced by health authorities as our model's simulation trigger (Appendix A). For each simulation we included the number of infectious people who entered a country, the discrete time step during which they entered, and whether or not they were exposed or infected as they entered a country. We triggered various public health policies according to the actual announcements of local health authorities, and adjusted our simulation environment, epidemic, and public health policy parameters according to actual disease information presented by the CDC (CDC 2003b, CDC 2003d, CDC 2003e, CDC 2003g) and Sebastian and Hoffmann (2003). In other words, our model makes use of actual epidemic parameter values from the CDC, WHO, and the health authorities of affected countries, thus avoiding the use of derived or estimated data.

Figure 5
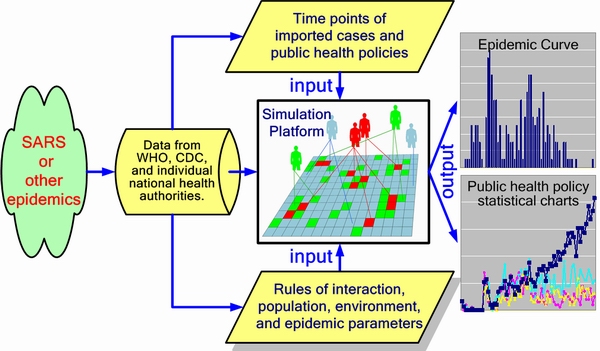
Figure 5. Simulation framework. Data on reported cases came from the World Health Organization (WHO) and health authorities in Singapore, Taiwan, and Toronto. Input data was distributed into three categories: epidemic parameters (e.g., average incubation period, infection rate, distribution among age groups, mortality); imported cases (e.g., time point, amount, imported during incubation or illness period); and public health policies, activated according to data from individual nations (e.g., number of quarantine days, efforts to take body temperatures, restricting access to hospitals). Simulation output includes cellular automata states and various statistical charts

Figure 6a
Figure 6b
Figure 6c
Figure 6. Simulation platform for contagious infection

Singapore SARS Outbreak

4.2
According to the comparison of actual and simulated SARS cases in Singapore shown in Figure 7, the simulated curve has a very close fit with data published by the city-state's health authority for the two outbreaks that occurred between February 25 and May 5 of 2003 (CDC 2003b; Sebastian and Hoffmann 2003; WHO 2003). The first outbreak was attributed to imported cases, and emergency public health policies were not activated. The second was attributed to the compound effects of secondary infections, and several emergency policies were put into effect on March 24 (e.g., a ban on visits to patients in hospitals or under home quarantine). The number of new cases dropped dramatically at the beginning of June, and soon afterwards the World Health Organization (WHO) announced that the disease was under control.

Figure 7
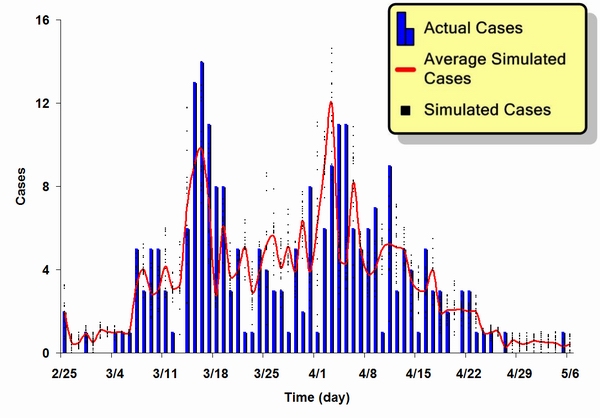
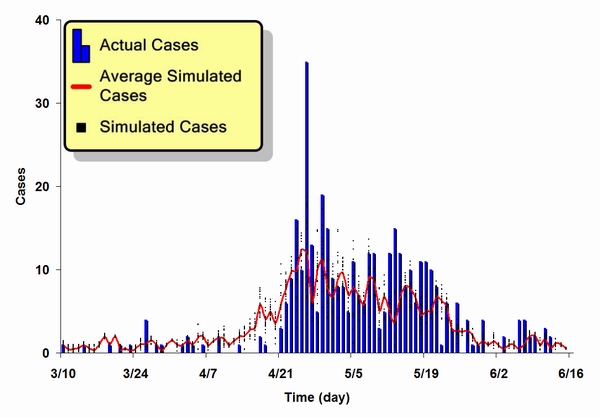
Figure 7. A Comparison of actual and simulated epidemic results for the SARS outbreak in Singapore. Blue bars represent actual reported cases, red line represents an average of 20 simulation results, and black dots represent 20 simulation results

Taipei SARS Outbreak

4.3
Our simulation of the Taipei situation included several public health policies enforced by that city's government, including several grades of home quarantine and a mask-wearing requirement for all bus and train travelers (CDC 2003d; CDC 2003g; Sebastian and Hoffmann 2003; WHO 2003). As shown in Figure 8, the simulated results have a close fit with the epidemic curve of probable cases published by the Taiwanese health authority on September 28, 2003 - that is, a major spike followed by several smaller outbreaks. We believe the heavier concentration in the Taipei curve (compared to Singapore's) is due to several different factors, including late case discoveries, delays in seeking treatment, illness cover-ups, public interactions, and the large number of cases imported by travelers returning from Hong Kong. In Singapore, all imported cases were reported prior to the first outbreak, and the second wave resulted from compound infections. In Taiwan, the reported s-curve is more representative of a typical infection pattern.

Figure 8
Figure 8. A comparison of actual and simulated epidemic results for the SARS outbreak in Taipei

Toronto SARS Outbreak

4.4
In Toronto, the SARS scenario consisted of two major waves with almost no new cases in between (Fig. 9) (CDC 2003e>; Sebastian and Hoffmann 2003; WHO 2003). After a re-examination of the data in August of 2003, the Canadian authorities acknowledged several additional cases during the lull period. According to our simulation, the second wave would not have been as severe if strong public health policies had been enforced for a longer period following the first wave. In our simulation, epidemic control measures - especially restricted hospital access and reduced public contact with infected persons - were relaxed after the first wave subsided. This resulted in a second spike occurring within a few days of the actual spike that was reported by Toronto health authorities. Our results matched Kamps-Hoffmann's (Sebastian and Hoffmann 2003) conclusion that the Toronto government lifted its control measures too quickly. Because of increased contact between patients and visitors and relaxed rules on the wearing of masks or respirators by health care workers, Toronto suffered a second nosocomial transmission period.

Figure 9
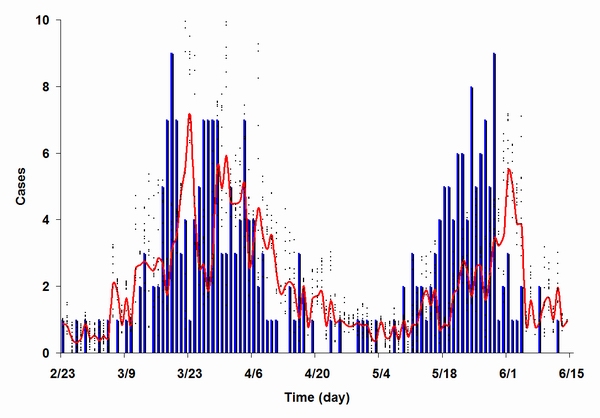
Figure 9. A comparison of actual and simulated epidemic results for the SARS outbreak in Toronto. We assumed that the second outbreak occurred because preventive policies were relaxed too soon following the first outbreak

4.5
From the combined results of these simulations, we suggest that our proposed model is a useful tool for purposes of cross-checking hypothesized findings and for gaining insight into how infectious disease epidemics develop.
Home Quarantines

4.6
In addition to the above simulations, we tested our model using the home quarantine policy. After releasing details of the global SARS outbreak on March 12, 2003, WHO officials suggested that home quarantine periods should be at least twice as long as the then-average 4-6 day incubation period in order to suppress the spread of the disease (CDC 2003a; CDC 2003g; WHO 2003). Consequently, the governments of Singapore, Taiwan, and Canada established and enforced 10-day quarantine policies during the epidemic, and for a short period the Taiwanese government enforced a 14-day policy. According to our simulation results, a minimum 10-day quarantine period was required for suppressing the number of new cases - the same time period recommended by WHO (Fig. 10). We observed that the SARS epidemic curve slowed down considerably and that the disease became endemic when the quarantine period was a minimum 10 days, otherwise it was impossible to control the disease.

Figure 10
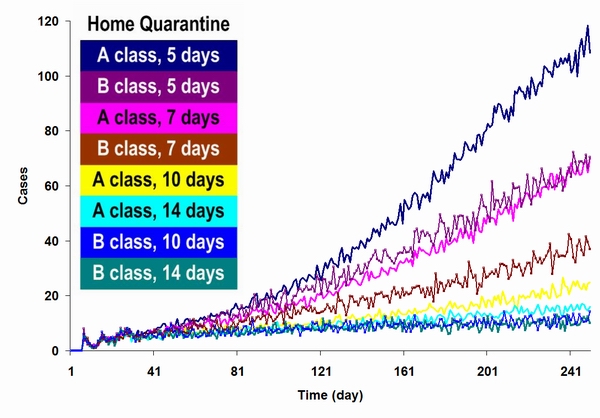
Figure 10. Results from a simulation based on various home quarantine policies. The time period for the simulation was 250 days, with a default incubation period of 5 days. The results indicate that different home quarantine restriction levels exerted different impacts on the SARS epidemic, and that a home quarantine policy by itself was insufficient for suppressing the epidemic

Analyzing Public Health Policies

Taking Body Temperature

4.7
The Singaporean and Taiwanese governments both implemented temperature measurement policies during the epidemic, going so far as to launch national campaigns that included installing temperature-monitoring equipment and setting up manual temperature measurement stations at various government buildings, clinics, and public transportation stations (Sebastian and Hoffmann 2003; WHO 2003). According to our simulation results, when such policies are both comprehensive and compulsory, they reduce the number of feverish individuals entering public places. However, they are difficult to execute; implementation methods tend to vary, oversights are common, and an unknown number of individuals manage to evade having their temperatures taken.

4.8
The results from our simulation suggest that a participation rate of between 80 and 90 percent is required for this public health policy to have a positive effect in controlling a SARS epidemic (Fig. 11). At a rate of 65 percent or lower, the policy has little effect. In addition, the policy incurs significant social costs - providing inexpensive thermometers, setting up stations for their distribution, setting up temperature screening stations, and arranging for manual temperature measurements at various government buildings, medical clinics, and public transportation stations.

Figure 11
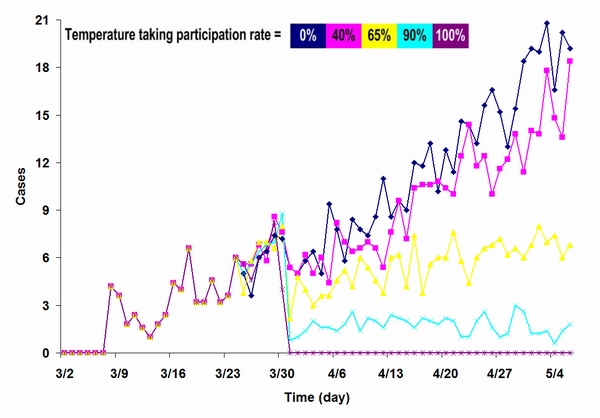
Figure 11. Results from a simulation focused on temperature measuring policy at different participation levels. We used the 8 imported case reported in Singapore to trigger the simulation. In each 66-day simulation run, the policy was activated on day 24; the goal was to compare impacts at different participation rates

Wearing Masks with Different Protection Levels - General Public vs. Healthcare Workers

4.9
The governments of Taiwan and Hong Kong made great efforts to promote general mask-wearing policies, which led to hoarding and panic buying (Sebastian and Hoffmann 2003; WHO 2003). Masks are categorized according to grade - ordinary, surgical, N95 respirator masks, etc. In Taiwan, a serious shortage of professional masks for medical staff occurred following a mad rush by the general population to purchase masks regardless of grade; this triggered a debate on the necessity of wearing N95 respirator masks outside of hospitals and clinics.

4.10
According to the results presented in Figure 12, ordinary and surgical masks can assist in controlling an epidemic outbreak as long as wearing them becomes a strong habit for the desired time period. At a prevention efficiency of 65 percent or more (that is, the mask covers the mouth and nose), epidemics can be controlled but not eliminated. When wearing ordinary masks, medical staff members have higher infection rates (Figs. 12 and 13); these personnel clearly benefit from wearing N95 and other high-resistance masks in hospitals and other medical centers. From our simulation, we suggest that the general public does not require high-resistance masks, and that higher grade masks should be reserved for use by medical staff and healthcare workers.

Figure 12
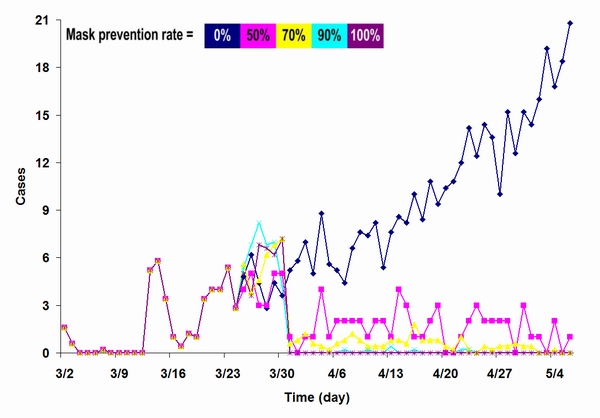
Figure 12. Results from a simulation focused on the impact of mask-wearing by the general public, comparing different mask protection levels

Figure 13
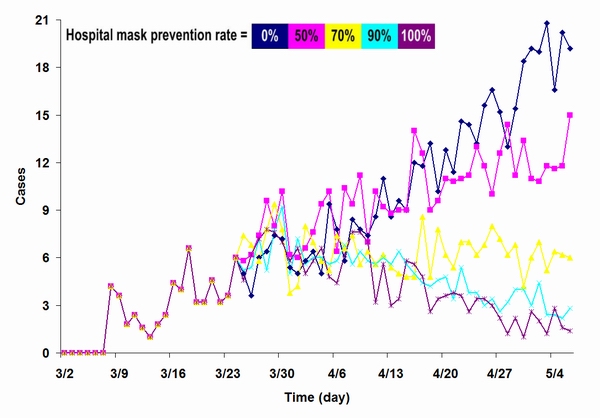
Figure 13. Results from a simulation focused on the impact of mask-wearing by healthcare workers in healthcare facilities, comparing different mask protection levels

Assessing Public Health Suites

4.11
Different public health policies have different social costs. Home quarantining is highly effective, but it requires considerable amounts of labor and material resources compared to temperature measurement and mask-wearing policies. We ran simulations of various prevention strategies in an attempt to find an optimal combination of public health policies in terms of efficacy and cost, and found that a combination of mask-wearing by the general public and reducing contact in public places was the best combination for suppressing the spread of SARS (Fig. 14). Some costs are involved in mask purchases, but few costs are associated with limited public contact. In addition, mask wearing addresses an epidemic at its source - disease transmission.

4.12
The combined strategies of temperature measurements, restricted hospital visitations, and mask-wearing by healthcare workers should be considered a remedial reaction to a SARS outbreak. This strategy suite is ineffective in stopping patients in the incubation stage or patients suffering from minor symptoms from spreading the disease to others. In addition to its numerous loopholes, this suite also requires substantial amounts of labor and material resources. The combination of home quarantines and reducing contact in public places also has high social costs, yet the disease can still be transmitted if strict isolation is not observed for the time periods discussed in an earlier section. Numerous instances of intra-family infections were reported during the 2002-2003 SARS outbreaks - evidence that the combination of these prevention strategies is ineffective in controlling this kind of epidemic.

Figure 14
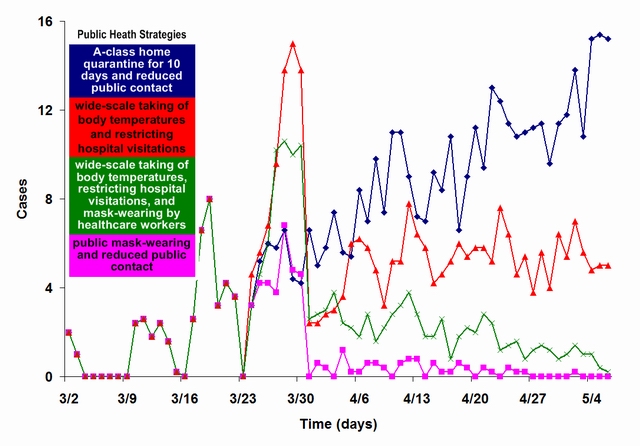
Figure 14. A comparison of various public health policy suites. We used the 8 imported cases reported in Singapore to trigger the simulation. Policy suites went into effect on day 24 of the 66-day simulation. Suite 1 (cyan): A-class home quarantine for 10 days and reduced public contact; suite 2 (red): wide-scale taking of body temperatures and restricting hospital visitations; suite 3 (green): wide-scale taking of body temperatures, restricting hospital visitations, and mask-wearing by healthcare workers; suite 4 (pink): public mask-wearing and reduced public contact

* Conclusion

5.1
In this paper, we proposed a novel small-world model consisting of cellular automata with mirror identities representing daily-contact social networks for running epidemiological simulations. We established the mirror identity concept to integrate long-distance movement and geographic mobility into the model, which can be used to simulate the transmission dynamics of infectious diseases among social networks and to investigate the efficacies of various public health policies and epidemic prevention strategies - alone and in combination. The model successfully exhibits epidemiological behaviors in the form of daily interactions among heterogeneous individuals, and expresses such present-day small-world properties as high degrees of clustering, low degrees of separation, and long-distance movement.

5.2
According to the results of simulations that we ran based on data collected during the 2002-2003 SARS outbreaks in Singapore, Taipei, and Toronto, we suggest that this model can be applied to different infection scenarios and used to simulate the development of epidemics with considerable accuracy. A comparison of simulation and real-world data indicate that our model can be used to test epidemic report systems and to identify the best public health policy suites for specific scenarios. The simulation results also indicate considerable flexibility in the model - that is, we believe it can be applied to a wide range of contagious diseases (e.g., influenza, enteroviruses, and HIV/AIDS) that have well-defined epidemic parameters.

* References

AHMED E and Agiza H N (1998) On modeling epidemics. Including latency, incubation and variable susceptibility. Physica A, 253, pp. 347-352.

AHMED E and Elgazzar A S (2001) On some applications of cellular automata. Physica A, 296, pp. 529-538.

ANAND K, Ziebuhr J, Wadhwani P, Mesters J R, and Hilgenfeld R (2003) Coronavirus Main Proteinase (3CLpro) Structure: Basis for Design of Anti-SARS Drugs. Science, 300(5626), pp. 1763-1767.

ANDERSON R M and May R M (1982) Directly transmitted infectious diseases: control by vaccination. Science 215(4536), pp. 1053-1060.

BENYOUSSEF A, Hafidallah N E, Elkenz A, Ez-Zahraouy H, and Loulidi M (2003) Dynamics of HIV infection on 2D cellular automata. Physica A, 322, pp. 506-520.

BOCCARA N and Cheong K (1992) Automata network SIR models for the spread of infectious disease in populations of moving individuals. Journal of Physics A, 25, pp. 2447-2461.

BOCCARA N and Cheong K (1993) Critical-behavior of a probabilistic-automata network SIS model for the spread of an infectious-disease in a population of moving individuals. Journal of Physics A, 26, pp. 3707-3717.

BOCCARA N, Goles E, Martinez S, and Picco P (1993) Cellular Automata and Cooperative Phenomena. Kluwer Academic Publisher, Boston.

BOCCARA N, Cheong K, and Oram M (1994) A probabilistic automata network epidemic model with births and deaths exhibiting cyclic behavior. Journal of Physics A, 27, pp. 1585-1597.

CDC (CENTERS FOR DISEASE CONTROL) (2003a) SARS: Frequently asked questions, http://www.cdc.gov/ncidod/sars/faq.htm.

CDC (CENTERS FOR DISEASE CONTROL) (2003b) Update: SARS --- Singapore, MMWR, 52(18), pp. 405-411.

CDC (CENTERS FOR DISEASE CONTROL) (2003c) Cluster of SARS Cases Among Protected Health-Care Workers-Toronto, Canada, MMWR, 52(19), pp. 433-436.

CDC (CENTERS FOR DISEASE CONTROL) (2003d) SARS --- Taiwan, MMWR, 52(20), pp. 461-466.

CDC (CENTERS FOR DISEASE CONTROL) (2003e) Update: SARS --- Toronto, Canada, MMWR, 52(23), pp. 547-550.

CDC (CENTERS FOR DISEASE CONTROL) (2003f) Update: SARS --- Worldwide and U.S., MMWR, 52(28), pp. 664-665.

CDC (CENTERS FOR DISEASE CONTROL) (2003g) Use of Quarantine to Prevent Transmission of SARS---Taiwan, MMWR, 52(29), pp. 680-683.

CDC (CENTERS FOR DISEASE CONTROL) (2003h) Revised U.S. Surveillance Case Definition for Severe Acute Respiratory Syndrome (SARS) and Update on SARS Cases --- United States and Worldwide, MMWR, 52(49), pp. 1202-1206.

CHOWELL G, Fenimore P W, Castillo-Garsow M A, and Castillo-Chavez (2003) SARS outbreaks in Ontario, Hong Kong and Singapore: the role of diagnosis and isolation as a control mechanism. Journal of Theoretical Biology, 224(1), pp. 1-8.

DONNELLY C A, Ghani A C, Leung G M, Hedley A J, Fraser C, and Riley S (2003) Epidemiological determinants of spread of causal agent of severe acute respiratory syndrome in Hong Kong. Lancet, 361(9371), pp. 1761-1766.

DYE C and Gay N (2003) EPIDEMIOLOGY: Modeling the SARS Epidemic. Science, 300(5627), pp. 1884-1885.

EDELETEIN-KESHET L (1988) Mathematical Models in Biology. Random House, New York.

EGUILUZ V M and Klemm K (2002) Epidemic threshold in structured scale-free networks. Physical Review Letters, 89(10), 108701.

ENSERINK M (2003) SARS IN CHINA: The Big Question Now: Will It Be Back? Science, 301(5631), pp. 299.

FUENTES M A and Kuperman M N (1999) Cellular automata and epidemiological models with spatial dependence. Physica A, 267, pp. 471-486.

GUAN Y, Zheng B J, He Y Q, Liu X L, Zhuang Z X, Cheung C L, Luo S W, Li P H, Zhang L J, Guan Y J, Butt K M, Wong K L, Chan K W, Lim W, Shortridge K F, Yuen K Y, Peiris J S M and Poon L L M (2003) Isolation and Characterization of Viruses Related to the SARS Coronavirus from Animals in Southern China. Science, 302(5643), pp. 276-278.

KEELING M J (1999) The effects of local spatial structure on epidemiological invasions. Proceedings of the Royal Society of London, 266, pp. 859-867.

KERMACK W O and McKendrick A G (1927) Contributions to the mathematical theory of epidemics. Proceedings of the Royal Society of London, pp. 700-721.

KLECZKOWSKI A and Grenfell B T (1999) Mean-field-type equations for spread of epidemics: the 'small world' model. Physica A, 274, pp. 355-360.

KUPERMAN M and Abramson G (2001) Small World Effect in an Epidemiological Model. Physical Review Letters, 86(13), pp. 2909-2912.

LIPSITCH M, Cohen T, Cooper B, Robins J M, Ma S, James L, Gopalakrishna G, Chew S K, Tan C C, Samore M H, Fisman D, and Murray M (2003) Transmission Dynamics and Control of Severe Acute Respiratory Syndrome. Science, 300(5627), pp. 1966-1970.

MARRA M A, Jones S J M, Astell C R, Holt R A, Brooks-Wilson A, Butterfield Y S N, Khattra J, Asano J K, Barber S A, Chan S Y, Cloutier A, Coughlin S M, Freeman D, Girn N, Griffith O L, Leach S R, Mayo M, Mcdonald H, Montgomery S B, Pandoh P K, Petrescu A S, Robertson A G, Schein J E, Siddiqui A, Smailus D E, Stott J M, Yang G S, Plummer F, Andonov A, Artsob H, Bastien N, Bernard K, Booth T F, Bowness D, Czub M, Drebot M, Fernando L, Flick R, Garbutt M, Gray M, Grolla A, Jones S, Feldmann H, Meyers A, Kabani A, Li Y, Normand S, Stroher U, Tipples G A, Tyler S, Vogrig R, Ward D, Watson B, Brunham R C, Krajden M, Petric M, Skowronski D M, Upton C, and Roper R L (2003) The Genome Sequence of the SARS-Associated Coronavirus. Science, 300(5624), pp. 1399-1404.

MARTINS M L, Ceotto G, Alves S G, Bufon C C B, Silva J M, and Laranjeira F F (2001) A cellular automata model for citrus variegated chlorosis. Physica A, 295, pp. 42-48.

MILGRAM S (1967) The small world problem. Psychology Today, 2, pp. 60-67.

MIRAMONTES O and Luque B (2002) Dynamical small-world behavior in an epidemical model of mobile individuals. Physica D, 168-169, pp. 379-385.

MOORE C and Newman M E J (2000) Epidemics and percolation in small-world networks. Physical Review E, 61(5 Pt B), pp. 5678-5682.

MORENO Y, Pastor-Satorras R, and Vespignani A (2002) Epidemic outbreaks in complex heterogeneous networks. European Physical Journal B, 26(4), pp. 521-529.

NEWMAN M E J (2000) Models of the Small World: A Review. Journal of Statistical Physics, 101, pp. 819-841.

NEWMAN M E J (2002) Spread of epidemic disease on networks. Physical Review E, 66 (1 Pt 2). 016128.

NEWMAN M E J, Jensen I, and Ziff R M (2002) Percolation and epidemics in a two-dimensional small world. Physical Review E, 65 (2 Pt 1), 021904.

NG T W, Turinici G, and Danchin A (2003) A double epidemic model for the SARS propagation. BMC Infectious Disease, 3(19), pp. 1-16.

NISHIURA H, Patanarapelert K, Sriprom M, Sarakorn W, Sriyab S, and Ming T I (2004) Modelling potential responses to severe acute respiratory syndrome in Japan: the role of initial attack size, precaution, and quarantine. Journal of Epidemiology and Community Health, 58(3), pp. 186-191.

PEIRIS J S, Lai S T, Poon L L, Guan Y, Yam L Y, Lim W, Nicholls J, Yee W K, Yan W W, Cheung M T, Cheng V C, Chan K H, Tsang D N, Yung R W, Ng T K, Yuen K Y, and SARS Study Group (2003) Coronavirus as a possible cause of severe acute respiratory syndrome. Lancet, 361(9366), pp. 1319-1325.

RILEY S, Fraser C, Donnelly C A, Ghani A C, Abu-Raddad L J, Hedley A J, Leung G M, Ho L M, Lam T H, Thach T Q, Chau P, Chan K P, Lo S V, Leung P Y, Tsang T, Ho W, Lee K H, Lau E M, Ferguson N M, and Anderson R M (2003) Transmission Dynamics of the Etiological Agent of SARS in Hong Kong: Impact of Public Health Interventions. Science, 300(5627), pp. 1961-1966.

ROTA P A, Oberste M S, Monroe S S, Nix W A, Campagnoli R, Icenogle J P, Penaranda S, Bankamp B, Maher K, Cher M H, Tong S, Tamin A, Lowe L, Frace M, Derisi J L, Chen Q, Wang D, Erdman D D, Peter T C T, Burns C, Ksiazek T G, Rollin P E, Sanchez A, Liffick S, Holloway B, Limor J, Mccaustland K, Olsen-Rasmussen M, Fouchier R, Gunther S, Osterhaus A D M E, Drosten C, Pallansch M A, Anderson L J, and Bellini W J (2003) Characterization of a Novel Coronavirus Associated with Severe Acute Respiratory Syndrome. Science, 300(5624), pp. 1394-1399.

SEBASTIAN B and Hoffmann C (2003) SARS Reference. Flying Publisher.

SIRAKOULIS G C H, Karafyllidis I, and Thanailakis A (2000) A cellular automaton model for the effects of population movement and vaccination on epidemic propagation. Ecological Model, 133, pp. 209-223.

WANG X F and Chen G (2003) Complex Networks: Small-World, Scale-Free and beyond. IEEE Circuits and Systems Magazine, First Quarter, pp. 6-20.

WATTS D J and Strogatz S H (1998a) Collective dynamics of 'small-world' networks. Nature, 393(6684), pp. 440-442.

WATTS D J (1998b) Small Worlds: The Dynamics of Networks between Order and Randomness. Princeton University Press, Princeton, NJ.

WHO (WORLD HEALTH ORGANIZATION) (2003) Consensus document on the epidemiology of severe acute respiratory syndrome (SARS), http://www.who.int/csr/sars/en/WHOconsensus.pdf.

----

ButtonReturn to Contents of this issue

© Copyright Journal of Artificial Societies and Social Simulation, [2004]