©Copyright JASSS

JASSS logo ----

Rob Koper (2005)

Increasing Learner Retention in a Simulated Learning Network Using Indirect Social Interaction

Journal of Artificial Societies and Social Simulation vol. 8, no. 2
<https://www.jasss.org/8/2/5.html>

To cite articles published in the Journal of Artificial Societies and Social Simulation, reference the above information and include paragraph numbers if necessary

Received: 31-Oct-2004    Accepted: 21-Feb-2005    Published: 31-Mar-2005


* Abstract

A learning network is a network of persons who create, share, support and study units of learning (courses, workshops, lessons, etc.) in a specific knowledge domain. Such networks may consist of a large number of alternative units of learning. One of the problems learners face in a learning network is to select the most suitable path through the units of learning in order to build the required competence in an effective and efficient way. This study explored the use of indirect social interaction to solve this problem. Units of learning that have been completed successfully by other comparable learners are presented to the learners as navigational support. A learning network is simulated in which learners search for, enrol in and study units of learning, subject to a variety of constraints: a) variable quality of the different units of learning, b) disturbance, i.e. interference by priorities other than learning and c) matching errors that occur when the entry requirements of the selected unit of learning do not align with the pre-knowledge of the learner. Two conditions are explored in the network: the selection of units of learning with and without indirect social interaction. It was found that indirect social interaction increases the proportion of learners who attain their required competence in the simulated learning network.

Keywords:
Self-Organisation, Education, Distance Learning, Lifelong Learning, Learning Network

* Introduction

1.1
One of the aims of using Internet technologies in education and training is to develop more flexible, adaptable and interoperable units of learning than are currently available. A 'unit of learning' (UOL) is an abstract term used to refer to any designed set of learning activities, like a lesson, course, workshop, conference and a seminar. A UOL consists of a learning design method and the learning objects and services that are referenced in the learning design (see Koper and Olivier 2004).

1.2
By using technologies, learners will be able to access UOLs anywhere, at any time and from a large variety of suppliers. Schools, universities and companies are already providing more and more courses, workshops and other learning resources via the Internet. Learners themselves can even create and share small UOLs or underlying learning resources. In principle, all these resources (called 'units of learning', UOLs) can be found using Internet search engines, but regardless of the knowledge domain, such search engines will turn up large numbers of more and less adequate results, causing selection problems for learners. Furthermore, when a students enrols in an Internet course with provider X and later takes another course with provider Y, there is little continuity: assessment results are not carried over, the social environment is different, and there is no learner support beyond what the individual institution has to offer.

1.3
Learners searching for learning resources will have two basic questions: Given my current knowledge and competences, and given my personal characteristics, preferences and circumstances:
  1. When I want to learn more about topic X, or want to build up more competence in domain X, what UOLs can I study best and in what order?
  2. I have recently finished studying UOLs [X, Y, Z]. What unit or units of learning, or set of UOLs, are suitable to continue my studies?

1.4
The answers to these questions are currently provided within the context of a single educational or training institute. Students typically select the most adequate institute and the student services or the curriculum within that institute provides the answers. However, Internet technologies essentially offer an additional, broader context in which learners can review what multiple providers have on offer on the Internet to select the best possible solution at a particular point in their lives. This includes the possibility of communicating and sharing resources with other people who are interested in the same subject. We refer to a group of persons who create, share, support and study a distributed set of UOLs in a specific knowledge domain as a Learning Network or LN (Koper and Sloep 2003; Koper et al. in press). Such networks, implemented as a set of Internet services, support seamless, widespread access to learning facilities at work, at home and in schools and universities. The use of the Internet for learning implies the development of new ways of organising learning facilities that go beyond course, programme, and institution-centric models and envisage a learner-centred, learner-controlled model of distributed lifelong learning.

1.5
An LN is more than just a searchable collection of UOLs. It should also have an organisation that controls the network's behaviour with respect to: access, quality, community policies, learner data, interoperability standards, and so on. In small networks, this organisation can be controlled by the management of an institute, but in larger multi-institutional and international networks it is more likely that these systems are self-organised. A self-organised system acts without centralised control. Di Marzo Serugendo et al. (2003) define self-organisation as the mechanism that controls the structure of a system or its organisation through the internal, local interactions between its components. These interactions give rise to properties that transcend those of the individual components in the system. Well-known examples can be found in social insect studies, for example the foraging behaviour of ants or their ability to sort eggs without any ant knowing the sorting algorithm (Deneubourg et al. 1991). The basic principle underlying this behaviour is called indirect social interaction or 'stigmercy' in biology (Grassé 1959; Theraulaz and Bonabeau 1999). The theory of stigmercy describes the use of asynchronous communication between actors mediated by environmental changes. Ants, for instance, use a chemical substance called pheromones to leave trails in the environment from their nest to a food source. This mechanism is a critical aspect of this study, and will be explained in more detail in the next section.

1.6
The objective of the research described in this paper was to explore how we can use the principles of indirect social interaction to help lifelong learners navigate in a learning network with multiple providers of UOLs. A simulation study was conducted in which the learning network was modelled, including a mechanism to provide learners with advice based on indirect social interaction. The focus of the advice was on the first question posed earlier: "When I want to learn more about topic X, or want to build up more competence in domain X, what UOLs can I study best and in what order?".

1.7
The hypothesis was that introducing an indirect social interaction mechanism to support the selection of suitable UOLs will increase the proportion of learners who attain their study target in a learning network for lifelong learning.

The idea is that indirect social interaction will advise learners to select a path that has been shown to be effective. This is particularly significant when learners must choose between different alternative paths in the network, all leading to the same targets, but having different chances of success. Through indirect social interaction, the path that the learners ultimately follow is expected to converge with the path that offers them the greatest chance of success.

1.8
We will begin by discussing the basic concepts of the conceptual model for the simulation in more detail: the principles of lifelong learning, the representation of a learning network, the principles of self-organisation and indirect social interaction, and the basic model for target attainment and dropping out in a learning network. We follow this discussion with a description of how the model was implemented in the simulation package. Finally, we conclude by presenting and discussing the results of the simulation runs.

* Model

Lifelong learning

2.1
Lifelong learning is defined as the activities people perform throughout their life to improve their knowledge, skills and competence in a particular field, given some personal, societal or employment related motives (Griffin 1999; Aspin and Chapman 2000; Field 2001).

2.2
There are several specific characteristics of lifelong learning that have to be taken into account when developing LNs (see Koper and Tattersall 2004). The major characteristics of lifelong learning are already contained in the phrase itself: it is "lifelong" (from cradle to grave) and puts "learning" (and not instruction) centre-stage. Knowledge and competences grow during one's life in different fields, and learning facilities should offer the possibility of supporting the lifelong building of knowledge and competences at different levels of proficiency in a given field. There are several implications that can be summarised as follows.

2.3
First of all, putting the learner centre-stage means that the learner-and not a teacher or an institute-is responsible for his/her own learning processes (see also Shuell 1992; Longworth 2003). Lifelong learners are self-directed (Brockett and Hiemstra 1991; Candy 1991), and can perform different learning activities in different contexts at the same time. For learners to be self-directed, they must be in a position to oversee what is available and determine how this matches their needs, preferences, prior knowledge and current situation. One of the basic requirements is to be able to search for adequate UOLs and to plan suitable learning paths through these UOLs.

2.4
Secondly, learners are typically engaged in a variety of formal and informal learning activities during their lifetime. This implies that the task of providing lifelong learning facilities cannot be entrusted to a single institute, but has to be seen as the collection of UOLs provided worldwide by different providers in a specific field and over time. However, lifelong learners need a single point of mobile access to distributed information about the UOLs on offer, and - to avoid overload - they should receive help in selecting the most suitable solution, given their needs, prior knowledge and current situation. Ideally, information about learning facilities should be amenable to digital processing, thereby facilitating Learning Brokerages (Hämäläinen et al. 1996) able to mediate between learners and learning providers to identify the most appropriate steps to be taken at any point in the learner's lifetime.

2.5
Thirdly, the participants in an LN in any given field have different levels of competence, varying from novice to top expert, and from practitioner to researcher and developer. Traditionally, the heterogeneity of the student body has been reduced as far as possible by providing clear entry requirements and using cohorts of groups that are considered homogeneous. Lifelong learning opens the door to exploiting the heterogeneity of learners by setting up learning communities in which novices collaborate with more experienced people. An approach of this kind is described by Lave and Wenger (1991); in their description, novices are positioned in a more peripheral role and experts in a more central role when they solve a problem jointly.

2.6
Fourthly, it is necessary to maintain a consistent, standard record of an individual's growth in competence in order to ensure that learners can search for new learning facilities that match and extend their current knowledge. One approach that is currently the subject of great interest is the definition and use of portable digital portfolios. These portfolios are owned by the learners themselves and are used and updated over a lifetime, across informal and formal education and training (Treuer and Jenson 2003; Mason 2004).

Representation of a Learning Network

2.7
An LN can be modelled as a two-mode graph with the node types 'participant' and 'UOLs'. (note: these are actually runs of the UOLs, also called Activity Nodes). The participants are persons who can have a variety of roles in the LN, for example learner, provider, teacher, assessor, tutor, mentor, etc. Participants who study UOLs are called learners. The UOLs can be any resource or event that will help them to learn something in the given knowledge domain. Examples are courses, web logs, workshops, websites, conferences, and discussions in the given domain. Any participant can create new UOLs, can search and select UOLs or can study UOLs.

2.8
When using the LN, learners travel from UOL to UOL. The path of UOLs completed sequentially over time by an individual learner is called a learning track. A track represents the actual behaviour of learners. Paths through a Learning Network that are planned beforehand are called routes. In traditional education, teachers or instructional designers are responsible for this route planning (e.g., curriculum planning). Lifelong learning may, however, involve a different approach. Learning tracks can be shared between the learners in an LN. This can be a single track or an analysis of the aggregated, collective tracks of a set of learners to determine the most successful routes. This data is expected to help learners 'navigate' in the LN and is a form of indirect social interaction.

2.9
Another concept in an LN is the learner's position in the LN (in Figure 1, the set {a4, a8, a10}). This is defined as the set of UOLs marked as completed in the LN, based on the actor's portfolio. The learner may not necessarily have completed the UOLs specified; he or she may have already met the objectives associated with the UOLs in some other way (e.g., as a result of exemptions arising from previous study or work experience).

Figure
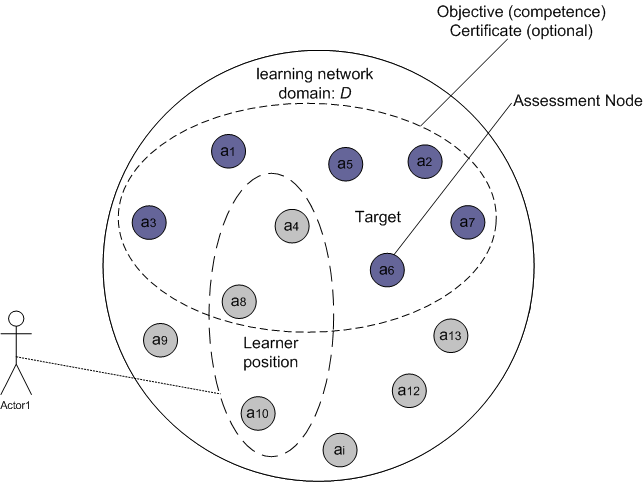
Figure 1. Position and Target in an LN

2.10
A target is any set of UOLs that takes the learner to a particular level of competence or expertise in the domain (in Figure 1 the set {a1, ..., a8}). These targets and connected competence levels may be self-defined (e.g., step-by-step) or may be predefined in the network.

2.11
A target can be associated with one or more formal assessments to certify knowledge or a competence. This can either involve an additional, specific kind of UOL, or it can be integrated into one or more UOLs. The discrepancy between the set of target nodes and the set of position nodes defines the set of UOLs that a learner has to complete to reach the target. Figure 1 shows this to-do list as the set {a1, a2, a3, a5, a6, a7}. Once this list has been drawn up, a sequence of learning steps can be established by deciding on the order in which the UOLs are completed (e.g., first a3, then a1 and a5 simultaneously, then a2 and a7 simultaneously, and finally a6). This decision can be based on the tracks of other successful and comparable learners in the LN. A learner can also follow a more exploratory route or can change routes on demand. Ultimately this will also create a track that can be shared.

Self-organisation and indirect social interaction

2.12
Self-organisation relies on four basic mechanisms according to Bonabeau, Dorigo and Theraulaz (1999):
  1. Multiple interactions between the actors in the system. Self-organisation is not optimal if the learners do not interact with each other, e.g., as in a self-study system without interaction. Self-organisation is a basic requirement for the next three mechanisms.
  2. Positive feedback. These are rules that govern the creation of a structure by amplifying certain behaviours, e.g., recruitment to study a certain UOL by informing learners about the paths taken by others.
  3. Negative feedback. This feedback counterbalances the positive feedback by means of mechanisms such as the enrolment restrictions for a certain UOL.
  4. Amplification of random fluctuations. To facilitate the discovery of new solutions (e.g., new UOLs), and to prevent convergence of suboptimal solutions (so-called suboptimal convergence) when better ones are available, some randomness in the behaviour is crucial in a self-organised LN.

2.13
The interactions between the actors in a self-organised system can be direct or indirect. Direct interactions are, for instance, communication between learners as they study an UOL. Indirect interaction (stigmercy) occurs when an actor changes the environment and another actor perceives this as a signal to take some action. The principle of stigmercy can be illustrated by the example of ants in a colony interacting when foraging for food. Their interaction is based on a chemical substance called pheromones which they deposit in their environment and can be smelled by other ants. Pheromones can be aggregated (the more ants leave the substance along the same track, the stronger the signal) and can evaporate (the signal becomes weaker as time passes). The behaviour of ants while foraging for food can be described in the following way (Dorigo, Di Caro and Gambardella 1999):
  1. When there are no pheromone signals in the environment, ants follow a random path to search for food.
  2. When an ant finds a food source, it leaves a pheromone trail on its way back to the nest.
  3. When another ant smells the pheromone trail, it is highly likely that it will instinctively follow this trail (not always, however; some randomness in behaviour will still occur).
  4. On the way back from the food source to the nest, the other ants will leave a new amount of pheromone along the trail. This strengthens the signal. If the ants do not continue to refresh the pheromone trail (e.g., because the food source has been exhausted), the signal evaporates over time.
This principle can be used to inspire the setting up of a mechanism for selecting UOLs in an LN. In a mechanism of this kind, learners leave information behind in the environment about the UOLs they have completed successfully and in which order. When a new learner is deciding what UOL to select next, this information will suggest a suitable UOL. When several learners have followed the same path successfully, it is more likely that the relevant UOL will be suggested.

2.14
We specified the following requirements for the design of the indirect social interaction procedure:
  1. The procedure should prevent suboptimal convergence by allowing some randomness in the proportion of learners who follow the 'pheromone-based' advice provided.
  2. The procedure should prevent sub-optimal convergence by allowing selection of successful paths that are less frequently chosen than the most successful ones.
  3. The probability of indirect social information being available should be as large as possible. For instance, when a certain target is related to a path of 10 UOLs, and a new learner wants advice based only on the success of persons who have already completed all 10 UOLs, then there must be persons available who have already completed all 10. That is less likely than when the information is based on a set of 2 UOLs.
  4. The calculations must be as efficient as possible. Because of the large numbers of possible participants and UOLs in the network, a combinatorial explosion can occur if the calculations are not efficient.
The procedure we designed following these requirements is presented in the implementation section.

Drop-out and Motivation

2.15
The aim of this study is to increase the proportion of learners who attain their target. Stated differently: the aim is to reduce the drop-out rate. Learning Networks share common characteristics with open and flexible distance education systems that use technologies to mediate communication with learners. These institutes are known to have high drop-out rates, an issue that has been studied extensively in the past. Pythian and Clements (1982) have stated that 53% of all drop-outs are caused by an external situational disturbance, for example job changes or other social, economic or physical priorities that interfere with the student's intentions. In a study conducted by Koper (1992), this was found to be as high as around 70% for distance education settings. The model developed by Tinto (1982) is well known and focuses on the decision-making process of university students. The model states that there is a strong correlation between social and academic integration, which influences the student's commitment to the university, and that this in turn influences his or her decision to drop out or to persist. Social integration is the amount of support that a student gets from his peers, and academic integration is the student's commitment to the objectives of the study and the policies and communication within the institute.

2.16
The early drop-out models developed by Spady (1970), Tinto (1975; 1982) and Pascarella and Terenzini (1980) are all based on the average 24 year old student in residential education. As a result, these models do not make sufficient allowance for external factors that influence more flexible, lifelong learning situations.

2.17
Another more recent and competitive model explaining drop-outs in education is defined by the self-determination theory (SDT, see Ryan and Deci 2000). It centres on the concept of motivation: when a student is no longer motivated, he or she will drop out. The theory states that it is intrinsic to human nature to be motivated to learn, but that motivation can be strengthened or weakened by external factors. It is this theoretical principle that we have adopted to stand for drop-out and attainment in our simulation model: a learner has a certain amount of motivation that can be increased or decreased by certain factors. The procedure we designed is roughly the following (this will be discussed in more detail in the implementation section):

2.18
To conclude this section, it should be noted that it may be difficult to measure the drop-out rate in flexible systems. The formula is:

number of learners = number attained + number studying + number searching + number dropping out

The only known factor in most systems is the number of learners who have attained their targets (when there are official completion activities, like exams). Whether a learner is 'still studying a UOL', 'searching for a new UOL' or is a 'drop-out' is hard to determine. As a consequence, for this study we will concentrate on the proportion of learners who have attained their target by completing the necessary UOLs.

Summary of the model

2.19
Figure 2 summarises the model used in this study.

Figure
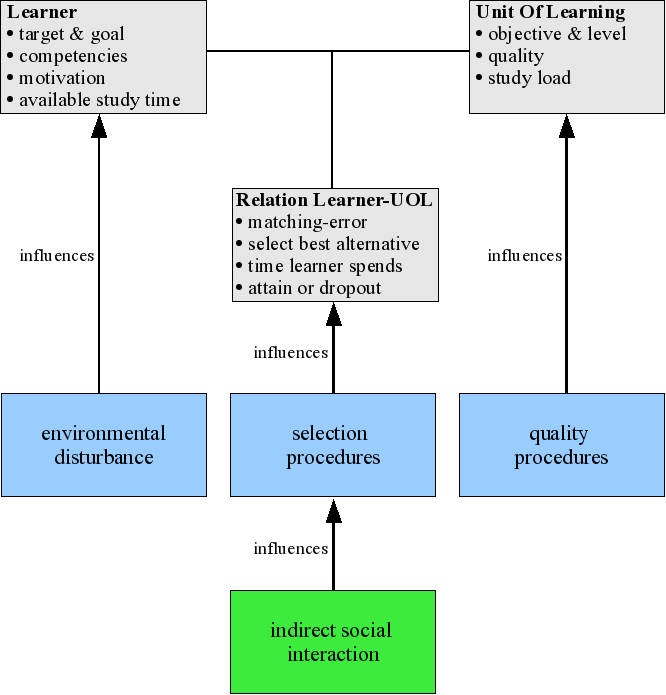
Figure 2. Summary of the model

2.20
The learner has a set of characteristics (target & goal, etc.); a UOL has a set of characteristics (objective & level, etc.), and the relationship between a learner and the selected UOL has a set of characteristics (e.g., matching error). The learner is primarily influenced by disturbance factors in the environment. The UOL is primarily influenced by the quality procedures that have been introduced to develop and run it. The relationship between the learner and the UOL is influenced by the procedure used to select a UOL that matches the competences and goal of the learner and chooses the best of the available alternatives (e.g., one of the UOLs with the highest quality). In this study we will concentrate on the role of indirect social interaction to improve the selection procedure.

* Implementation

In General

3.1
We used the Netlogo (version 2.0.1; 7 May 2004) multi-agent simulation environment developed by Wilensky (1999) to implement the Learning Network. The learners are the agents ('turtles') who are moving in an environment that consists of a variety of different UOLs ('patches', see figure 3). Several settings can be modified in the interface: the number of UOLs (0-180), the number of weeks (0-1040), the simulation runs, the mean number of learners entering the system every week (0-1000), the risk of disturbance (0-100%), the matching error (0-100%), the minimum and maximum quality of a UOL (each 0-100%), the mean weekly study time a learner has available (0- 40 hours), the study load for a UOL (0-200 hours) and the proportion of learners that will follow the advice given based on indirect social interaction (pheromone strength, 0-100%). The distributions of the random variables are chosen according to common conventions described in Law and Kelton (2000). They are not yet based on empirical data. The source of the simulation program can be found at: http://hdl.handle.net/1820/298 .

Figure
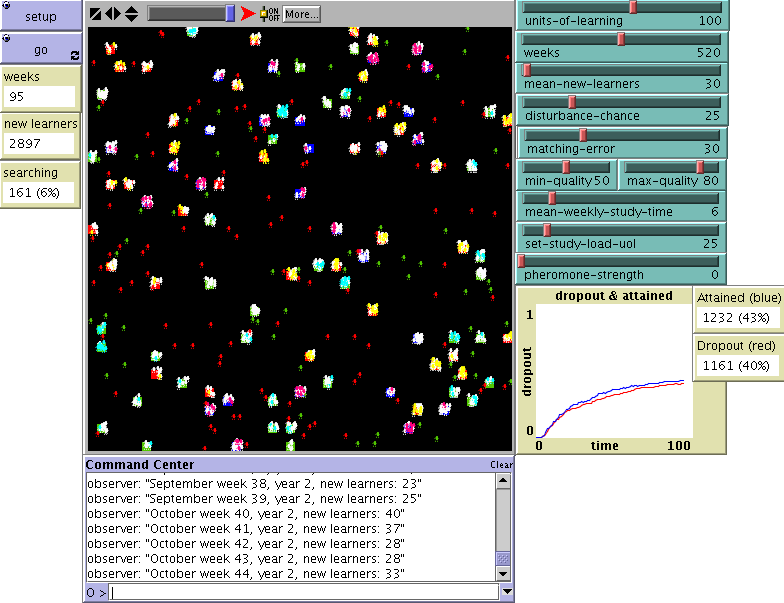
Figure 3. The interface of the model in the Netlogo environment

Setup of the model

3.2
Pressing the setup button prepares the environment:

3.3
The distributions selected are 'best guesses', based on the expected characteristics of the variable (zero, negatives included, etc.) and rules of thumb as presented in the literature (eg, Vincent 1998; Law and Kelton 2000)

Running the model

Pressing the go button starts up the simulation:

Implementation of Indirect Social Interactions: the pheromone strength

3.4
Indirect social interactions can be set using the 'pheromone-strength' slider (0-100%). When set to 0%, there is no indirect social interaction in the system. When set to any other percentage (e.g., 80%), the learner will be given advice when it is available, but the probability that he or she will follow the advice is set to the same percentage (in this case 80%). The type of advice given answers the first learner question 'When I want to learn more about topic X, or want to build more competence in domain X, what UOLs can I study best and in what order?'. The answers to this question are given one by one in the procedure, i.e. when the learner completes a UOL, he or she is advised on the best UOL to take next in order to attain the target, and so on.

3.5
The procedure is designed to meet the requirements stated earlier, and follows the same four steps that we have used to describe the foraging behaviour of ants:
  1. When no 'pheromone' information is available in the environment to support the selection of UOLs, learners have to select UOLs in the regular way. A regular search is based on the meta-information given by the providers of the UOL (e.g., about the objectives, prerequisites, setting), and the assumed match between a) the learner's goal and the learning objective of the UOL, and b) the entry requirements of the UOL and the learners' prerequisites. Note that the information about UOLs, as given by the providers, can contain errors (low quality courses are presented as high quality courses or the prerequisites are not stated explicitly) and the information can be wrongly interpreted by the learner. Furthermore, the learner can make mistakes when assessing his own pre-knowledge. These errors create matching errors. In an earlier study (Koper 1992), we found a relationship between matching errors and drop-out behaviour among open university students: matching errors are correlated to drop-out rates (a better match decreases the drop-out rate by between 17% and 21% in open distance education).
  2. When a learner completes a UOL, this information is stored in a personal portfolio. After having completed one or more UOLs, the portfolio will contain a list of the identifiers of UOLs that the learner has completed successfully. The list is sorted according to the sequence of completion. The portfolio lists hold the actual pheromone trail information that can be read and used by the mechanism which provides advice to individual learners. For instance: when person A has portfolio [A,B,C,D,E] and person B has portfolio [A,B], the advice for person B may be to enrol in UOL C. Using information in this way is comparable to recommender systems such as that used by amazon.com ('Customers who bought this item also bought:'). The major difference is that the information on books is based on ordering behaviour, whereas the information in a learning network will not be based on enrolment ('people who enrolled for this course also enrolled for the following courses:'), but on the successful completion of UOLs.
  3. When pheromone information is available in the environment, meaning that others with the same target have completed at least one more UOL, the learner will receive advice according to the following procedure. First a list (called nextAN) is drawn up of all the UOLs that follow sequentially after the current completed UOL in the portfolios of all learners who have completed the same UOL and at least one more since then. For instance, learner-to-be-advised has portfolio [B], and there are six other learners in the system who have completed B (share same position), but have also completed at least one more UOL. The six have the following portfolios: [A,B,C] [B,C] [B,D] [B,E] [B,D,E,F] [A,B,C]. The nextAN list is then [C, C, D, E, D, C]. To create the advice, precisely one item is randomly selected from this list. The result is that the most frequently followed path (B-C) has a higher probability of being selected. There is a chance that the other paths (B-D and B-E) will be selected, to prevent suboptimal convergence to the path (B-C). Note that the procedure includes two types of randomness (the first two requirements for the procedure): first, the variable likelihood that the advice will be followed by the learner, and second, the random selection of a successful path when there is more than one alternative (with the most frequently followed paths having the greatest chance of being selected). In this case, the learner is advised to enrol in UOLs that have been successfully completed by other learners who share the same position. In order to meet the third requirement for the design of the procedure ('large probability of pheromone info being available'), we must look carefully at the number of UOLs selected to represent the current position of the learner. We decided to use only the most recently completed UOL to represent the position of the learner to meet the third requirement. The more UOLs are taken into account, the better we expect the advice to be, but the smaller the chance that the learner will in fact find any advice. This also meets the fourth requirement (computational efficiency).
  4. Other learners who follow the same path successfully will increase the strength of the trail for those who follow because the path will show up more frequently on the nextAN list. When learners cease following the path, its relative importance will slowly evaporate, i.e. the relative likelihood that it will be selected decreases. In this model, we did not put limits on UOLs (e.g., only 20 learners may enrol) or on their availability (e.g., a one-off course). When such restrictions occur, the nextAN must be adjusted by deleting all the UOLs that are not or no longer available.

* Experiment

4.1
To explore the effects of indirect social interactions (pheromone-strength) on the percentage of learners who attain their targets (attained proportion), we conducted a series of simulation runs in a 24 factorial design. The dependent variable is the attained proportion, and the factors are: matching-error, min-quality, disturbance-chance, and pheromone-strength. The selected factor levels are the following: matching error (0% and 100%), min-quality (0% and 100%; max-quality is always set to 100%), and disturbance (0% and 100%).

4.2
According to Law and Kelton (2000, pp. 496), a simulation study is a computer-based statistical sampling instrument in which the output processes are almost always non-stationary and auto-correlated. This means that classic statistical techniques that are based on Independent and Identically Distributed (IID) observations are not directly applicable. Correcting this problem involves applying the principle of independence across runs. This means that the N in a simulation study is not the number of cases in a single run, but the number of replications of the same simulation. It also implies that the seed of the random number must vary per run and is not fixed, as is usual in some approaches intended to reduce variance.

4.3
Given this principle, we decided to replicate every condition 12 times (N = 12 per condition). Furthermore, we decided to use a warm-up period to simulate 260 simulated weeks (5 years) and use the values of the 260th week to create the distributions for the attained proportion. Longer than 5 years would be a period that is hard to look over in education. The settings selected to run the experiment were the following:

Settings in user interface:
Units of learning: 100
Weeks: 1040 (the number of 260 weeks, is controlled automatically; this setting only prevents early termination).
Mean-new-learners: 10
Mean-weekly-study-time: 6
Max-quality: 100
Study-load-uol: 25
Vary variables in experiment:
matching-error: values 0 and 100
min-AN-quality: values 0 and 100
disturbance-chance: values 0 and 100
pheromone-strength: values 0 and 100
replications: values 1, 2, 3, ... , 12
Set up model with these commands:
setup
Step model with these commands:
go
Stop after this many steps:
260

Data analysis was performed with SAS JMP 5.1. All systems ran under the Linux operating system.

4.4
Table 1 provides the exploratory outcome after analysing the full factorial design (using the Standard Least Squares analysis) in order to investigate the effect size of the different factors.

Figure
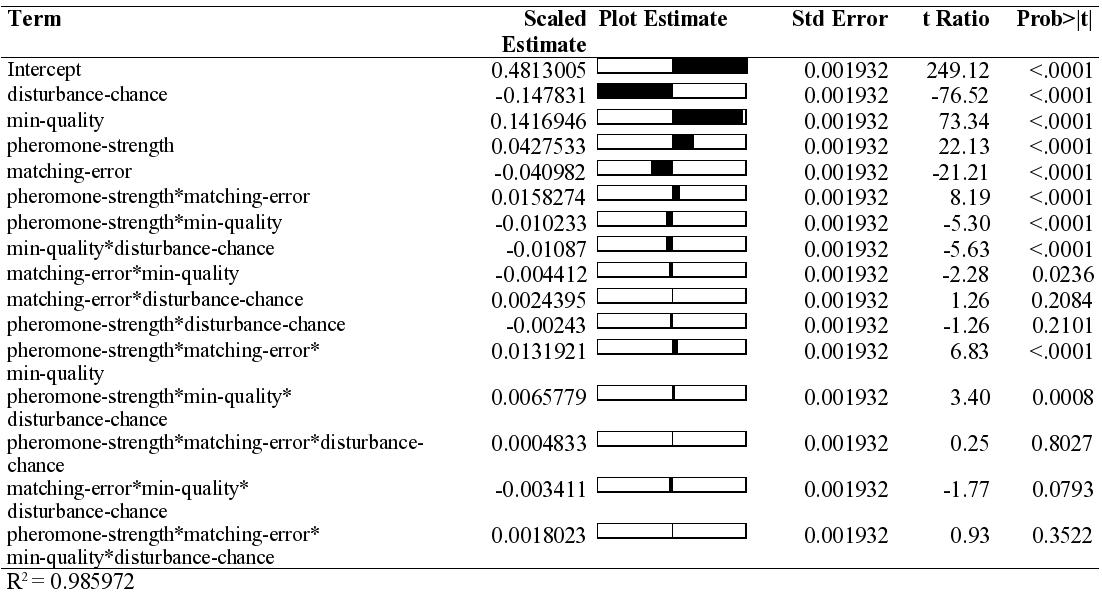
Table 1. Scaled estimates for full factorial model, factors centred by mean, scaled by range/2.

4.5
When the scaled estimates are considered, the largest effects (all factors with p < 0.0001) are disturbance-chance (-0.15), min-quality (0.14), pheromone-strength (0.04), matching-error (-.04), and the interactions: pheromone-strength × matching-error (0.02), pheromone-strength*min-quality (-0.01), and min-quality*disturbance-chance (-0.01).

4.6
Figure 4 examines the interactions more closely.

Figure
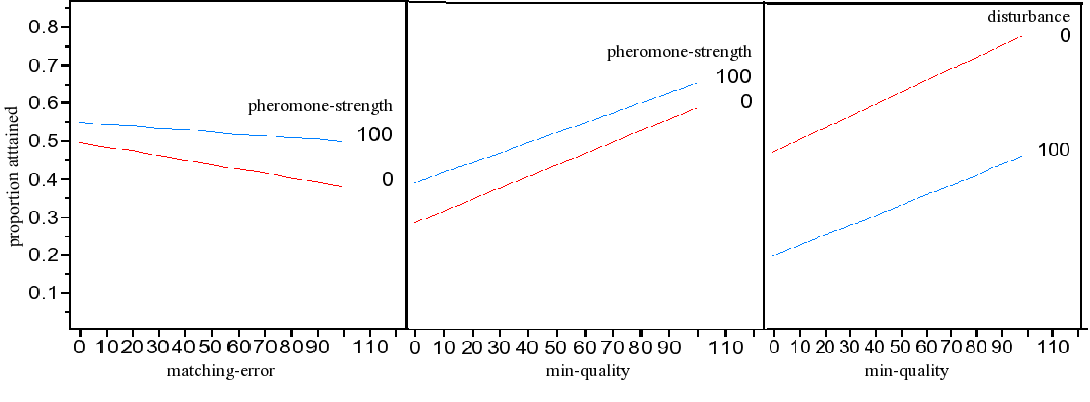
Figure 4. The interactions in the model

4.7
Table 2 shows the attained proportion for the three interactions.

Table 2: Attained proportion for the interaction effects

Pheromone- strengthmatching-error min-quality
01000100
10055%50%39%66%
050%38%29%59%
difference5%12%10%7%


disturbance
min-quality
0100
10020%46%
048%78%
-28%-32%

4.8
Figure 4 and Table 1 show that the main effects matching-error and min-quality are modified by pheromone-strength, and that the main effect of min-quality is modified by disturbance. There is a small difference in the attained proportion when pheromones are, or are not provided if there are no matching errors (5%). However, when there are matching errors, pheromones increase the attained proportion by 12%. The table also shows that, in this case, the use of pheromones compensates for the matching errors (see the two 50% scores).

4.9
In this study we are interested in the effects of pheromone strength on the attained proportion. The most logical and parsimonious model would be one that includes only a) the significant effects, b) the two-, three- and four-way effects that include pheromone strength and c) the interaction effect, for which all the underlying pairs of effects are also significant. Applying these rules to the findings of table 1 results in a model with 6 effects (table 3).

Table 3: The reduced model with 6 effects

Analysis of Variance
SourceDFSum of SquaresMean SquareF Ratio
Model68.79244021.465411359.179
Error1850.19945880.00108Prob > F
C. Total1918.9918991 <.0001
R2= 0.977818


Parameter Estimates
TermEstimateStd Errort RatioProb > t
Intercept0.48566550.00529991.66<.0001
matching-error-0.000820.000047-17.29<.0001
min-quality0.00283390.00004759.79<.0001
disturbance-chance-0.0029570.000047-62.38<.0001
pheromone-strength0.00085510.00004718.04<.0001
pheromone-strength × min-quality-0.0000049.479e-7-4.32<.0001
pheromone-strength × matching-error0.00000639.479e-76.68<.0001

4.10
The results show that the model still explains a large proportion of variance (97.7%). The main regression effect of pheromone strength on the attained proportion is provided by the formula: percentage attained = 43.9 + 0.09 × pheromone-strength (p<0.006). this formula indicates that the overall attained proportion without the use of pheromones is 43.9% in the given system configuration, and the overall improvement is 9% when pheromones are provided and the advice is always followed by the learners.

4.11
The correlation between the attained proportion and the drop-out proportion is 0.9922 (p<0.00001). the model presented for the attained proportion is similar to the model for the drop-out proportion.

4.12
The data presented tested the model by comparing the attained proportion for precisely 260 weeks. To get an idea of the dynamic changes in the attained proportion over time, figure 5 presents the attained proportion and the drop-out proportion across 520 weeks in different system configurations.

Figure

A. Settings in user interface:Factor settings:
units of learning: 100
weeks: 520
mean-new-learners: 6
mean-weekly-study-time: 6
study-load-uol: 25disturbance-chance: 100
matching-error: 100
min-AN-quality: 0
max-quality: 100
pheromone-strength: 0
note: these settings represent the worst-case scenario

Figure

A. Settings in user interface:Factor settings:
See previous settings. disturbance-chance: 100
matching-error: 100
min-AN-quality: 0
max-quality: 100
pheromone-strength: 100
note: these settings represent the influence of pheromones in the worst-case scenario

Figure

A. Settings in user interface:Factor settings:
See previous settings. isturbance-chance: 0
matching-error: 0
min-AN-quality: 100
max-quality: 100
pheromone-strength: 0
note: these settings represent the best-case scenario

Figure 5. Drop-out and attained proportions over 520 weeks, different settings

When comparing figure 5A with 5B, we seen that the influence of pheromones on the attained proportion continues to increase after the 260 weeks selected to compare the conditions in this study. The model itself is not expected to be influenced; however, estimates of the effect on the attained proportion depend largely on the timeframe in which the pheromones work.

* Discussion

5.1
The purpose of the simulation program was to explore the effects of indirect social interaction in order to help lifelong learners navigate in a learning network (LN). The first challenge was to create a model of an LN that could be implemented in the form of a simulation program. The basic structure was inspired by the theories presented, but at a more detailed level we were forced to make many arbitrary choices, as we were modelling a future system with no empirical data available as yet. Besides exploring the effects of indirect social interaction, then, the study helped us to operationalise the theory of LNs in very concrete terms. This effect has been discussed in the literature as one of the major advantages of simulation studies (see e.g., Gilbert and Troitzsch 1999; Lomi and Larsen 2001). There is one further advantage in this particular case: we are developing new technologies, and the simulation study can help us to define the requirements of these technologies before embarking on the costly process of development, implementation, testing and revision.

5.2
The outcome of this study showed that, given the settings selected, the matching procedure based on indirect social interaction increased the overall percentage of learners that attain their learning objectives in the simulated LN (the attained proportion) by 9%. When there are major matching errors in the LN, the increase is 12%. When there is a large variance in the quality of the UOLs (between 0% and 100%), then the pheromone condition increases the attained proportion to 10%. This confirms the hypothesis stated in the introduction.

5.3
The effects on the attained proportion are (in order of importance): disturbance-chance, min-quality, pheromone-strength, matching-error, and the interactions pheromone-strength × matching-error and pheromone-strength-min-quality. This leads us to make the following recommendations for the design of LNs that use settings similar to the one explored in the simulation:

5.4
The study presented our first exploratory research on indirect social interactions within the context of learning networks. The simulation program can be extended in future in the following ways:

5.5
Besides the limitations mentioned, the mechanisms that are currently implemented must be further explored in greater depth and improved where possible. The most important mechanism is the procedure that we used to provide for indirect social interactions. Are there better procedures? Can we implement it differently? Does the procedure produce any negative side effects (e.g., in the composition of the portfolio, in the structure or the composition of the LN, etc.)? One specific issue is whether the convergence effect produces side effects when it comes to providing support for the units of learning. Typically, this will result in some UOLs having a large enrolment of learners and others having a very small enrolment. This has consequences for the support infrastructure associated with each UOL in the LN. Another issue is the implementation of the nextAN list. Currently this list is based on the information stored in the portfolios of learners. Another possibility would be to store the data in the UOLs, e.g. when a learner completes a UOL, information is left about previous successfully completed UOLs. This principle is more consistent with the theory of stigmercy (an agent changes its environment, cq a learner changes the UOL).

5.6
Another future issue is that a variety of sensitivity analysis has to be performed to detect whether the model is robust enough to cope with changes in certain settings, e.g. the distribution of random variables or the settings in the user interface. More detailed analysis can be performed, based on comparisons of the attained proportion over time. Although many questions remain, the outcomes of this study are promising enough to justify further research in this area.

* Acknowledgements

The author would like to thank the management and staff of the Schloss Dagstuhl International Conference and Research Center for Computer Science for providing a pleasant, stimulating and well-organised environment in which to write this article.

* References

ASPIN D N and Chapman J D (2000) Lifelong learning: concepts and conceptions. International Journal of lifelong education, 19(1), pp. 2-19.

BONABEAU E, Dorigo M and Theraulaz G (1999). Swarm intelligence : from natural to artificial systems. New York: Oxford University Press.

BROCKETT R G and Hiemstra R (1991) Self-direction in Adult Learning: perspectives on theory, research and practice. London: Routledge.

CANDY P C (1991) Self-direction for Lifelong Learning. San Francisco: Jossey-Bass.

DENEUBOURG J L, Goss S, Francks N, Sendove-Francks A, Detrain C and Chretien L (1991) The dynamics of collective sorting: Robot-like ants and ant-like robots. Paper presented at the Proceedings of the first international conference on simulation and adaptive behaviour.

DI MARZO SERUGENDO G, Foukia N, Hassas S, Karageorgos A, Kouadri Mostéfaoui S, Rana O, Ulieru M, Valckenaers P and Van Aart C (1998) Self-organisation: Paradigms and Applications. In Di Marzo Serugendo G, Karageorgos A, Rana O and Zambonelli F (Eds.), Engineering Self-Organising Systems. LNAI 2977, pp. 1-19. Heidelberg, Springer.

DORIGO M, Di Caro G and Gambardella L M (1999) Ant Algorithms for Discrete Optimization. Artificial Life, 5, pp. 137-172.

FIELD J (2001) Lifelong education. International Journal of Lifelong Education, 20 (1/2), pp. 3-15.

GILBERT N and Troitzsch K G (1999) Simulation for the Social Scientist. Buckingham: Open University Press.

GRASSÉ P P (1959) La construction du nid et les interactions inter-individuelles chez les bellicositermes natalenis et cubitermes sp. la théorie de la stigmergie: essai d'interprétation des termites constructeurs. Insectes Sociaux, 6, pp. 41-83.

GRIFFIN C (1999) Lifelong learning and social democracy. International Journal of Lifelong Education, 18(5), pp. 329-342.

HÄMÄLÄINEN M, Whinston A B and Vishik S (1996) Electronic Markets for Learning: Education Brokerages on the Internet. Communications of the ACM, 39(6), pp. 51-58.

KOPER E J R (1992) Studieondersteuning met behulp van de computer [computer based learner support]. Utrecht: Lemma.

KOPER E J R and Sloep P (2003) Learning Networks: connecting people, organizations, autonomous agents and learning resources to establish the emergence of effective lifelong learning (OTEC RTD Programme Plan 2003-2008). Heerlen: Open University of the Netherlands.

KOPER E J R and Olivier B (2004) Representing the Learning Design of Units of Learning. Educational Technology & Society, 7 (3), pp. 97-111. http://ifets.ieee.org/periodical/7_3/10.html

KOPER E J R and Tattersall C (2004) New directions for lifelong learning using network technologies. British Journal of Educational Technology, 35(6), pp. 689-700.

KOPER E J R, Giesbers B, Van Rosmalen P, Sloep P, Van Bruggen J, Tattersall C, et al. (in press) A Design Model for Lifelong Learning Networks. Interactive Learning Environments.

LAVE J and Wenger E (1991) Situated learning: Legitimate peripheral participation. Cambridge: Cambridge University Press.

LAW A M and Kelton W D (2000) Simulation Modeling and Analysis (third ed.). Boston: McGraw-Hill.

LOMI A and Larsen E R (Eds.) (2001). Dynamics of Organizations: computational modeling and organization theories. Cambridge: MIT Press.

LONGWORTH N (2003) Lifelong Learning in Action: Transforming Education in the 21st Century. London: Kogan Page.

MASON R (2004) ePortfolios in Lifelong Learning. British Journal of Educational Technology, Autumn, (this issue).

PASCARELLA E T and Terenzini P T (1980) Predicting freshmen persistence and voluntary drop-out decisions from a theoretical model. Journal of higher education, 51, pp. 60-75.

PYTHIAN T and Clements M (1982) Drop-out from third level math courses. Teaching at a Distance, 21, pp. 33-45.

RYAN R M and Deci E L (2000) Self-determination theory and the facilitation of intrinsic motivation, social developments and well being. American Psychologist, 55, pp. 68-78.

SHUELL T J (1992) Designing instructional computing systems for meaningful learning. In M Jones and P H Winne (Eds.), Adaptive Learning Environments. pp. 19-54. Berlin: Springer-Verlag.

SPADY W G (1970) Drop-outs from higher education: an interdisciplinary review and synthesis. Interchange, 2, pp. 38-62.

THERAULAZ G and Bonabeau E (1999) A Brief History of Stigmercy. Artificial Life, 5. pp. 97-116.

TINTO V (1975) Drop-out from higher education: a theoretical synthesis of recent research. Review of Educational Research, 45(1), pp. 89-125.

TINTO V (1982) Limits of theory and practice in student attrition. Journal of Higher Education, 53(6), pp. 687-700.

TREUER P and Jenson J D (2003) Electronic Portfolios need standards to survive. EDUCAUSE Quarterly, 2, pp. 34-42.

VINCENT S (1998) Input Data Analysis. In Banks J (Ed), Handbook of Simulation: Principles, Methodology, Advances, Applications, and Practice. pp. 55-92. New York, John Wiley.

WILENSKY U (1999) NetLogo. Center for Connected Learning and Computer-Based Modeling, Northwestern University. Evanston, IL. http://ccl.northwestern.edu/netlogo/ .

----

ButtonReturn to Contents of this issue

© Copyright Journal of Artificial Societies and Social Simulation, [2005]