
James F. Robison-Cox, Richard F. Martell and Cynthia G. Emrich (2007)
Simulating Gender Stratification
Journal of Artificial Societies and Social Simulation
vol. 10, no. 3 8
<https://www.jasss.org/10/3/8.html>
For information about citing this article, click here
Received: 22-Nov-2006 Accepted: 06-Apr-2007 Published: 30-Jun-2007

 Abstract
 (1)
(1)
|
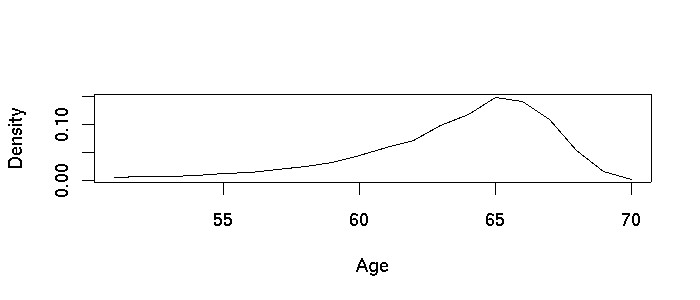
| Figure 1. Distribution of retirement age for new hires |
| Table 1: Numbers of managers reported in a large Fortune 500 company (by level) | ||||
| Hurley-Hanson's Company | ||||
| Level | count | % | ||
| 7 (CEO) | 1 | 0.004 | ||
| 4 - 6 | 683 | 2.5 | ||
| 3 | 1592 | 5.9 | ||
| 1 - 2 | 24866 | 91.7 | ||
| total | 27141 | 100 | ||
| Table 2: Numbers of managers used in simulated companies | |||||||||
| Large Company | Medium Company | Small Company | |||||||
| Level | count | % | Level | count | % | Level | count | % | |
| 7 (CEO) | 1 | 0.004 | 6 (CEO) | 1 | 0.03 | 5 (CEO) | 1 | 0.1 | |
| 6 | 10 | 0.04 | 5 | 7 | 0.2 | 4 | 6 | 0.8 | |
| 5 | 80 | 0.3 | 4 | 42 | 1.2 | 3 | 30 | 4.0 | |
| 4 | 560 | 2.0 | 3 | 168 | 4.7 | 2 | 120 | 15.9 | |
| 3 | 1680 | 6.1 | 2 | 672 | 18.8 | 1 | 600 | 9.3 | |
| 2 | 5040 | 18.3 | 1 | 2688 | 75.1 | total | 757 | 100 | |
| 1 | 20160 | 73.2 | total | 3578 | 100 | ||||
| total | 27531 | 100 | |||||||
In each case, the numbers
show that a majority do not get promoted to the higher levels of the
company, and that the competition will be intense to get to the upper
levels.
Next we will describe some of the technical details of the simulation.
|
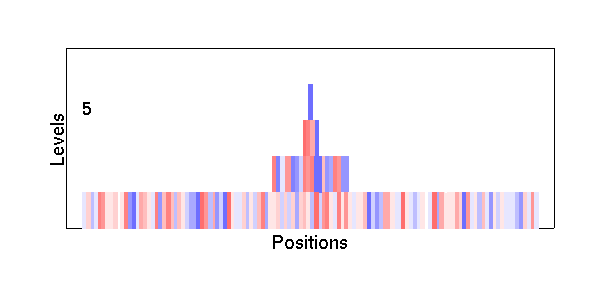
| Figure 2. Screen shot of a four level company during its fifth year of operation. Individuals are colored according to gender and performance score with darker colors indicating higher performance scores |
|
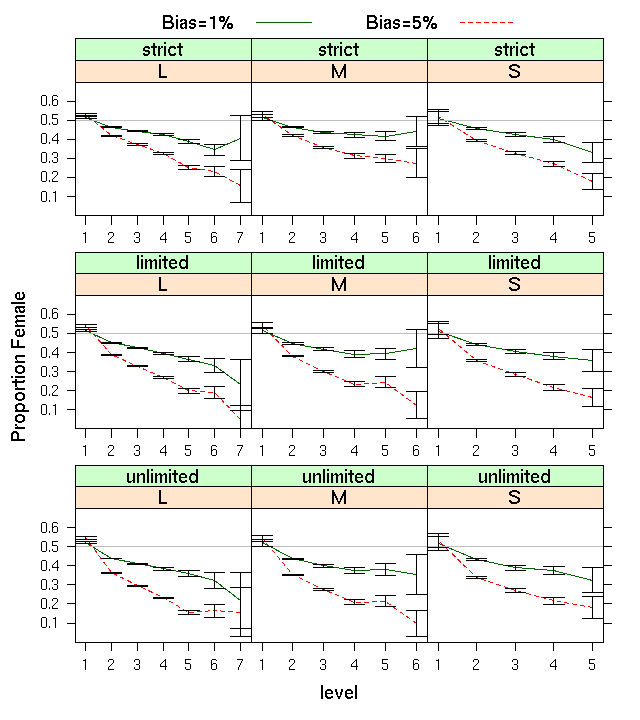
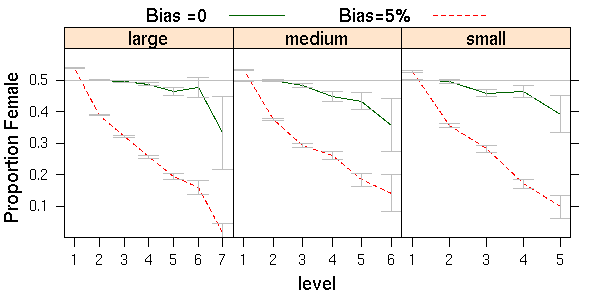
| Figure 3. Effects of 1% and 5% bias on proportions female for three company sizes and three candidate pools (unlimited, limited, or strict) |
From figure 3 we note that bias has a strong effect as judged against the gray horizontal line at 50%. The first level has more than 50% women because relatively more women than men are detained in level 1. The more open candidate pools (middle and bottom rows) show faster rates of decline in proportions female. It is also true that mean performance scores increase more steeply with level for unlimited pools than for strict or limited pools. (Data available upon request.) Decreases in proportions tend to flatten out at the level just below CEO. This is an artifact of a special attrition rule implemented only at that level. When a new CEO is hired, the next level down (VPs) will all leave in the following year. Promoting a large batch of people at one time uses up a greater proportion of the candidates, making the new VPs look much like the level just below them (little filtering is taking place). Smaller companies tend to have higher proportions female in the upper levels, which is sensible because fewer competitions take place between the bottom and the top of the company and because candidate pools are typically smaller than with larger companies. Variability naturally increases with level because lower levels contain far more people. Finally, note that even with 5% bias the proportions female are above the 17% target for the upper levels.
|
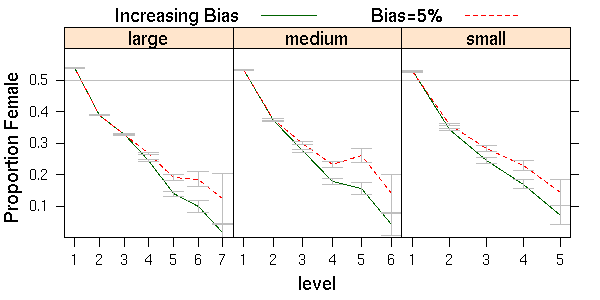
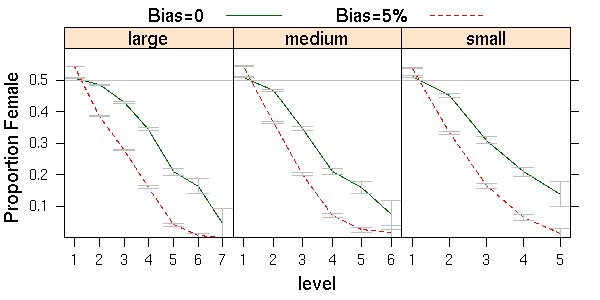
| Figure 4. Effects of 5% and of increasing bias on proportions female for three company sizes |
|
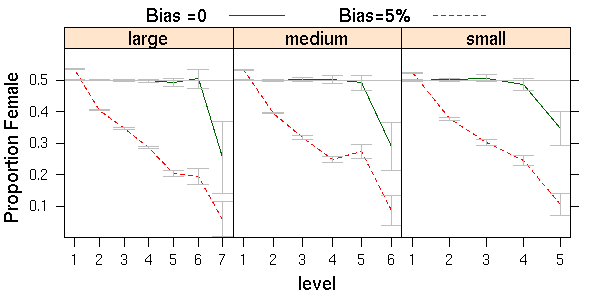
| Figure 5. Effects of line-staff division combined with 0 and 5% bias on proportions female for three company sizes |
Figure 5 shows that by itself, the line-staff division reduces the proportion of female CEOs to 25-30%. When combined with 5% bias, only 5% of the large, 8% of the medium, and 10% of the small company CEOs were female. At the VP level percents female were 19, 27, and 24 percent (large, medium and small companies, respectively).
| Size | ||||||
| Large | Medium | Small | ||||
| Level | M | F | M | F | M | F |
| 1 | 4 | 4 | 4 | 4 | 4 | 4 |
| 2 | 3 | 5 | 2 | 6 | 1 | 7 |
| 3 | 3 | 5 | 2 | 6 | 1 | 8 |
| 4 | 2 | 6 | 1 | 7 | 1 | 9 |
| 5 | 1 | 7 | 1 | 9 | 1 | 10 |
| 6 | 1 | 8 | 1 | 10 | ||
| 7 | 1 | 10 | ||||
|
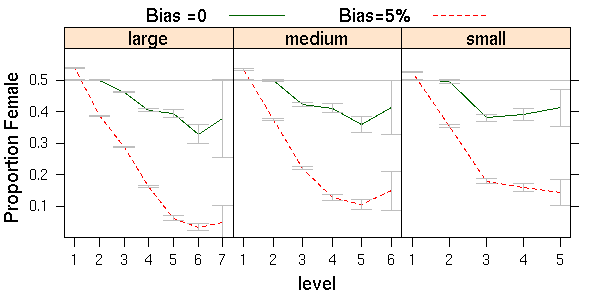
| Figure 6. Effects of increased female attrition combined with 0 or 5% bias on proportions female for three company sizes |
|
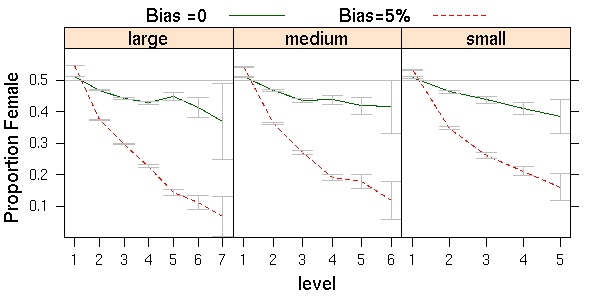
| Figure 7. Effects of random one-year delays for women coupled with 0 or 5% bias on proportions female for three company sizes |
Combined with 5% bias, we observed: 6, 13, and 16% of CEOs were women, at the VP level, 11, 18, and 21% were women (for large, medium, small companies). The percentages of women are surprisingly similar to the 5% bias lines in figure 4, indicating that the penalty and bonus were not strong enough to disadvantage women further, or that it is not hard for the few exceptional women who rise to the highest ranks to make up for the one-year delay.
| Probability of external hire | |||||||||||||
| Level | |||||||||||||
| Size | 1 | 2 | 3 | 4 | 5 | 6 | 7 | ||||||
| large | 1.0 | .05 | .07 | .10 | .10 | .20 | .30 | ||||||
| medium | 1.0 | .10 | .20 | .25 | .30 | .30 | |||||||
| small | 1.0 | .10 | .25 | .30 | .30 | ||||||||
| Proportion male in external pool | |||||||||||||
| Level | |||||||||||||
| Size | 1 | 2 | 3 | 4 | 5 | 6 | 7 | ||||||
| large | .50 | .55 | .60 | .70 | .75 | .80 | .85 | ||||||
| medium | .50 | .55 | .60 | .70 | .80 | .90 | |||||||
| small | .50 | .60 | .70 | .80 | .90 | ||||||||
|
| Figure 8. Effects of external hiring from a predominantly male pool combined with 0 or 5% bias on proportions female for three company sizes |
|
| Figure 9. Effects of 20% increase in SD for males with 0 or 5% bias on proportions female for three company sizes |
|
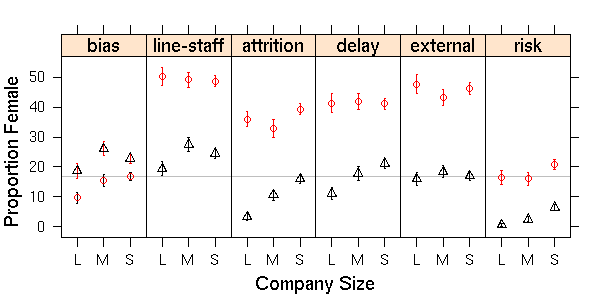
| Figure 10. Confidence interval estimates of the proportions of women at the VP level for different effects and company sizes |
In the left-most panel, the triangles are for 5% bias alone, and the circles are for increasing bias. In each of the other panels, the circles are for another effect by itself and the triangles are for the same effect combined with 5% bias.
BOWEN, C.C., J.K. Swim, and R.R. Jacobs (2000). Evaluating gender biases on actual job performance of real people: A meta-analysis. Journal of Applied Social Psychology, 30(10) pp. 2194-2215
BRETT, J.M. and L.K. Stroh (1997) Jumping ship: Who benefits from an external labor market career strategy? Journal of Applied Psychology, 82 pp. 331-334.
CATALYST (2006) 2005 Catalyst census of women corporate officers and top earners of the Fortune 500. Technical Report, Catalyst.
CLEVELAND, W. (1993) Visualizing Data. Hobart Press.
COX, T.H. and C.V. Harquail (1991) Career paths and career success in the early career stages of male and female MBAs. Journal of Vocational Behavior, 39 pp. 54-75.
DAVIDSON, M. and Burke, R.J. (2000) Women in Management: Current Research Issues, volume II. Sage, London.
EAGLY, A.H., M.G. Makhijani, and B.G. Klonsky (1992). Gender and the evaluation of leaders: A meta-analysis. Psychological Bulletin, 111 pp. 3-22.
FORTUNE (2006) How the companies stack up. Fortune, 153 pp. 28-31.
HURLEY-HANSON, A. E., S. Wally, S.L. Segrest Purkiss and J.A. Sonnenfeld (2005). The changing role of education on managerial career attainment. Personnel Review, 34(5) pp. 517-533.
KONRAD, A. and J. Pfeffer( 1991). Understanding the hiring of women and minorities. Sociology of Education, 64 pp. 141-157.
LYNESS, K.S. and M.E. Heilman (2006). When fit is fundamental: Performance evaluations and promotions of upper-level female and male managers. Journal of Applied Psychology, 91(4) pp. 777-785.
LYNESS, K.S. and M.K. Judiesch (1999). Are women more likely to be hired or promoted into management positions? Journal of Vocational Behavior, 54 pp. 158-173.
MARTELL, R.F., D.M. Lane, and C. Emrich (1996). Male-female differences: A computer simulation. American Psychologist, 51 pp. 157-158.
OLIAN, J., D. Schwab, and Y. Haberfield (1988). The impact of gender compared to qualifications on hiring recommendations. Organizational Behavior and Human Decision Processes, 41 pp. 180-195.
PALMER, V. (2006). 'Simulation of the Categorization-Elaboration Model of Diversity and Work-Group Performance'. Journal of Artificial Societies and Social Simulation 9(3)3 https://www.jasss.org/9/3/3.html.
PETZOLDT, T. (2003). R as a simulation platform in ecological modelling. R News, 3(3):8-16, http://cran.fhcrc.org/doc/Rnews/
POWELL, G N and L A Mainiero (1992). Cross-currents in the river of time: Conceptualizing the complexities of women's careers. Journal of Management, 18(2) pp. 215-228.
RICHIARDI, M, R Leombruni, M Sonnessa, and N Saam, Nicole (2006). A Common Protocol for Agent-Based Social Simulation. Journal of Artificial Societies and Social Simulation 9(1) 15 https://www.jasss.org/9/1/15.html .
R DEVELOPMENT CORE TEAM (2005). R: A language and environment for statistical computing. R Foundation for Statistical Computing, Vienna, Austria. http://www.R-project.org. 3-900051-07-0.
ROSIN, H.M. and K. Korabik (1990). Marital and family correlates of women managers: attrition from organizations. Journal of Vocational Behavior, 37 pp. 104-120.
SCHUBERT, R. (2006). Analyzing and managing risks - on the importance of gender differences in risk attitudes. Managerial Finance, 32(9) pp. 715.
STROH, L.K., Brett, J.M. and Reilly, A.H. (1992). All the right stuff: A comparison of female and male career patterns, Journal of Applied Psychology, 77 pp. 251-260.
SWARM Development Group (2005). Documentation Set for Swarm 2.2. Santa Fe, New Mexico. http://www.swarm.org.
SWIM, J.K. and L.J. Sanna (1996). He's skilled, she's lucky: A meta-analysis of observers' attributions for women's and men's successes and failures. Personality and Social Psychology Bulletin, 22(5)pp. 507-519.
SWIM, J.K., E. Borgida, G. Maruyama, and D.G. Myers (1989). Joan McKay versus John McKay: Do gender stereotype bias evaluations? Psychological Bulletin, 105 pp.409-429.
VAN FLEET, D.D. and A.G. Bedian (1971). A history of the span of management. Academy of Management Review, 2 pp. 356-372.
WELLINGTON, S., M.B. Kropf, and P.R. Gerkovich (2003) What's holding women back? Harvard Business Review, 81(6) pp. 18-19.
 Return to Contents of this issue
© Copyright Journal of Artificial Societies and Social Simulation, [2007]