
 Abstract
- Multi-agent simulation was used to study the effect of simple models of leadership on interpersonal violence and warfare in small societies. Agents occupied a two dimensional landscape containing villages and food sources. Sharing and stealing contributed to normative reputation. Violence occurred during theft, in revenge killings, and in leader-directed warfare between groups. The simulations were run over many generations to examine the effect of violence on social development. The results indicate that leadership reduced the survival probability of the population. Interpersonal violence killed more agents than warfare when intra-group violence was permitted. More aggressive leaders did not always prevail over less aggressive leaders due to the inherent risks associated with attacks. The results of the simulation are compared to cross-cultural studies and to observations of indigenous Pacific island societies.
- Keywords:
- Multi-Agent Simulation, Leadership, Violence, Warfare, Pacific Island Societies
Introduction
- 1.1
- Cross-cultural studies have examined the relationship between leadership, interpersonal violence, and warfare in a wide spectrum of societies ranging from egalitarian bands to nation states (e.g.Ember and Ember 1992; Keeley 1996; Kelly 2000; Loftin 1971; Oterbein 1968; Oterbein and Oterbein 1965; Ross 1985). Loftin (1971) found that the nature of warfare between groups was different in societies governed by simple political organizations than in those governed by complex ones: "… as societies increase in complexity, a number of changes converge which make warfare a profitable enterprise for those individuals who control the political and military institutions of the society (1971: 107)". In complex societies, "war is a relatively impersonal business with motivations provided by the structure of the military organization and can exist almost irrespective of the identity of the enemy (1971: 88)". In small societies, "the enemy is less likely to be an abstraction, known only through rumor or propaganda. More likely he is a well known rival whose insults, threats and violence have been demonstrated in concrete terms on many occasions to nearly all members of the society. (1971: 89)." Egalitarian societies engage in warfare less frequently than more hierarchical societies, although the rate of interpersonal violence in egalitarian societies can be quite high (Keeley 1996). In a study of sedentary societies in the Americas, Feinman and Neitzel (1984) found that war was the most exercised function of leadership. War was a means of demonstrating and increasing their power and, in some cases was one of the few avenues for social distinction.
- 1.2
- Ross (1985) found a moderate positive correlation between interpersonal violence and warfare in his cross-cultural study of pre-industrial societies. "Internal conflict is a good predictor of the level of external conflict, and external conflict is an excellent predictor of internal conflict (Ross 1985: 553)." A similar correlation was found by Ember and Ember (1992).
- 1.3
- In this paper I focus only on lethal violence and distinguish between two forms: interpersonal violence and warfare. Interpersonal violence is here interpreted as occurring in a dyadic relationship between two or a few individuals where violence is directed at a specific person. Examples of interpersonal violence include homicides committed in the act of theft, assassinations, and revenge killings. Warfare is defined as organized lethal violence between groups wherein the targets of attacks are chosen based on their affiliation rather than on individual attributes or actions.
- 1.4
- The distinction between interpersonal violence and warfare may be more than semantic. Kelly (2000: 3) asks, "Does war of the variety manifested by hunter-gatherers represent a point on a continuum that differs only incrementally from other forms of lethal violence? Or, alternately, does the transition to war constitute a watershed event that institutes practices governed by a distinctly different logic?" He believes the latter to be the case: "Although war entails lethal violence between individuals who reside in separate social groups, not all acts of intergroup violence exhibit the full ensemble of distinctive features that characterize war (Kelly 2000: 6)." Interpersonal violence can certainly lead to war, as when a group takes revenge upon another group for the murder of one of its members, but the mechanisms by which a group decides to attack another group are often different in character from the decision processes affecting violence against a single individual.
- 1.5
- Simulation has been used to study violence in small societies with interesting results. Doran (2005) constructed a multi-agent simulation of guerrilla war and insurgencies and examined violence in Ireland, Arabia, Cuba, and other cases. A particularly interesting finding of his study was that the key contributor to insurgent success was effective communication—only by continuously replenishing their ranks can they hope to survive the determined efforts of a central authority.
- 1.6
- Younger (2005) performed multi-agent simulations of interpersonal violence in egalitarian societies, finding that some restriction of violence within the group was important to group survival. Similar methods were applied to the study of simple styles of leadership in small societies (Younger 2010). In the latter work, simulations suggested that leadership did not improve the economic performance of small groups, in keeping with the empirical analysis of Sahlins (1958; 1963) for Pacific island societies, but it did have a significant impact on the normative makeup of the population.
- 1.7
- This paper uses multi-agent simulation to investigate a number of issues associated with leadership, interpersonal violence, and warfare in small societies. What is the effect of simple forms of leadership on interpersonal violence? If leaders stimulate violence, is this another reason why many small societies tend toward egalitarianism? How do the characteristics of a leader—such as its innate aggression—affect the level of internal and external violence within a small society? How are interpersonal violence and warfare correlated in simulated societies? Ember and Ember (1992) assert that warfare leads to the socialization of internal violence. Can the simulations shed like on a causal direction linking interpersonal violence and warfare?
- 1.8
- The results of the simulations are compared to observations of indigenous Pacific societies at the time of contact with the western world. Oceania is a particularly attractive test case for simulations. Pacific ecosystems range from small atolls barely able to maintain a viable human gene pool to volcanic islands large enough to host pre-state cultures. For example, on the small atolls of Pukapuka, Kapingamarangi, and Nukuoro, each of which had total populations numbering in the few hundreds, the traditional central leadership of the ancestral Polynesian culture was moderated to be little more than a coordination of a semi-egalitarian face-to-face society. On larger islands such as Tahiti, Tonga, and especially Hawaii, with tens of thousands of people, a distinct social stratification and leadership system emerged in which individual lives were strongly influenced by a central government. The frequency and nature of violence varied from very seldom and primarily interpersonal in small societies to strongly warlike in the larger cases (Younger 2008).
Simulation Method
- 2.1
- MICROS is the name of the multi-agent simulation computer code that I used to study a population of independent agents acting according to a fixed set of rules laid down at the start of each run. A population of 100 or 200 agents assigned to one or two villages moved about circumscribed environments, searched for and consumed food, mated, procreated, shared food, stole food (during which events lethal violence might occur), communicated the normative reputation of other agents, and executed the orders of leaders, including warfare against other villages.
- 2.2
- A detailed discussion of this code, including its application to social processes such as reciprocity, sanctions, interpersonal violence, and leadership can be found in previous papers (Younger 2003; 2004; 2005; 2010). Pseudocode for MICROS is given in the Appendix. Parameters used in the simulation, along with their ranges, are given in Table 1.
Table 1: Parameters of the MICROS simulation Parameter Range Comment Size of environment 1 Village: 20 × 20 squares
2 Villages: 30 × 30 squaresProvides grid for location of agents, villages, food Day 48 timesteps Agents begin to return to home village at 36 timesteps into day Agent lifetime 4000 Agents die of old age Length of each run 40,000 Simulation stops at this time Number of runs per case 20 Each result is average of 20 runs Food required by agents 1 unit per timestep Agents require food to survive Maximum need for food before starvation 200 Agents die if their need for food exceeds 200 points Food source replacement rate 12.5 per food source, except 25 for central food source in 2 village environment Food sources replenished by this amount each timestep. Food endures until consumed. Carrying capacity of environment 100 agents for 1 village
200 agents for 2 villagesAverage number of agents that can be supported by all food sources Range of agent vision 5 squares Agents can sense other agents and food sources 5 squares in each direction Altruism 0 - 1.0 Agents with higher altruism share more readily Aggression 0 - 1.0 Agents with higher aggression steal more readily Fighting ability 0 - 1.0 Higher fighting ability improves ability to kill or defend Leader Drive 0 - 1.0 Governs fraction of day agents in village are required to carry out orders of leader Interaction matrix Unconstrained Sharing adds to interaction matrix element connecting agents while stealing and killing reduce it Mutual obligation Unconstrained Sum of interaction matrix elements of all agents in a defined group Probability of conception 0.0025 per timestep Probability that a new agent will appear when mated male and female agents are collocated Female fertility age 1000 - 3000 timesteps Females can only produce offspring in this age range Inheritance of altruism, aggression, fighting ability, and leader drive Random chance of offspring inheriting average of parent values, 0.1 more, 0.1 less Accounts for random variation of offspring - 2.3
- The agents inhabited one of two environments, the first (shown in Figure 1) containing one village and four sources of food and the second (shown in Figure 2) containing two villages and seven sources of food. Agents occupied a place on the grid and more than one agent could occupy the same location. The boundaries of the environments were reflective so that when an agent reached an edge it turned and went in another direction, giving the environments the characteristics of islands.
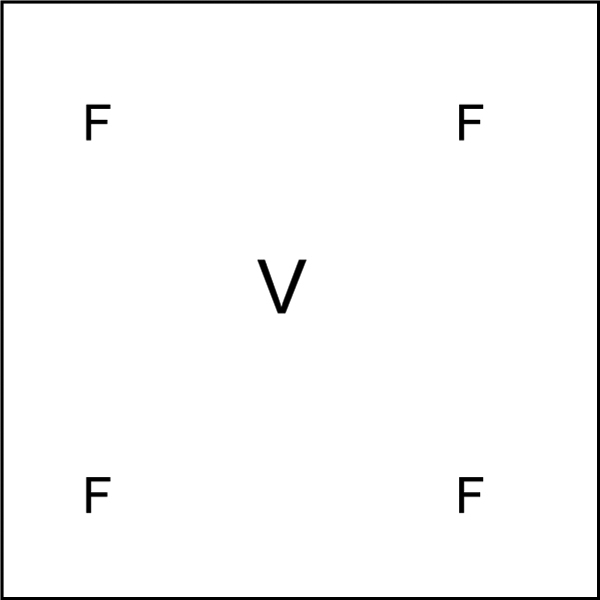
Figure 1. One village environment. V refers to the village. F refer to the food sources. - 2.4
- The initial population was randomly distributed across the environment and was equally divided between male and female agents. In all of what follows, I equate group with village since they were the only political units.
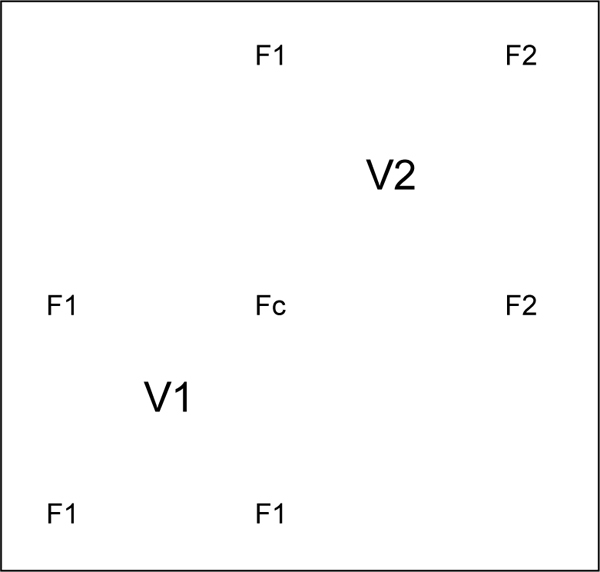
Figure 2. Two village environment. V1 and V2 refer to the villages. F1 are food sources claimed by Village 1 and F2 are food sources claimed by Village 2. Fc is a contested food source, i.e. it is claimed by both villages. - 2.5
- The agents' normative behavior was governed by four parameters: altruism ( Ai), aggression ( Gi), fighting ability ( Fi), and leader drive ( Di). The altruism and aggression parameters controlled an agent's sharing and stealing. If an agent was carrying food and (agent hunger / 200) < Ai then that agent would share its food with other agents at the same location. A large altruism parameter meant that an agent would share on most occasions and a small altruism parameter meant that it would share only if its own hunger was very low. (Sharing depended on the state of the agent with the food, not on the need of potential recipients.) When an agent shared it gave an equal share to each of the other individuals at its location, keeping a share for itself. In the case of a two-village environment, agents from the other village received only one half of a normal share.
- 2.6
- Theft was similarly dependent upon the situation in which the agent found itself. An agent who was not already carrying food stole all of the food carried by a collocated agent if (agent hunger / 200) > Ai and (agent hunger / 200) > (1 - Gi), where the parameters again refer to the stealing agent and not the victim. Agents with small altruism and large aggression parameters were more likely to steal than agents with large altruism and small aggression parameters. Attempted theft was resolved as follows:
- Gi > Gj and Fi > Fj : Theft occured without fighting. Here the acting agent was both more aggressive than its victim and had greater fighting ability. It intimidated the victim into giving up its food without a fight.
- Gi < Gj and Fi < Fj : No theft occurred. Here the acting agent was less aggressive than the defender and had weaker fighting ability. It chose not to fight.
- Gi > Gj and Fi < Fj : The acting agent was more aggressive than the defender, but had less fighting ability. The acting agent lost the fight and died. The defending agent suffered no penalty.
- Gi < Gj and Fi > Fj : The acting agent was less aggressive then the defender but a better fighter. The defending agent died and its food was taken by the acting agent. The acting agent suffered no penalty.
- 2.7
- Examination of these rules indicates that there was an equal chance of no theft, theft without fighting, the death of the attacking agent, and the death of the defending agent. The lethal nature of the combat described by these rules is consistent with observations of many indigenous societies where, when violence did occur, it was often fatal.
- 2.8
- A death that occurred during an attempted theft was considered a homicide. To separate the effect of homicide from that of theft, I ran some simulations using the above rules without allowing any deaths.
- 2.9
- In simulations of violence in egalitarian cultures, Younger (2005) noted that many societies excluded a certain subpopulation from violent death. In my simulations I consider two cases: one in which violence was permitted between any male in the population and another in which violence was limited to males of another village. The exclusion of females from violence was observed in many Polynesian cultures, as noted by Williamson (1939). Boehm (1993; 1999) argues that a prohibition against intra-group violence is a nearly universal behavioral norm based on sociobiological optimization.
- 2.10
- Agents could not sense the normative parameters of other agents. Prior to interaction, they did not know whether they were likely to be the recipient of sharing or the victim of theft. To allow the agents to keep track of the behavior of other agents, I defined an interaction matrix, imx(i,j). When agent i shared x units of food with agent j then x points were added to imx(j,i). When agent i stole x units of food from agent j then x points were subtracted from imx(j,i). When agent i killed agent j, then 4000 points (an agent lifetime) were deducted from the interaction matrix elements connecting the killer with all collocated agents of the same village as the victim, the total amount equally distributed over those agents.
- 2.11
- As indicated in Figure 2, food sources were assigned to villages. Whenever an agent took food from a food source claimed by the other village (including the contested food source) an amount equal to the food removed was deducted from the interaction matrix elements of any agents of the owning village who were collocated with the theft. This was distributed over the agents present.
- 2.12
- Since only food and killing were included in the definition of imx, it was only the relative value of killing compared to theft that was relevant in the construction of imx. I studied a variety of penalties for killing and found the qualitative results reported in this paper to be insensitive to the details.
- 2.13
- Revenge killing was included in some of the simulations. When agent i found itself collocated with another agent j for whom it had a negative interaction matrix element, agent i would conduct a revenge attack upon agent j. The results of a revenge attack were decided as follows:
- Fattacker > Fdefender : Attacking agent killed the defending agent and 4000 points were deducted from the interaction matrix elements of collocated agents in the same group as the defender.
- Fattacker < Fdefender : Attacking agent died in the attempt at revenge and 4000 points were deducted from the interaction matrix elements of collocated agents in the same group as the attacker.
- 2.14
- An attack only occurred when Gattacker > Gdefender, i.e. when the attacker was more aggressive than the defender.
- 2.15
- Note that there was no material gain in a revenge attack—any food carried by the loser was lost. However, revenge focused on agents with negative reputations, which were in turn a result of low altruism and high aggression parameters. It preferentially removed less altruistic and more aggressive agents from the population.
- 2.16
- Sharing and theft were included as symmetrical normative behaviors that were simple to simulate. They correspond roughly to Sahlins' (1972) positive and negative reciprocity. (Sahlins (1972) identified a third form of reciprocity, trade, which I will not consider here.)
- 2.17
- The interaction matrix element constituted a form of individual normative reputation for each agent. Depending on what circumstances prevailed at the time of interaction, a given agent might have been viewed negatively by one agent and positively by another. It was even possible for a given agent to change its opinion of another agent, such as when it was the victim of theft from an agent that had previously shared.
- 2.18
- Normative reputations were communicated between two collocated agents by averaging the interaction matrix elements that connected them to each of the other agents in the population. The communication of normative reputation gave an agent the opportunity to learn something about the past behavior of another agent without having to have direct experience with that agent.
- 2.19
- Leaders in my simulations had three functions. They could order their agents to collect food for storage at their village, they could redistribute that food back to the population, and they could initiate warfare, the goal of which was to secure the food stored at the other village and to eliminate competition for food in the limited environment.
- 2.20
- Recognizing the extraordinary complexity of leadership (charisma, organizational ability, rhetorical skill, physical strength, etc.) in even the smallest society, I described a leader in my simulations by adding only one additional normative parameter to the description of an agent. The leader's drive parameter, Di, determined what portion of a day an agent was compelled to obey its leader.
- 2.21
- At the beginning of each day, a leader issued instructions to collect food to all residents of the village who were present in the village. Each agent who received such an order would collect food and return it to the village, not eating any of it or sharing it with other agents. (Food could be stolen from agents who were carrying it back to their home village.) However, if the simulation clock exceeded 48 times Di then the agent was freed of any obligation, could keep any food collected and otherwise make its own decisions. Since an agent moved one square per unit of time, examination of the environments indicates that an agent could, upon starting out from a village, reach a food source in as little as 10 time units. Thus if Di = 0.25 the agent would be under orders until just after it left the food source on its journey homewards. If Di = 0.5 then an agent would be under orders for the time spent going and coming, assuring that it would deposit any collected food at the village. Higher values of Di caused the agent to deposit food and to attempt a return trip to a food source. Since food sources were limited by their replenishment rate, it was possible for an agent to set out for a food source, only to find it already depleted by other agents.
- 2.22
- Once food was accumulated, a leader shared it with agents located in its village when (1 / hungersubject) < Aleader. Thus leaders with a large altruism parameter were likely to share with their subjects and leaders with a small altruism parameter shared only when the hunger of their subjects was extreme. To enable them to issue orders and distribute food, leaders were constrained to remain in their village.
- 2.23
- Two methods were used to choose a leader:
- Fixed characteristics: An agent was chosen at random but was given predetermined values of Di, Ai, and/or Gi. This enabled a systematic study of the effect of leader characteristics on social performance.
- Heredity: The oldest son of the previous leader was chosen and, if there was no son, the oldest brother of the leader was chosen. If neither of these cases occurred then the new leader was chosen as the agent with highest sum of altruism and aggression.
- 2.24
- Only males above the age of 1000 time units were eligible to be a leader. (Females only rarely assumed political authority in the types of small indigenous societies considered here.)
- 2.25
- The third function of a leader in my simulations was to order his people to attack another village and to collect any food stored there. There were many proximate causes for warfare in small societies. Here we consider two: the desire of a leader to demonstrate his power over another village and revenge attacks against one village based on perceived transgressions of the other village against its members. I refer to the former as the power scenario and the latter as the revenge scenario.
- 2.26
- In the power scenario, the leader of a village attacked another village if his village was stronger, the strength of a village being defined as
Village Strength = (4000 Gk Pk + Foodk) (1) where Gk was the aggression of the leader of village k, Pk was that village's male population of fighting age (older than 1000 time units), and Foodk was the food stored at the village. Village i went to war with village j when (Village Strength)i > (Village Strength)j * Warfactor, where Warfactor—usually set to 1.0 or 2.0—was a multiplier that restricted attacks to situations where the attacker had an advantage over the defender. More aggressive leaders were more likely to attack than less aggressive ones. The net result of this definition of village strength was that an aggressive leader with a large population and plenty of food was disposed to go to war. The importance of food in enhancing a leader's power has been discussed by Kirch (1984).
- 2.27
- In the revenge scenario, the leader of a village initiated an attack on the other village if the sum of interaction matrix elements connecting the agents of his village with those of the other village was negative and if the strength of the attacking village was at least half that of its intended target.
- 2.28
- Combinations of drive, altruism, and aggression represent different aspects of leadership. High drive combined with high altruism and low aggression meant that the leader focused on the collection and distribution of food for the benefit of his population. High drive, low altruism, and low aggression meant that a leader focused on his own enrichment with little consideration given to aggression. In both cases, low aggression implied that the leader was primarily civil in orientation rather than warlike. Conversely, a high aggression parameter suggested a leader bent on obtaining materials by conquest. The case of high drive and high aggression meant that the females in the population focused on domestic acquisition while the males were occupied with foreign conquest.
Results of the Simulations
-
Leadership With Fixed Drive and Altruism Parameters in a One-Village Environment with Homicide and Revenge
- 3.1
- Table 2 gives the results of simulations where homicide and revenge were permitted among the members of a one-village population of 50 agents with fixed leader drive and altruism parameters.
Table 2: Results of simulations with fixed leader drive and altruism where homicide and revenge were permitted among the members of a one-village population of 50 agents. Surv is the percentage of runs that had a non-zero population at the end of the run, Age, Hun, Hom, and Rev are the percentages of agents who died of that cause where Age was old age, Hun was hunger, Hom was homicide, and Rev was revenge. Numbers in parentheses are standard deviations. Di / Ai Surv Age
(%)Hun
(%)Hom
(%)Rev
(%)Ending
Agents
With
Ai > 0.5 (%)Average
GiAverage
FiMutual
ObligNo ldr or vio 100 27
(5.5)73
(5.5)N/A N/A 83
(27)0.35
(0.079)0.37
(0.082)97
(45)No ldr, with vio 90 32
(6.4)47
(5.6)2.3
(0.73)18
(3.3)60
(35)0.11
(0.040)0.41
(0.084)83
(70)0.25 / 0.25 65 39
(4.9)34
(9.0)4.1
(1.6)23
(4.0)16
(20)0.11
(0.047)0.036
(0.075)690
(480)0.25 / 0.50 75 35
(7.2)44
(10.5)3.8
(1.5)18
(4.2)60
(25)0.13
(0.065)0.41
(0.069)820
(470)0.25 / 0.75 70 33
(7.2)45
(8.3)3.1
(1.3)19
(3.8)91
(12)0.12
(0.058)0.40
(0.084)770
(320)0.50 / 0.25 30 47
(10)27
(12)3.7
(0.56)23
(2.1)29
(37)0.10
(0.036)0.39
(0.13)2100
(1600)0.50 / 0.50 20 40
(6.1)32
(10)4.8
(1.2)23
(5.0)55
(17)0.12
(0.072)0.36
(0.15)1200
(640)0.50 / 0.75 45 37
(3.1)35
(7.0)3.6
(1.2)24
(4.4)88
(20)0.13
(0.047)0.44
(0.077)1500
(460)0.75 / 0.25 20 43
(4.9)31
(7.2)2.7
(0.49)24
(2.5)7.1
(6.8)0.078
(0.016)0.53
(0.13)640
(190)0.75 / 0.50 40 43
(6.1)23
(9.4)2.5
(0.68)31
(4.3)55
(28)0.13
(0.046)0.41
(0.051)1000
(250)0.75 / 0.75 15 40
(1.4)25
(3.8)1.9
(0.40)33
(2.7)82
(7.3)0.20
(0.088)0.44
(0.11)1100
(300) - 3.2
- Without leadership, violence, or revenge the population survived in 100% of the runs. With violence and revenge but without leadership, the probability of survival dropped to 90%.
- 3.3
- Figure 3 shows that the survival probability of the population decreased with increasing leader drive. At high leader drive, agents had less time to collect food on their own and they resorted to theft. When homicide attended theft, agents were removed from the population, sometimes to the point where there was an insufficient mating pool to insure continuance. For Drive = 0.75 and Altruism = 0.75 the population survived in only 15% of the runs.
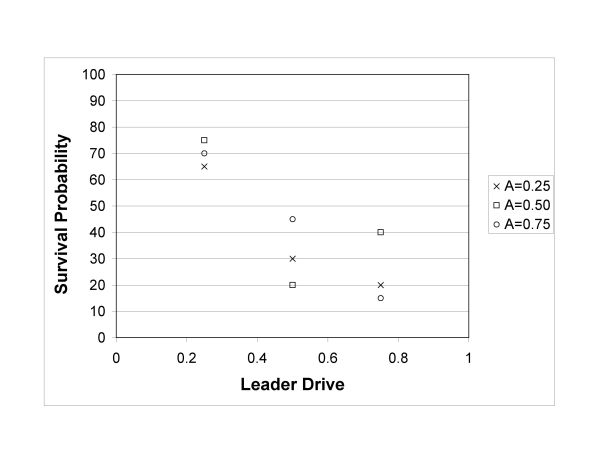
Figure 3. Survival probability vs. leader drive and altruism for the case of one village where homicide and revenge were permitted. - 3.4
- More agents died from revenge than as a result of homicide committed in the act of theft. One theft could develop into a cycle of revenge killings lasting several generations. Note that the percentage of deaths due to violence committed during theft decreased with increasing leader drive. As leaders provided food there was less of an incentive from agents to steal from one another. However, that food also allowed them to live long enough to exact revenge for those thefts that did occur, resulting in a positive correlation between revenge killings and leader drive. More agents lived into old age when homicide and revenge were permitted. This was due to the fact that so many agents were dying as a result of homicide and revenge that there was more food for the survivors.
- 3.5
- The number of agents with Ai > 0.5 at the end of the simulation was strongly correlated with leader Aldr. This agrees with a previous study (Younger 2009) that found that leadership characteristics had a casual role in the normative makeup of the population. Specifically, the more altruistic the leader, the more altruistic the population.
- 3.6
- Agent aggression, shown in Figure 4, was much lower when homicide and revenge were permitted, a result of violent agents being removed from the population's normative gene pool in revenge attacks. Without violence, agent aggression increased with leader drive since only agents who stole could obtain enough food to survive.
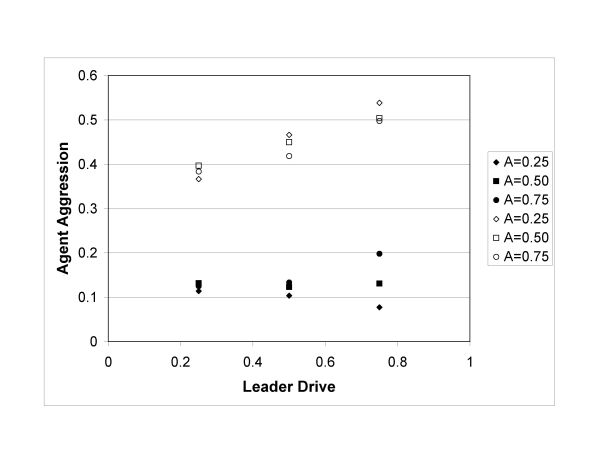
Figure 4. Agent aggression vs. leader drive for the case of one village where homicide and revenge were permitted. The upper three values are for the case where homicide and revenge were prohibited (Younger 2009). - 3.7
- Mutual obligation, shown in Figure 5, was higher when homicide and revenge were present, even though killing had the potential of detracting from the reputation of the killer and hence his contribution to mutual obligation. The reason was that more agents lived into old age and their relatively high altruism parameter caused them to share frequently. This contrasts to a population where most agents died before their high altruism factor allowed them to share many times and hence build up the high interaction matrix elements that contributed to mutual obligation. The anomalously high value for Dldr = 0.50 and Aldr = 0.25 was a consequence of poor statistics—only six of the twenty runs survived for this case.
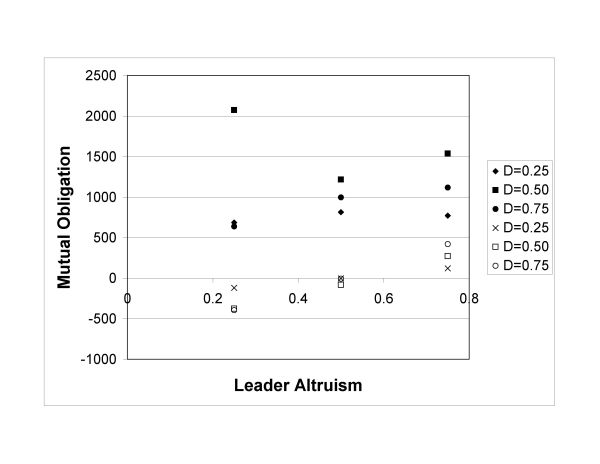
Figure 5. Mutual obligation vs. leader drive and altruism for the case of one village where homicide and revenge were permitted. The lower three values are for the case where homicide and revenge were prohibited (Younger 2009). Leadership with Fixed Drive and Altruism Parameters in a Two-Village Environment with Homicide, Revenge, and Warfare
- 3.8
- Table 3 contains results for various restrictions on homicide and revenge and for the case of inter-group warfare precipitated by the power option with Warfactor = 1.0. Where comparisons are possible (i.e. no war between villages) these results are very close to the one-village cases presented in Table 2.
Table 3: Results for various combinations of leadership, homicide, revenge, and inter-village warfare in a two village environment where each leader had his drive and altruism parameters set to 0.5. An X in a column indicates that a feature was active in the scenario. Here Ldr refers to leadership, HR to homicide and revenge, Intra-group to whether violence was permitted between males within the same village, War to the presence of warfare with the Power option and warfactor = 1.0, Surv the percentage of runs with a non-zero population at the end, Both Vill Surv the percentage of runs where both villages survived until the end of the run, Age the percentage of agents who died of old age, Hun the percentage of agents who died of hunger, Hom the percentage of agents who died of homicide committed in act of theft, Rev the number of agents killed in a revenge attack, Attk the number of attacking agents killed in war, Def the number of defending agents killed in war, Ai > 0.5 the percentage of agents with Ai > 0.5 at the end of the run, and Mut Oblig the total mutual obligation. Ldr HR Intra-
groupWar Surv Both
Vill
SurvAge Hun Hom Rev Attk Def Ai>0.5 Gi Mut
Oblig100 100 29
(3.0)71
(3.0)0 0 0 0 97
(8.9)0.32
(0.049)130
(21)X 100 100 15
(2.3)66
(4.0)2.1
(0.33)16
(2.7)0 0 66
(20)0.22
(0.044)-13
(28)X X 95 65 30
(8.4)46
(10.4)2.6
(0.82)21
(3.2)0 0 61
(28)0.12
(0.056)84
(44)X 100 100 25
(1.8)75
(1.8)0 0 0 0 87
(15)0.42
(0.074)-140
(54)X X 100 35 24
(2.8)62
(6.3)1.6
(1.1)12
(6.7)0 0 79
(19)0.40
(0.061)56
(300)X X X 75 25 44
(4.1)22
(5.9)4.8
(1.1)29
(3.9)0 0 62
(19)0.17
(0.047)1600
(350)X X 85 0 30
(3.1)65
(3.7)0 0 2.2
(0.97)1.9
(0.32)83
(15)0.38
(0.094)260
(350)X X X 90 0 31
(3.3)65
(3.8)0.049
(0.076)0.24
(0.24)1.8
(0.54)2.0
(0.38)79
(21)0.41
(0.082)87
(280)X X X X 10 0 45
(0.49)21
(0.42)4.4
(0.52)25
(0.60)1.8
(0.47)2.0
(1.5)94
(6.0)0.17
(0.064)2200
(370) - 3.9
- There are a number of comparisons that can be made from the data in Table 3. I discuss the four that I consider the most important. First, the numbers of deaths due to homicide and revenge were highest when intra-group conflict was allowed. Agents interacted most frequently with others of the same village since they often traveled together to and from food sources and since they were required to return to their home village at the end of the day. If these interactions contained the potential for killing, then the death rate was high.
- 3.10
- Second, when intra-group homicide and revenge were allowed but warfare was prohibited, the presence of leadership decreased the survival probability of the population from 100% (without leadership) to 75% (with leadership). Both villages survived in only 25% of the runs. This effect was further exacerbated when warfare was added to the mix, reducing the survival probability to only 10%. The deleterious effect of leadership was smaller when intra-group homicide and revenge were prohibited and only inter-group violence allowed; in this case the populations survived in 100% of the runs when warfare was prohibited, and 90% of the time when warfare was included. Leadership decreased the percentage of deaths due to homicide and revenge when intra-group conflict was forbidden, but only because the population of one village was often completely eliminated, depriving would-be killers of targets.
- 3.11
- Third, even without warfare, competition between leaders reduced the probability that the population of both villages would survive until the end of the run. Without leadership, both villages survived in 100% of the runs. With leadership, both villages survived in 35% of the runs without intra-group violence and in only 25% with intra-group violence. Warfare further reduced this survival rate to zero.
- 3.12
- Fourth, the addition of war did not significantly reduce intra-group violence. Deaths due to homicide and revenge were 34% without war and 29% with war. War, in and of itself, did not prevent homicide committed during thefts and revenge. The suppression of intra-group violence requires another mechanism, such as mediation by the leader or a social norm proscribing in-group violence.
- 3.13
- A detailed examination of a single run can be informative of the dynamics of the simulation of warfare. The following describes a run with leadership and warfare but without intra-group violence. When the simulation started, the leader of Village 1 had an aggression factor of 0.82 and the leader of Village 2 had an aggression factor of 0.67. Both villages started with identical numbers of male and female agents but the higher aggression factor of the leader of Village 1 gave him more power. At t=49 units the leader of Village 1 declared war on Village 2. During this first attack, 9 attackers were killed along with 4 defenders. These asymmetric losses so weakened Village 1 that the leader of Village 2 was motivated to counterattack. This he did, with 5 attackers killed (belonging to Village 2) to 2 defenders (belonging to Village 1). In the next round, Village 2 attacked and 2 attackers were killed compared to 5 defenders. With the balance of power decisively affected, Village 2 continued to attack until all male members of Village 1 were killed, ensuring its eventual collapse. (Some females from Village 1 were taken as wives by the conquerors according to the usual rules of mating described above.) Village 2 then had free reign over the food sources previously utilized by Village 1 and was able to substantially increase its population.
Leadership with Fixed Drive and Aggression Parameters in a Two Village Environment with Homicide, Revenge, and Warfare
- 3.14
- So far I have focused on the leader's drive and altruism parameters—those that were most relevant to his performance as a civil rather than as a military leader. I now turn to a consideration of the effect of fixing drive and aggression parameters, the latter of which was central to the leader's likelihood to engage in attacks against the other village. Table 4 shows the results of runs where the leaders' drive and aggression parameters were set to combinations of 0.25 and 0.75. Of particular interest was the case where one village had a very aggressive leader (Gi = 0.75) and the other village had a much less aggressive leader (G i = 0.25). Intra-group homicide and revenge were prohibited in these runs.
Table 4: Results for warfare in a two-village environment in which the leaders of the villages had Drive and Aggression parameters set to combinations of 0.25 and 0.75. Warfare was included with a warfactor of 1.0. Homicide and revenge were permitted only between males of different villages. In the mixed case, Village 1 (V1) had Di = 0.25 and Gi = 0.75 and Village 2 (V2) had Di = 0.75 and Gi = 0.25. Parameter No leader Both .25 /.75 Both .75/.25 One each Survived (%) 100 90 100 80 V1 Only Survived 0 55 55 45 V2 Only Survived 0 35 45 35 Deaths Age (%) 15
(2.3)27
(4.6)35
(3.0)31
(4.2)Deaths Hunger (%) 66
(4.0)69
(5.0)61
(3.0)65
(4.8)Deaths Homicide (%) 2.1
(0.33)0.015
(0.033)0.0042
(0.019)0.011
(0.030)Deaths Revenge (%) 16
(2.7)0.21
(0.22)0.21
(0.21)0.25
(0.15)Deaths Attack (%) N / A 1.9
(0.69)2.2
(0.65)2.3
(0.89)Deaths Defense (%) N / A 1.8
(0.37)1.9
(0.40)1.9
(0.47)V1 Initiated Attacks N / A 51
(37)45
(37)54
(43)V2 Initiated Attacks N / A 27
(28)29
(28)35
(37)V1: Average Population 55
(2.8)41
(32)35
(31)40
(35)V2: Average Population 54
(3.3)29
(34)30
(32)29
(31)V1: Ai > 0.5 (%) 60
(17)56
(15)55
(18)67
(23)V2: Ai > 0.5 (%) 60
(18)67
(15)59
(19)56
(18)V1: Mutual Obligation 7.6
(25)90
(190)490
(690)190
(280)V2: Mutual Obligation 6.1
(25)120
(210)150
(210)230
(370) - 3.15
- In every case where a leader was present, only one village persisted until the end of the run, so the percentage of deaths due to war attacks and defenses belies the significance of inter-group conflict. (The opposing village was typically eliminated within one or two lifetimes, so the effect of war was relatively small when measured across a run that lasted ten agent lifetimes.) There was no clear advantage to either leadership style in the mixed case. Even the number of times that a village leader decided to attack was comparable in all cases studied. Over the long term, aggression did not pay in that the risks associated with attack mitigated the potential benefit.
Warfare in a Two Village Environment Where Leaders Were Chosen According to Heredity
- 3.16
- In all of the previous studies I fixed the values of key leadership parameters. Table 5 gives the results of simulations that used hereditary transmission of leadership, the means most common in Oceania and in many other parts of the world. Homicide and revenge were prohibited between members of the same village. Two cases are considered, one with the warfactor set to 1.0 and the other with it set to 2.0, indicative of a higher threshold before war is declared.
Table 5: Results for warfare in a two-village environment in which the leaders of the villages were chosen according to heredity and where intra-group homicide and revenge were prohibited. Here H refers to homicide, R to revenge, W to warfare using the power option, and WF is the warfactor. Surv is the percentage of runs with a non-zero population at the end, Both Surv is the percentage of runs where both villages survived until the end of the run, Age the percentage of agents who died of old age, Hun the percentage of agents who died of hunger, Hom the percentage of agents who died of homicide committed in act of theft, Rev the number of agents killed in a revenge attack, Attk the number of attacking agents killed in war, Def the number of defending agents killed in war, A i > 0.5 the percentage of agents with A i > 0.5 at the end of the run, Aldr the average Altruism of the leader, Dldr the average Drive of the leader, Gldr the average Aggression of the leader, and Mut Oblig the total mutual obligation. Scenario Surv Both
SurvAge Hun Hom Rev Attk Def Ai>0.5 Aldr Dldr Gldr Mut
ObligNo H, R, or W 100 85 28
(2.4)72
(2.4)0 0 0 0 90
(20)0.57
(0.057)0.65
(0.068)0.54
(0.10)130
(270)H and R 100 30 26
(3.8)58
(5.6)1.8
(1.1)15
(6.2)0 0 59
(32)0.48
(0.079)0.58
(0.095)0.52
(0.12)270
(310)HRW, WF=1 85 0 33
(2.8)63
(2.7)0.027
(0.053)0.34
(0.33)2.0
(0.73)1.9
(0.33)71
(34)0.50
(0.082)0.58
(0.10)0.56
(0.099)410
(380)HRW, WF=2 85 0 31
(3.1)64
(3.8)0.32
(0.23)2.8
(1.9)1.3
(0.76)1.1
(0.78)86
(13)0.54
(0.085)0.57
(0.13)0.54
(0.24)280
(420) - 3.17
- Comparing the results given in Table 5 to those of Table 3, where leaders had their Altruism and Drive parameters fixed to 0.5, shows little difference. This is not surprising given that leader parameters obtained from hereditary transmission were close to 0.5. The survival rate of the total population as well as the percentages of deaths due to different causes were virtually identical, suggesting that over time hereditary transmission of leadership produced the same result that would have been obtained by a succession of average leaders.
- 3.18
- Increasing the warfactor (the threshold for going to war) from 1.0 to 2.0 reduced the percentage of agents killed in warfare but greatly increased the number who died in revenge attacks so that the total percentage of deaths due to all forms of violence actually increased from 4.3% (0.67) to 5.5% (1.6).
Revenge as a Cause of War
- 3.19
- A leading cause of warfare in the Pacific was revenge (Oliver 1989). Table 6 compares the results of simulations conducted with the power and revenge options for deciding war.
- 3.20
- Without any form of violence, both villages survived in 100% of the runs. When interpersonal violence was permitted against members of the opposing village, there was a 70% chance of one of the villages being eliminated. When war was added to the mix, the probability of both villages surviving droped to zero.
Table 6: Results for warfare in a two-village environment in which the leaders of the villages were chosen according to heredity, where intra-group homicide and revenge were prohibited, and where the cause of war was power or revenge. Here Surv the percentage of runs with a non-zero population at the end, Both Surv is the percentage of runs where both villages survive until the end of the run, Age the percentage of agents who died of old age, Hun the percentage of agents who died of hunger, Hom the percentage of agents who died of homicide committed in act of theft, Rev the number of agents killed in a revenge attack, Attk the number of attacking agents killed in war, Def the number of defending agents killed in war, and Ai > 0.5 the percentage of agents with A i > 0.5 at the end of the run. Cause of War Surv Both
SurvAge Hun Hom Rev Attk Def Ai>0.5 Mutual
ObligationNo Violence 100 85 28
(2.4)72
(2.4)0 0 0 0 90
(20)130
(270)Hom and Rev but no War 100 30 26
(3.8)58
(5.6)1.8
(1.1)15
(6.2)0 0 59
(32)270
(310)Power
Warfactor =1.085 0 33
(2.8)63
(2.7)0.027
(0.053)0.34
(0.33)2.0
(0.73)1.9
(0.33)71
(34)410
(380)Revenge 95 0 30
(4.4)61
(5.7)0.31
(0.30)3.1
(2.7)3.4
(1.9)2.1
(1.1)82
(20)310
(440) - 3.21
- Figure 6 plots the percentage of agents lost in warfare vs. those killed by interpersonal violence in each scenario. Whereas interpersonal violence and warfare were strongly correlated in revenge based war, deaths due to interpersonal violence were much lower than those due to warfare in the power option.
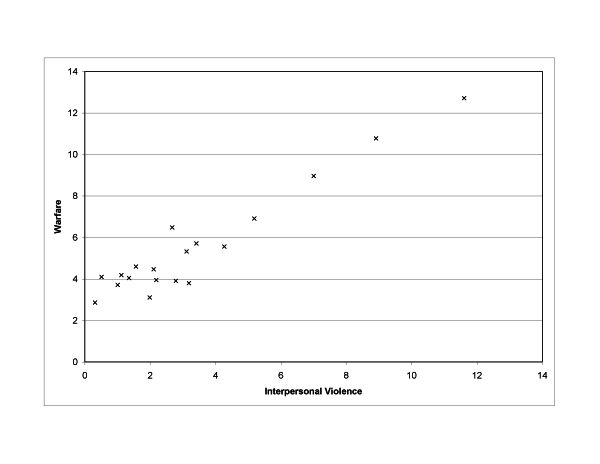
Figure 6. Warfare vs. interpersonal violence for the case of two villages with no intra-village violence and hereditary leadership. Leadership was hereditary. Left: power based war. Right: Revenge based war. (Note different scales in figures.) - 3.22
- Power based war was the result of a leader decision that was in turn a function of his innate aggression, the population under his control, and the amount of food that he controlled. It was an executive decision that was independent of the relations between individuals in opposing villages. Conversely, revenge-based war was a group decision in that war was declared when the sum of interaction matrix elements linking the members of different villages fell below a certain (negative) value. This negative opinion could be generated through interpersonal violence or through previous wars. The leader's role was to carry out the intention of the group. Interpersonal violence created a fund of negative reputation for the other group which eventually led to revenge warfare. In turn, war provided an opportunity for negative reputation to develop among individual combatants, which could lead to future interpersonal revenge attacks. However, a strong correlation between interpersonal violence and warfare is not a foregone conclusion of the simulation design. Sometimes warfare was so destructive that it overwhelmed deaths due to interpersonal violence.
- 3.23
- In the simulations, the desire for group revenge was inversely proportional to the ability to inflict it. Strong negative opinions of another village occurred as a result of massive theft or the killing of villagers, both of which reduced the fitness of the victim to conduct revenge attacks. However, attacks carried their own cost, namely a probability of being killed. In this sense, revenge warfare was self-regulating. It stopped when populations were reduced below the threshold of war. Interpersonal violence between members of different villages continued and the population recovered until the village had both the means and the motivation (via the sum of interaction matrix elements linking it to the other village) to attack.
- 3.24
- Note that the destructiveness of revenge based war, as measured in the percentage of agents killed, had significant outliers at high values—up to 13%. Cycles of revenge war were very destructive.
Discussion
- 4.1
- Several observations can be made from the above results:
- Leadership reduced the survival probability of a population
- Revenge killed more agents than homicide
- Interpersonal violence and warfare were correlated in revenge-based warfare, but not in power-based warfare
- Interpersonal violence killed more agents than warfare when intra-group violence was permitted
- Violence enhanced social solidarity as measured by mutual obligation
- More aggressive leaders did not always prevail over less aggressive leaders
Leadership Reduced the Survival Probability of a Population
- 4.2
- High values of leader drive significantly reduced the probability that a population would survive until the end of a run. Revenge killing was the dominant cause of death, with cycles of revenge initiated by theft.
- 4.3
- For leaders with average characteristics, i.e. altruism and drive parameters set to 0.5, the simple collection-redistribution form of leadership included in the simulations increased the percentage of agents who died a violent death when intra-group violence was permitted and reduced it slightly when only inter-group violence was allowed. The first result was attributed to increased pressure on agents to find food in the limited time left after fulfilling the orders of a leader. Theft could ignite a chain of revenge killings. The reduction in theft-related homicide and revenge attacks when intra-group violence was prohibited was mainly due to the fact that one of the villages was likely to be completely eliminated during the course of the run, eliminating all potential targets from the population.
- 4.4
- Note that the increase in violence with leadership was not foreordained in the simulations. It is possible that the role of leadership in coordinating food collection and redistribution might have led to a more equitable distribution of food and less violence associated with theft.
- 4.5
- Bergeron and Schneider (2005), in a cross-cultural study of peer-to-peer aggression, concluded that individuals in more hierarchical, status driven cultures were more prone to homicide than those living in societies in which individuals cooperated voluntarily, although they acknowledge that further work is required to refine this conclusion. While my simulations have a very simple status system consisting of leader and followers, I found that in-group violence increased when leaders were present.
- 4.6
- An analysis of violence and warfare in a selection of Polynesian (Goldman 1970, Younger 2008) and Micronesian (Younger 2009) islands suggests that small isolated populations tend to be semi-egalitarian in nature with low rates of violence and warfare. Sahlins (1958) attributes this partly due to the lack of economic advantage provided by centralized leadership in face-to-face subsistence cultures. An alternate explanation of the lack of a pronounced hierarchy is the reluctance of individuals to give up personal sovereignty (Boehm 1993; 1999). The simulation results presented here support a third rationale: leaders increase the level of internal violence with a society and, when several polities are within close proximity to one another, the potential for war. People may have suppressed leaders so as to avoid society-threatening violence.
- 4.7
- Polynesian islands with the weakest form of central government, such as Pukapuka, had the lowest rates of internal violence and used verbal ridicule as a means to deal with the inevitable conflicts that arise in daily life. This is analogous to the role that reputation played in the simulations. Agents in this simulation do not evaluate the consequences of their behavior—the rules constrain them to act in certain ways. The effect of violent behavior arising from these rules, and the negative reputation that it engendered, was to make it more difficult to find a mate.
Revenge Killed More Agents than Homicide
- 4.8
- Revenge killings greatly outnumbered homicides in the simulations. This was to be expected since homicides occurred during theft which only occurred when the victim was carrying food. In contrast, a revenge attack was mandatory when someone was encountered about whom the acting agent had a negative opinion. This negative reputation could be generated by the observation of theft or homicide of a fellow village member or through the communication of normative reputation.
- 4.9
- Revenge was a significant cause of violence across the Pacific. In many societies, especially those in Melanesia, any death was attributed to human cause, either physical or magical and, in the case of higher status individuals, mandated revenge. Cycles of revenge killings were a significant factor in overall mortality in some of these societies.
Interpersonal Violence and Warfare were Correlated in Revenge Based War, but Not in Power Based War
- 4.10
- Cross cultural studies have found that interpersonal violence and warfare are correlated in many small societies (Ross 1985; Ember and Ember 1992; Younger 2008 and 2009). Figure 7 compares the results for an analysis of 35 Polynesian islands (Younger 2008) with the simulation results for revenge based war, indicating qualitatively similar trends.
- 4.11
- While the number of deaths due to interpersonal violence and warfare were correlated in the revenge based warfare scenario, they were not in the power-based warfare scenario, where warfare killed far more agents than interpersonal violence. This suggests that the decision process used in the declaration of war has implications beyond the immediate battle. Power based war was leader directed and occurred independent of the relationships between individuals in the two polities. Revenge based war occurred as a direct result of the collective relationships—the functions of the leader were only to recognize that the threshold for war had been exceeded and to issue the necessary order to attack. Hence one expects interpersonal violence to be correlated in revenge based warfare.
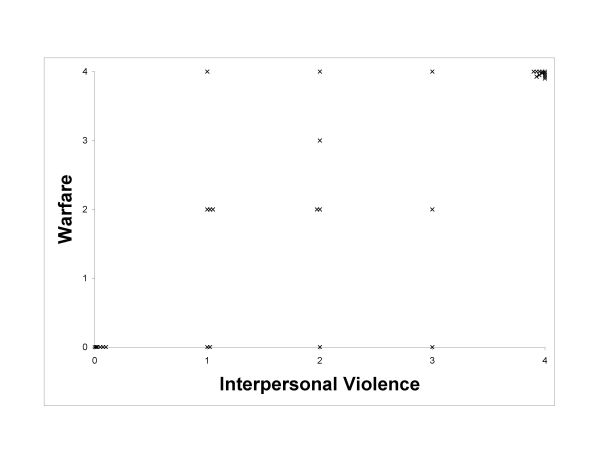
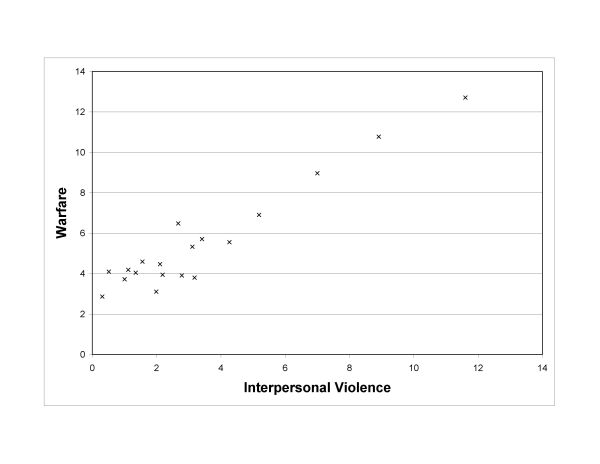
Figure 7. Comparison of warfare vs. interpersonal in a selection of 35 Polynesian islands (Younger 2008) and the results of simulations. The scales are different in the two figures. The empirical study measured violence on a relative scale of 0-4 whereas the simulation results indicate the percentage of agent deaths due to interpersonal violence or warfare. - 4.12
- On Tahiti, violence within the general population appeared to have been relatively low. Warfare, which was frequent, may have been the result of the aggressive nature of the chiefs rather than the characteristics of the general population (Levy 1973), consistent with my power scenario. In contrast, Melanesian societies, which often had Big Men as leaders (Sahlins 1958), had weak central control and the decision to declare war may have been more of a consensus decision, as in my revenge scenario. The rate of violence in many Melanesian societies was exceptionally high.
- 4.13
- In some of my two village simulations I found that the villages fought until one was completely eliminated. Given persistent attacks, especially those mandated by the power scenario, this was hardly surprising. On Ifaluk (Caroline Islands, Micronesia) in the nineteenth century a strong prohibition against internal violence was not matched by a similar prohibition against external violence. While residents of Ifaluk strongly discouraged any display of violent behavior against one another, they attacked and annihilated the entire populations of neighbor islands (Betzig and Wichimai 1991). A similar, if less extreme, case prevailed on Vokeo in Melanesia (Hogbin 1978).
- 4.14
- Violence, especially intra-group violence but to a lesser extent non-leader-directed inter-group homicide and revenge, was a population control in my simulations, consistent with the view of Hayden (1972: 216) that a "second means of insuring maintenance of group size would be the augmentation of inter-group hostility and conflict." Kirch (1984: 119) writes of Tikopia that "war between social divisions was an ultimate means of relieving the stress of over-population, and according to Tikopian tradition, was practiced twice in the last four or five centuries." Famine was another, involuntary, means of population control on Tikopia, an island that sometimes operated at, or even slightly above, its carrying capacity. Indeed, famine and violence were related in many cultures, each exacerbating the other (Younger 2005).
Interpersonal Violence Killed More Agents than Warfare When Intra-Group Violence Was Permitted
- 4.15
- Homicide and revenge claimed more agent lives than did warfare. In a finite environment inter-agent interactions were frequent and provided many opportunities for theft and revenge attacks. Agents were much more likely to die as a result of these interactions than from warfare where they were directed to attack and kill agents of another village on the orders of their leader. This effect was exacerbated when violence was permitted between members of a village.
- 4.16
- Even more interesting than the fact that war did not reduce the total number of violent deaths is the fact that it did not increase it. This contrasts with the hypothesis of Ember and Ember (1992) that war socialized violence within a society. In the revenge based warfare scenario, interpersonal violence and war were correlated and, if anything, the casual direction was from the accumulation of interpersonal grievances to the declaration of war. In the power based warfare scenario, the leader decided when war would occur and the negative reputations generated in warfare did not result in significant interpersonal violence.
- 4.17
- Malinowski (1941: 528) observed that: "the smaller the group engaged in co-operation, united by some common interests, and living day by day with one another, the easier it is for them to be mutually irritated and to flare up in anger." As was the case for many Pacific societies, leaders in my model did not control every action of the people, especially those relating to interpersonal relations. Indeed, the focus of a leader was more on how the people interacted with him than how they interacted with one another. Specifically, neither the leaders in my simulation nor those in many in human societies intervened in inter-agent disputes (theft and revenge) so that a high level of violence persisted even during warfare. Chuuk and Niue are examples of island societies where violence was endemic, part of the value system that gave social status to an individual (Younger 2008; 2009).
- 4.18
- In simulations of homicide and revenge in egalitarian societies I found that the survival probability of the social unit was increased if a major segment of the population—group members or females—was excluded from violence (Younger 2005). The results shown in Table 3 allow a similar conclusion to be drawn for societies with leaders. When homicide and revenge were permitted in the group but there was no warfare, the population survived in 75% of the cases. Similarly, when homicide and revenge were prohibited in the group but warfare was allowed, the survival probability was 90%. When both intra-group violence and warfare were allowed, the survival probability dropped to only 10%. One can compare these results to observations of three categories of cultures: those that had significant internal violence but no warfare, those that had warfare but little internal violence, and those that had both. The Copper Eskimos (Keeley 1996) were an example of the first case, where intra-group homicide was a significant cause of adult death but where inter-group violence was slight. The residents of the Melanesian island of Vokeo were much less violent within their social unit but considered violence against other groups acceptable (Hogbin 1978)—an example of the second group. Both of these cultures survived over many generations. The Waorani (Yost 1981) were violent internally and externally and in some cases groups fought to extinction and illustrate the third case.
Violence Enhanced Social Solidarity as Measured by Mutual Obligation
- 4.19
- It is interesting that both in-group and inter-group violence increased mutual obligation, a measure of social cohesion. In the case of interpersonal violence accompanying theft, agents prone to steal engaged in high risk behavior by conducting attacks in which they could themselves be killed. In this way aggressive agents were preferentially removed from the population, leaving a population more inclined to share and hence increase, rather than decrease, social cohesion. Violence was, in this sense, self-regulating. The case for war increasing social cohesion is weaker in the simulation results given the devastating impact of both intra-group and inter-group violence on demographics—the total population survived in only 10% of the runs.
- 4.20
- Murphy (1957) cites Simmel's (1955) argument that war might distract a population from internal problems, unify them against a common foe, and increase social cohesion, cognizant of Coser's (1956) proviso that societies that already lack solidarity could well disintegrate under the stress of war. Since agents in my simulations followed a fixed set of behavioral rules, they could not be distracted. However, the increased food supply made available by successful wars could have reduced violence by reducing the need for agents to steal from one another. This did not happen. Instead, the increased food supply simply allowed the population to grow with continued internal violence. The normative rule set dominated ecological considerations.
More Aggressive Leaders Did Not Always Prevail Over Less Aggressive Leaders
- 4.21
- Aggression was costly in that it exposed male members of the population to the risk of combat. Just as in interpersonal theft, the potential for gaining resources through conquest of another village was offset by this risk, combined with the lost opportunity of using those same males to gather food in a peaceful fashion.
- 4.22
- Wars were common in Polynesia and the effect on the population was almost uniformly disastrous. While a particular chief could be aggressive in his pursuit of hegemony, he often lacked the military superiority to achieve a decisive result, especially when shifting alliances of other chiefs were arrayed against him (Campbell 1989). Only in a small number of cases did a chief succeed in overcoming all competition to establish undisputed rule over a large island or archipelago. Even then, unification often fractured upon the death of the chief or the advent of an even more aggressive and talented war leader. This was especially true in societies such as the Marquesas, Niue, and Rapa Nui (Easter Island) where warfare was frequent and led to significant hardship for the populations.
Comparison to Specific Islands
- 5.1
- The ethnographic literature is sufficiently diverse to yield evidence for almost any thesis involving human behavior. So far, I have compared the simulation results to a number of observations of small societies, but no attempt was made to ensure that all of the simulation results were consistent with the all of the observations of any one culture. I now give a brief comparison of the simulation results to the Polynesian islands of Pukapuka and Niue.
Pukapuka
- 5.2
- Pukapuka is a small coral atoll in the Cook Islands. Located 530 km from its nearest neighbor, it is a population isolate. While there are three islets in the group, two are used as agricultural reserves and the entire population of about 630 lives on the northernmost island which has an area of only 1.3 km2 (Beaglehole and Beaglehole 1938). This makes Pukapuka one of the most densely populated islands of all of Polynesia. Primary foods include cultivated taro, coconuts, and fish from the lagoon enclosed by the islands and the surrounding reef. Tradition suggests that Pukapuka was settled somewhat after 1200 AD.
- 5.3
- The primary sources of food ownership and distribution on Pukapuka were the three villages of the island. Secular power has for some time rested in a council of elders. Heredity governed the selection of chiefs, who had limited power, but fathers could choose which of their sons would accede to the position. There does not appear to have been any time when a single individual had control of the entire atoll, although there were several attempts to do so. The generosity expected from the chiefs came from their own gardens rather than from collection or taxation. Hence the chief was not a dominant force in the economy of the island.
- 5.4
- There is no oral or historical record of warfare on Pukapuka. This relatively peaceful circumstance may be partly due to the complex land ownership scheme on the island, one that cut across village lines so that geographically localized polities were not united in their desire for or defense of food sources. However, when civil disturbances did occur, they were especially violent. Beaglehole and Beaglehole (1938) report oral traditions that relate the island "running red with blood" during rebellions against unfair leaders. Apparently there was an expected code of behavior for rulers and, when that code was violated, a response akin to Boehm's (1993; 1999) reverse dominance hierarchy was invoked. Indeed, those with supernormal powers were expected to leave the island to avoid undue influence over the rest of the population.
- 5.5
- There are a number of similarities, and some important differences, between Pukapukan history and the principal features of my simulations. In each case, food was supplied from a small number of sources, taro beds on the island and food sources in my simulation, that were claimed by distinct social groups. In my simulations the leader controlled the collection and redistribution of food—heads of households or family units did the same on Pukapuka.
- 5.6
- In the simulations and on Pukapuka, non-altruistic and aggressive leaders led to theft and violent deaths. When the leader was generous (altruistic), the population was content and relatively prosperous, but when the leader attempted to control scarce food then theft increased and the population became more aggressive.
- 5.7
- Warfare does not appear to have been common on Pukapuka. Infrequent violence was interpersonal—murder or killings in revenge for murder. A partial point of agreement between simulation and observation is that most of the violent deaths were associated with theft. Negative reputation followed from theft from a food source owned by another village.
- 5.8
- Pukapuka corresponds to a simulation including leaders with weak drive, strong altruism, intra-group homicide, and no warfare. Examining the entry in Table 3 corresponding to these conditions suggests that the villages will all survive over the long term, that most killing will be associated with theft, and that the fraction of highly altruistic agents will be relatively small. The last point is consistent with a tendency toward stinginess that sometimes existed on Pukapuka (Borofsky 2003). One serious point of disagreement between simulation and observation is that there were far fewer revenge killings on Pukapuka than in the simulations. This suggests that other, non-violent, means for dispute resolution were employed, methods that were absent in the simulations.
Niue
- 5.9
- Niue is a raised coral atoll approximately 500 km west of the Cook Islands. With a land area of 267 km2 it is of moderate size, although it suffers from poor soil quality and an uneven water supply. Nineteenth century population estimates, taken at a time when the indigenous culture was still dominant, were in the range 4,000 - 5,000. Principal foods included taro, yams, coconuts, and fish. Radiocarbon dates (Anderson and Walter 2002) suggest that Niue was settled by 2000 BP, well before Pukapuka.
- 5.10
- Society was organized around the village. Heredity seems to have been the means for establishing status within the family but it did not prevail in larger political units. Chiefs took their positions by force with little attempt to justify themselves via the complex genealogies common in the rest of Polynesia (Goldman 1970).
- 5.11
- Niue was divided into two major political units, Motu in the north and Tafiti in the south. After centuries of conflict, neither was able to achieve ascendancy over the entire island. Roscoe (1993) cites Niue's isolation and its challenging ecology as reasons why it was never able to develop a strong central political hierarchy as occurred on comparably sized Tongatapu.
- 5.12
- Warfare was endemic on Niue. Goldman (1970) concludes that Niuean chiefs were "more aggressive than political", i.e. that violence had taken on a life of its own independent of political motivation. North fought south, village fought village, and neighbor fought neighbor. Again, Goldman (1970) states that "Short of extermination, they had no means for bringing an end to feuds." Warfare was constant without a mechanism for peacemaking.
- 5.13
- In the language of my simulations, Niue corresponds to a power based warfare scenario, where intra-group violence was allowed and where the leader was highly aggressive. Table 4, which gives results for a warfare situation with leaders having aggression parameters set to 0.75, is the closest match. The simulations predict that only one village will prevail, a disagreement that is most likely due to the relatively small populations involved in the simulations—the rate of violence was too great in the simulations and combat continued until the elimination of one of the contestants. The fraction of altruistic agents is relatively low, consistent with a violent culture. Mutual obligation is also low, suggesting a low level of social cohesion. Although intra-group violence was not included in the scenario described in Table 4, I know from other simulations that, were it allowed, such a population of non-altruistic and aggressive agents would have resulted in a large number of violent deaths.
- 5.14
- The simulations suggest that aggressive leaders are associated with aggressive populations, certainly a point of agreement with Niuean culture. Constant warfare, driven by aggressive leaders, reduced the productivity of the population below the already low limit set by the environment. Violence pervaded the culture of the island, as it did in the simulations for this type of leader. Tolerance was very low, both at the individual and the collective level.
- 5.15
- The larger size of Niue compared to Pukapuka makes the comparison between simulation and observation less exact. In a population of 4500 there is a much greater opportunity for complex social dynamics, including competition between different sub-groups. Losses in battle have a smaller impact on the survival of a large polity than a small one—a population of several thousand can sustain the loss of a dozen males of reproductive age whereas a simulation population of 100 might never recover. Nevertheless, there are enough points of similarity to make the simulations useful in understanding conflict on this island.
Conclusion
- 6.1
- Multi-agent simulation serves a useful role as an aid to interpreting the results of cross-cultural studies and observations of specific societies. While the simulations presented here lack the complexity of human societies, they allow testing of some high-level hypotheses, such as the linkage of intra-group and inter-group violence and the effect of directed activity on violence. They can also suggest alternate explanations of empirical data. For example, strong leaders may be suppressed in small societies out of fear that they could instigate violence threatening to the survival of the population, a compliment to theories based on economic advantage or personal independence. The intention in such relatively simple simulations is to examine the utility of an intermediate level of complexity between narrative analysis and a fully-realistic simulation of a given culture.
- 6.2
- This study involved populations of fixed size arranged in one or two polities. It is of interest to examine how violence scales with population, population density, and the number of distinct groups in close contact with one another. These studies have been undertaken and will be reported in a separate publication.
Appendix 1: Pseudocode for the Simulation
- 7.1
- The code used for the simulations described above consisted of approximately 4900 lines of code written in Visual Basic. A 100 agent simulation executed on a 3 GHz personal computer took approximately 2-3 hours, depending on the options included. The following pseudocode is intended to give the reader an understanding of the sequence of actions performed in the code.
Main Agent Decision Routine:
FOR each agent:

IF agent is female, has no mate, and has reached reproductive age THEN
	SELECT male with whom female has highest interaction matrix element
PLACE mated female at same location as her mate

SENSE the environment and store the location of food sources and villages

COMMUNICATE normative reputation with collocated agents

IF the agents are on an attack mission THEN
CONTINUE that mission until clock = 0.75 * (length of day)
	END IF

	IF the agent is under orders from its leader to collect food AND clock < (Leader
drive * length of day THEN

IF not already carrying food then
CALL food routine
			EXIT main agent decision routine
		END IF

		IF carrying food then
			CALL movement routine to return to village
			EXIT main agent decision routine
		END IF

	END IF

IF hunger > 0.5 maximum hunger AND clock < 0.75 * length of day THEN
CALL food routine
EXIT main agent decision routine
END IF

If clock > 0.75 * length of day THEN
CALL movement routine to return to village
		EXIT main agent decision routine
	END IF

CALL movement routine to explore landscape

END agent decision routine
Food Routine:
IF the agent is carrying food THEN eat all of that food

IF the agent is at a food source THEN
	Eat food to reduce hunger to zero
	IF food remains at the food source, collect up to maximum carry capacity
	EXIT food routine
ELSE
SEARCH memory of agent to find nearest food source with food at time of last observation
	IF agent remembers a food source with food THEN
MOVE one square in the direction of that food source
	ELSE
CALL movement routine to move one square in a random direction in search of food
	END IF
END IF

END food routine
Movement routine:
SENSE the environment by storing the location of all agents and food sources within sensory range

STORE the locations of all food sources, along with the amount of food and the time of observation,
in the agent's memory

IF the flight option is enabled AND there is an agent within sensory range for whom the active agent
has a negative interaction matrix element THEN move one square away from that agent AND EXIT the movement routine

IF the agent is searching for food AND the agent is at a food source THEN
	Eat food to reduce hunger to zero
	IF food remains at the food source, collect up to maximum carry capacity
	EXIT the movement routine
ELSE
	IF agent has sensed a food source that has food THEN
MOVE one square in the direction of that food source
	ELSE
MOVE one square in a random direction in search of a food source that is in supply
	END IF
END IF
Communication routine:
Sharing
IF there are other agents at the same location AND the active agent is carrying food AND
the ratio (agent hunger / maximum hunger) < the agent's altruism parameter THEN
COUNT the number of agents at that location who are not carrying food
CALCULATE a share as the amount of food carried by the active agent divided by the number of counted agents
GIVE a full share to agents of the same group as the sharer and one half share to agents of a different group
ADD the amount shared to the interaction matrix element imx (receiver, sharer) of each agent
END IF
Stealing
IF there is another agent at the same location who is carrying food AND
the active agent is not carrying food AND [(agent hunger / maximum hunger before death) > the agent's altruism parameter] AND
[(agent hunger / maximum hunger) > ( 1 - agent's aggression parameter)] THEN
IF active agent has larger aggression parameter AND larger fighting ability parameter THEN
		TAKE all of the food carried by the other agent
REDUCE the interaction matrix element imx(victim, thief) by the amount of food stolen
ELSE
IF violence is permitted between this pair of agents AND the active agent has a larger aggression parameter
AND the other agent has a larger fighting ability parameter THEN
The active agent is killed
DEDUCT an amount equal to an agent lifetime from the interaction matrix elements imx(collocated, killer)
for all agents who were of the same group as the agent killed and who were collocated with the killing
EXIT communication routine
ELSE
IF active agent has larger fighting ability parameter and a smaller aggression parameter than the other agent THEN
The other agent is killed
The food carried by the other agent is taken by the active agent
DEDUCT an amount equal to an agent lifetime from the interaction matrix elements imx(collocated, killer)
for all agents who were of the same group as the agent killed who were collocated with the killing

		END IF
	END IF
END IF
Revenge
FOR all other agents at the same location as the active agent
	IF the interaction matrix element imx(active agent, other agent) < 0 THEN
IF the active agent has a higher fighting ability parameter than the other agent THEN
			The other agent is killed
DEDUCT an amount equal to an agent lifetime from the interaction matrix elements imx(collocated, killer)
for all agents who were of the same group as the agent killed who were collocated with the killing
ELSE
		The active agent is killed
DEDUCT an amount equal to an agent lifetime from the interaction matrix elements imx(collocated, killer)
for all agents who were of the same group as the agent killed who were collocated with the killing
END IF
	END IF
NEXT AGENT
Share normative reputation of other agents
FOR all other agents j at the same location at the active agent
	FOR all agents k
IF either the active agent or agent j has a non-zero interaction matrix element imx(agent, k) THEN
imx(active, k) = _ (imx(active, k) + imx(j, k))
imx(other, k) = _ (imx(active, k) + imx(j, k))
NEXT AGENT k
NEXT AGENT j
Agent reproduction
IF the active agent is collocated with its mate
AND 0.25 * (agent lifetime) < male age < 0.75 * (agent lifetime)
AND 0.25 * (agent lifetime) < female age < 0.75 * (agent lifetime)
AND (RANDOM NUMBER) < 0.0045
THEN
	SET parameters of a new agent
		Location is same as parents
		Group is same as parents
		Equal probability of male or female
		Random aggression parameter
		Random fighting ability parameter
		Altruism parameter:
			1/3 chance of mother's altruism parameter
			1/3 chance of mother's altruism parameter + 0.1
			1/3 chance of mother's altruism parameter - 0.1
END IF
Leader Selection routine:
IF leader selection is RANDOM THEN
SELECT an agent at random from the designated home village and make him leader
IF the drive and/or altruism parameters are fixed THEN set the leader's drive and altruism to the desired values

	IF leader selection is by HEREDITY THEN
		SELECT the eldest son of the current leader as the next leader
IF the leader has no son THEN chose the eldest brother of the leader as the next leader AND
assign the eldest brother's son as the subsequent leader
IF the leader has no son and not brothers THEN use the MERIT scheme

	IF leader selection is by MERIT THEN
SELECT the agent with the highest value of altruism + drive from the designated home village
and make him the new leader

	IF leader selection is by POPULARITY THEN
SELECT the agent with the highest value of the sum of the interaction matrix elements linking
him to all other agents of the designated home village

	IF leader selection is by PRESTIGE THEN
SELECT the agent with the highest value of prestige from the designated home village
Leader Decision routine:
IF the leader's drive parameter * length of day > clock THEN all agents at the home village are ordered to collect food
ELSE all agents at the home village are free of any leader order
ENDIF
IF the leader's hunger factor is > 0.5*maximum hunger THEN allow the leader to consume food stored at the home village
IF the WARRIOR option is enabled THEN ADD 0.01 to the fighting strength of each male at the home village
to a maximum fighting strength of 1.0 at a cost of 0.5 food points deducted from the village storage per warrior
IF there is insufficient food at the home village THEN REDUCE the fighting strength of each warrior by 0.01
but not below a fighting strength of 0.5
ENDIF
War routine:
Decision to Conduct Warfare
The leader of the village remains at the village

IF WARCAUSE = POWER THEN SELECT the enemy village WHERE the attacking village's leader's power * warfactor
is greater than the largest compared to any potential enemy village leader's power AND
where there is food stored  at the enemy village

IF WARCAUSE = REVENGE THEN SELECT the enemy village WHERE the power of the attacking leader is at least
0.5 * power of potential enemy leader AND where the potential enemy village has the lowest sum of interaction
matrix elements linking it to the attacking village AND where the sum of interaction matrix elements linking
it to the attacking village is less than the parameter warfactor AND where there is food stored  at the enemy village

IF WARCAUSE = PRESTIGE THEN SELECT the enemy village with the smallest value of leader prestige WHERE
the attacking village's leader's prestige is greater than warfactor * enemy leader prestige AND
where there is food stored  at the enemy village

IF WARCAUSE = NEED THEN SELECT the enemy village with the largest value of the warfactor *
(sum of the food at the food sources controlled by it plus food stored at its home village)

ORDER all males located at the home village to begin to attack the designated enemy village
during their next action step
Combat
MOVE the active agent toward the enemy village
IF the active agent is at the same location as an agent from the enemy village THEN
IF the enemy agent has a higher fighting strength
THEN the attacking agent is killed and no revenge is implied against the defending agent
ELSE the enemy agent is killed, any food that it is carrying is stolen
DEDUCT an amount equal to an agent lifetime from the interaction matrix elements imx(collocated, killer)
for all agents who were of the same group as the agent killed who were collocated with the killing
ADD an amount equal to an agent lifetime plus the amount of food stolen to the prestige of the attacking agent
ADD an amount equal to an agent lifetime plus the amount of food stolen to the prestige of the leader
of the attacking agent's village
		ENDIF
	ENDIF
	IF the attacking agent is at the enemy village THEN
COLLECT food from the enemy shelter to the maximum carrying capacity of the attacking agent
DEDUCT the amount of food stolen from the imx matrix elements of the enemy agents present at their home shelter
RESET attacking agent's orders to return food to its home shelter
	ENDIF
References
-
ANDERSON A and Walter R (2002) Landscape and culture change on Niue island, west Polynesia. In Ladefoged T N and Graves M W (Eds.) Pacific Landscapes: Archaeological Approaches. Easter Island Foundation.
BEAGLEHOLE E and Beaglehole P (1938) Ethnology of Pukapuka. Honolulu: Bernice P. Bishop Museum Press.
BERGERON N and Schneider B H (2005) Explaining cross-national differences in peer-directed aggression: A quantitative synthesis. Aggressive Behavior 31. pp. 116-137. [doi:10.1002/ab.20049]
BETZIG L and Wichimai S (1991) A not so perfect peace: A history of conflict on Ifaluk. Oceania 61. pp. 240-256. [doi:10.1002/j.1834-4461.1991.tb01597.x]
BOEHM, C (1993) Egalitarian society and reverse dominance hierarchy. Current Anthropology, 34. pp. 227-254. [doi:10.1086/204166]
BOEHM C (1999) Hierarchy in the Forest: The Evolution of Egalitarian Behavior. Cambridge, MA: Harvard University Press.
BOROFSKY R (2003) Private communication.
CAMPBELL I C (1989) A History of the Pacific Islands. Berkeley: University of California Press.
COSER L A (1956) The Functions of Social Conflict. Glencoe: Free Press.
DORAN J (2005) Iruba: An agent-based model of the guerrilla war process. In Troitzsch K G and Folbach (Eds.) Representing Social Reality, pre-proceedings of the Third Conference of the European Social Simulation Association (ESSA), Koblenz, Sept 5-9, 2005. pp. 198-205.
EMBER C R and Ember M (1992) Resource unpredictability, mistrust, and war: A cross cultural study. J. Conflict Resolution 36. pp. 242-262. [doi:10.1177/0022002792036002002]
FEINMAN G and Neitzel J. (1984) Too many types: An overview of sedentary prestate societies in the Americas. Advances in Archaeological Method and Theory 7. pp. 39-102. [doi:10.1016/b978-0-12-003107-8.50007-4]
GOLDMAN I (1970) Ancient Polynesian Society. Chicago: University of Chicago Press.
HAYDEN B (1972) Population control among hunter-gatherers. World Archaeology 4. pp. 205-221. [doi:10.1080/00438243.1972.9979533]
HOGBIN H (1978) The Leaders and the Led: Social Control in Wogeo, Papua New Guinea. Carlton: Melbourne University Press.
KEELEY L H (1996) War Before Civilization: The Myth of the Peaceful Savage. Oxford: Oxford University Press.
KELLY R C (2000) Warless Societies and the Origin of War. Ann Arbor: University of Michigan Press.
KIRCH P V (1984) The Evolution of Polynesian Chiefdoms. Cambridge: Cambridge University Press.
LEVY R (1973) Tahitians: Mind and Experience in the Society Islands. Chicago: University of Chicago Press.
LOFTIN C K (1971) Warfare and Societal Complexity: A Cross-Cultural Study of Organized Fighting in Preindustrial Societies. Unpublished PhD thesis. University of North Carolina at Chapel Hill.
MALINOWSKI B (1941) An anthropological analysis of war. American J. Sociology 46. pp. 521-550. [doi:10.1086/218697]
MURPHY R F (1957) Intergroup hostility and social cohesion, American Anthropologist 59. pp. 1018-1035. [doi:10.1525/aa.1957.59.6.02a00070]
OLIVER D L (1989) Oceania: The Native Cultures of Australia and the Pacific Islands. Honolulu: University of Hawai'i Press.
OTERBEIN K F (1968) Internal war: a cross cultural study. American Anthropologist 70. pp. 277-289. [doi:10.1525/aa.1968.70.2.02a00040]
OTERBEIN K F and Oterbein C S (1965) An eye for an eye, a tooth for a tooth: A cross cultural study of feuding. American Anthropologist New Series 67. pp. 1470-1482. [doi:10.1525/aa.1965.67.6.02a00070]
ROSCOE P B (1993) Practice and political centralization: A new approach to political evolution. Current Anthropology 34. pp. 111-140. [doi:10.1086/204149]
ROSS M H (1985) Internal and external conflict and violence: Cross cultural evidence and a new analysis. Journal of Conflict Resolution 29. pp. 547-579. [doi:10.1177/0022002785029004001]
SAHLINS M D (1958) Social Stratification in Polynesia. Seattle: University of Washington Press.
SAHLINS M D (1963) Poor man, rich man, big-man, chief: Political Types in Melanesia and Polynesia. Comparative Studies in Society and History 5. pp. 285-303. [doi:10.1017/S0010417500001729]
SAHLINS M D (1972) Stone Age Economics. New York: Aldine de Gruyter.
SIMMEL G (1955) Conflict. Glencoe: Free Press.
WILLIAMSON R W (1939) Warfare in Central Polynesia. In Piddington R (Ed.) Essays in Polynesian Ethnology. Cambridge: Cambridge University Press.
YOST J A (1981) Twenty Years of Contact: The mechanisms of change in Wao (Auca) culture. In Whitten N A (Ed.) Cultural Transformations and Ethnicity in Modern Ecuador. Urbana, IL: University of Illinois Press.
YOUNGER S M (2003) Discrete Agent Simulation of the effect of simple social structures on the benefits of resource sharing. Journal of Artificial Societies and Social Simulation 6 (3) 1. https://www.jasss.org/6/3/1.html.
YOUNGER S M (2004) Reciprocity, sanctions, and the development of mutual obligation in egalitarian societies. Journal of Artificial Societies and Social Simulation 8 (2) 9. https://www.jasss.org/8/2/9.html
YOUNGER S M (2005) Violence and revenge in egalitarian societies. Journal of Artificial Societies and Social Simulation 8 (4) 11. https://www.jasss.org/8/4/11.html
YOUNGER S M (2008) Conditions and mechanisms for peace in precontact Polynesia. Current Anthropology 49. pp. 927-934. [doi:10.1086/591276]
YOUNGER S M (2009) Violence and warfare in the pre-contact Caroline Islands. Journal of the Polynesian Society 118. pp. 135-164.
YOUNGER S M (2010) Leadership in small societies. Journal of Artificial Societies and Social Simulation 13 (3) 5. 2010. https://www.jasss.org/13/3/5.html