
 Abstract
- We explore the impact of age on cultural change through simulations of cultural evolution. Our simulations show that common observations about the relationship between old and young naturally emerge from repeated cultural learning. In particular, young individuals are more open to learn than older individuals, they are less effective as cultural models, and they possess less cultural traits. We also show that, being more open to learning, young individuals are an important source of cultural change. Cultural change, however, is faster in populations with both young and old. A relatively large share of older individuals, in fact, allows a population to retain more culture, and a large culture can change in more directions than a small culture. For the same reason, considering age-biased cultural transmission in an overlapping generations model, cultural evolution is slower when individuals interact preferentially with models of similar age than when they mainly interact with older models.
- Keywords:
- Cultural Evolution, Cultural Transmission, Cultural Change, Age, Age-Biased Transmission, Openness
Introduction
- 1.1
- It is a common motif that young individuals oppose ideas and values of older generations while older individuals complain about the habits of young and their lack of respect for traditions. Sociological and psychological studies support the idea that contemporary young tend to have relatively unstable attitudes, and that attitudes' stability increases with age (Ryder 1965; Alwin & Krosnick 1991). Similarly, many researches had shown that older people tend to be more conservative than younger ones, where conservatism is broadly intended as a resistance to change values and attitudes as well as a tendency to defend the status quo (Feather 1977; Ray 1985; Truett 1993; Cornelis et al 2009). While these tendencies may be stronger in contemporary western societies because of specific conditions such as sustained economic growth and extended education, the anti-conformist attitude of youth (at least from the point of view of older individuals) seems to hold historically (Levi & Schmitt 1997) and cross-culturally (Amit-Talai & Wulff 1996). Levi and Schmitt (1997), for example, report that in medieval Italy elders were deeply concerned about young men's associating and developing their own rituals and cultural practices.
- 1.2
- Here we study this phenomenon through simulations of cultural evolution, showing that these common observations may naturally emerge from repeated cultural learning. We further explore how the age structure of a population (i.e., the relative share of young and old individuals) as well as age-biased cultural transmission (i.e., the fact that individuals may interact preferentially with cultural models of a particular age) influence the rate of cultural change.
- 1.3
- Research in cultural evolution investigates how different social learning strategies (Rendell et al. 2011) or different learning biases (Henrich & McElreath 2003) influence cultural processes. Empirical evidence supports the existence of various age-related biases in humans (Harris 1999) and other species (Dugatkin & Godin 1993). However, to our knowledge, few models explicitly considered the effects of age-biased cultural transmission and of individual development on cultural dynamics.
- 1.4
- This research expands previous work on how openness and conservatism - defined as the propensity (or lack thereof) to learn from others - develop in individuals and how they change in cultural evolution (Ghirlanda et al 2006; Acerbi et al 2009;Ghirlanda et al. 2010,Acerbi et al. 2012). The main assumption of this work is that cultural traits are associated with preferences that encode individual's attitudes toward them (e.g. liking/disliking): individuals base their decision to copy from others on their preferences for the cultural traits others bear. Moreover, both traits and preferences can be transmitted in cultural interactions, meaning that individuals are able not only to copy from others actual cultural traits, but also their "attitudes" towards cultural traits.
- 1.5
- The results show that effective cultural models, i.e., individuals that are often copied by others, are relatively conservative. To understand this somewhat surprisingly result, one has to consider that conservative individuals copy less, and thus maintain a stable set of cultural traits that can be repeatedly observed by others. This will augment the probability that those traits (including the conservative attitude) will be copied (see also Tanaka et al (2009) for the suggestion that the persistence of - ineffective - traditional medicine may be favoured by the same principle). On the other hand, the advantage of conservativeness is balanced by the need of remaining open to acquire traits that are preferred by others, especially if many traits are present in a population, or when traits change rapidly (Acerbi et al. 2009, Acerbi et al. 2012).
- 1.6
- Here, we reproduce these simulations showing that, assuming newborn individuals are maximally open to copy and they are born without any cultural traits, repeated learning and the coevolution between traits and preferences naturally generate age-related changes in the share of culture possessed, in the degree of openness/conservativeness, and in the effectiveness of individuals as cultural model. Young individuals acquire cultural traits progressively through their life, and they are typically more open than older ones., while old individuals are, on average, more effective cultural models. We further evaluate the influence of age on cultural change in two ways. First, we manipulate the age structure of the population by varying the expected lifetime of individuals. Young individuals will be predominant in populations with short expected lifetime while older individuals will be relatively more common as the expected lifetime increases. Second, we consider age-biased cultural transmission by introducing biases such that individuals are more likely to interact with older individuals ("elder bias") or with individuals of similar age ("peer bias").
Methods
-
Basic simulation
- 2.1
- We simulate a population of N = 100 individuals for T = 20.000 time steps. Cultural traits are absent at the beginning of the simulation, and are subsequently introduced with a probability of innovation Uq = 0.001 per individual per time step (a new trait appears, on average, every 10 time steps). Each innovation results in the introduction of a new trait. We describe each individual by variables qi that encode whether the individual lacks ( qi = 0) or possesses ( qi = 1) any of the cultural traits present in the population, and by variables pi that encode the individual's preferences for each trait. Preferences range continuously from -1 (strong dislike) to 1 (strong liking). When a new trait appears in the population, individual preferences for that trait are randomly assigned.
- 2.2
- Traits and preferences are stored, for each individual, as a vector of the size of the total number of cultural traits present at any time step in the population and they can change both through individual and social learning.
- 2.3
- At each time step, each individual interacts with a randomly chosen model and observes her traits. The decision to copy is determined by the observer's preferences for the model's traits. We first calculate the overall preference as:
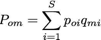
(1) where poi is the i -th preference of the observer, qmi is the i -th trait of the model, and S is the number of traits present in the population. The overall preference results in a probability to copy according to:
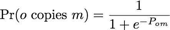
(2) - 2.4
- This means that when an observer is "indifferent" towards a model ( Pom is around 0), her probability to copy is approximately 0.5, which increases towards 1 when the model has traits for which the observer has strong positive preferences. Conversely, if the observer has a strong dislike for the model's traits, the probability to copy is near 0. When an observer copies a model, she copies the model's values for a randomly chosen trait-preference pair. Notice that we are assuming that an observer may abandon a trait, if the trait randomly chosen is not possessed by the model. The rationale is that observers can decide to abandon a cultural trait if they observe an effective cultural model that does not show it.
- 2.6
- Preferences can also change spontaneously. We assume a probability Up = 0.01 per individual per time step that a preference is reset to a random value between -1 and 1. Note that we are assuming that Up > Uq, i.e. individual changes are more likely to result in modifications of preferences than in the introduction of new traits.
- 2.7
- Lastly, individuals are replaced with a probability r = 0.01 per individual per time step, resulting in an average lifetime of τ = 100 time steps, i.e., 100 cultural interactions with others. New introduced individuals are culturally naive, i.e., they do not possess any trait ( qi = 0 for all I = 1, … , S). They are also assumed to be maximally open to cultural influence, i.e., pi = 1 for all i = 1, … , S. The pseudo-code for the simulation can be found in the appendix.
Varying the lifetime of individuals
- 2.8
- In these simulations we vary the expected lifetime by manipulating the replacement rate of individuals, resulting in expected lifetimes of 25, 50, 100, 200, 400 time steps, corresponding to an equal number of cultural interactions. A shorter lifetime corresponds to the population being composed, on average, of younger individuals, while individuals will be on average older as the expected lifetime increases.
Age-biased cultural transmission
- 2.9
- In these simulations we keep the average lifetime fixed at 100 time steps, but manipulate the patterns of cultural interactions. In the base simulation, individuals meet at random, independently of their age. We devise two interaction biases, which we label "peer bias" and "elder bias" that modify the likelihood of an interaction to happen according to the age of observer and model. When interactions are peer biased, three potential models are randomly picked from the population, and the observer interacts with the one whose age is most similar to herself. Analogously, in elder biased interactions, three potential models are randomly picked, but in this case the observer interacts with the eldest.
- 2.10
- Figure 1 shows how the two biases modify the average difference between models' age and observers' age in the simulations. The random pattern of the base simulation (black line) results in a linear relationship between the age of the observer and the age difference between the observer and model. In other words, young individuals tend to interact with older individuals and vice-versa. Peer biased transmission (red line) "smooths" this relationship resulting in individuals interacting with those of similar age, while elder biased transmission (blue line) results in the overwhelming majority of individuals interacting with older ones.
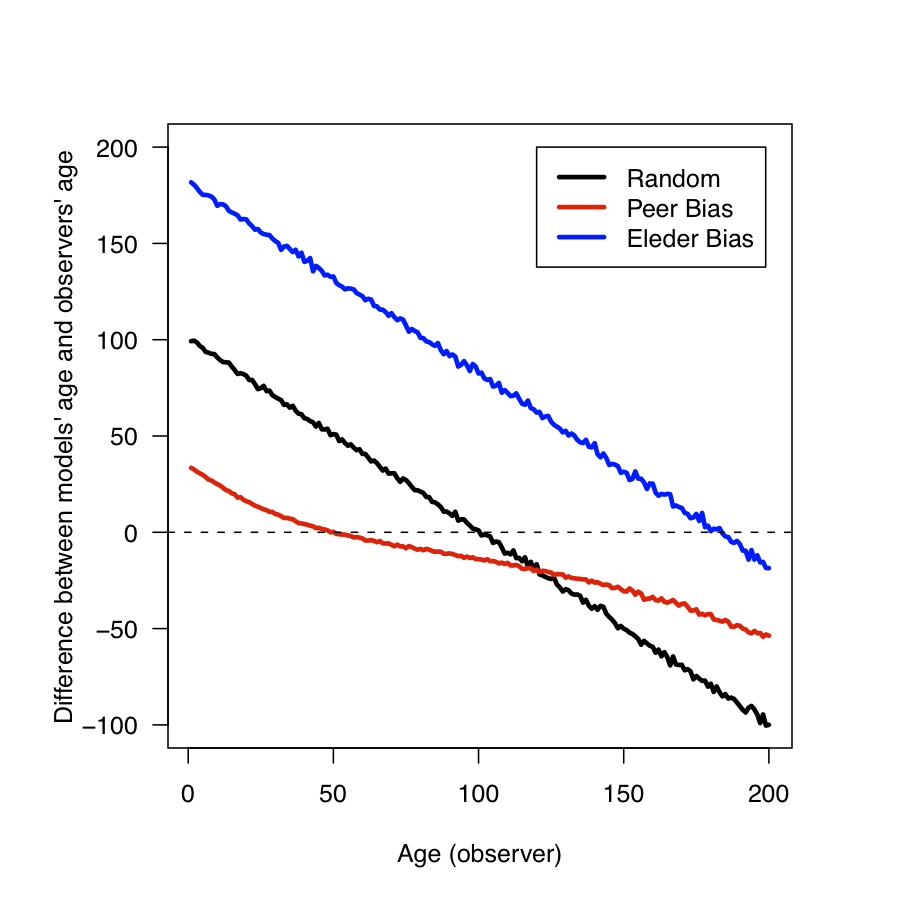
Figure 1. Average difference between models' age and observers' age versus age of the observer for three patterns of cultural interactions (Simulations on age-biased cultural transmission). Data are collected on the last 5.000 time steps of 30 runs of the simulation for each condition.
Results
- 3.1
- Figure 2 summarizes the effects of age on individual characteristics in the basic simulation. First, we consider how the proportion of successful transmissions is influenced by the age of observers and models. We define "successful transmission" an interaction between two individuals that results in the observer copying a trait-preference pair from the model, and "unsuccessful transmission" an interaction in which this does not happen. Figure 2a shows that successful transmissions decrease with observer age. Younger individuals indeed tend to copy more than older individuals, both because they are more open (see Introduction) and because they tend, given the age structure of the population, to interact with individuals older then themselves. Older individuals, in fact, have had more time to acquire cultural traits and thus are more effective culture models. For the same reasons, Figure 2b shows that successful transmissions increase with model age. Finally, Figure 2c shows the time course of enculturation: individuals are born without culture and they acquire cultural traits progressively throughout their life.
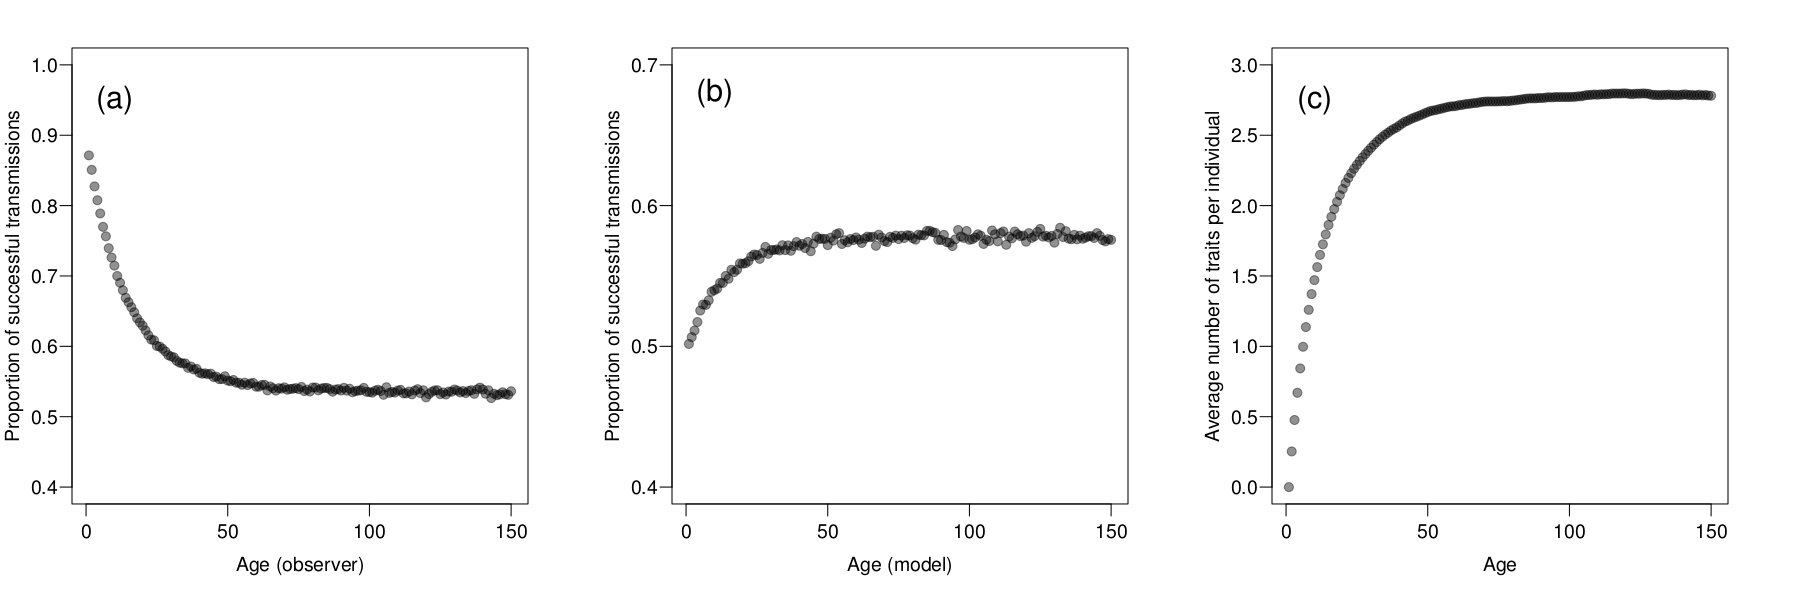
Figure 2. Summary of results of the basic simulation. (a) Proportion of successful transmissions versus observers' age. (b) Proportion of successful transmissions versus models' age. (c) Average number of cultural traits per individual versus age. Data are collected on the last 5.000 time steps of 30 runs of the simulation for each condition. - 3.2
- We now examine how varying the age structure of populations and introducing an age-biased cultural transmission affect the rate of cultural change and the size of culture. To measure the rate of cultural change we consider the Euclidean distance between the culture of a population (the matrix represented by individual vectors of cultural traits) at any successive time step and we average this measure on the total number of time steps for which we calculated the distances (5.000). The size of culture is measure as the number of different cultural traits present in the population.
- 3.3
- Figure 3 summarizes the results of simulations in which the expected lifetime of individuals is varied. Increasing the number of young individuals in the population has a complex effect on the velocity of cultural change (see Figure 3a). A younger population generally changes more rapidly, but not if the expected lifetime is too short. To understand this result is necessary to consider the effect of young individuals on the size of culture (see Figure 3b). Populations mainly composed by young individuals indeed can maintain less culture. This follows naturally from the fact that young individuals are culturally naive, and thus need time to acquire culture. If the expected lifetime is relatively short, newly introduced traits have a higher probability of dying with their inventors without having been transmitted to others. Since younger populations can support less culture, and they are mainly composed of individuals who are ineffective cultural models (see Figure 2b), even though individuals in a young population are potentially willing to copy there are few traits to copy as well as few successful interactions. Hence the cultural composition of the population changes more slowly.
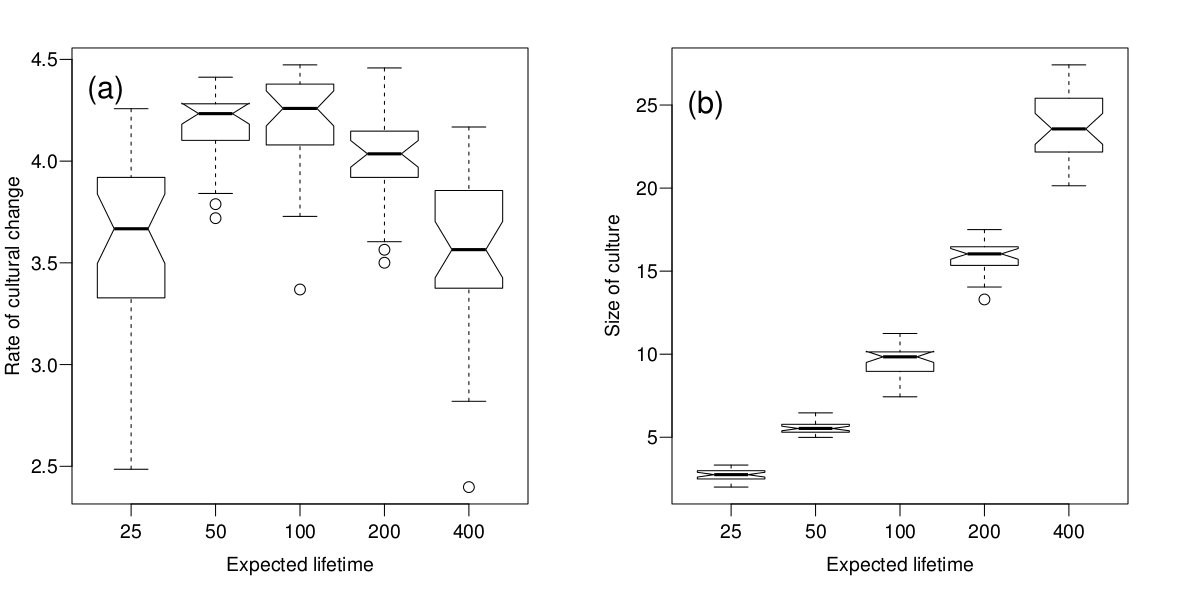
Figure 3. Summary of results of simulations in which we varied the expected lifetime of individuals. (a) Rate of cultural change versus different expected individuals' lifetimes.(b) Size of culture (total number of traits maintained in the population) versus different expected individuals' lifetimes. Boxes represent the interquartile range of the data. The horizontal lines inside the boxes indicate the median values. The horizontal lines outside the boxes indicate the minimum and maximum values. Circles represent outliers. The boxes' notches give an indication of a 95% confidence interval for the difference in medians (R development Core Team 2011). Data are collected on the last 5.000 time steps of 30 runs of the simulation for each condition. - 3.4
- A similar effect is apparent in the results from simulations of age-biased cultural transmission (see Figure 4). Elder biased cultural transmission produces larger cultures, because older individuals are more effective at transmitting their traits, and have had more time to acquire them (Figure 4b). As a consequence, even if older individuals are more conservative, the rate of change is similar, or at times higher, than in the condition in which individuals meet at random (see Figure 4a). Peer biased cultural transmission, on the other hand, leads young individuals to interact preferentially with other young individuals, which results in a smaller and more slowly changing culture for the same reasons explained for simulations in which young individuals outnumber older ones.
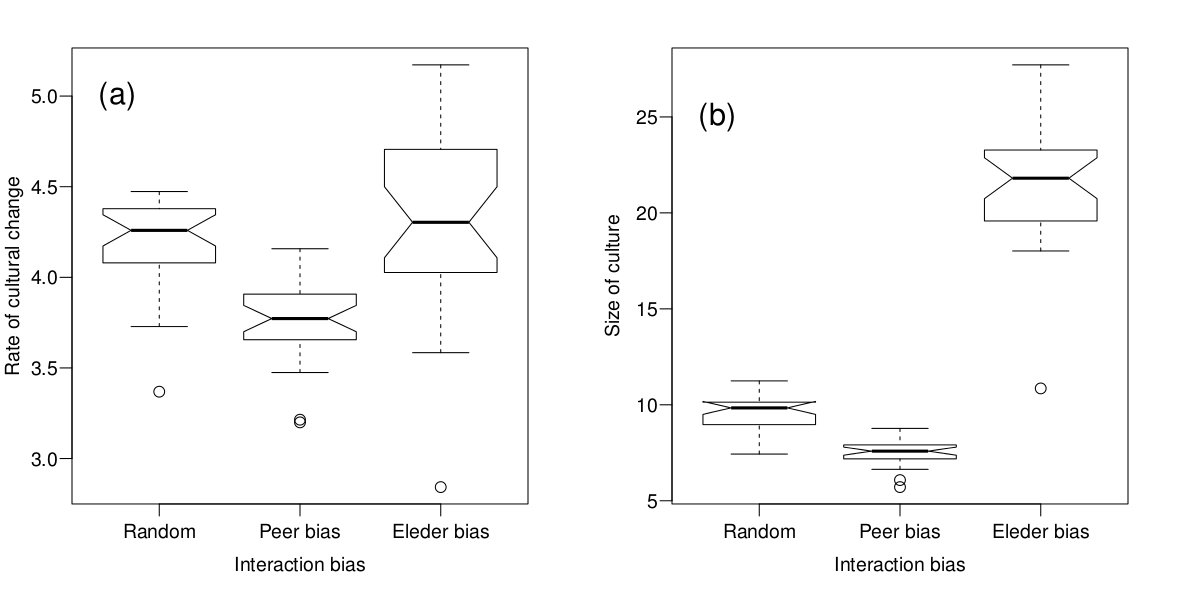
Figure 4. Summary of results of simulations of age-biased cultural transmission. (a) Rate of cultural change versus different interaction biases. (b) Size of culture (total number of traits maintained in the population) versus different interaction biases. Boxes represent the interquartile range of the data. The horizontal lines inside the boxes indicate the median values. The horizontal lines outside the boxes indicate the minimum and maximum values. Circles represent outliers. The boxes' notches give an indication of a 95% confidence interval for the difference in medians (R development Core Team 2011). Data are collected on the last 5.000 time steps of 30 runs of the simulation for each condition.
Discussion
- 4.1
- We showed that repeated learning and the coevolution between traits and preferences naturally generate age-related individual characteristics. Young individuals have less cultural traits than older individuals, openness to copy decreases with age, while effectiveness as cultural models increases.
- 4.2
- Further, by varying the age structure of the population as well as considering age-biased cultural transmission, our simulations confirmed the intuition that young individuals are an important source of cultural change, but also showed the importance of older individuals. Populations composed mainly by young individuals, or where young individuals interact preferentially with individuals of the same age, change at a slower pace than mixed populations, or where young individuals learn preferentially from older. Older individuals are necessary to maintain larger amounts of culture (a result echoing Acerbi & Parisi 2006) and a large culture allows more possibilities for change than a small culture. Faster-changing cultures are therefore composed by both young and old individuals, with young individuals being open to copy and older individuals acting as “supplies” of cultural traits.
- 4.3
- The decrease of openness with age agrees with empirical studies of personality changes (see Acerbi et al. 2009). Here we considered newborn individuals as maximally open to cultural influence, so even random drift would produce a decrease with age. That such a decrease is rather the result of directional forces arising from repeated cultural transmission can be proved analytically in simple models (Ghirlanda et al. 2006, Acerbi et al. 2009, Ghirlanda et al. 2010). Computer simulations, moreover, show that openness decreases with age for any initial value of p greater the zero (data not shown). Lastly, openness does not change indefinitely with age, but reaches a stable value in old individuals (Acerbi et al. 2009), which is not expected under drift dynamics.
- 4.4
- In our analysis, we varied the age structure of the population varying the expected lifetime of individuals, keeping the population size constant. It is important to note that we purposely used in our model an oversimplified demographic structure. In a real human population, the variation of expected lifetime of individuals is inherently linked to population growth and decline, and thus to the variation of population size. However we believe that including in the model a more realistic demographic structure would not qualitatively change our main results, since they only depend on the ratio of young and old individuals.
- 4.5
- Moreover, we assumed that, when copying, observers choose a model's trait-preference pair at random, among the cultural traits present in the population. The rationale behind this is that individuals, when observe a preferred model, may copy one of her trait independently from the attraction for the specific trait. In other words, we copy a film star's hairstyle not because we like the hairstyle per se, but exactly because the film star adopted it. While this phenomenon is well supported by observations of human social learning (Bandura 1977, Dalton et al. 2003), extensions of our model might consider the fact that individuals choose to copy the most preferred trait or, conversely, to abandon the less preferred trait if they don't observe it in the model.
- 4.6
- On the other side, we believe that our implementation of age-dependent cultural transmission, realized through biases towards interacting with older or same-age individuals may represent a useful alternative to the common discrete generations models of cultural evolution. Previous research on age-biased cultural transmission (starting from Cavalli-Sforza & Feldman 1981, see also McElreath & Strimling 2008) has used a discrete generations model in which cultural transmission can be classified as vertical (parent to offspring), oblique (older generation to newer generation), or horizontal (within the same generation). Such a clear-cut classification is a simplification of reality as humans have overlapping generations. Our model embodies the same idea, but can be applied to overlapping generations where vertical, oblique and horizontal transmission cannot be identified unambiguously.
Appendix: Pseudo-code for the Simulation
-
// Set initial parameters
r   = 0.01	// replacement rate - r=0.01 corresponds to an average lifetime of 100 time steps
T   = 20000	// number of time steps
N   = 100	// population size
U_q = 0.001	// innovation rate q (introduction of a new trait)
U_p = 0.01	// innovation rate p (random modification of a preference)

// Initialize population
FOR each individual i
	SET age(i) equal to zero
ENDFOR
SET q_mat as an empty matrix	// matrix for cultural traits
SET p_mat as an empty matrix	// matrix for preferences

FOR T time steps

	// Innovate
	FOR each individual i
		innovate q with probability U_q	// introduction of a new trait
		IF innovate q
			add a column of zeros to q_mat	// add to the matrix for cultural traits a column for the new introduced trait
			SET q_mat(i,added column) equal to one // only the innovator has the trait
			add a column to p_mat	// add to the matrix for preferences a column for the new introduced trait
			SET p_mat(all,added column) to random values between -1 and +1 // preferences for new traits are random
		ENDIF
		FOR each traits n in the population
			innovate p with probability U_p // modification of a preference
			IF innovate p
				SET p(i,n) to a random value between -1 and +1 // random modification of a preference
			ENDIF
		ENDFOR
	ENDFOR

	// Copy
   FOR each individual i
  		// find model according to different conditions
       IF random bias
        			assign a model randomly chosen in the population
		ELSE IF peer bias
			randomly chose three models in the population and assign the one with the closest age
		ELSE IF elder bias
			randomly chose three models in the population and assign the older one
		ENDIF

		calculate probability to copy according to equation 1 and 2 in the text

		IF copy
			choose a random trait (x) among all traits present in the population
			SET q(i,x) equal to q(model,x)
			SET p(i,x) equal to p(model,x)
		ENDIF
	ENDFOR

	// Demography
	FOR each individual i
		increase age(i) of one unit
		replace individual with probability r
       IF replace
        	SET age(i) equal to zero
        	SET q(i,all) equal to zero	// newborn individuals don't have cultural traits
        	SET p(i,all) equal to one	// newborn individuals are maximally open
       ENDIF
	ENDFOR

ENDFOR
Acknowledgements
- Work supported by the Uniquely Human project funded by the Swedish Research Council. We thank two anonymous reviewers for their comments on a previous version of this manuscript.
References
-
ACERBI, A., ENQUIST, M. & GHIRLANDA, S. (2012). The logic of fashion cycles. PLoS ONE, 7(3), e32541. [doi:10.1371/journal.pone.0032541]
ACERBI, A., ENQUIST, M. & GHIRLANDA, S. (2009). Cultural evolution and individual development of openness and conservatism. PNAS, 106(45), 18931- 18935. [doi:10.1073/pnas.0908889106]
ACERBI, A. & PARISI, D. (2006). Cultural transmission between and within generations. Journal of Artificial Societies and Social Simulations, 9(1), 9 https://www.jasss.org/9/1/9.html
ALWIN, D. F. & KROSNICK, J. A. (1991). Aging, cohorts, and the stability of sociopolitical orientations over the life span. The American Journal of Sociology, 97(1), 169-195. [doi:10.1086/229744]
AMIT-TALAI, V. & WULFF, H. (eds.). (1996). Youth Cultures: A Cross Cultural Perspective. London: Routledge.
BANDURA, A. (1977). Social learning theory, Englewood Cliffs: Prentice-Hall.
CAVALLI-SFORZA, L. L. & FELDMAN, M. W. (1981). Cultural transmission and evolution: a quantitative approach. Princeton: Princeton University Press.
CORNELIS, I., VAN HIEL, A., ROETS, A. & KOSSOWSKA M. (2009). Age differences in conservatism: Evidence on the mediating effects of personality and cognitive style. Journal of Personality, 77(1), 51-88. [doi:10.1111/j.1467-6494.2008.00538.x]
DALTON, M. A., SARGENT. J. D., BEACH, M. L., TITUS-ERNSTOFF, L., GIBSON, J. J., AHRENS, M. B., TICKLE, J. J., & HEATHERTON, T. F. (2003). Effect of viewing smoking in movies on adolescent smoking initiation: a cohort study. Lancet, 362, 281-285. [doi:10.1016/S0140-6736(03)13970-0]
DUGATKIN, L. & GODIN, J. (1993). Female mate-choice copying in the guppy: Age-dependent effects. Behavioral Ecology 4(4), 289-292. [doi:10.1093/beheco/4.4.289]
FEATHER, N. T. (1977). Value importance, conservatism, and age. European Journal of Social Psychology 7, 241-245. [doi:10.1002/ejsp.2420070209]
GHIRLANDA, S., ACERBI, A., ENQUIST, M. & NAKAMARU, M. (2010). The sometimes evitable route to conservatism and persuasiveness. Current Anthropology, 51(2), 271-272. [doi:10.1086/651259]
GHIRLANDA, S., ENQUIST, M. & NAKAMARU, M. (2006). Cultural evolution develops its own rules. the rise of conservatism and persuasion. Current Anthropology, 47(6), 1027-1034. [doi:10.1086/508696]
HARRIS, J. R. (1999) The Nurture Assumption. New York: Free Press.
HENRICH, J. & McELREATH, R. (2003). The evolution of cultural evolution. Evolutionary Anthropology, 12, 123-135. [doi:10.1002/evan.10110]
LEVI, G. & SCHMITT J. C. (eds.). (1997). A History of Young People in the West. Cambridge: Harvard University Press.
MCELREATH, R. & STRIMLING, P. (2008). When Natural Selection Favors Imitation of Parents. Current Anthropology, 49(2), 307-316. [doi:10.1086/524364]
RENDELL, L., FOGARTY, L., HOPPITT, W. J. E., MORGAN, T. J. H., WEBSTER, M. M. & LALAND, K. N. (2011). Cognitive culture: theoretical and empirical insights into social learning strategies. Trends in Cognitive Science, 15(2), 68-76. [doi:10.1016/j.tics.2010.12.002]
R DEVELOPMENT CORE TEAM (2011). Box Plot Statistics. http://stat.ethz.ch/R-manual/R-devel/library/grDevices/html/boxplot.stats.html Archived at: http://www.webcitation.org/67tnNwdzw
RAY, J. J. (1985). What old people believe: Age, sex, and conservatism. Political Psychology, 6, 525-528. [doi:10.2307/3791086]
RYDER, N. B. (1965). The cohort as a concept in the study of social change. American Sociological Review, 30(6), 843-861. [doi:10.2307/2090964]
TANAKA, M. M., KENDALL, J. L. & LALAND, K. N. (2009). From traditional medicine to witchcraft: Why medical treatments are not always efficacious. PLOS One, 4(4), e5192. [doi:10.1371/journal.pone.0005192]
TRUETT, K. R. (1993). Age differences in conservatism. Personality and Individual Differences, 14, 405-411. [doi:10.1016/0191-8869(93)90309-Q]