
 Abstract
- This paper describes a simulation model of the spatial development of economic activities over time. The key principle addressed is how spatial patterns of economic activity emerge from decisions of individual firms, which are in turn influenced by the existing spatial configuration. A stylized simulation is presented, in which two types of firms grow at different rates, giving rise to split offs and spatial relocations. The influence of the spatial pattern on individual firms' decisions is implemented in various ways, related to well-known effects such as Jacobs and Marshall externalities described in the economic literature and congestion effects. We demonstrate that different assumptions about the spatial scale of these externalities lead to different spatial configurations. Function concentration (Marshall effects) is more likely to lead to the emergence of subcentres with a specific specialisation. However, the spatial scale of the market and agglomeration effects matters. In particular, if Marshall advantages stretch out over a longer distance, more subcentres emerge. Somewhat surprisingly, congestion seems to have a minor impact on the emerging patterns. The simulation outcomes are intuitively plausible, suggesting that micro-simulation is a promising tool for developing forecasting models to support spatial and economic policies. However, they also articulate the need for validation of the behavioural decision rules, in particular by investigating how growth rates and the spatial scale of externalities differs between different industrial sectors.
- Keywords:
- Firm Location, Externalities, Spatial Pattern, Micro-Simulation
Introduction
- 1.1
- The spatial pattern of economic activities is an important determinant of urban development. Locations of firms influence where workers will live, where consumers will buy products and where other firms are located. The locations of firms also impact on transportation flows, since they are important attractors and producers of both personal and freight traffic. Finally, the spatial pattern of firms obviously has a profound impact on the economic viability and conditions for economic growth in a region. Through the decades, therefore, researchers have developed models that describe and predict how spatial patterns of economic activity emerge.
- 1.2
- A rather recent development is the use of micro-simulation models for this purpose. In such models, individual firms rather than the number of firms or employees in a certain spatial unit are modelled. The underlying idea of such approaches is that by modelling individual firms, the processes that are the outcome of the aggregation of behaviours of individual firms (e.g. spatial concentration) can be best understood and most reliably modelled (Benenson et al. 2004). It is important to distinguish at this stage between micro-simulation models and agent-based models. Whereas micro-simulation models encompass all models that are based on representing individual decision-makers (in this case firms) in order to find aggregate effects, agent-based models can be considered a more specific class of models assigning specific characteristics to the individual decision-makers that are modelled that allow to classify them as agents (Grimm et al. 2006; Macal and North 2010). In particular, agents are assumed to be self-directed, implying that they make independent decisions in response to information acquired from their environment. In addition, agents are assumed to be social, in the sense that they interact with and exchange information with other agents and are able to recognize characteristics of other agents. Agents are also assumed to be adaptive, meaning that they are able to learn from experiences and their environment and consequently change behavioural rules. These behaviours are supposed to lead to goals and agents (in order to learn and adapt) will compare the outcomes of their behaviours to their goals. Finally, agents are typically heterogeneous, in the sense that they differ in terms of salient characteristics. To the authors' knowledge agent-based models of economic development meeting the above definition are not yet existing. However, in land use and housing models, various examples exist of models that describe how aggregate patterns of land use or price levels emerge from the behaviour of agents as defined Macal and North (2010). Since a detailed discussion of these models is beyond the scope of this paper, we refer housing market and land use models (Berger 2001; Brown et al. 2006; Diappi et al. 2008; Ettema 2010; Ettema 2011; Filatova et al. 2009; Magliocca et al. 2011; Parker and Filatova 2008) for more details about these various approaches and limit our discussion to micro-simulation models of spatial economic development in the remainder.
- 1.3
- A first type of micro-simulation models used (UrbanSim, SimFirms, ILUMASS) describes the evolution of spatial economic systems as a stochastic process, in which events such as firm growth, firm relocation, spin offs and take place with a probability that is predominantly a function of firm characteristics. In UrbanSim (Waddell 2002), economic activity is represented in terms of individual jobs, which are taken from an independent economic forecasting model, and are exogenous to the model. The jobs are treated as independent entities (i.e. not organised in firms), which are distributed across grid cells. ILUMASS (Moeckel 2005) applies a more elaborate economic component. In particular, it uses a synthetic database of firms, which may take decisions regarding relocation, growth and closure. In addition, new firms may emerge at a particular birth rate, which is specific per sector and dependent on general economic growth rates. One of the most elaborate micro-simulation models of firms' developed to date is SIMFIRMS (Van Wissen 2000). This model distinguishes the same events as ILUMASS (birth, growth, (re-) location, closure) but uses more sophisticated behavioural rules, accounting for such factors as market stress, spin offs of existing firms, age effects and spatial inertia in the case of relocation. Market stress is related to the concept of carrying capacity, which, analogous to the ecological concept, indicates the maximum number of firms that an urban system can contain. Carrying capacity is operationalised as the difference between market supply and market capacity, which is based on aggregate input-output models. Thus, the measure is the outcome of aggregate conceptualisations, rather than on firms' perception of demand and supply. In general the micro-simulation approaches are especially insightful to study demographic processes. For instance, they suffice to describe what the distribution across sectors in a region will be given some initial setting and given birth rates, spin-off probabilities etc. An element that is much less developed in these models is the role of spatial proximity. The fact that firms cluster in order to achieve agglomeration advantages is not well represented. Structural changes in spatial economics structures (e.g. the emergence of new economic centres due to changes in industries) are not well represented. Hence, it is concluded that existing models of economic development can be regarded as micro-simulation models, in the sense that forecasts are obtained as the aggregation of individual simulated firm behaviours. However, typical elements that set apart agent-based approaches, such as agents interacting with other agents, changing their behavioural rules and adapt their behaviour to changed situations are lacking.
- 1.4
- A second type of models that has recently received increased interest adopts a more stylised approach to modelling the emergence of spatial patterns of economic activity. It focuses on the emergence of hierarchies of concentrations (of firms or population) as a result of simple reproduction and migration rules. Simon (1955) shows that by assuming fixed reproduction rates and relocation probabilities, and assuming that larger concentrations attract more migrants than lower concentrations, a hierarchy of concentrations emerges that follows a power law distribution. Remarkably, such power law distributions match existing hierarchies in economic concentration (Frenken et al. 2007) and population concentrations (Pumain 2006) very well. Although apparently these simple reproduction and migration rules touch upon general principles of spatial organisation, the theoretical underpinning of the models is somewhat cumbersome (Krugman 1996). In their most basic form, models as suggested by Simon are non-spatial. That is to say, the relative position of a concentration (e.g. a city or a commercial area) to other concentrations does not matter, since locational preferences of migrants only depend on the size of the concentration and not on its surroundings. As a result, a big city on an isolated place would be equally attractive as an equally big city surrounded by other cities. This assumption is problematic since it ignores the impact of proximity. For instance, studies in evolutionary economics (Boschma et al. 2002) suggest that proximity to other firms matters for their productivity and innovative capacity, and that this proximity exceeds the purely local scale. In particular, regions play an important role in processes of economic innovation, where the size of a region differs between types of industries. Thus, although correctly reproducing the rank size distribution of existing economic and population concentrations, the Simon model falls short in describing the emergence of clusters of economic development on a regional level.
- 1.5
- From the above, we conclude that existing micro-simulation approaches to modelling spatial economic development have some important limitations. Most importantly, the role of spatial proximity to other firms is not well represented in these models. Yet, spatial proximity is regarded a key factor in studies of regional economic development (Quigley 1998; Fujita and Thisse 2002). According to Fujita and Thisse (2002), McCann and Van Oort (2009) and Beaudry and Schifauerova (2009), spatial proximity plays a key role in the emergence of so called agglomeration effects, which can be understood as externalities stemming from concentration of firms, which are unintentional and not represented in market prices. An important debate that has been ongoing over the past decades is whether agglomeration effects should be understood as localisation economies (Marshal 1990) or urbanisation economies (Jacobs 1969). Localisation economies concern intra-sector externalities, stemming from the concentration of similar firms. Such externalities may concern sharing inputs, relying on a larger, specialised labour force, exchanging specialised knowledge (through circulating employees) and reducing transactions costs (e.g. search costs for employees) (see Duranton and Puga 2000; Van Oort and McCann 2009). Urbanisation economies (Jacobs 1969), in contrast, assume that variety in skills, knowledge and type of firms are key to economic development. These stem from a larger accumulation of economic activity of any kind (across sectors). It is argued that the wider variety of firms/skills makes a region more innovative and less vulnerable to economic setbacks, since new products and services are more easily developed. In addition, a larger accumulation of firms, irrespective of type, is associated with the existence of large scale urban facilities such as universities, knowledge institutes, trade associations, cultural organisations etc., which also bolster development and exchange of knowledge and attract skilled workers. Both types of externalities have been tested in empirical settings, and indications of both have found to influence regional economic performance. However, indicators and measurement scales vary significantly across studies and outcomes of different studies are often inconsistent (Beaudry and Schifauerova 2009). Apart from these agglomeration effects, which are also termed centripetal forces, firms are subject to centrifugal forces (Fujita and Thisse 2002). Centrifugal forces include competition for facilities and accommodations, leading to higher prices, the spatial dispersion of demand or competition of workers.
- 1.6
- Despite the debate and the remaining unclarity, we feel that when modelling economic development in micro-simulation models, the various forms of spatial externalities should be properly taken into account on a conceptual level. This paper proposes a stylised micro-simulation model of firm development and relocation that includes both Marshal and Jacobs effects as well as competition effects. By varying the relative importance of the effects and the spatial scale at which they work, we aim at increasing the insight into how these different and partly counteracting effects allow different aggregate patterns to emerge. Such insight is regarded as a necessary first step in the development of micro-simulation or agent-based models of firm development as part of, for instance land use transport interaction (LUTI) models. The model that is used can be regarded as a micro-simulation model, although the individual decision-making units have some characteristics that are typical for agents, as defined by Macal and North (2010): the firms could be termed self-directed in the sense that they find optimal locations based on a utility maximisation rule and are heterogeneous in terms of business type, age and size. However, the firms are not social, since they do not interact with other firms or observe other firms directly, and are not adaptive since they do not change behaviour rules or tactics in response to changes in the environment, in order to meet a more abstract goal. Also, we do not model collectives of firms, by representing them as social networks. Based on the outcomes we will draw conclusions regarding the sensitivity of spatial economic development on the assumptions made about the externalities. Specifically, a theoretical framework is developed in which market potential, agglomeration benefits and competition affect locational decisions on different spatial scales. The model of location behaviour is embedded in a demographic model of firm growth and spin-off processes.
- 1.7
- The paper is organised as follows. The second section, Model Description, outlines a model that describes the behavioural mechanism and the impact of different forms of spatial proximity. The third section, Study Design, describes the application of the model in a series of simulations. The fourth section, Simulation Results, analyses the impacts of spatial proximity, weighting effects and relocation probabilities on the emerging patterns of economic activity. The paper is concluded with conclusions and suggestions for further research.
Model Description
- 2.1
- In line with the micro-simulation models reviewed above, our model describes the spatial behaviour of firms dynamically over a number of time steps. However, as firms may consist of multiple establishments and divisions, that may take individual locational decisions, we take the division as the unit of analysis. We define divisions as coherent working units with a minimum and maximum size, dependent on the type of firm. Firms may be of two abstract types: 'traditional' and 'innovative' industries, which has implications for their behavioural rules. Firms are located in a landscape consisting of square cells (also termed cities), defined by a uniform size and x and y coordinates, that allow us to calculate distances between cells. Each firm is located in a particular cell. In addition, each cell has as its characteristics the number of firms of each type that is hosted, but also measures of the proximity of firms of each type hosted by other cells, as will be discussed in the remainder.
- 2.2
- The firm behaviours described by the model are growth, spin-off and relocation. With respect to internal growth, we assume that divisions in a certain sector grow uniformly with a fixed amount per year. In reality, growth rates will differ between firms due to factors such as quality of management, position in a network of firms and geographical position. Although we recognise the existence of such heterogeneity (Quigley 1998), we will not include it in this study, since the emphasis is on the impact of proximity effects on relocation decisions.
- 2.3
- In particular, we assume that division size St+1 in year t+1 equals:
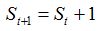
(1) - 2.4
- This implies a constant growth of one unit per year. Thus, growth speed is in our model given exogenously and is not influenced by state variables of firms or cells in our model system. We further assume that divisions have a maximum size δ and that growth beyond this maximum results in less effective functioning of divisions, e.g. through increasing overheads. Hence, we assume that if the maximum size is reached the division will split, resulting in a new division (spin-off). To reflect developments in product and sector lifecycles a spin-off does not necessarily result in a division of the same type as the parent division. For instance, a spin-off of an industrial division may be a division in services or high-tech. This reflects ongoing shifts in economies from traditional industries to high-tech and from manufacturing to services. In the stylised models tested in this study we will assume the existence of a traditional and an innovative industry. The rule for occurrence of spin-offs is:
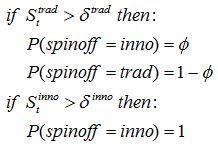
(2) - 2.5
- Thus, if the maximum size of a traditional division is reached with probability φ, the spin-off is the new type. The size of a spinoff is 0 by definition. Apart from such demographic processes, the model describes firms' relocation behaviour. Relocation of firms may take place for many reasons, which are usually concerned with internal processes, such as growth or suitability of the building (Lloyd et al. 1977; Van Dijk et al. 2000). In such cases, the relocation is likely to take place within the same municipality or region, without structurally changing the spatial structure of the economy. In this study, however, we are particularly interested in the more strategic relocation, in which divisions seek to improve their access to markets and resources by moving to another geographic location. In this respect, we assume that each division has a certain probability to evaluate its current geographical position against alternative positions to test whether relocation results in an improvement of its conditions. Two options are distinguished in the case of relocation. First, a division may investigate relocation to an existing city (defined as an existing concentration of firms), in an attempt to profit from proximity to firms of the same type (Marshall externalities) or from other firms in general (Jacobs externalities). Second, a firm may seek a new place without a current concentration of firms. In that case, immediate proximity to other firms is not the motivation, but a firm may look for a strategic location that maximises access to markets, suppliers etc. reachable within a larger but still acceptable distance. It is noted, though, that such strategic considerations may also play a role when choosing an existing city. In our stylised model, cities will be equivalent to grid cells in a plane. We assume that the probabilities of not exploring relocation λ1, investigating relocation to an existing city λ2 and to a new city λ3 are 0.9, 0.09 and 0.01 respectively. It is recognised that different probabilities of relocation may result in different spatial patterns and different development speeds. However, since the focus of our study is on the role of spatial proximity in the emergence of spatial patterns, we use the above values, which proved to work well in other studies (Krugman 1996; Simon 1955).
- 2.6
- In case a spin off looks for a location in another (existing) or a new city, a location is selected based on the evaluation of alternative locations and relocation takes place as follows. A firm will evaluate all locations to find the location with the highest utility. If this maximum utility is higher than the utility of the current location, the division will move to this new location, otherwise, it will stay in its current place.
- 2.7
- The central issue when discussing the impact of spatial proximity is how utility is defined. In a non-spatial model, utility of each location would be equal, suggesting a random spatial process. The spatial sensitivity of the model is improved if the locational preference depends on the size (number of divisions) in the destination. In this case utility is defined as:

(3) where Ui is the utility of area i and Ni is the number of division in an area i. In essence, this is the model proposed by Simon, which leads to the well known power law distribution of concentrations. However, the Simon model is local in terms of its utility function, since it only accounts for firms in a certain location, and the surroundings are not taken into account, ignoring the fact that travel allows for interaction between firms that are not in the same location. The agglomeration effects referred to in the introduction (Marshall and Jacobs externalities) are likely to occur over larger distances than for instance within-municipality distance, provided that accessibility to other places is sufficient. In this respect, this study proposes and tests utility formulations that not only take into account locational characteristics, but also characteristics of the surroundings, such as the proximity to other firms. Looking at locational characteristics of firms, the literature suggests various factors relating to proximity of firms that clearly exceed the purely local level.
- 2.8
- A first factor concerns the "Jacobs" potential. As noted before this refers to the proximity to any kind of firms, which has advantages in terms of diversity of skills, innovative capacity and providing a critical mass (Ball 2004; Garreau 1992) for knowledge institutes and trade organisations and other facilities. In addition, proximity to firms in general serve as a proxy for market potential (Harris 1954). Firms make profits from selling products of services to other firms or to individuals. The shorter the travel distance to these clients, the lower the costs and the higher the profit. In addition, the more clients can be reached within acceptable travel distance from a location, the larger the market potential and the more attractive the location is to settle. In this respect, the sensitivity to distance is the factor determining the spatial configuration. For common goods, such as groceries, willingness to travel is low. For more specialised goods/services, the willingness to travel and the market area will be larger. Such differences in distance decay will have a large impact on the emerging spatial patterns of economic activity. Taking the above into account, Jacobs potential (JP) can be defined as:
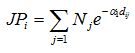
(4) where JPi is the Jacobs potential in area i and Nj is population (number of divisions) in city j. α1 is a parameter for controlling the distance decay and dij is distance between area i and city j. A second factor related to spatial proximity is the Marshall externalities. Many studies suggest that firms benefit from proximity to similar firms. One reason is that they may profit from shared facilities and suppliers. In addition, some firms may be better able to attract clients and employees jointly than individually. Another important issue is that firms form networks in which knowledge is exchanged, projects are carried out and market information is exchanged, in order to achieve competitive advantages. Such Marshall externalities suggest that firms will prefer to locate near other firms from the same sector. In equation, Marshall effects are expressed as:
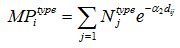
(5) where MPitype is the Marshall potential of division of specific type in area i and Njtype is a population of divisions of a specific type in city j. α2 is a parameter for controlling the distance effect and dij is distance between area i and city j. It is recognised that agglomeration advantages for different sectors may differ in importance, e.g. due to the relative importance of knowledge and innovation in a sector. Also the scale of agglomeration advantages may differ, due to the type of interaction, e.g. having similar consumers asks for immediate physical proximity, whereas exchange of knowledge via personal meetings allows a longer travel time.
- 2.9
- Finally, having noted the advantages of being close to other firms and clients, we note that there will also be disadvantages. Increasing density leads to congestion of infrastructure and facilities, but also to higher prices and increasing competition for employees and other resources. Note that congestion is not sector specific, in the sense that firms suffer from congestion caused by all other firms. In equations:
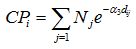
(6) where CPi is the congestion effect in area i and Nj is population in city j. α3 is a parameter for controlling distance effect and dij is distance between area i and city j. Again, we note that sensitivity of congestion may differ between firm types, due to their need for space and infrastructure and the required qualifications of their employees. However, also the advantage of agglomeration will be weighted off against the disadvantage of congestion. As a result, the Simon utility of expression 3 can be transformed as:
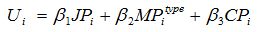
(7) 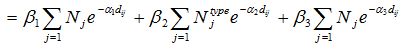
(8) where Ui is the utility in an area i and JPi is the market (Jacobs) potential in an area i. MPitype is the agglomeration (Marshall) potential of type t and CPi is the congestion effect in the area i. The relocation probability can then be defined as:
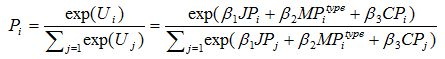
(9) where Pi is the probability of area i for relocation. This function is applied both for migration to existing cities and for migration to new cities.
- 2.10
- To summarise, our model assumes that growth, spin-off and relocation are the guiding behaviours leading to the emergence of aggregate patterns of economic activity. These aggregate patterns, in turn, determine the Marshall, Jacobs and congestion effects that influence individual firms' relocation behaviours. Thus, an iterative multi-scale process results, as illustrated in Figure 1. Whereas growth is a uniform and automated process, the spin-off and relocation process is stochastic in nature, implying that similar initial settings may lead to different outcomes. Although both types of firms (traditional and innovative) have in essence the same behavioural rules, the parameters for weights of different effects and distance sensitivity differ. We hypothesize that the preferences of firms with respect to proximity will determine the spatial configuration of economic activities. For instance, agglomeration advantages on a small scale will lead to multiple centres of economic activity, whereas agglomeration advantages on a larger scale may lead to a single centre. In the remainder of this paper we will test to what extent differences in the spatial scale will lead to different spatial configurations.
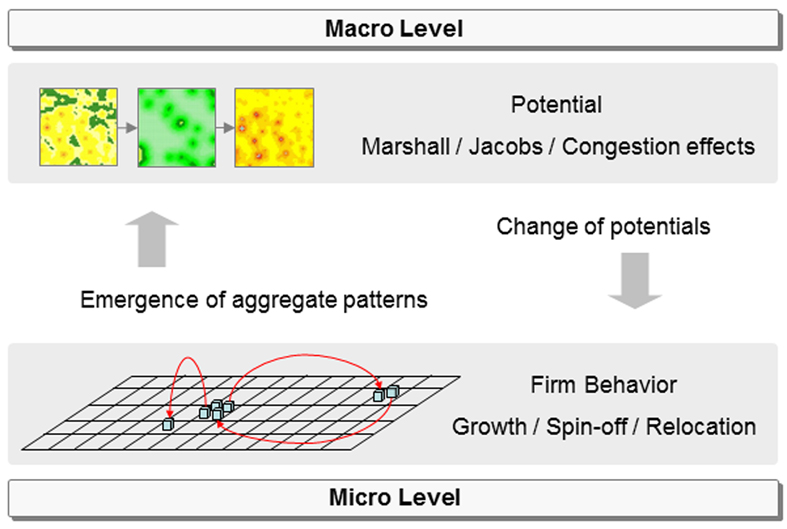
Figure 1. Multi-scale process in each time step
Study Design
- 3.1
- Although we recognise that many factors other than discussed before (such as the availability of facilities, path dependency etc.) impact on firms' location choice, we will use a stylised setting in which we will test some fundamental relationships between individual preferences of firms on the one hand, and aggregate spatial patterns on the other hand. In particular, we assume that firms operate in a landscape that is homogeneous in terms of travel speeds and quality of locations, and only varies in terms of the presence of other firms. The landscape consists of a square of 50 × 50 cells. Initially, at t=0, the landscape is filled with 2500 divisions (one in each cell), which in each time step will grow, reproduce spin-offs with some probability and with some probability relocate. The likelihood and effectuation of these events is determined by the equations described in the above. The process is organised such that preceding each time step, the Marshall, Jacobs and congestion measure for each cell is calculated, based on the spatial distribution of firms at that stage. Then, for each firm, growth, spin-off and relocated are simulated as described above, based on the calculated Jacobs, Marshall and congestion measures. This leads to a change in the spatial configuration, necessitating recalculation of the Marshall, Jacobs and congestion measures, which are input to a next step of firm simulation. This cyclic process is displayed in Figure 1. To test the impact of different preferences of spatial proximity, the model will be run with different parameters during 50 time steps, after which the resulting pattern is analysed. This analysis will include three elements. Since we present a stylized model, time and distance units do not have a meaning, and we will focus on differences in emergent patterns based on difference in the sensitivity to this abstract distance.
- 3.2
- First, the resulting patterns will be interpreted visually in terms of the number and size of emerging clusters of economic activity. Second, the distribution of rank sizes will be plotted, to see whether the resulting patterns follow the power law distribution typical for urban and economic distributions (Simon 1955; Pumain 2006). Third, the degree of clustering is expressed using the formula:
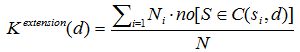
(10) 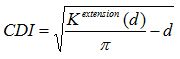
(11) where Kextension is the cluster density and N is the total number of divisions. C(si, d) is a circle with distance d from si (Kosfeld et al. 2011; Marcon et al. 2003). This index has a higher value if more divisions are closer to one another. The index is calculated with the distance 10 for the purpose of our study.
Table 1: Base Model Model 1 Model 2 Model 3 Model 4 Model 5 Model 6 Model 7 Parameter Type Empty Only JP JP+
MPJP+
MP+
CPLarger JP Larger MP Larger JP+
MPJP α1 Traditional 0.6 0.6 0.6 0.6 0.6 0.6 0.6 Innovative 0.5 0.5 0.5 0.5 0.3 0.5 0.3 MP α2 Traditional 0.6 0.6 0.6 0.6 0.6 0.6 0.6 Innovative 0.5 0.5 0.5 0.5 0.5 0.3 0.3 CP α3 Traditional 0.6 0.6 0.6 0.6 0.6 0.6 0.6 Innovative 0.5 0.5 0.5 0.5 0.5 0.5 0.5 JP effect β1 Traditional 0 1 1 1 1 1 1 Innovative 0 1 1 1 1 1 1 MP effect β2 Traditional 0 0 0.5 0.5 0.5 0.5 0.5 Innovative 0 0 0.5 0.5 0.5 0.5 0.5 CP effect β3 Traditional 0 0 0 -1 -1 -1 -1 Innovative 0 0 0 -1 -1 -1 -1 Maximum
Growthδtrad Traditional 0 0 0 -1 -1 -1 -1 δinno Innovative 0 0 0 -1 -1 -1 -1 Relocation
Probabilityλ2 Traditional 0 0 0 -1 -1 -1 -1 λ3 Innovative 0 0 0 -1 -1 -1 -1 Time Step 50 50 50 50 50 50 50 Probability of turning into innovative φ 0.01 0.01 0.01 0.01 0.01 0.01 0.01 - 3.3
- The starting point of the analyses is a base specification of the model, with parameters specified as in Table 1. This table follows the following logic. First, starting from a Simon-type model without locational preferences (β are zero), various spatial factors are added stepwise, to see how this changes the resulting pattern. In addition, a model with only congestion effects and a model in which congestion has a double weight are tested. Second, the impact of different spatial factors will be varied by changing the α parameter, in order to find out how this relative impact affects the spatial pattern of economic activity. These analyses are followed by two extensions. First, the models are run with varying initial conditions:
- 2500 initial firms being randomly allocated to cells
- 25 initial firms being randomly allocated to cells
- 3.4
- Finally, base model 4 will be run with varying values for the parameters lambda, to see how that influences the resulting spatial pattern. It is recognised that these analyses do not serve to find 'true' or realistic parameter settings as a base for simulations in more concrete settings. However, by varying model parameters in a systematic way we want to explore how a relative emphasis on a certain factor (Marshall externalities, Jacobs externalities, congestion) has implications for emerging aggregate patterns.
Simulation Results
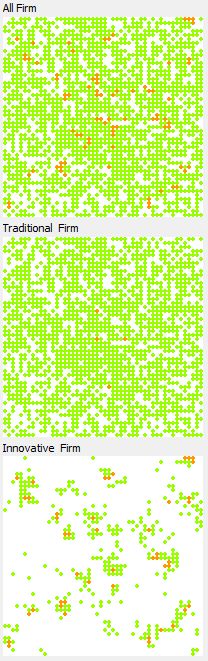
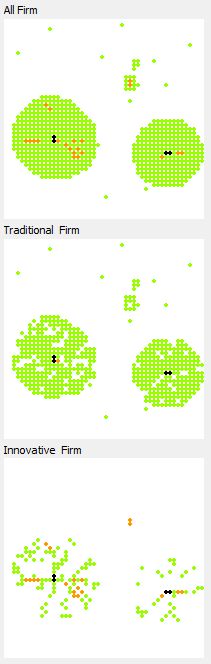
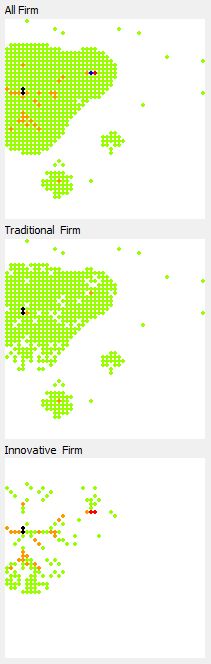
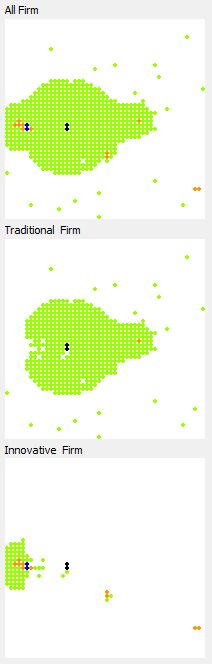
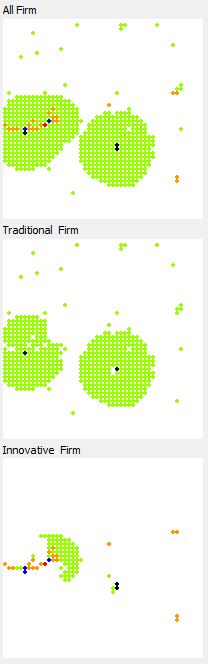
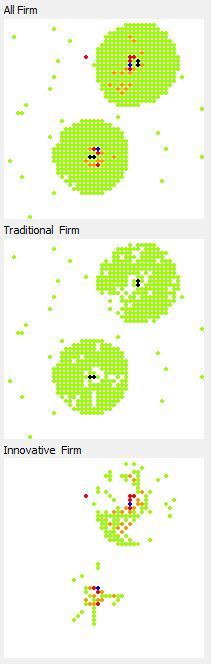
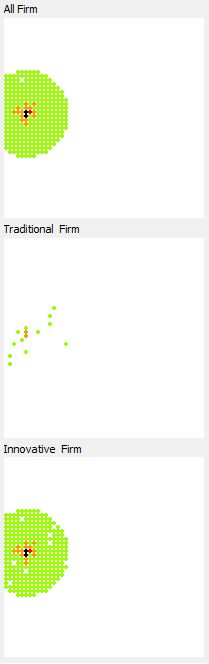
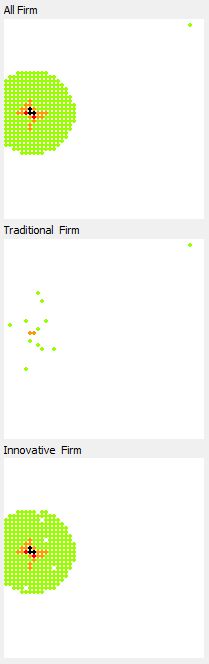
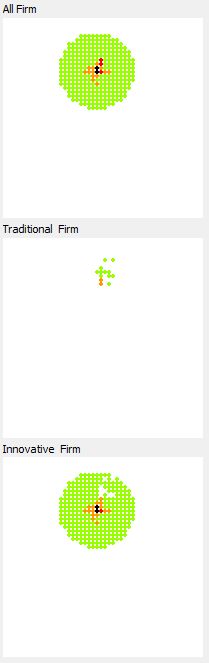
- 4.1
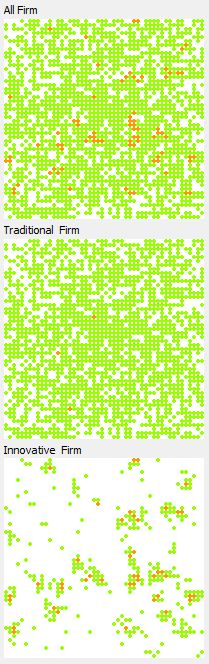
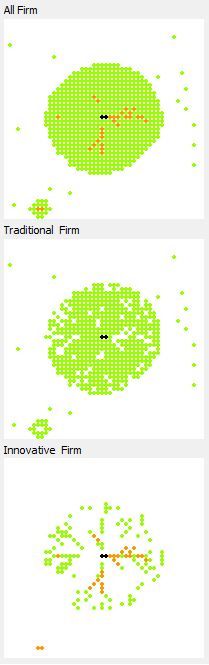
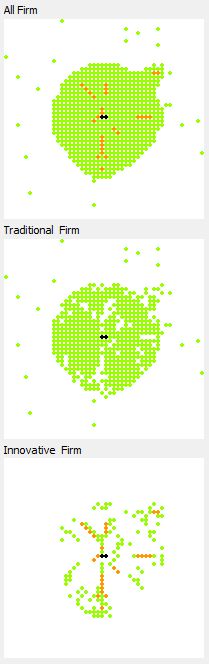
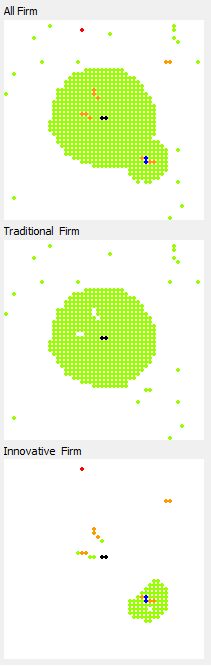
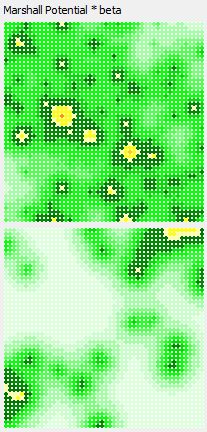
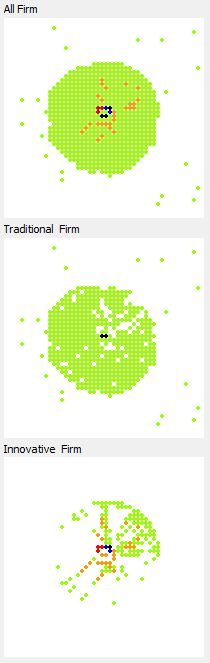
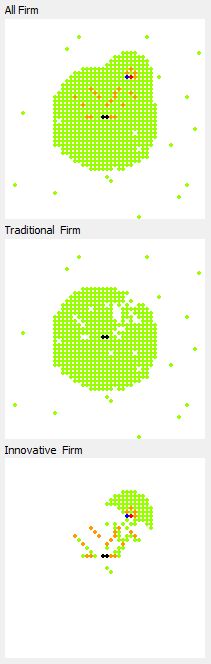
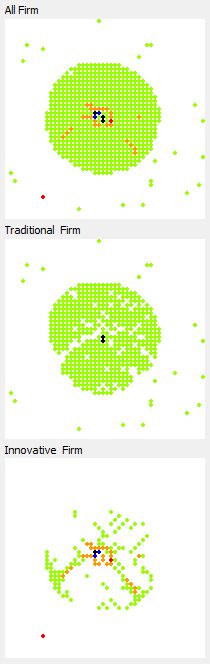
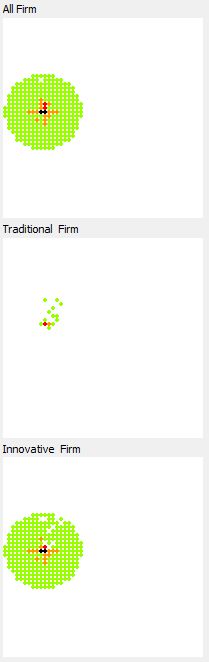
- As shown in figure 2 (which represents Model 4 with Jacobs, Marshall and congestion potential), the initial state of simulation is that the division of old type is equally distributed across all regions which consists of 2500 cells (50 by 50). A division in the traditional industry grows in each time step leading to a spin-off or relocation. The utility and probability for migration also follow the expressions 8 and 9 respectively. The figure 2 shows that the spatial pattern of traditional industry changed from an evenly distributed pattern into a clustered spatial pattern. Concerning the emergence of a innovative industry, we assume a growth rate of the innovative industry is five times higher than that of the traditional industry. The different parameters for the traditional and innovative industry clearly affect their pattern of evolution. The innovative industry emerges both in new agglomerations and in existing agglomerations. This can be understood from the fact that the innovative industry profits from agglomeration economies of co-location with firms of the own kind (which explains the emergence of new agglomerations especially in the beginning of the process) as well as from proximity to demand (explaining the growth of the innovative industry in the existing agglomerations). The resulting spatial pattern after the innovative industry has emerged, has become more "Zipf-like" (Zipf 1949) in the sense that we can witness cities of different sizes with the frequency of particular size decreasing with increasing size (figure 3). Our model thus underlines the need to understand the spatial structure of an economy as a historical process of structural change leading to a progressive diversification of the economy.
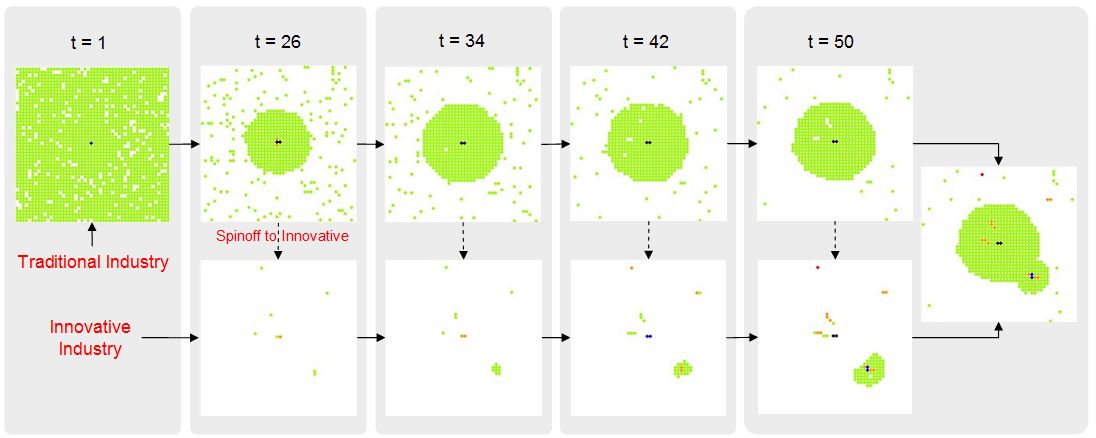
(cell density: low-high  )
)Figure 2. Time series for base model 4 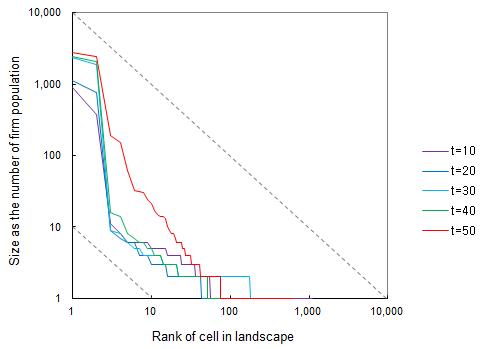
Figure 3. Rank size distribution for base model 4 The impact of spatial proximity
- 4.2
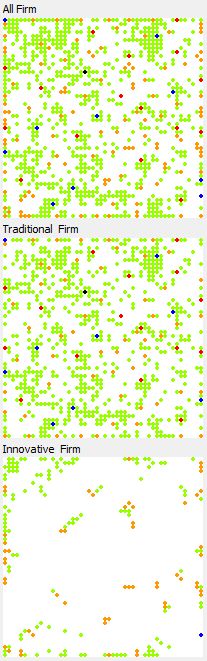
- The first model (model 1) that is tested is only based on growth and spin-off processes, lacking spatial preferences. This model is rather similar to the Simon model, except for the fact that Simon's model assumes that cells with more divisions are more likely to attract newcomers, whereas in our model all cells have equal probability. As can be seen in figure 4, this model results in a pattern without centres, with divisions scattered out over space and filled all cells.
Base Model 1
CDI = 15.66Base Model 2
CDI = 32.97Base Model 3
CDI = 32.81Base Model 4
CDI = 29.73(cell density: low-high )Figure 4. The impact of spatial proximity - 4.3
- The second model (model 2) includes the proximity to both traditional and innovative industry firms, representing Jacobs potential. The second picture of figure 4 suggests that adding market power results in a more clustered configuration, with one large centre. In time step 50, a smaller subcentre has emerged, which may in time develop into a new centre. Thus, the Jacobs effect acts as a centripetal force leading to a higher degree of concentration (32.97 against 15.66 for model 1). However, path dependency allows for the emergence of subcentres. Not also that innovative industries are more dispersed within the bigger agglomeration, since they do not specifically look to be close to firms of their own type. It is noted that the clusters are not uniform in terms of density. This is due to differences between cells in the initial conditions, which carry forward to later states. Thus, cells within a cluster that have already attracted more firms, are more likely to do so in later stages, due to the fact that they result in the highest Marshall and Jacobs effects.
- 4.4
- The third model (model 3) includes Jacobs and Marshall effects. The simulation suggests that this model also leads to clustering of divisions, with one large centre. However, agglomeration may, since it adds Marshall effect as similar firm types, more easily result in local clusters. In this simulation innovative firms cluster more around a limited number of axes within the central area. The degree of clustering (as expressed by the CDI) is similar to the case where only Jacobs externalities are modelled.
- 4.5
- Model 4, adding the impact of congestion to the model, results in a pattern with one centre like the fourth picture of figure 4. Overall, the effect of congestion, which is counteracting the Jacobs and Marshall externalities, leads to a slightly lower degree of clustering, as expected. In particular, the innovative industries, which are slightly more flexible in location (since initially they do not experience Marshall effects), locate in an adjacent subcentre that grows through path dependency.
- 4.6
- Finally, using congestion as the only spatial impact (model 4b) or doubling its impact (model 4c) leads to simulations in which centripetal forces are dominant. The main driving force is that firms seek to maximise the space between them, leading to dispersed patterns as in figure 5. Consequently, the degree of clustering is significantly lower.
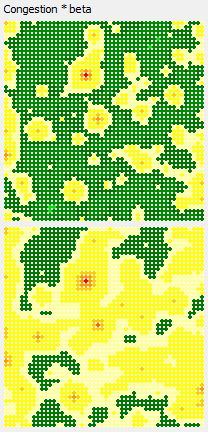
Cell density Potential Cell density Potential β1 = 0, β2 = 0, β3 = -1 β1 = 0, β2 = 0, β3 = -2 Base Model 4b Base Model 4c CDI = 12.35 CDI = 12.54 (cell density: low-high )(cell potential: low-high  )
)Figure 5. The impact of congestion Weighting effects
- 4.7
- In this section various models in which the spatial reach impact of Jacobs and Marshall effects is varied, are discussed. As seen in figure 6, Model 5 has a lower α1 for the Jacobs potential implying a lower distance decay function (e.g. because transport costs are lower). This model results in a spatial pattern with one large centre, which is more clustered (CDI = 35.95) than the base model (model 4) and the models without congestion effects (models 2 and 3). Apparently, the geographically larger reach has the effect that all relocating firms are attracted by the central area. Also, innovative firms are more spread out across the central area.
Base Model 5
CDI = 35.95Base Model 6
CDI = 31.96Base Model 7
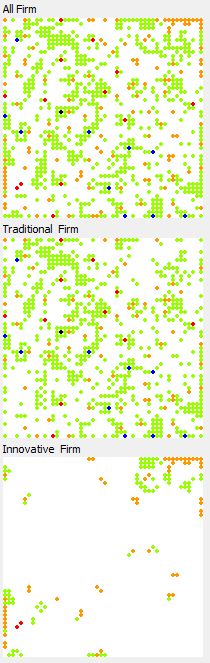
CDI = 35.27(cell density: low-high )Figure 6. The impact of weighting effects - 4.8
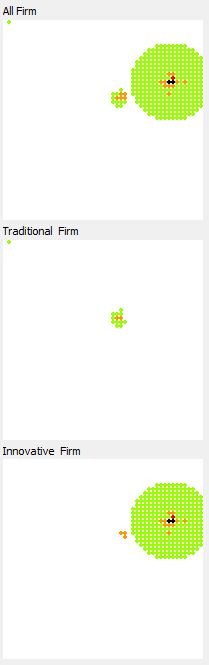
- Model 6 increases the spatial scale of Marshall effects through a lower α2 for the agglomeration potential of innovative industries. This results in a pattern with a sub-centre for the innovative industries. Apparently, the larger spatial reach increases the attractiveness of less densely 'populated' areas, increasing also the probability of subcentres emerging. In turn, if an innovative firm settles in the periphery by chance, it will be more likely to attract others in the vicinity, due to the larger reach. Yet, the cluster index has a high value, suggesting that within and around the clusters accessibility to other firms is high. This is also the result of the relative closeness of the clusters.
- 4.9
- Model 7, in which both Jacobs and Marshall effects have a larger spatial reach for innovative firms, clustering degree is high, as in model 5. Apparently, the Jacobs effects exhibit a strong centripetal force on all innovative firms, due to the spatial reach. This leads to a higher degree of clustering overall.
The effect of initial conditions
- 4.10
- The simulations for models 1-7 were repeated with different initial settings:
- 2500 initial firms being randomly allocate to cells
- 25 initial firms being randomly allocated to cells
Base Model 1
CDI = 15.39Base Model 2
CDI = 26.12Base Model 3
CDI = 31.92Base Model 4
CDI = 29.70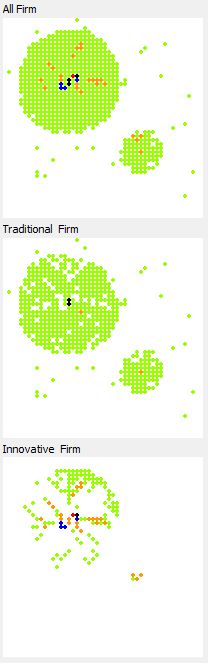
Base Model 5
CDI = 35.74Base Model 6
CDI = 19.73Base Model 7
CDI = 27.58(cell density: low-high )Figure 7. 2500 initial firms being randomly allocate to cells 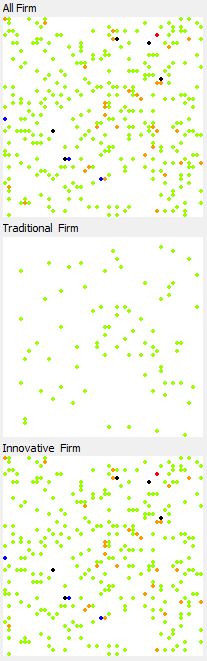
Base Model 1
CDI = 13.14Base Model 2
CDI = 29.90Base Model 3
CDI = 31.14Base Model 4
CDI = 30.58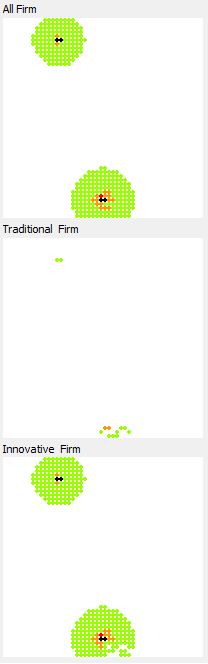
Base Model 5
CDI = 21.86Base Model 6
CDI = 28.67Base Model 7
CDI = 30.24(cell density: low-high )Figure 8. 25 initial firms being randomly allocated to cells The impact of relocation probabilities
- 4.11
- To test the impact of relocation probabilities, the variables λ2 and λ3 were varied to represent a higher relocation probability of moving to an existing city in general (mostly determined by λ2) and a higher probability of moving to a new city (λ3). λ1 is always defined as 1 - (λ2 + λ3). For each combination, the emerging spatial pattern as well as the cluster index is displayed (figure 9). Visual inspection of the emerging patterns and the CDI suggests that with higher λ2, the degree of clustering increases, whereas it goes down with increasing λ3. Thus, a higher probability to move to an existing city (an occupied cell in our case) increases the probability that firms adhere to centripetal forces (Marshall and Jacobs effects). A higher probability of moving to a new city (unoccupied cell) as indicated by λ3 may diminish this effect, since unoccupied cells are more often located in the periphery. It is noted, though, that the relative effect of variations in λ2 and λ3 is much less than changing the presence, size and spatial reach of Marshall, Jacobs and competition effects.
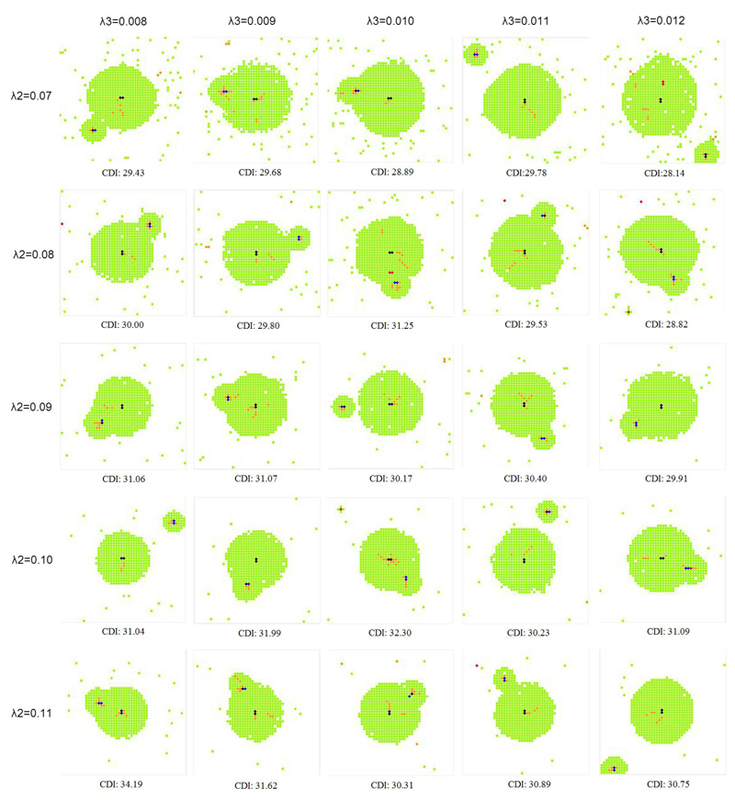
(cell density: low-high )Figure 9. Variation of λ based on base model
Conclusion and Discussion
- 5.1
- In this paper we have demonstrated in a stylised setting, how differences in preferences with respect to spatial proximity lead to different spatial patterns of economic activity. In this respect, a preference to achieve a high levels of Jacobs externalities and to profit from Marshall externalities results in more centralised settings. The simulations suggest a tendency that function concentration (Marshall effects) is more likely to lead to the emergence of subcentres with a specific specialisation. However, the spatial scale of the market and agglomeration effects matters. In particular, if Marshall advantages stretch out over a longer distance, more subcentres emerge. Somewhat surprisingly, congestion seems to have a minor impact on the emerging patterns. Although the simulation outcomes are intuitively plausible, they also articulate the need for validation of the behavioural decision rules. If outcomes are determined by the presence (and potentially strength, although not tested in this paper) and spatial reach of Jacobs potential, Marshall and congestion effects, it is important to investigate how firms of different types valuate these factors in their location choice behaviour. In particular, it is important how the valuation of these factors varies with firm characteristics such as type of activities, size, history and the position in economic networks. Such information would be necessary to apply the above approach in a more realistic setting as a policy support tool. A second conclusion that can be drawn from the simulations is that relocation probability to existing and new cities impacts on the emerging patterns. This finding is highly policy relevant, since it suggests that the availability of locations where firms/divisions can move has a significant impact on spatial patterns of economic activity. If this is confirmed by validation studies, it would suggest that spatial planning is a tool that can directly impact on the economic structure of regions and will influence firms' performance and thereby regional economic development.
- 5.2
- Although this study provides first insights into the emergence of spatial patterns of economic activity, it is obvious that much more research is needed to develop this approach into a tool that can be readily used for policy analysis. This research should address the following issues. First, the behavioural rules applied in this test of concept need to be verified and refined. In particular, multivariate analyses are needed that relate firm characteristics to the degree and spatial reach of proximity preferences. This will require dedicated data to be collected from individual firms. Second, it should be recognised that firms do not operate in isolation, but interact with households and individuals (as clients and employees), institutions (such as government agencies, universities, schools etc.) and react to the physical environment (landscape, quality of residential environment, pollution and noise). A proper model for policy evaluation should include a representation of how proximity concerns are traded off against these other factors.
References
-
BALL, P. (2004). Critical Mass: How one thing leads to another. New York: Farrar, Straus and Giroux.
BEAUDRY, C. and Schiffauerova, A. (2009). Who's right, Marshall or Jacobs? The localization versus urbanization debate. Research Policy, 38, 318-337. [doi:10.1016/j.respol.2008.11.010]
BENENSON, I. and Torrens, P.M. (2004). Geosimulation: object-based modelling of urban phenomena. Computers, Environment and Urban Systems, 28, 1-8. [doi:10.1016/S0198-9715(02)00067-4]
BERGER, T. (2001). Agent-based spatial models applied to agriculture: a simulation tool for technology diffusion, resource use changes, and policy analysis. Agricultural Economics, 25, 245-260. [doi:10.1111/j.1574-0862.2001.tb00205.x]
BOSCHMA, R.A., Frenken, K. and Lambooy, J.G. (2002). Evolutionaire Economie. Een inleiding. Bussum: Coutinho.
BROWN, D. and Robinson, D. (2006). Effects of heterogeneity in residential preferences on an agent-based model of urban sprawl. Ecology and Society, 11(1), 46.
DIAPPI, L. and Bolchi, P. (2008) Smith's rent gap theory and local real estate dynamics: A multi-agent model. Computers, Environment and Urban Systems, 32(1), 6-18. [doi:10.1016/j.compenvurbsys.2006.11.003]
DURANTON, G. and Puga, D. (2000). Diversity and Specialization in Cities: Why, Where and When Does it Matter? Urban Studies, 37(3), 533-555. [doi:10.1080/0042098002104]
ETTEMA, D. (2010) The impact of telecommuting on residential relocation and residential preferences: A latent class modelling approach. The Journal of Transport and Land Use, 3(1), 7-24.
ETTEMA, D. (2011). A multi-agent model of urban processes: Modeling relocation processes and price setting in housing markets. Computers, Environment, and Urban Systems, 35(1), 1-11. [doi:10.1016/j.compenvurbsys.2010.06.005]
FILATOVA, T., van der Veen, A. and Parker, D.C. (2009). Land Market Interactions between Heterogeneous Agents in a Heterogeneous Landscape - Tracing the Macro-Scale Effects of Individual Trade-Offs between Environmental Amenities and Disamenities, Canadian Journal of Agricultural Economics, 57(4), 431-457. [doi:10.1111/j.1744-7976.2009.01164.x]
FRENKEN, K., and Boschma, R.A. (2007). A Theoretical Framework for Evolutionary Economic Geography: Industrial Dynamics and Urban Growth as a Branching Process. Journal of Economic Geography, 7, 635-649. [doi:10.1093/jeg/lbm018]
FUJITA, M., and Thisse, J.F. (2002) Economics of Agglomeration: Cities, Industrial Location, and Regional Growth. Cambridge University Press. [doi:10.1017/CBO9780511805660]
GARREAU, J. (1992). Edge City. New York: Anchor Books.
GRIMM, V., Berger, U., Bastiansen, F., Eliassen, S., Ginot, V., Giske, J., Goss-Custard, J., Grand, T., Heinz, S.K., Huse, G., Huth, A., Jepsen, J.U., Jørgensen, C., Mooij, W.M., Müller, B., Pe'er, G., Piou, C., Railsback, S.F., Robbins, A.M., Robbins, M.M., Rossmanith, E., Rüger, N., Strand, E., Souissi, S., Stillman, R.A., Vabø, R., Visser, U. and DeAngelis, D.L. (2006). A standard protocol for describing individual-based and agent-based models, Ecological Modelling 198, 115-126. [doi:10.1016/j.ecolmodel.2006.04.023]
HARRIS, C.D. (1954) The market as a factor in the localisation of industry in the United States. Annals of the Association of American Geographers, 44, 315-348.
JACOBS, J. (1969). The Economy of Cities. New York: Random House.
KOSFELD, R., Eckey, H.F. and Lauridsen, J. (2011). Spatial Point Pattern Analysis and Industry Concentration. Annals of Regional Science, 47, 311-328. [doi:10.1007/s00168-010-0385-5]
KRUGMAN, P.R. (1996). The Self-Organizing Economy. Oxford: Blackwell Publishers.
LLOYD, P.E. and Dicken, P. (1977). Location in Space. A Theoretical Approach to Economic Geography. London: Harper & Row.
MACAL, C.M. and North, M.J. (2010). Tutorial on agent-based modelling and simulation, Journal of Simulation, 4, 151-162 [doi:10.1057/jos.2010.3]
MAGLIOCCA, N.R., Safirova, E., McConnel, V. and Walls, M. (2011). An economic agent-based model of coupled housing and land markets (CHALMS). Computers, Environment, and Urban Systems, 35(3): 183-191. [doi:10.1016/j.compenvurbsys.2011.01.002]
MARCON, E. and Puech, F. (2003). Evaluating the Geographic Concentration of Industries using Distance-Based Methods. Journal of Economic Geography, 3, 409-428. [doi:10.1093/jeg/lbg016]
MARSHALL, A. (1890). Principles of Economics. London: Macmillan.
MCCANN, P. and van Oort, F. (2009). "Theories of agglomeration and regional economic growth: a historical review". In: P. Nijkamp and R. Capello, Handbook of Regional Growth and Development Theories. Cheltenham: Edward Elgar, pp. 19-32. [doi:10.4337/9781848445987.00007]
MOECKEL, R. (2005). Microsimulation of firm location decisions, Proceedings of 9th International Conference on Computers in Urban Planning and Urban Management. June 29-July 1, London, U.K.
PARKER, D.C. and Filatova, T. (2008). A conceptual design for a bilateral agent-based land market with heterogeneous economic agents, Computers, Environment and Urban Systems, 32(6), 454-463. [doi:10.1016/j.compenvurbsys.2008.09.012]
PUMAIN, D. (2006). Alternative Explanations of Hierarchical Differentiation in Urban System. In D. Pumain (Ed.), Hierarchy in Natural and Social Sciences (pp. 169-222). Dordrecht: Springer. [doi:10.1007/1-4020-4127-6_8]
QUIGLEY, J.M. (1998). Urban Diversity and Economic Growth. Journal of Economic Perspectives, 12(2), 127-138. [doi:10.1257/jep.12.2.127]
SIMON, H. (1955) On a class of skew distribution functions. Biometrika 44, 425-440. [doi:10.1093/biomet/42.3-4.425]
VAN Dijk, J. and Pellenbarg, P.H. (2000). Firm Relocation Decisions in The Netherlands: An Ordered Logit Approach, Regional Science, 79 191-219. [doi:10.1007/s101100050043]
VAN OORT, F.G. and McCANN, P. (2009). Theories of agglomeration and regional growth: a historical review. In R. Capello and P. Nijkamp (Ed.), Handbook of regional growth and development theories (pp. 19-32). Cheltenham: Edward Elgar.
VAN Wissen, L. (2000). A micro-simulation model of firms: Applications of concepts of the demography of the firm. Papers in Regional Science, 79, 111-134. [doi:10.1007/s101100050039]
WADDELL, P. (2002). UrbanSim: Modeling Urban Development for Land Use, Transportation, and Environmental Planning. Journal of the American Planning Association, 68(3): 297-314. [doi:10.1080/01944360208976274]
ZIPF, G.K. (1949). Human Behavior and the Principle of Least Effort. Cambridge, MA: Addison-Wesley.