
 Abstract
- Public service delivery programs are not free from players' opportunistic behaviors, such as fraudulent benefit exchanges. The standard methods used to detect such misbehaviors are static, less effective in uncovering interactions between corrupt agents, and easy to evade because of corrupt agents' familiarity with detection procedures. Current fraud detection efforts do not match the dynamics and adaptive processes they are supposed to monitor and regulate. In this paper, an agent-based simulation model is built to gain insight on sanction choices to deter fraudulent activities in public service delivery programs. The simulation outputs demonstrate that sanctions with low certainty must be accompanied by prompt action in order to observe a reduction in fraudulent vendors. However, a similar level of reduction in fraudulent vendors may be achieved once a certain number of fraudulent vendors are sanctioned, even if the public agency's action is relatively delayed. These characteristics of sanctions provide strategic choices that public service delivery program managers can consider based on their priorities and resources.
- Keywords:
- Fraud, Public Service Delivery, Deterrence, Agent-Based Modeling
Introduction
- 1.1
- There are many public service delivery programs in the United States, including the Supplemental Nutrition Assistance Program (SNAP, which was previously known as the Food Stamp program) and the Special Supplemental Nutrition Program for Women, Infants, and Children (WIC) program. These two programs together cost over $80 billion to provide food and nutritional supplements for the financially needy in 2011. However, public service delivery programs are rarely, if ever, flawless in their design and implementation. Such programs consist of interdependent but goal-incongruent players who work together to pursue overlapping, but somewhat different, goals. For example, public agencies frequently attempt to deliver public services to program recipients by contracting with private service providers (i.e., vendors). While these vendors are responsible for delivering services on behalf of the public agencies, they also attempt to maximize the profit they gain from the delivery. Program recipients are expected to improve their physical or economic condition by complying with program policies and consuming the services. However, such compliance occurs based on each recipient's priority, judgment, and environment. These characteristics of public service delivery programs inevitably provide opportunities for some players to engage in illegal activities.
- 1.2
- While formal rules and regulations are in place for the delivery of public services, fraud, waste, and abuse have been serious issues in the two programs above as well as other public service delivery programs, such as the Unemployment Insurance Program (Heddell 2002), the workers' compensation system (Wait 1997), and home health care programs (Vandenburgh 2005). In the private sector, theft and "shrinkage" are mainly due to customers and employees acting as individuals, but fraud in public service delivery programs more often requires the active participation of the program recipient as well as the service provider. For example, trafficking, or the exchange of public service benefits for cash, has been a serious type of fraudulent behavior. Overcharging by vendors has been known as the main source of fraud in the WIC and Food Stamp programs. Other illegal activities of vendors include forcing unwanted purchases and allowing substitutions for unauthorized items. Vendors may be a primary driver of these illegal activities, but program recipients also willingly or unwillingly become part of those activities.
- 1.3
- Given the volume of daily transactions in public service delivery programs, it is difficult for individual states to identify every misuse, abuse, and case of fraud, though some proxy measures and methods are used to identify misbehavior. For example, WIC programs have utilized fraud identification and detection methods, such as examining monthly WIC sales volume given store characteristics (e.g., the number of cash registers) and conducting field investigations. However, these methods are static, less effective in uncovering the interactions between corrupt agents, and easy to evade because of familiarity with detection procedures. The standard control mechanisms do not mirror the complexity of the issue. That is, simple fraud detection efforts do not match the dynamics and adaptive processes they aim to monitor and regulate. Provost (2002) argued that the adaptive nature of fraud in public programs is not well addressed in the typical information system life cycle based on linear processes. In recent years, scholars have suggested understanding fraud as an outcome of complex interactions. For example, Wilhelm (2004) framed fraud as an issue that requires dynamic, evolving, and adaptive management due to its complexity.
- 1.4
- This paper explores the utility of a simulation model as a way to explore the dynamics of fraudulent behavior and sanction choices in a public service delivery program. Computer or computational modeling approaches (i.e., agent-based models) have been suggested and used as a key instrument for gaining knowledge on various social issues (Epstein 2006; Gilbert & Troitzsch 2005; Marcy & Willer 2002) and crime in particular (Eck & Liu 2008; Groff 2007). Simulating the dynamics of crime and/or punishment is a subject that has also received attention from the artificial societies and social simulation community (Bosse & Gerritsen 2010; Fonoberova et al. 2012; Rauhut & Junker 2009; Ye et al. 2011).
- 1.5
- We model an artificial public service delivery program where program recipients and vendors dynamically interact for public benefit exchanges, which can also lead to opportunities for rule-breaking behaviors. The research question is "What different sanction choices can be made in terms of deterring fraudulent exchanges and vendors in a dynamic adaptive public service delivery system?" We focus on two primary contrasts: 1) the level of fraudulent vendors without versus with different levels of vendors sanctioned (as a proxy of the certainty of the sanction), and 2) the level of fraudulent vendors with prompt versus delayed punitive action when sanctions are issued to randomly chosen fraudulent vendors on a regular basis (as a proxy of the celerity of the sanction). This simulation also allows us to examine the deterrence effects of sanction choices that combine both dimensions (certainty and celerity) under a fixed level of severity. Thus, these experiments provide a chance to draw useful insights on the relative efficacy of sanction choices in a dynamic public service delivery system.
- 1.6
- The organization of this paper is as follows. We first present an agent-based modeling framework that includes key players and their attributes, decisions, and actions in a public service delivery program. We explain how the model was informed by the operation of a public service delivery program, existing theories of crime, and other relevant literature. Based on the simulation results, managerial insights are generated to inform public service delivery in practice. We conclude with a discussion on this developing approach as it applies to the design of effective policy interventions in order to prevent fraud in public service delivery programs.
Modeling a State's Public Service Delivery System
-
Agents
- 2.1
- The context of the model is the Women, Infants and Children (WIC) program in many U.S. states. In building the ABM for such a program, the delivery of services and behavior of the key players can be modeled as a series of interdependent actions and transactions among three types of agents. The local clinics and state agency can be collapsed into one agent. This public agency agent issues vouchers to recipients, monitors payments to vendors, and punishes vendors when they commit fraud. Recipient agents redeem their vouchers at the vendors responsible for delivering food and nutritional supplements to recipients on behalf of the public agency. The window of opportunity for illegal activities is presented during the benefit exchange between recipient and vendor, and decisions are based on the risk propensity of agents and opportunity to commit fraud at the moment of exchange. Finally, vendor agents commit fraud by misrepresenting the value of a voucher used during a fraudulent exchange to the public agency agent. Such a system can be depicted as shown in Figure 1.
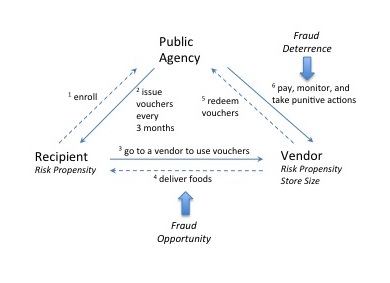
Figure 1. A Framework of the Agent-Based Model of a Public Service Delivery System - 2.2
- In the simulation, program recipients and vendors are explicitly introduced to the artificial world. The locations of recipients and vendors are randomly assigned when the simulation is initialized. Besides the location, no other environmental conditions are specified. The public agency agent is not explicitly presented in the world, but still performs its functions of monitoring and deterring fraudulent behaviors in the system. Table 1 presents the parameterization of the base model.
Table 1: The Parameterization of the Model Parameter Value Random seed Varies Number of program recipients 3,000 Number of vendors 100 Number of public agencies 1 Initial risk propensity for recipients, mean (standard deviation) 50 (15) Initial risk propensity for vendors, mean (standard deviation) Small vendors (1-2 checkout lanes) 50 (15) Medium vendors (3-7 checkout lanes) 20 (10) Large vendors (8+ checkout lanes) 10 (5) Random chance to search for an opportunity for high-risk propensity recipients who are not engaging in a fraudulent exchange (v) 0.1 Sanction effect on risk propensity (μ) 5 Percent of fraudulent vendors sanctioned out of total vendors 1%, 5%, 10% How fast a sanction is issued to selected fraudulent vendors 12 steps, 36 steps - 2.3
- Exchanging public benefits fraudulently is a crime, but also different from 'crimes of passion' such as homicide and other violent crimes. The crime opportunity perspective helps frame this type of calculative crime. For example, a group of environmental criminologists whose studies are based on routine activity theory have focused on crime as an event or action (Cohen & Felson 1979; Felson 1987; Eck 1995). A main thrust of this theory is that crime depends upon opportunities presented by routine activities in everyday life, where motivated offenders and suitable targets are converged in time and space without guardianship (Eck 1995). These recurrent and prevalent interactions deliver crime opportunities to the offender (Cohen & Felson 1979; Felson 1987).
- 2.4
- It has been debated whether one should distinguish criminal offenders from targets, regardless of crime type. The original routine activity theory was developed mainly to explain predatory offenses (Felson 1987), suggesting that some people are predisposed to greater risk as a target or have greater motivation to become an offender (Miethe & Meier 1990). When this theory is extended to other types of offenses, such as individual deviant behavior (Osgood et al. 1996) and white-collar crime (Felson 2002), the sharp distinction between offender and victim is not applicable to a large share of illegal or deviant behavior. To participate in illegal or deviant behavior, one needs to be present and willing when an opportunity arises. In everyday life, however, people may behave dishonestly enough to profit, but honestly enough to delude themselves about their own integrity (Ariely 2007; Mazar, Amir & Ariely 2008). Agents in our model are not pre-defined criminals, but their decision to engage in illegal benefit exchanges is jointly influenced by their risk propensity toward rule-breaking and the opportunities presented at the moment of a benefit exchange.
Risk Propensity toward Rule-Breaking
- 2.5
- The key attribute of each recipient and vendor in the model is the "risk propensity," which is a hypothetical property used to model the chance and change of an agent's decision toward fraudulent behavior. Crime propensity plays a key role in Wikström's situational action theory on crime. Wikström (2005) argues that the convergence between an individual's crime propensity and exposure initiates a perception-choice process, and the outcome of the process is an act of crime. In the present paper, 'risk propensity' is used as an instrumental concept that influences the legal or illegal behavior of agents. This property influences agents' decision-making for illegal voucher exchanges (fraud involvement), and is recursively influenced by agents' involvement in the illegal process.
- 2.6
- We are not aware of many empirical studies that explicitly examine the risk propensity distribution of individuals or organizations. As an exception, Wikström's (2010) study using adolescent and young adult data shows that crime propensity based on the composite score of morality and self-control scales is approximately normally distributed. As such, at the initial stage of the simulation, recipients' risk propensity is assigned with a truncated Gaussian distribution, with a mean of 50 and a standard deviation of 15 (ranging from min 0 to max 100). For vendor agents, the store size attribute is simultaneously considered in the risk propensity. By the USDA's definition (2007), small vendors are stores with 2 or fewer cash registers. Medium vendors indicate stores with 3 to 7 cash registers. Large vendors are stores with more than 7 cash registers. Previous government reports (USDA 2001; USDA 2007) have reported that fraud occurs more frequently among small vendors, so the initial risk propensities for vendor agents are also assumed to be normally distributed with different levels and variances depending upon the vendor size (i.e., less than 3 checkout lanes: a mean of 50 (standard deviation (SD): 15); 3-7 checkout lanes: a mean of 20 (SD: 10); greater than 7 checkout lanes: a mean of 10 (SD: 5)).
- Assumption 1: The distribution of risk propensity among agents at the beginning is approximately normal. The smaller the vendor, the higher the risk propensity and the larger the variance of the risk propensity.
Interaction and Decision Rules
- 2.7
- Once agents are generated in the simulated world, the recipient faces a decision regarding the choice of vendors. At the beginning of the simulation, recipient and vendor agents are generated with their location. Store size is also assigned for vendor agents, reflecting the empirical distribution of stores by the number of checkout lanes in WIC vendor studies (USDA 2001; USDA 2007). Using the Huff spatial interaction model (1964), each recipient's store choice is modeled. In the Huff model, the probability of a consumer visiting a particular store (Pij) is calculated as a relative measure that is the ratio of the utility of that store (Uij) to the sum of utilities of all stores considered by the consumer. Formally, it is shown as
Pij = Uij / Σ(Uij) = Sj α ⋅Dij β / Σ(Sj α ⋅Dij β) (1) where i and j indicate the ith consumer and the jth store, respectively. The utility consists of two decision factors for store choice, the store size of i (Si) and the Euclidian distance between i and j (Dij). Sensitivity parameters were assigned as α = 1 and β = -2 following the Newtonian analogy, where the square of distance is an appropriate power function in gravity models (Haynes & Fotheringham 1984). Using this rule, each recipient has a preference list for vendor selection.
- Assumption 2: Recipients' store choice follows Huff's spatial interaction model. When a recipient visits a vendor based on the store choice rule, an opportunity to engage in illegal behavior is presented in the process of a benefit exchange.
Whether agents decide to engage in illegal benefit exchanges or not at the initial encounter is based on agents' initial risk propensity levels and a result of a coin toss, because the recipient and vendor agent do not have information on one another. For example, Wikström (2010) distinguished people with low, medium, and high risk propensities using a standard deviation. Similarly, both agents in the simulation in the present study were grouped by their risk propensity at one of five levels (extremely low: <10; low: 10-33; medium: 34-66; high: 67-90; extremely high: >90). An agent with extremely high risk propensity would have a 50% chance of engaging in an illegal exchange. The chance of engaging in illegal behavior for the next group diminishes to 25% for those with a high risk propensity, 10% for those with a medium risk propensity, 5% for those with a low risk propensity, and no chance for those with an extremely low risk propensity.
- Assumption 3: The higher the risk propensity of the group, the greater the chance of engaging in illegal benefit exchanges.
- 2.8
- As a result, four possible benefit exchange outcomes can occur between a recipient and a vendor: (a) both agents agree to involvement in an illegal benefit exchange, (b) both agree not to be involved in an illegal benefit exchange, (c) the vendor wants an illegal benefit exchange while the recipient does not, and (d) the vendor does not want an illegal benefit exchange while the recipient does. If the outcome is an agreement between the two parties (i.e., (a) or (b)), the recipient agent continues to visit the vendor and use the benefits dishonestly or honestly. For recipient agents who are not engaging in illegal benefit exchanges (i.e., (b)) but have a relatively high risk propensity (greater than 66), a random chance (v) is introduced in each step to lead the recipient to seek out another vendor agent. If agents disagree with a fraudulent voucher exchange (i.e., (c) or (d)), the recipient agent also moves to the next vendor selected by the store choice rule and goes through the benefit exchange process with a new vendor until a successful (legal or illegal) agreement on benefit exchange occurs. However, vendors are ultimately the party who misrepresent the actual amount of benefits used during the fraudulent exchange to a public agency agent because they redeem benefit vouchers collected from recipients every month.
- Assumption 4: Fraudulent exchange is an outcome of the interaction between vendors and recipients based on chance and agents' risk propensities at the moment of benefit exchange.
- 2.9
- The fraud and subsequent decisions regarding illegal benefit exchanges trigger a small change in the risk propensity for both recipients and vendors. When a recipient engages in an illegal exchange, that agent's risk propensity increases by 3 x units. If a recipient refuses to engage in an illegal exchange, that agent's risk propensity decreases by x unit. When a vendor engages in an illegal exchange, the vendor agent's risk propensity increases by 0.1 x unit every y incidences, depending upon vendor size (small vendors: every 5 incidences, medium vendors: every 10 incidences, and large vendors: every 20 incidences), and if that same vendor refuses to engage in illegal exchange, the risk propensity decreases by 0.1 x unit every y incidences. According to this assumption, small vendors are more sensitive to the experience of fraudulent benefit exchanges. For a normal benefit exchange between recipient and vendor agents (outcome (b)), the risk propensity for both agents remains the same as in the previous simulation steps.
RP t+1 = RPt + ΔRPt (2) ΔRPt = xgt + x(1-gt)ht = x(gt + (1-gt)ht) (3) where gt = 1 if fraud occurs (0 otherwise), ht = 1 if an agent attempts a fraudulent exchange and 1 if an agent refuses a fraudulent exchange (0 otherwise), and x is the change rate.
- Assumption 5: A successful fraudulent exchange of benefits increases agents' risk propensity, whereas a failed exchange decreases agents' risk propensity. There is no change in the risk propensity for normal exchanges between agents.
- 2.10
- Table 2 summarizes the assumption about the interactions between vendors and participants for benefit exchanges, their decision outcomes, and the consequences for risk propensities.
* Recipients assigned with a high risk propensity (>66) have a v% random chance at each step to move to a vendor who is willing to engage in fraudulent benefit exchanges with them.Table 2: Benefit Exchange Types, Outcomes, and Consequences Between Recipients and Vendors A recipient wants to exchange benefit fraudulently? No Yes A vendor wants to exchange benefit fraudulently? No (b) Normal exchange*
PRP: no change
VRP: no change(d) Failed exchange†
PRP: Δ
VRP: ∇Yes (c) Failed exchange†
PRP: ∇
VRP: Δ(a) Fraudulent exchange
PRP: Δ
VRP: Δ
† Recipients move to next choice because the exchange failed.Monitoring and Sanctioning Rules
- 2.11
- The processes above simulate routine operations (i.e., normal benefit exchange processes) and unusual activities (i.e., fraudulent benefit exchanges) among program recipients and vendors in the state's public service delivery programs. During the program operation, the public agency agent performs two functions: monitoring and sanctioning, which are primary functions of the states that implement these programs. The simulation is informed from the states' practices regarding these functions following federal regulations.
- 2.12
- The state programs are asked on a regular basis to identify those with a high probability of committing vendor violation (i.e., high-risk vendors): "The State agency must identify high-risk vendors at least once a year using criteria developed by FNS and/or other statistically-based criteria developed by the State agency" (USDA 2000, p. 406). To comply with this rule, public service delivery programs often examine aggregate transaction patterns (e.g., WIC sales volumes at vendors) that can signal potential rule violations. After identifying high-risk vendors based on certain criteria, the state agency must conduct compliance investigations on all high-risk vendors up to the 5% minimum each fiscal year. If fewer than 5% of vendors are identified as high-risk, then the state agency must randomly select additional vendors to conduct the investigation up to 5% of vendors. When an actual rule violation is identified from the investigation, the state agency notifies a vendor in writing (e.g., warning letter) in order to establish a pattern of violations. Based on this practice, the agency can impose a sanction on a vendor, if necessary. In the WIC program, the state agency sanctions include disqualifications, civil money penalties assessed in lieu of disqualification, and administrative fines (USDA 2000, p. 410).
- 2.13
- We simplify the complicated process of the states' monitoring and sanctioning procedures. In this simulation, vendor agents are monitored based on the percentage of illegal benefit exchanges that transpired out of the total number of exchanges occurring in their store every simulation step. If the percentage of illegal benefit exchanges is greater than 10% per checkout lane, then the public agency agent recognizes the abnormal transaction pattern, tags the vendor as high risk (and fraudulent in this paper for simplicity of modeling), and tracks the number of these vendors in the system.
- Assumption 6: If the proportion of fraudulent exchanges is greater than 10% per checkout lane, the vendor is categorized as fraudulent and assumed to be caught by the public agency agent given abnormal WIC sales volume per checkout lane.
- 2.14
- We then introduce sanction scenarios that show how the public agency may intervene with fraudulent vendors given the regulation. First, the public agency agent sanctions 5% of vendors (randomly selected among fraudulent vendors if more than 5% of vendors are fraudulent in the system) within a certain time period. For example, if there are 100 vendors in the program and more than 5 vendors are identified as being fraudulent at the moment of sanctioning, the public agency agent randomly selects and sanctions 5 fraudulent vendors. If there are less than or equal to 5% fraudulent vendors in the system at the moment of sanction, only those identified as fraudulent are sanctioned. We experiment with the sensitivity of this rule in the simulation.
- Scenario 1: The public agency agent issues sanctions to 0% (no sanction scenario), 1%, 5%, or 10% of vendors (i.e., fraudulent vendors).
- 2.15
- Another variable in the sanction rule can influence the dynamics of fraudulent benefit exchanges in the system. The public agency agent makes a decision on how promptly to take punitive action with selected fraudulent vendors. The present model distinguishes the swiftness of punitive actions at two levels. Slow or fast ratings describe sanctions for the chosen percent of fraudulent vendors every 36 steps versus 12 steps, respectively. This captures the promptness of sanctions in response to illegal behavior.
- Scenario 2: The public agency agent issues sanctions to selected fraudulent vendors every 12 steps ( prompt; F) or every 36 steps (delayed; S).
- 2.16
- Finally, there are different severity levels of sanctions for fraudulent vendors (e.g., fines and civil penalties). When a fraudulent vendor receives a sanction, the severity values influence the vendor's current risk propensity as follows:
VRP t+1 = VRPt - μ (4) where VRP t is the risk propensity of a vendor at step t and μ is the change in risk propensity, which varies based on the severity level. Here we fix the severity value of the sanction because certainty and celerity conditions in the two scenarios are the main focus in our experiments.
- 2.17
- Next, vendors renegotiate with recipients who are visiting them based on their adjusted risk propensities, which influences the subsequent fraud decisions and behavioral choices. Behavioral changes due to a sanction mean that vendors have a lower chance of engaging in illegal voucher exchanges, which helps them avoid being identified as fraudulent during the next monitoring phase. This is a radically simplified version of the monitoring and sanctioning of fraudulent vendors in public service delivery programs.
Results
- 3.1
- The conceptual model was implemented using the NetLogo simulation toolkit. The simulation world consists of 201 × 201 grid cells (i.e., 40,401 plots). The simulation generates 100 vendors with 3,000 recipients served by 1 public agency in each simulation. We run the simulation 200 times and average the percent of fraudulent vendors at each step t.
- 3.2
- To observe the dynamics of fraud in the artificial system, we define LFVB as the base level of fraudulent vendors identified in the system without sanction. On the other hand, LFVS is defined as the level of fraudulent vendors in the system when a sanction scenario (s) is implemented. In a solution space, LFVS is expected to be smaller or equal to LFVB at the same t because a sanction lowers the risk propensity of fraudulent vendors who were sanctioned and, as a result, makes them change their exchange behavior in the following steps.
- 3.3
- Figure 2 presents the dynamics of LFVB and LFVS in the artificial system, allowing us to compare the simulation outcomes without and with sanction efforts. Without any sanctions (i.e., deterrence efforts from a public agency agent), LFVB were monotonically increasing and later converged at a certain level as step ( t) increases. That is, LFVB increased to approximately 20% of vendors at the end of the simulation with the base parameter set (labeled as base). This also implies that even if there is no sanction effort, not every agent engages in fraudulent behavior. Some, but not all, agents engaged in fraudulent behavior, regardless of sanction. This 'no sanction' scenario result is presented in Figure 2(a)-(c) in order to provide a reference for the results with sanction.
- 3.4
- In Figure 2(a), 5% of randomly selected fraudulent vendors received a sanction every 12 steps (labeled as F) or every 36 steps (labeled as S). With this (5%, F) scenario, the public agency agent promptly takes punitive action against fraudulent vendors as compared with the (5%, S) scenario. Implementing a sanction to 5% of fraudulent vendors significantly reduced LFVS compared to LFVB. When the public agency agent's action is prompt and regular (5%, F), LFVS in the public service delivery system reached 2% at the end of the simulation. On the other hand, even if the proportion of fraudulent vendors sanctioned remained at the same level (5%), LFVS was two or three times higher when the public agency agent took action relatively slowly (5%, S) as compared with the (5%, F) scenario.
- 3.5
- Figure 2(b) presents the results for similar scenarios, but this time the percent of fraudulent vendors receiving a sanction was reduced to 1%, a very small percentage. The interval to intervene with selected fraudulent vendors was the same as above, 12 steps versus 36 steps. The performance of the sanction scenario was expected to be inferior to that in Figure 2(a) given the number of fraudulent vendors sanctioned. However, even slow intervention with a minimum number of fraudulent vendors (1%, S) lowered LFVS to approximately 13-14% as compared with 20% when no sanction exists. The regular prompt punitive action taken with 1% of fraudulent vendors surprisingly reduced LFVS over time (to approximately 4-6%). It appears that this (1%, F) scenario performs similarly to the (5%, S) scenario presented in Figure 2(a). This is true at the beginning of the simulation (at step 100), t (398) = -1.92, p > 0.05. However, a significant mean difference between the two scenarios is observed over time. At step 400, the hypothesis of no difference is rejected, t (398) = -13.94, p < .001, with the (1%, f) scenario showing higher mean in the level of fraudulent vendors than the (5%, s) scenario. The (5%, s) scenario indeed performs better than the (1%, f) scenario at the end.
- 3.6
- Figure 2(c) reports the simulation results when 10% of vendors who were fraudulent received a sanction. As more fraudulent vendors received a sanction that influenced their engagement in fraudulent benefit exchanges, the level of fraudulent vendors in the system was reduced much more than in the previous scenarios. The deterrent effect was significant, and there were rarely fraudulent vendors in the system with the 10% scenario. Note that the punitive action was taken regularly based on celerity conditions during the simulation. Figure 2(c) suggests that it may not be necessary for the public agency agent to sanction all fraudulent vendors in order to reduce the level of fraudulent vendors. As long as a sufficient number of fraudulent vendors are sanctioned by the public agency agent, a significant deterrence effect can be achieved.
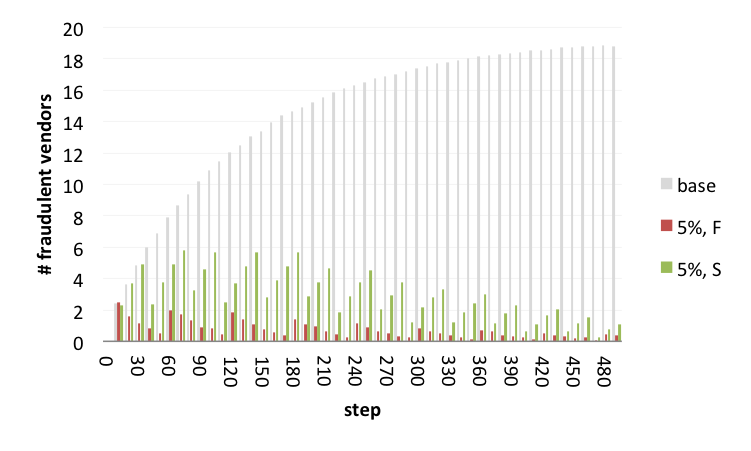
Figure 2a. Percent of Fraudulent Vendors in the System (N = 100): (a) Sanctioning 5% of randomly selected vendors who are fraudulent 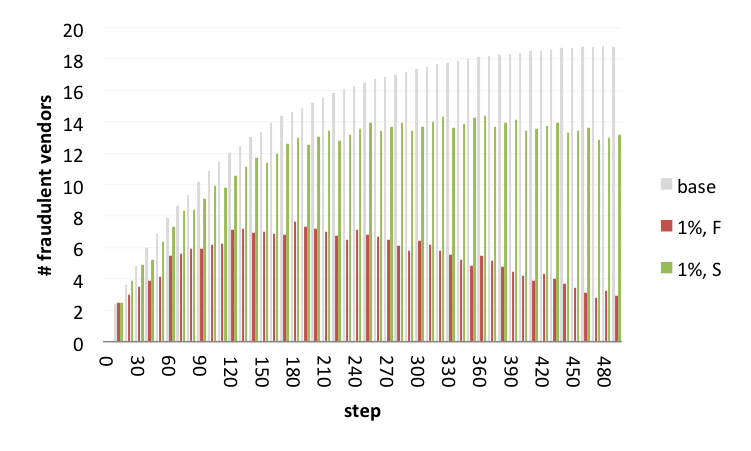
Figure 2b. Percent of Fraudulent Vendors in the System (N = 100): (b) Sanctioning 1% of randomly selected vendors who are fraudulent 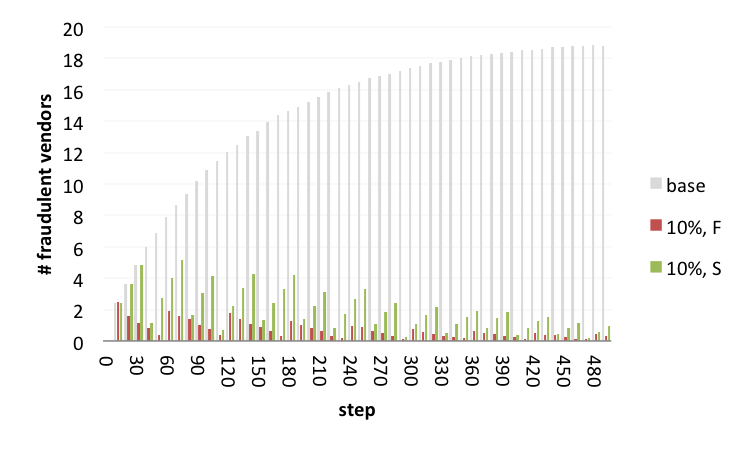
Figure 2c. Percent of Fraudulent Vendors in the System (N = 100): (c) Sanctioning 10% of randomly selected vendors who are fraudulent Note: Gray bars represent the percent of fraudulent vendors without a sanction. Green bars represent the results when a sanction was sent to a certain percent of fraudulent vendors every 36 steps (S). Red bars report the results when the same effort was implemented every 12 steps (F).
- 3.7
- From close examination of the three charts in Figure 2, LFVS looked similar in some sanction scenarios (e.g., (5%, S) and (1%, F)). Figure 3 presents the performance of a set of such sanction scenarios. In Figure 3(a), we first compared the LFVS values for three sanction scenarios: (5%, F), (10%, F), and (10%, S). There is not much difference in the performance of sanction scenarios (5%, F) and (10%, F). To achieve the level of performance produced by the two scenarios, the public agency agent can implement either scenario. In other words, if the public agency agent intervenes with fraudulent vendors relatively promptly, the percent of fraudulent vendors sanctioned (whether it is 5% or 10%) does not make much difference in terms of the deterrence effect. However, when the punitive action is taken slowly or delayed, a relatively higher LFVS value occurred, even when sanctioning more fraudulent vendors (10%, S) as compared with the (5%, F) scenario.
- 3.8
- Figure 3(b) presents another set of sanction scenarios: (1%, F), (5%, S), and (10%, S). The three scenarios performed at similar levels in terms of the deterrence of fraudulent vendors at the beginning of the simulation. The level of fraudulent vendors remained very close between the (5%, S) and (10%, S) scenarios during the simulation. From Figure 3(a), the progress of fraudulent vendor levels looks extremely similar when the public agency agent takes prompt punitive action in the 5% or 10% sanction scenarios. In Figure 3(b), when the public agency agent takes slow punitive action with fraudulent vendors, the percent of fraudulent vendors sanctioned (5% versus 10%) makes a slight difference in the deterrence effect. On the other hand, a gap between those two scenarios and the (1%, F) scenario emerged as the simulation progressed. Sanctioning only 1% of vendors was less effective than the other two sanction scenarios, even if the intervention was prompt. These figures provide a comparative perspective of sanction choices that can be alternatives in the program for policy makers.
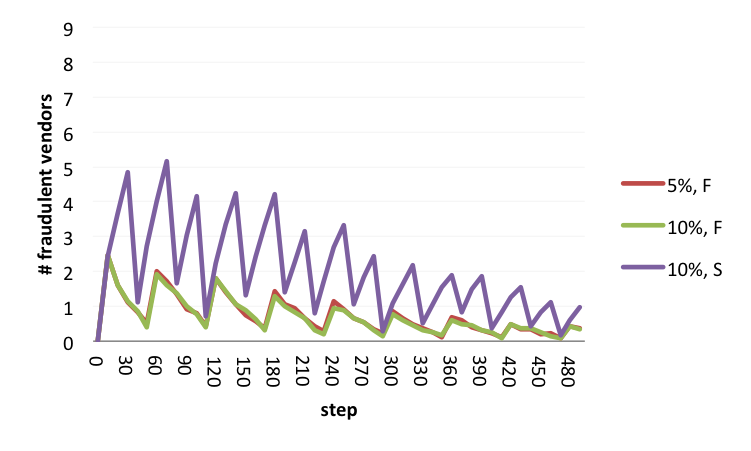
Figure 3a. Comparison of Sanction Scenario Performance: (a) (5%, F) performs equally to (10%, F) and better than (10%, S) 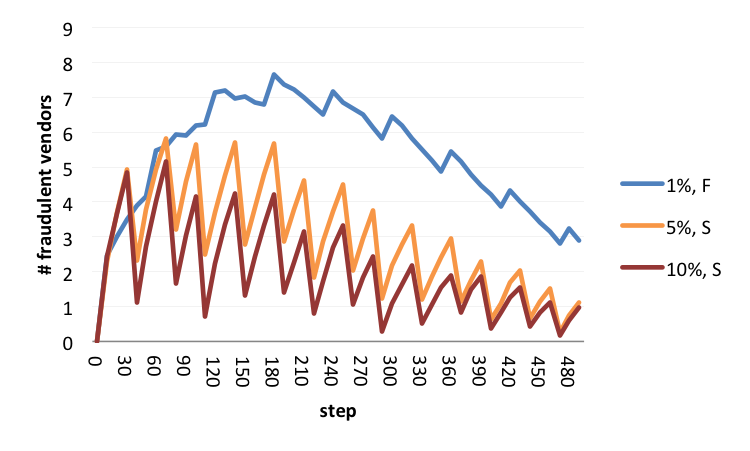
Figure 3b. Comparison of Sanction Scenario Performance: (b) (5%, S) performs similarly to (10%, S) Summary
- 3.9
- Figure 4 summarizes the distribution of the percent of fraudulent vendors under different sanction choices in the box-plots. The level of fraudulent vendors in the system was grouped by three certainty conditions and two celerity conditions of sanction choices over time (t = 100, 200, 300, and 400). First, the performance of sanctioning 1% of fraudulent vendors is very different from that of sanctioning 5% or 10% of vendors. With the 1% sanction scenario, the percent of fraudulent vendors increases at the beginning and then decreases over time. This is not the case for the 5% or 10% scenarios. These scenarios decrease fraudulent vendors right after the simulation starts to run. How promptly the public agency takes action makes a difference to the level of fraudulent vendors, mostly when it is associated with the 1% sanction scenario. Second, the 5% and 10% sanction scenarios perform very similarly in terms of the deterrent effect. With the 5% or 10% scenario, prompt actions make a slight difference in the level of fraudulent vendors, but not as much as with the 1% scenario. If the public agency agent aims to maintain the level of fraudulent vendors at a level of less than 5% in the system, they can choose either the 5% or 10% scenario regardless of promptness of action because they can achieve the goal with either scenario.
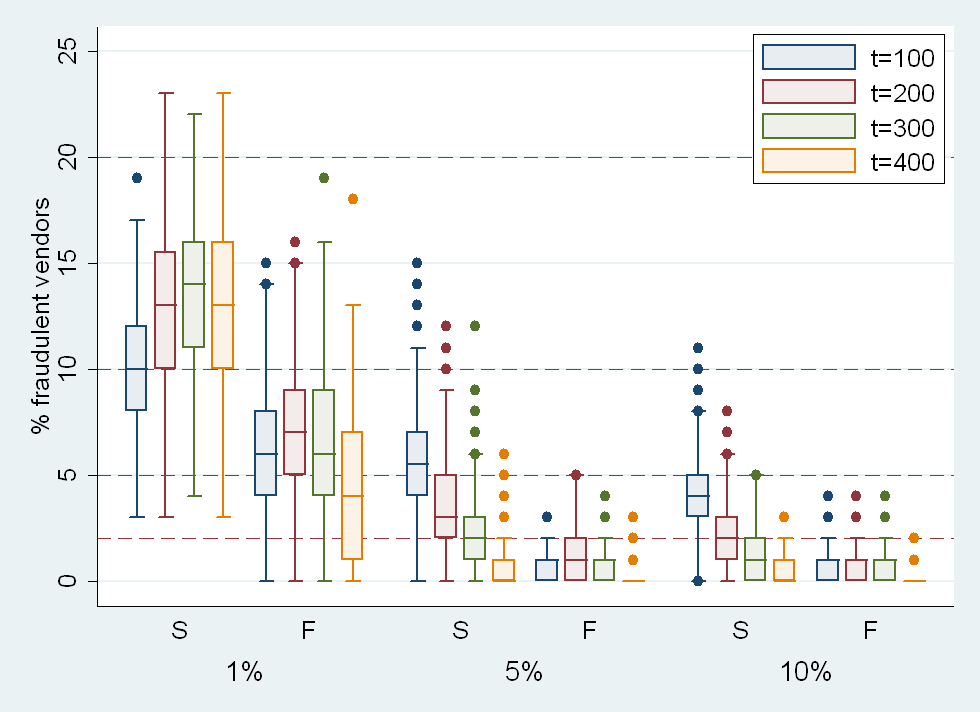
Figure 4. The Percent of Fraudulent Vendors by Sanction Choice Note: The percent of fraudulent vendors in the system is displayed on the y-axis by the percent of fraudulent vendors sanctioned (1%, 5%, or 10%) and the promptness of the sanction (S: every 36 steps and F: every 12 steps) on the x-axis.
Discussion
- 4.1
- This paper focuses on the issue of fraudulent benefit exchanges in public service delivery programs, such as WIC. Following the focused concern on WIC's integrity and follow-up regulations in the 1990s, WIC vendors' practices have significantly improved (USDA 2007). The United States Department of Agriculture (USDA) conducted three national studies of WIC vendors in 1991, 1998, and 2005. The 2005 study (USDA 2007) indicated that the frequency and monetary loss of overcharging and undercharging reached historically low rates in 2005, and that small vendors or vendors that violate administrative rules (e.g., such as not providing a required receipt) are more likely to overcharge than larger vendors or rule-following vendors. Regulatory changes after the 1998 study appear to have impacted the practice of WIC delivery. To better understand the dynamics of benefit exchanges among key players along with the sanction choices in such a program, we designed an agent-based model and conducted computational experiments.
- 4.2
- The simulation presents insightful deterrent patterns regarding the relative effect of sanction scenarios on rule-breaking behaviors, focusing on the percent of fraudulent vendors sanctioned (certainty) and the promptness of punitive action taken by the public agency (celerity). Celerity in the form of promptness may be conditional on certainty in terms of the reduction in fraudulent vendors. Even regular, prompt policy action taken among a small percentage (1%) of fraudulent vendors brought relatively large deterrent effects. However, celerity may not be separated from certainty. When a sanction was implemented for 1% of fraudulent vendors, prompt action was not as effective as in the 5% or 10% scenarios with delayed action (Figure 3(b)). The joint effect of certainty and celerity requires further attention in studies on deterrence.
- 4.3
- Figure 4 suggests that there may be critical certainty conditions that policy makers need to pay attention to. Regardless of promptness, there was little difference in terms of the deterrence effect between the 5% and 10% sanction scenarios. Both sanctions drastically reduce the level of fraudulent vendors and lead to very similar levels of fraudulent vendors in the system. However, these scenarios performed very differently as compared with the 1% scenario. If a similar level of deterrence effect can be achieved from the 5% and 10% scenarios, the public agency can choose the one that is most cost effective. Thus, identifying such a critical level of certainty in public service delivery programs can be crucial for policy makers.
- 4.4
- The simulation results also indicate that public agencies can make strategic choices to manage fraudulent vendors, considering both certainty and celerity. If the agency plan is to react to fraudulent vendors promptly on a regular basis, then the percent of fraudulent vendors sanctioned may be less critical as long as the proportion of fraudulent vendors sanctioned reaches a critical level. If the agency delays intervening with fraudulent vendors, the agency may need to increase the percent of fraudulent vendors sanctioned in order to achieve a low level of fraudulent vendors in the system. From a decision-maker's point of view, these scenarios can be indifferent in terms of effectiveness. Other criteria can be utilized depending upon the operation condition of the organization. In other words, the public agency can utilize different sanction choices to satisfy its needs, all of which may perform reasonably well.
- 4.5
- Deterrence theory has served as a theoretical foundation of sanctions on illegal activities. Since the publication of Crime and Punishment (Becker 1968), this rational choice approach to crime has been rigorously studied (Cooter & Ulen 2007). According to this perspective, an individual commits a crime only when he or she believes that the benefits gained by the act of offending will outweigh the potential costs. For a criminal, the expected cost might be produced by two elements, the certainty and severity of punishment. An increase in the certainty or severity of punishment for an offense would increase potential offender's perceived costs, thereby discouraging them from engaging in criminal behaviors, which may result in a lower crime level in a society. This view certainly contrasts with the crime opportunity perspective (e.g., routine activity theory) that describes how crime occurs during the routine of daily activities, because this view places more emphasis on the dimension of punishment.
- 4.6
- Most of the early empirical deterrence studies that relied on aggregate data indicated a negative relationship between the certainty of punishment and the crime rate, as well as a weak or non-existent relationship between the severity of punishment and the crime rate (Antunes & Hunt 1973; Ayres & Levitt 1998; Grogger 1991). On the other hand, perceptual studies explicitly attempted to assess the relationship between individuals' perceived certainty and severity of punishment and behavior, producing conflicting empirical findings (Grosvenor, Toomey & Wagenaar 1999; Hollinger & Clark 1983). A recent meta-analysis showed that the mean effect of the relationship between deterrence variables and crime was modest to negligible, and the certainty of punishment was most consistently supported for white-collar crimes (Pratt et al. 2008).
- 4.7
- While the deterrent effect of certainty and severity and the interaction between the two have been evaluated for various criminal behaviors, few have assessed the influence of the swiftness of punishment or its interplay with other dimensions. Despite emphasis on this topic by early deterrence scholars such as Beccaria, punishment imminence has been largely ignored in empirical tests (Selke 1983). In theory, a delay in punishment should diminish the deterrent effect, but evidence for such a relationship is scant (Clark 1988; Pratt et al. 2008). Results from a few studies are not very supportive of the deterrent effect of celerity (Bailey 1980; Yu 1994). When all three variables were considered, celerity had no deterrent effect on behavior (Nagin & Pogarsky 2001) or had only minimal effects (Howe & Loftus 1996). In contrast to what intuition would indicate, the role of celerity as a deterrent variable is not well supported in the existing deterrence literature. This article considers the under-explored and counterintuitive dimension of a formal sanction (celerity) along with certainty and severity, because the dynamic simulation model is a natural platform to explore such a dimension of sanction and punishment.
- 4.8
- We must note that the monitoring and sanction rules are operationalized with crude proxies of such key constructs in the deterrence theory: certainty and celerity. We did not make a distinction between the probability of being caught and the probability of being punished once caught. Instead, the percent of fraudulent vendors sanctioned was used to represent a dimension of sanction certainty. We also did not define celerity as swiftness between being caught and being punished but rather as an interval between punitive actions taken for fraudulent vendors. Therefore, the simulation pattern should be interpreted with caution when relating them to findings in empirical deterrence studies.
Limitations
- 4.9
- This study bears many limitations found in studies based on simulation. The simulation was developed to model a public service delivery program in a specific context, so revisions and updates are required when one attempts to use the framework in other contexts. Recipient and vendor agents make store choices and fraud decisions immediately upon meeting, but in reality, decisions may take longer and both parties may go through a trial-and-error process. Other characteristics or situations, such as historical relationships, an informal social network, or reputation effect, may also influence how decisions are made. The simulation can also be enhanced by incorporating several constraints that public agencies confront, such as resources, capacity, and the legal environment. These limitations (as related to building a 'realistic, but not too simple' model) are ongoing discussion points for the use of computational simulation models (Grimm et al. 2005). Finally, several parts of the current model, such as the distribution and a change in risk propensities due to fraud involvement, are based on heuristics. This limitation of modeling provides an opportunity to identify gaps in the current body of knowledge, and also serves as a challenge to build empirically motivated, robust simulation models.
Conclusion
- 5.1
- Perhaps the fraudulent behavior of some members in any public service delivery programs is inevitable. However, public agencies may still be able to regulate such behavior at a very minimal level. This article provides a research framework to study the dynamic phenomenon of fraud in such programs, and offers insights on the use of the framework in studying the anticipated consequences of policy actions. This approach helps us refine knowledge on the sanction choices needed to deter illegal behaviors in complex social systems and allows us to draw useful policy insights for managerial decision-making. Insights from this effort can provide a base for future empirical studies that simultaneously consider the three dimensions of punishment on rule-breaking behavior.
Acknowledgements
- The current simulation was designed using a Java language in conjunction with the MASON simulation toolkit, as well as NetLogo. Programming code is available upon requests. We are grateful for the feedback of participants at the 30th Research Conference of the Association for Public Policy Analysis and Management, Los Angeles, CA, November 6-8, 2008, and at the 10th Public Management Research Conference, Columbus, OH, December 1-3, 2009. In particular, the useful comments of Heather Campbell at Claremont Graduate University, Jennifer Auer and Callie McGraw at Arizona State University, and Roy Heidelberg at Louisiana State University, also improved the manuscript. The study was supported by the National Research Foundation of Korea Grant funded by the Korean Government (NRF-2010-330-B00262).
References
-
ANTUNES, G. and Hunt, A. L. (1973). The impact of certainty and severity of punishment on levels of crime in American states: An extended analysis. The Journal of Criminal Law and Criminology, 64(4), 486-493. [doi:10.2307/1142449]
ARIELY, D. (2007). Predictably irrational: The hidden forces that shape our decisions. New York: HarperCollins Publishers.
AYRES, I. and Levitt, S. D. (1998). Measuring positive externalities from unobservable victim precaution: An empirical analysis of Lojack. The Quarterly Journal of Economics, 113(1), 43-77. [doi:10.1162/003355398555522]
BAILEY, W.C. (1980). Deterrence and the celerity of the death penalty: A neglected question in deterrence research. Social Forces, 58(4), 1308-1333. [doi:10.1093/sf/58.4.1308]
BECKER, G. S. (1968). Crime and punishment: An economic approach. In R. Febrero & P. S. Schwartz. (Eds.), The Essence of Becker (pp. 463-517). Stanford: Hoover Institution Press. [doi:10.1086/259394]
BOSSE, T. and Gerritsen, C. (2010). Social simulation and analysis of the dynamics of criminal hot spots. Journal of Artificial Societies and Social Simulation 13 (2) 5 https://www.jasss.org/13/2/5.html
CLARK, R.D. (1988). Celerity and specific deterrence: A look at the evidence. Canadian Journal of Criminology, 30(2), 109-120.
COHEN, L. E. and Felson, M. (1979). Social change and crime rate trends: A routine activity approach. American Sociological Review, 44(4), 588-608. [doi:10.2307/2094589]
COOTER, R.D. and Ulen, T. (2007). Law and economics (5th ed.). Boston: Pearson Addison Wesley.
ECK, J.E. (1995). Examining routine activity theory: A review of two books. Justice Quarterly, 12(4), 783-797. [doi:10.1080/07418829500096301]
ECK, J.E. and Liu, L. (2008). Contrasting simulated and empirical experiments in crime prevention. Journal of Experimental Criminology, 4(3), 195-213. [doi:10.1007/s11292-008-9059-z]
EPSTEIN, J. M. (2006). Generative social science: Studies in agent-based computational modeling. Princeton: Princeton University Press.
FELSON, M. (1987). Routine activities and crime prevention in the developing metropolis. Criminology, 25(4), 911-931. [doi:10.1111/j.1745-9125.1987.tb00825.x]
FELSON, M. (2002). Crime and everyday life (3rd ed.). Thousand Oaks, CA: Sage Publications.
FONOBEROVA, M., Fonoberov, V.A., Mezic, I., Mezic, J. and Brantingham, P.J. (2012). Nonlinear dynamics of crime and violence in urban settings. Journal of Artificial Societies and Social Simulation 15 (1) 2 https://www.jasss.org/15/1/2.html
GILBERT, N. and Troitzsch, K.G. (2005). Simulation for the social scientist (2nd ed.). New York: Open University Press.
GRIMM, V., Revilla, E., Berger, U., Jeltsch, F., Mooij, W. M., Railsback, S. F., Thulke, H., Weiner, J., Wiegand, T. and DeAngelis, D. L. (2005). Pattern-oriented modeling of agent-based complex systems: Lessons from ecology. Science, 310, 987-991. [doi:10.1126/science.1116681]
GROFF, E.R. (2007). Simulation for theory testing and experimentation: An example using routine activity theory and street robbery. Journal of Quantitative Criminology, 23(2), 75-103. [doi:10.1007/s10940-006-9021-z]
GROGGER, J. (1991). Certainty vs. severity of punishment. Economic Inquiry, 29(2), 297-309. [doi:10.1111/j.1465-7295.1991.tb01272.x]
GROSVENOR, D., Toomey, T. L. and Wagenaar, A. C. (1999). Deterrence and the adolescent drinking driver. Journal of Safety Research, 30(3), 187-191. [doi:10.1016/S0022-4375(99)00013-4]
HAYNES, K.E. and Fotheringham, A.S. (1984). Gravity and spatial interaction models. Beverly Hills, CA: Sage Publications, Ltd.
HEDDELL, G. S. (2002, June 11). Statement of Gordon S. Heddell. Before the Committee on Ways and Means. Subcommittee on Human Resources. U.S. House of Representatives.
HOLLINGER, R. C. and Clark, J. P. (1983). Deterrence in the workplace: Perceived certainty, perceived severity, and employee theft. Social Forces, 62(2), 398-418. [doi:10.1093/sf/62.2.398]
HOWE, E. S. and Loftus, T. C. (1996). Integration of certainty, severity, and celerity information in judged deterrence value: Further evidence and methodological equivalence. Journal of Applied Social Psychology, 26(3), 226-242. [doi:10.1111/j.1559-1816.1996.tb01848.x]
HUFF, D.L. (1964). Defining and estimating a trading area. Journal of Marketing, 28(3), 34-38. [doi:10.2307/1249154]
MARCY, M.W. and Willer, R. (2002). From factors to actors: Computational sociology an agent-based modeling. Annual Review of Sociology, 28, 143-166. [doi:10.1146/annurev.soc.28.110601.141117]
MAZAR, N., Amir, O. and Ariely, D. (2008). The dishonesty of honest people: A theory of self-concept maintenance. Journal of Marketing Research, XLV, 633-644. [doi:10.1509/jmkr.45.6.633]
MIETHE, T.D. and Meier, R. F. (1990). Opportunity, choice, and criminal victimization: A test of a theoretical model. Journal of Research in Crime and Delinquency, 27(3), 243-266. [doi:10.1177/0022427890027003003]
NAGIN, D.S. and Pogarsky, G. (2001). Integrating celerity, impulsivity, and extralegal sanction threats into a model of general deterrence theory and evidence. Criminology, 39(4), 865-891. [doi:10.1111/j.1745-9125.2001.tb00943.x]
OSGOOD, D.W., Wilson, J.K., O'Malley, P.M., Bachman, J.G., & Johnston, L.D. (1996). Routine activities and individual deviant behavior. American Sociological Review, 61(4), 635-655. [doi:10.2307/2096397]
PRATT, T.C., Cullen, F.T., Blevins, K.R., Daigle, L.E. and Madensen, T.D. (2008). The empirical status of deterrence theory: A meta-analysis, In F.T. Cullen, J.P. Wright, & K.R. Blevins (2008). Taking Stock: The Status of Criminological Theory (pp. 367-395). New Brunswick, NJ: Transaction Publishers.
PROVOST, F. (2002). Comment on "statistical fraud detection: A review," Statistical Science, 17(1), 249-251.
RAUHUT, H. and JUNKER, M. (2009). Punishment deters crime because humans are bounded in their strategic decision-making. Journal of Artificial Societies and Social Simulation 12 (3) 1 https://www.jasss.org/12/3/1.html
SELKE, W.L. (1983). Celerity: The ignored variable in deterrence research. Journal of Policy Science and Administration, 11(1), 31-37.
USDA. (2000). Federal Register, Part VI. CFR. Part 246.
USDA. (2001). WIC vendor management study 1998 (Report No. WIC-01-WICVM).
USDA. (2007). 2005 WIC vendor management study (Report No. WIC-06-WICVM-02)
VANDENBURGH, H. (2005). Home health care fraud in the 1990s: Did region play a role? Journal of Economic Crime Management, 13(1), 1-13.
WAIT, B. (1997). Combating benefits fraud: The case of the South Australian workers rehabilitation and compensation system. Crime Law and Social Change, 26(3), 253-270.
WIKSTRÖM, P.H. (2005). The social origins of pathways in crime: Towards a developmental ecological action theory of crime involvement and its changes, In D. P. Farrington (ed.), Integrated Developmental & Life-Course Theories of Offending (pp. 211-245). New Brunswick: Transaction Publishers.
WIKSTRÖM, P.H. (2010). Activity fields and the dynamics of crime: Advancing knowledge about the role of the environment in crime causation. Journal of Quantitative Criminology, 26, 55-87. [doi:10.1007/s10940-009-9083-9]
WILHELM, W. K. (2004). The fraud management lifecycle theory: A holistic approach to fraud management. Journal of Economic Crime Management, 2(2).
YE, H., Tan, F., Ding, M., Jia, Y. and Chen, Y. (2011). Sympathy and Punishment: Evolution of Cooperation in Public Goods Game. Journal of Artificial Societies and Social Simulation 14 (4) 20 https://www.jasss.org/14/4/20.html
YU, J. (1994). Punishment celerity and severity: Testing a specific deterrence model on drunk driving recidivism. Journal of Criminal Justice, 22(4), 355-366. [doi:10.1016/0047-2352(94)90082-5]