
 Abstract
- This paper examines the evolution of the pharmaceutical industry. After a brief discussion of the main stylised facts about the industry, we present a history-friendly model that aims at capturing the underlining mechanisms and the logic that guides the evolution of this industry. Simulation results show the mechanisms and dynamic processes linking the patterns of innovation, demand structure, and concentration.
- Keywords:
- Simulation, Industrial Dynamics, Innovation, Market Structure, Pharmaceuticals
Introduction
- 1.1
- In this paper, we present a history-friendly model of the evolution of the pharmaceutical industry. History-friendly models are "agent-based models" that endeavour to represent the relationships and behaviours of economic agents, as well as the mechanisms underlying the evolution of given industries, as described in qualitative theories (Malerba et al. 1999; Malerba et al. 2001; Garavaglia 2010). More precisely, history-friendly models are, on the one hand, formal models which allow logical explorations and causal argumentation and which make explicit the logic that guides the model results. On the other hand, they follow an appreciative theorising, being empirically oriented and relating to verbal arguments put forth by many evolutionary scholars. The goal of this approach is not the reconstruction of general properties of socio-economic processes but the investigation of historical "stylised facts". This purpose is "industry-specific", aimed at resembling in a stylised and formal way the functioning of an industry. The structure of history-friendly simulation models rests in reproducing in the laboratory an artificial industry, made by artificial agents and environments, in order to investigate and explain some social and economic phenomena, which are contextualised in a given industry. The basic difference between history-friendly models and other evolutionary simulation models rests in the field and scope of analyses. While history-friendly models are industry-specific and history-based, other general simulation models investigate collective invariances, generic properties of industry structures and dynamics that apply to many industries, purposely neglecting historical and industry-specific features.[1]
- 1.2
- With regard to the debate about the contestability of history, history-friendly models consider the historical event under study not as the outcome of a sequence of random occurrences but as the result of some causal and deterministic attributes that give birth to given trajectories and phenomena. History-friendly simulations try to build mechanisms and causal forces that are able to explain the generation of these phenomena, as displayed by the historical evolution of industries, by explaining how it is possible that we are observing these phenomena and the conditions behind the realisation of that "typical" history (Garavaglia 2010). However, it is important to emphasise here that it is not the purpose of history-friendly modelling to produce simulations that closely match the quantitative values observed in the historical episode under investigation. The goal is to match overall patterns in qualitative features, particularly the trend behaviour of the key descriptors of industry structure and performance that any industrial organization study would typically focus upon. Further, the goal is to achieve this in a manner that features some particular causal mechanisms—namely, those that have been proposed in the appreciative theories put forward in connection with empirical studies of the historical episode.
- 1.3
- Just as we do not attempt detailed quantitative matching to historical data, we also do not attempt detailed calibration of parameters. This does not mean that we are indifferent to plausibility, or reckless in the choices we make. Because most parameters fall into groups with a particular mechanism in the model, there is typically some common-sense guidance available for choosing plausible orders of magnitude—there is some reality-based impression of how that mechanism ought to behave. Many value choices for parameters involve implicit unit choices for variables, which means that the quantitative values are in the end arbitrary (or matters of convenience), but also means that relations among parameters affecting the behaviour of the same variables have to be made with a view to consistency. It does not matter, for example, what range of numerical values represents the aggregate value of sales in our model industry; what matters is the relationship between production costs or R&D spending and that sales total. Further, some parameter values correspond to elasticities, which means that the choice of values is framed by the known qualitative significance of elasticity = 1. An additional constraint disciplining and orienting the choice of parameter values is provided by the time structure of the model. History-friendly models purport to generate sequences of events that take place in (approximations to) real time. And the definition of what "one period" means in real time (one year in this model) is crucial for establishing which actions take place at any one period. Hence, the time structure of the model imposes restrictions in order to respect consistency. For example, an interest rate equal to 8% on a yearly basis requires other important parameters in the model to conform to the specified time structure (see Windrum et al. 2007, for a description of alternative methods of model validation, different from the history-friendly approach).
- 1.4
- The research interest of this paper is the evolution of a high-R&D, marketing-intensive sector: the pharmaceutical industry. Given these characteristics—as a first approximation—the industry should be characterised by high degrees of concentration. However, concentration has been consistently low over the history of the industry. Adding to the puzzle, the industry is largely dominated by a core of innovative firms that has remained quite small and stable for a long period of time.
- 1.5
- The model we present is an improved and updated version of Malerba and Orsenigo (2002). In this paper, we present a complete description of the formal structure of the model. The structure of the paper is as follows: Section 2 presents some relevant historical features about the nature of competition in pharmaceuticals; Section 3 discusses interpretations of the features of market structure in pharmaceuticals; Section 4 outlines the model; Section 5 discusses the simulation results; Section 6 presents the sensitivity analysis; and Section 7 concludes.
Brief historical evolution of the pharmaceutical industry
- 2.1
- This section presents significant characteristics of the historical evolution of pharmaceuticals.[2] Different eras can be identified. Until the middle of the 20th century, the industry was not characterised by intensive R&D research projects: few new drugs[3] were introduced into the market, whose effectiveness was limited in any case, and research methods were not advanced. The pioneering firms were mainly chemical firms that exploited knowledge spillovers and links existed between the chemical and pharmaceutical fields.
- 2.2
- After the 1940s, the industry experienced important changes. The war efforts—through government-sponsored programs to develop and produce penicillin—provided firms (particularly in the United States and the UK) with financing, technological and organizational capabilities, and innovative opportunities, initially in antibiotics and then in many other therapeutic areas (Pisano 1996). The role of science began to increase during this period and firms started to formalise in-house R&D programmes. The R&D-sales ratio increased rapidly, and firms also started to invest heavily in sales efforts to build vast and sophisticated marketing forces. The R&D-sales ratio rose from 3.7% in 1951 to 5.8% in the 1950s, 10% in the 1960s, and 15-20% in the 1980s and later (Chetley 1990; Ballance et al. 1992; Inside Biotechnology & Pharmaceuticals 2000). Similarly, promotional spending had reached 12.4% of industry sales in the USA. Ballance et al. (1992) estimated that large research-oriented pharmaceutical companies spent in the late 1970s around 16.5% of their sales in marketing (Sutton 1998). In more recent years, marketing intensity has been estimated to range between 20% and 25% in the United States, according to different sources (Gagnon and Lexchin 2008).
- 2.3
- New research opportunities and the existence of several unmet needs created a rich environment for pharmaceutical firms. A further fundamental pillar of the development of the industry was the rapid growth of demand. On the one hand, very few effective drugs were in existence and the space for new treatments and cures for most diseases was immense. Moreover, the growth of healthcare insurance in America and of the Welfare State in most European countries provided a large, rich, and organised market for drugs. In the United States, in particular, sales were further sustained by other factors, namely, the sheer size of the population and the high prices that drugs could command thanks to strong patent protection. This translated into a period of rapid introductions of new drugs. In the following two decades, hundreds of new chemical entities (NCEs) and several important classes of drugs were discovered and introduced, ranging from antibiotics to antidepressants to diuretics, etc. Correspondingly, the number of new molecular entities approved by the U.S. Food and Drug Administration (FDA) rose steadily, from 25 in the decade 1940-49 to 154 in the 1950s, 171 in the 1960s, and 264 in 1970s (Lichtenberg 2006).
- 2.4
- On the other hand, detailed knowledge of the biological underpinnings of specific diseases remained limited in this period of development. Firms adopted an approach to drug discovery known as "random screening", whereby thousands of compounds were screened looking for potentially therapeutic activity. Unsurprisingly, only a small fraction of them showed promising potential, and discoveries were frequently serendipitous. When a lead was identified—often while searching for cures for different diseases—the molecule was then developed into a potential drug through painstaking processes of chemical synthesis in order to optimise safety and efficacy characteristics, e.g. reduce side effects. As Sutton (1998) has suggested, this process can be thought of as a lottery.
- 2.5
- Notwithstanding firms' massive investments in R&D and marketing, the industry did not experience a significant rise in the degree of concentration. Rather, market structure has been characterised by a stable core of leading firms. On the one hand, patent protection granted a sort of monopoly power to many firms in many therapeutic categories (submarkets), referred to hereafter as "TCs"; on the other hand, no dominant positions in the global market emerged. Firm competition during this era relied extensively on the introduction of new products, but also on incremental refinements of existing drugs and on imitating drugs whose patent protection had expired. Many firms specialised not in R&D and innovation, but rather in the imitation (or inventing around), production, and marketing of products invented elsewhere. Price competition was also intense.
- 2.6
- An interesting feature of firm strategies in this industry setting concerns the choice between diversification in research projects (and then in products and submarkets) and concentration in a few TCs. While some companies have shown a high dependence, in terms of revenues, on a few products, others have relied on a wider range of drugs. Larger firms were characterised by more diversified strategies, but even these companies were sometimes strongly dependent on a few "blockbuster" products.
- 2.7
- The 1970s represented another turning point for the evolution of the pharmaceutical industry. Progress in pharmacology, physiology, enzymology, and biology lead to a deeper knowledge of the mechanisms of action in drugs and the diseases they treated. In turn, these advances paved the way for new techniques for searching, named "guided search" and "rational drug design", that made it possible for researchers to design compounds with specific therapeutic effects. Also, the way in which compounds were screened changed substantially. Amidst the switch from random to guided search, advances in DNA technologies and molecular genetics represented a radical innovation for the industry. It is not the aim of this work to study the advent of biotechnology; for our purposes, it suffices to say that, indeed, the biotechnology revolution implied important changes in the process of drug discovery. The knowledge base and the required competencies underwent a deep transformation and existing firms had to face this transition. At the same time, the industry—for the first time after World War II—experienced a significant process of entry of new firms.[4]
- 2.8
- The effects of the biotechnology revolution on industry structure have so far been circumscribed mainly to the boundaries of firms, with significant processes of vertical specialisation. However, the nature of the innovative process has not yet dramatically changed, and the promises of "guided search" and of the molecular biology revolution have still to be fulfilled. If anything, the productivity of R&D has been falling over the past twenty years and the search for new drugs remains extremely uncertain and almost blind. In this respect, the discovery and development of new drugs is still very similar to a lottery (Nightingale and Mahdi 2004; Pisano 2006).
- 2.9
- The peculiar feature that emerges from a historical analysis of the pharmaceutical industry is the existence of an oligopolistic core of firms, whose individual, worldwide market share is not as significant as in some other industries[5], but that hold a relevant, dominant position if we consider the single TCs. In some TCs, industrial concentration (measured in terms of the CR4 index) was above 80 percent in 1995[6], and in many other TCs the competition is fierce, as shown in Table 1, in which two or three drugs account for more than 50 percent of the market sales. These firms also represent the most active firms in terms of innovative output (measured by the introduction of new chemical entities (NCEs) in the market).
Table 1: Product market share in some therapeutic categories in 2001 TC and Drug name Market share in TC Producer Antidepressant Zoloft 17.2 Pfizer Paxil 16.9 GSK Prozac 15.9 Eli Lilly Antiulcerant Prilosec 39.0 AstraZeneca Prevacid 29.6 TAP Antipsychotic Zyprexa 45.9 Eli Lilly Risperdal 29.6 Janssen Cholesterol Reducer Lipitor 44.9 Pfizer Zocor 27.2 Merck Pravachol 14.1 Bristol Oral Antihistamine Claritin 39.9 Schering-Plough Allerga 24.8 Aventis Zyrtec 20.8 Pfizer Source: Chong et al. (2003)
Relevant features in the dynamics of pharmaceuticals.
- 3.1
- In this paper, we concentrate our analysis on the "random screening" period and we focus our attention on the relevant dynamics related to market structure. What emerges from the brief historical evolution presented in Section 2 can be summarised as follows.
- 3.2
- The main features of firms' competitive process in the pharmaceutical industry are:
- firms compete through R&D investments as well as imitative strategies;
- firms run parallel projects in product development;
- the Food and Drug Administration (FDA) follows strict approval procedures for new molecular entities;
- the pharmaceutical market is composed of a large number of independent submarkets, corresponding to different therapeutic categories (TCs), with little or no substitution between products;
- patents are a fundamental appropriability device;
- the process of drug discovery and development has long been based on an approach customarily labelled "random screening", in which researchers, lacking a precise knowledge of the causes of diseases and the mechanisms of action of drugs, randomly screen thousands of natural and chemically derived compounds in test tube experiments and on laboratory animals, looking for therapeutic activity;
- the innovative process is characterised by extreme uncertainty[7] and, above all, by the difficulty of leveraging the results of past innovative efforts into new products: in other words, economies of scope and cumulativeness of technological advances are limited;
- firms compete through processes of "inventing around", the development of so-called "me-too drugs" and—after patent expiry—imitation and the entry of generics;
- firms also compete heavily through investments in advertising and marketing.
- 3.3
- What emerges from these characteristics of competition among firms in this industry can be summarised in the following "stylised facts":
- the industry did not experience a significant rise in the degree of concentration in the global market;
- however, a stable core of leading firms emerged;
- firms diversify in many therapeutic categories;
- firms are able to gain monopoly positions in many therapeutic categories;
- monopolistic positions are short-lived and rarely observed because of the patterns of imitation;
- firms' size distribution is highly skewed;
- the R&D-sales ratio increased rapidly during these decades;
- hundreds of new chemical entities (NCEs) and several important classes of drugs were discovered and introduced, ranging from antibiotics to antidepressants to diuretics, etc.;
- correspondingly, the number of new molecular entities approved by the Food and Drug Administration (FDA) rose steadily from 25 in the decade of 1940-49 to 154 in the 1950s, 171 in the 1960s, and 264 in 1970s (Lichtenberg 2006);
- also, the number of imitative drugs increased significantly.
- 3.4
- In the next section, we develop a simulation model based on the "inputs" described above. We show that our model is able to reproduce the main "stylised facts" of the evolution of the pharmaceutical industry as the "output" of our simulation runs.
The model
- 4.1
- In this section we provide a discussion of the formal structure of the model.[8] Appendix 1 reports the values and a concise description of the model parameters.
The market
- 4.2
- The global market is composed of many submarkets (TCs), whose number is given and equal to nTC. Each TC has a different number of patients (PatTC) in need of treatment for a specific disease, which determines the potential demand for drugs in each submarket. This number is set at the beginning of each simulation by drawing from a normal distribution [PatTC~N(μp,σp)] truncated in 0 to avoid negative values, and it is known by firms. Patients of each TC are grouped according to their willingness to buy drugs characterised by different qualities. Some of them, for example, may be unwilling to buy low quality drugs because of the presence of side effects.
- 4.3
- Other things being equal, TCs with a larger number of patients tend to be more attractive for firms. The economic value of each TC is endogenously determined by summing the revenues of each drug j sold at a given time-variable price (Pj,t). Therefore, even if the number of patients is exogenously given, the economic value of the TC changes during the simulation according to the monopolistic power stemming from patents and the degree of competition among firms (approximated by the number of firms with a drug in the same TC).
- 4.4
- Each TC is characterised by a given spectrum of opportunities, represented by the number of molecules MolTC having a therapeutic and (therefore potentially) commercial value (quality Q), that firms aim to discover. On average, the probability of finding a "zero quality" molecule is equal to φ, conditional on not being zero, Q is randomly drawn from a normal distribution [Q~N(μQ,σQ)].
- 4.5
- When a molecule is discovered a patent is granted and it is stored in a firm-specific portfolio of molecules available for future development projects. Patents have a specific duration, PD, and width, PW. That is to say, a patent prevents competitors from developing similar molecules located in the neighbourhood (spatial location represents the similarity) for PD simulation periods. Once the patent expires, the molecule becomes available for all firms, i.e. it is put it in a public portfolio shared by all the firms.
Firm features and routines
- 4.6
- The industry is populated by an exogenously given number of potential entrants, nF, (50 in this version of the model) who may possibly enter the market. Each potential entrant is endowed with a budget Bstart, equal for all firms. At the beginning of the simulation, firms start to invest part of their budget in random searches for promising molecules that might be the basis for the development of drugs useful in a particular TC. Firms have a limited understanding of the environment in which they act and behave, and follow simple, firm-specific rules of thumb (routines). Specifically, all firms engage in three activities: search, development (i.e. research activities), and marketing. In each simulation period, firms look for promising molecules and, if successful, start to develop the drug. If firms discover more than one promising molecule, they can decide to run multiple parallel projects of drug development. If the process of drug development is successful, firms actually enter the market and start marketing and selling the new drug.
- 4.7
- Firms are heterogeneous: Each firm is characterised by a different "strategy", or propensity, with regard to research and marketing activities. This propensity is quantitatively represented by a parameter, h, drawn from a uniform distribution. Consequently, firms invest a different amount of resources in each activity according to their propensity; for example some firms may want to spend more on search and development and less on marketing, while other firms do the opposite. Thus, the firms' budget, B, is divided each period among search (BS,t), development (BD,t), and marketing activities (BM,t) as follows:
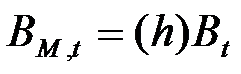
(1) 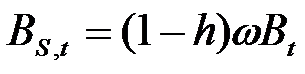
(2) 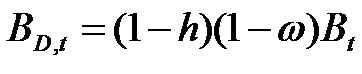
(3) where ω is invariant and firm-specific and represents the share of the firm's non-marketing budget devoted to search activity (i.e. 1 - ω budget devoted development activity).
- 4.8
- Firms are heterogeneous also for another reason: they can behave like innovators or imitators. On the one hand, firms that behave as innovators look for new molecules by randomly screening the market environment and incurring a search cost. On the other hand, those firms that act as imitators select among the molecules whose patent has expired; imitators thus avoid the cost of search. Also, imitators benefit from another advantage: sustaining a lower cost of drug development. In each period, firms' propensity (h) determines the imitation or innovation strategy followed by the firm according to a stochastic mechanism: If a firm has a propensity to research such that (1-h)>ψt (where ψt is a random number drawn from a uniform distribution ranging from 0 to 1), then the firm is temporarily an innovator. Otherwise, it will be temporarily an imitator. While the propensity to research (1-h) is given at the beginning of the simulation and does not change over time, ψt does; as a consequence, firms with a very low propensity to research will most of the time be imitators (and the inverse for innovators). Sometimes, no molecule is available for imitation: all discovered molecules are covered by patent protection. In this case, imitators are forced to behave as innovators.
Innovative and imitative activities
- 4.9
- Innovators look for new molecules by investing in a search process. Search involves the payment of a fixed cost, (Cs), in order to draw a molecule from the space of available molecules. Thus, the number of molecules drawn by a firm in each period (Xt) is determined by the ratio between the fraction of the budget allocated to search, Bs,t, and the cost Cs:
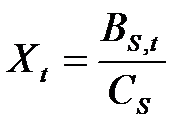
(4) - 4.10
- Firms do not know the quality Q of the molecule they have drawn; they only know whether Q is greater than zero. If the molecule has a non-zero value and it has not been patented by others, then a patent for the molecule is obtained. The patented molecules become part of an individual 'portfolio' that each firm maintains for potential drug development.
- 4.11
- Imitative firms differ from innovative firms because they pick up—from a public portfolio —an already discovered molecule whose patent has expired[9] (instead of selecting randomly) without paying the cost of drawing; accordingly, their budget devoted to search activities is set to zero (BS,t). Imitators rate molecules to develop according to the same principle as innovators (see the next section).
Development activities
- 4.12
- Both innovator and imitator develop products from molecules by engaging in drug development activities. If the molecule is potentially interesting (i.e. it has a quality Q greater than zero), the firm starts a development project, using the budget allocated to this kind of activity, BD,t, to pay for the cost of development. The time and the cost required to complete a development project are, for the sake of simplicity, assumed to be fixed and equal for all molecules and firms, the only difference being that both the cost (c) and the time spent (T) for innovation (indexed as in) are larger than for imitation[10] (indexed as im). In other words, cin > cim and Tin > Tim. Thus, the total cost of development of a molecule is given by cxTx, where x={in, im}. If the cost of development is larger than the available development budget, BD,t, the molecule remains stored in the firm's portfolio, and the firm waits to accumulate enough financial resources to start one or more new projects. When the project ends, the quality of the molecule (the new drug) is revealed. Products must have a minimum quality, indicated with νQ, to be allowed to be sold in the marketplace. In other words, products are subject to a "quality check" by an external agency (e.g. the FDA). In the simulations, the quality check threshold, νQ, is set equal to the mean of the random distribution generating the quality of the molecules (μQ = νQ). Below this value, the drug cannot be commercialised and the project fails.
- 4.13
- When a product originates from a molecule which has never been used before, it is labelled as an innovative product; otherwise, it is considered an imitative product.
- 4.14
- In every simulation period, firms choose how many projects to start and which are the most promising molecules to develop. In other words, firms run parallel projects. The choice of how many projects to conduct simultaneously and of which molecules to develop is governed by certain routines.
Firms choose the number of new projects to start in each period t as follows. First, a firm f subtracts the resources (θt) needed to complete all current, ongoing projects from the total available resources (BD,t) committed to product development. The remaining resources represent the budget (Bnewt) that can be allocated for new projects (newPrt). The firm's number of new projects is then determined by the following routine (where x={in, im}):
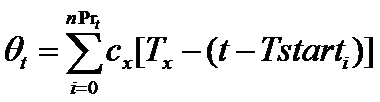
(5) 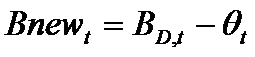
(6) 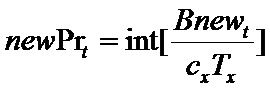
(7) where nPrt is the number of ongoing projects and Tstarti is the starting time of project i. Intuitively, a firm starts a number newPrt of new projects at time t only if the budget Bnewt covers almost newPrt times the whole cost of the development process (cxTx), where x={in, im}. The resources put aside to complete the ongoing projects (Θt) are remunerated with an interest rate r.
- 4.15
- Having determined the number of new projects to start, the second issue is related to the selection process of the available molecules in the firm's portfolio. Firms consider two features of a molecule in order to choose more-promising ones for development: (A) Companies look at the economic value of the submarket, TC, to which the molecule belongs. The economic value of TCi, where the molecule belonging to project i is located, in period t is calculated in terms of the average earnings provided by the products sold in TCi in period t (AvgEarningsi,t). Again, the index i refers to the i-th project under analysis. In the case of a green-field TC, the earnings are computed knowing the number of patients and fixing the highest price allowed (see pricing strategy for more details). (B) Innovative firms consider the residual length of the molecule's patent protection, i.e. the time left to capture profits generated by the molecule under patent protection. Then, each molecule is associated with a variable (indexi,t) that determines its position in a ranking of attractiveness:
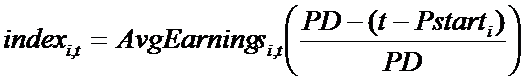
(8) where Pstarti is the time t when the patent of product i was granted. Given the number (newPrt) of projects compatible with the budget constraint, the top-ranked molecules are chosen and development projects related to newPrt are begun. Index i,t equals zero when the patent expires.
Marketing activities
- 4.16
- After the process of development, and if the quality check is successful, firms launch their drugs on the marketplace. In order to get access to a larger number of patients, companies invest in marketing activities, which yield a certain level of "product image" for consumers.
- 4.17
- During a product's development, a firm accumulates resources for eventual marketing investment by putting aside fractions of the total resources allocated to marketing, BM,t. These resources are remunerated at an interest rate r. This "saving" process starts when the project is considered to be "promising", that is to say, when the potential drug satisfies the "quality check". The total budget devoted to marketing is split among the ongoing projects according to the higher average earnings of the related TCi of the project (AvgEarningsi,t). The marketing expenditure, Mt, is borne entirely at the launch of the drug at time t. They yield a certain level of "product image" for the consumers. This level of "image" is eroded with time at a rate equal to eA in each subsequent period, according to:
(9) Demand and market shares
- 4.18
- When a project i is completed and reaches the minimum level of quality, it becomes a product j sold on the market. In this model, we assume that there is a constant unit cost of manufacturing and that each patient buys one unit of the drug. Drugs are bought on the marketplace by groups of heterogeneous consumers. The decision to buy a drug depends on several factors, which together yield a specific "merit" to each drug j at time t. Formally, the value of this "merit", Uj,t, is given by:
(10) where Qj is the quality of the drug (equal to the quality of the originating molecule), Mt is the level of marketing "image" at time t, Pj,t is the level of price of drug j at time t, and exponents a, b and c are specific to each TC and drawn from uniform distributions. Firms define prices according to a mark-up rule, as follows:
(11) z are the costs of manufacturing, equal for all drugs, and mupj,t is the mark-up charged by firms. The mark-up is structured in order to take into account the competitive pressure in the TC:
(12) where Sharef,t,TC is the market share of firm f, in terms of patients, in a given TC, η is the price sensitivity of demand, and γ represents inertia in the price update mechanism.
- 4.19
- The quality of a drug impacts its diffusion among patients. Intuitively, consumers of each TC are classified into four groups according to their propensity to buy drugs of low, medium-low, medium-high, or high quality. This structure is exogenously fixed and is equal for all the TCs: the lower border corresponds to the FDA's minimum quality requirement for entering the market (μQ), while the upper limit, to access the group of most demanding patients, is exogenously fixed at three times more than the minimum threshold. Therefore, low quality drugs will be in competition only for patients with the lowest request in terms of quality. On the other hand, high quality drugs will be available for all patients. This stylised mechanism is a way to account for the heterogeneity of demand, where some patients face problems of drug side effects and tolerability. Moreover, in this way, only high quality drugs are able to satisfy all of the demand, even if there is only one firm in the TC. Other things being equal, the higher the share of patients, the higher will be a firm's sales, market share, and, consequently, its mark-up and price. At the beginning, successful drugs in a particular TC face no competition, but after some time other firms may discover and develop a competing drug in the same TC. Moreover, after patent expiration, imitations may occur. As a consequence of the competition from competing or imitative products, the market share and revenue of the original innovator is eroded. When new products enter the TC, the price gradually (and endogenously) adjusts.
Budget and accounting
- 4.20
- Profits of firm f given by product j at time t are indicated by πf,j,t. Because a firm f may have more than one product, total profits (Πf,t) are given by the sum of profits obtained from all the products of the firm, according to the following equation:
(13) where Prf,t is the number of products belonging to firm f, z is the given cost of production, equal for all firms, and Pj,t is the price of product j. Patj,t is the number of patients who buys the product j. In each period the profit, accumulated and divided into BS,t, BD,t, and BM,t, is used to finance new expenditure in search, development, and marketing for launching new products. Moreover, we are assuming that the firm reinvests its whole budget, without paying dividends to shareholders. For reasons of simplicity, we do not model stock market behaviour.
Exit rules
- 4.21
- Given that firms start new projects only if they have a sufficient budget to complete them (i.e. to complete the process of product development), it is impossible that firms run out of business by having a negative amount of money in their account. Our exit rules, then, relate to other mechanisms. There are three rules governing a firm's market exit.
- 4.22
- First, if the number of draws of potentially valuable molecules per period in the search process is 0 more than n times (n=7), the firm fails. This rule aims at reflecting research inefficiencies. Obviously this rule does not work for those firms who follow an imitative strategy.
- 4.23
- The second rule states that when a firm does not have the minimum budget needed to complete one project and is not selling other products, the firm fails. This rule reflects financial difficulties.
- 4.24
- Finally, firms exit when their overall market share is lower than χ (χ=0.4%). This reflects the unattractive position of the firm in the market. In the model there is also an exit rule at the product level: Firms consider marginal a product that is purchased by a share of consumers lower than 5%, and, consequently, they withdraw this product from the market.
Simulation runs: "history-friendly" results
-
Calibration and initialisation
- 5.1
- We first examine the results of the simulations (averaged over 100 runs) for what we define "the Standard Set". This parameterisation reflects both some fundamental theoretical hypotheses and, as discussed in the Introduction, some empirical evidence in a qualitative way. The specification of the value of the parameters of the model also includes some strongly simplifying assumptions and reflects our ignorance about the "true" values of some key parameters. As a consequence, the Standard Set is broadly considered "history-friendly", and it serves the purpose of producing a benchmark for subsequent analyses. Thus, for example, in the Standard Set there are no economies of scale, no economies of scope, and no processes of mergers and acquisitions. More importantly, there are no exogenous advances in knowledge that allow firms to focus their search activities and to increase the productivity of their research.
- 5.2
- The calibration of the model is the result of a process of repeated changes in the parameters and methods in order to obtain a satisfactory specification. Some parameters are selected on the basis of the knowledge we have about their meanings and values as shown by the empirical literature and the evidence provided by industry specialists. The value of other parameters has been selected with a view to preserving coherence. In many cases, the parameterisation of some key variables of the model is largely ad hoc: We do not know the "real" distributions of the opportunities of discovery and we have only some rather generic knowledge about the economic value of the drugs developed.
- 5.3
- Thus, in our model, the landscape explored by firms is sufficiently rich in terms of opportunities for discovery to allow for the survival of the industry and the introduction of a large number of new drugs. However, because search activity remains risky and is most often unsuccessful, the parameter describing the probability of finding a "zero quality" molecule, φ, is set equal to 0.97, meaning that only 3% of the available molecules are potentially valuable. Moreover, the quality value of the molecules is highly skewed.
- 5.4
- Search, development, and marketing activities are expensive and take time. Here, we have some stronger empirical references. The development of innovative and imitative drug products takes, respectively, 8 and 4 periods (broadly corresponding to the years required to bring a drug on the market in reality). The relative costs of search, development, and marketing also broadly reflect the costs currently observed in the industry (Di Masi et al. 2003). Patent duration is set equal to 20 periods. The number of submarkets (TCs) is also very high (200), again resembling the number of therapeutic categories registered in the industry classifications. Marketing expenditures have an important role in accessing a large number of customers and the sensitivity of demand to price is rather low (exponent b in equation (10)). The mark-up over production costs is consistent with the high rate of returns observed throughout the industry history (around 10-15%, with a significant variance. (Comanor 1986;Pisano 1996)).
- 5.5
- The time span of the simulations is 100 periods, that is, approximately one century, from the early 1900s to contemporary times. That is to say, the model tries to "reproduce" both the formative stage of the industry as well as its subsequent consolidation. As mentioned earlier, the correspondence between the timing of the model and the real historical unfolding of events should not be taken literally. Moreover, a major simplifying assumption of the model is that the value of the parameters are kept fixed throughout the length of the simulations. In effect, as discussed in Section 2, some important changes did actually occur over the history of the industry, concerning, for example, the role of science, the toughness of regulation, the availability of patent protection, the size of the population, the cost of R&D, etc. We have not introduced these changes exogenously for reasons of simplicity. Moreover, while very important, these modifications have been incremental rather than radical and do not amount to really drastic and sudden discontinuities. Still, as we shall clarify in our discussion of the results, the output of the model is broadly consistent with the actual timing of the evolution of the industry.[11]
- 5.6
- Thus, the model is initialised in such a way that the available budget allows firms to discover only a few molecules in the early stages. R&D expenditures and the introduction of new drugs start to grow as time goes by and successful firms accumulate profits. The initial number of potential entrants (nF =50) has been set in such a way as to be consistent with the number of TCs and the duration of the simulation. Moreover, this number reflects the sizable but not too large population of pharmaceutical firms operating at the national level in America in the early 1900s (Chandler 2005).[12] Alternative methods for calibration and validation of the parameters, different from the history-friendly approach proposed in this paper, have been described by Windrum et al. (2007).
Market structure
- 5.7
- In each submarket, concentration (measured by the Herfindahl index) tends to decrease quickly after an initial upsurge (Figure 1), reaching a value of 0.29 at the end of the simulation runs. This pattern is due to the monopoly power of early entrants in each TC; namely, after the introduction of competing innovative and imitative products in the same TC, the degree of competition gradually rises and concentration decreases. Two main events are clearly observable in Figure 1. First, products enter the market after 8 periods of development, and in the beginning these products face no competition and are leaders in the TC. Second, after 24 periods, imitative products enter the market (i.e. patent duration lasts for 20 periods and 4 periods are the minimum needed in the simulation to develop an imitation).
- 5.8
- Not surprisingly given the fragmentation into several submarkets, overall market concentration is always much lower than in individual therapeutic categories (Figure 2). It increases after period 50 as bigger firms, exploiting their larger financial resources, are able to enter new submarkets by finding and developing new products and imitating existing ones. However, this tendency is countered by the intrinsic randomness of innovation and by imitation. Thus, overall concentration remains relatively low, reaching a value of 0.23 at the end of the simulation.
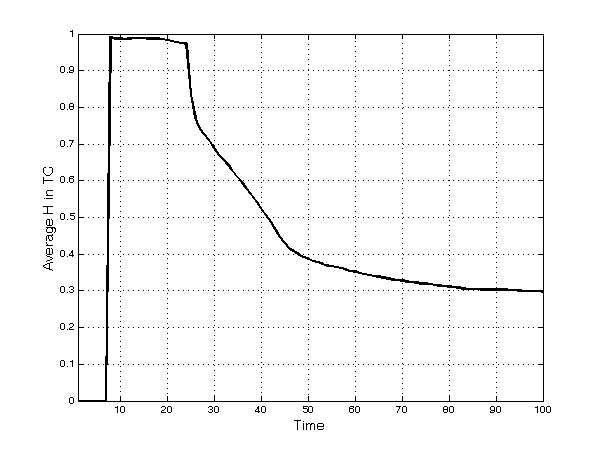
Figure 1. Average[13] Herfindahl index in each TC 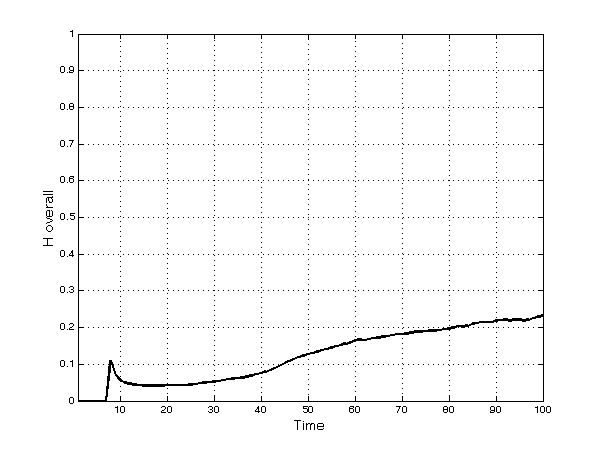
Figure 2. Herfindahl index in the overall market - 5.9
- Selection is particularly intense in the first half of the simulation. Only 20 of the 50 potential entrants succeed in entering the market, because firms either fail to discover promising molecules or are unable to complete the development process (Figure 3). Other firms do succeed in entering the market, but for the same reasons as above, and because of competitive pressure, they subsequently exit. The upsurge in the number of active firms around period 25, as shown in Figure 3, is a result of entries by imitative firms after the first patents expire.
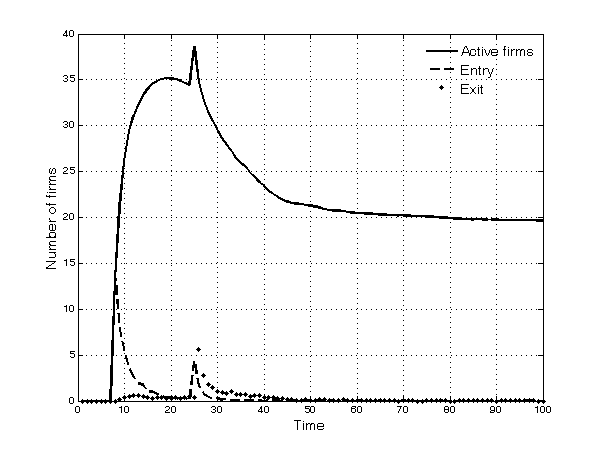
Figure 3. Number of active firms in the market, entries and exit - 5.10
- As time goes by, the industry becomes more stable: both entry and exit decrease and most of the surviving firms tend to remain alive until the end of the simulation. Surviving firms own a portfolio of products and, though their market shares tend to decline in individual submarkets, leading in some cases to the withdrawal of products, they rely on the profits stemming from drugs in different TCs.
- 5.11
- Furthermore, and not surprisingly, leadership in the industry changes rather frequently at the beginning of the simulation, given the non-cumulative nature of innovation (on average the leader changes 10 times in the first half of the simulation and only 5 times afterwards). After this period of instability, however, a stable core of few large firms emerges.
- 5.12
- As a consequence of the processes of innovation, imitation, and diversification, firms grow quickly and, as mentioned previously, enjoy high levels of profitability. A skewed firm-size distribution emerges (Figure 4), with some larger firms (mainly innovators, who are present in a igh number of TCs, and many smaller companies (mainly imitators)[14], in line with the empirical evidence (Cabral and Mata 2003).
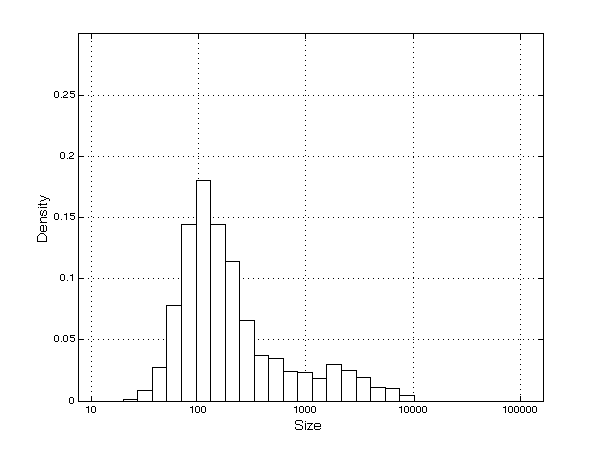
Figure 4. Firms' size distribution Innovation, imitation and firms' diversification
- 5.13
- These broad dynamic trends result from significant heterogeneity across TCs: A few TCs have no firms, while other, richer TCs have several. Firms compete simultaneously through processes of innovation, imitation, and diversification into new submarkets. Innovation constitutes a fundamental ingredient of firms' competitiveness. In the early periods of the simulation, most products are—almost by definition—innovative. Afterwards, as time passes, imitation begins: The patents of the first set of innovative products expire and imitation occurs frequently thereafter. The number of both innovative and imitative products increases in absolute terms and the share of imitative products increases continuously over time (Figure 5). The opportunity to engage in parallel research projects further strengthens imitative activities. However, innovative products are much more profitable overall than imitative ones, as shown by the fact that, at the end of the simulation runs, 70% of the profits of all products in the market have gone to firms with innovative products (Figure 6).
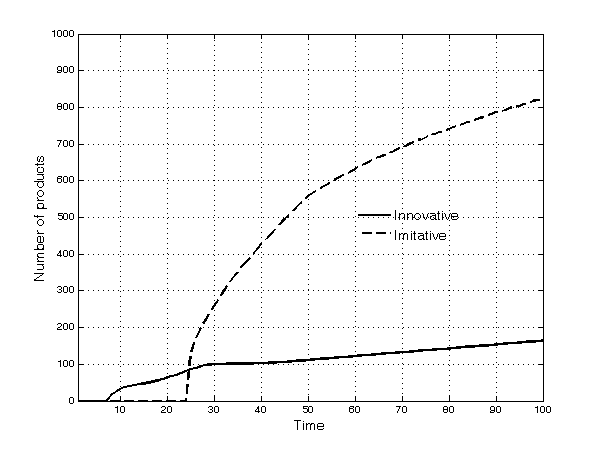
Figure 5. Number of innovative and imitative products 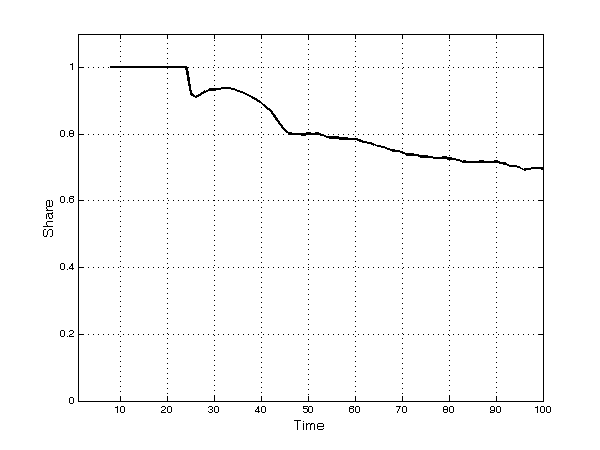
Figure 6. Share of profits of innovative products - 5.14
- Also, firms increasingly diversify into new TCs: the rate of discovery of new therapeutic categories is quite high in the first part of the runs, but then it slows down (Figure 7). At period 50, firms sell at least one product in more than 110 TCs, out of the existing 200. This number then grows to 140 at period 100 as the number of unexplored TCs declines and as firms tend to crowd in the richest TCs. The decreasing rate of discovery is also correlated to the higher competitive pressure that imitative products have on innovative ones: Firms tend to select imitative drugs in large submarkets rather than developing new products in smaller TCs.
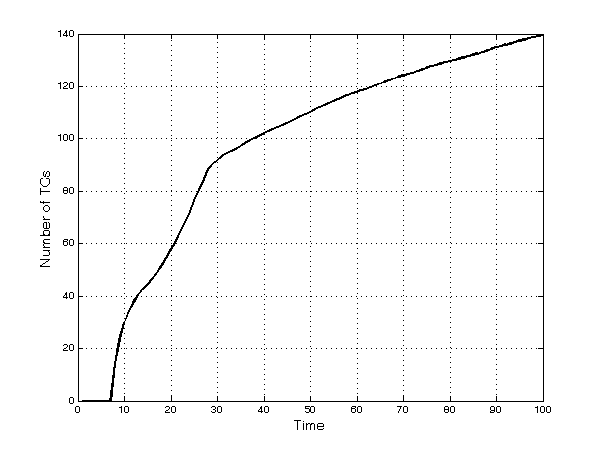
Figure 7. Number of discovered TCs Firms' market power.
- 5.15
- As time goes by, the prices of drugs decrease (Figure 8). The decline in prices of innovative products under patent protection is due to the higher degree of competition (the entry of competing innovative products in each TC) along the simulation time span. Thus, firms introducing new products in an occupied TC are prevented from charging very high prices. The decline in prices of products whose patent has expired is even more pronounced because of the fiercer competition they suffer from imitation. Prices of imitative products, after an initial peak due to cases of duopoly between the first innovative incumbent and the second entrant, remain stable over time.
- 5.16
- The patterns of average earnings for these typologies of products follow a similar dynamics (Figure 9). Thanks to the introduction of higher quality innovative products, the average number of patients in each TC that are willing to buy a drug (i.e. the number of patients firms are able to cure) increases.
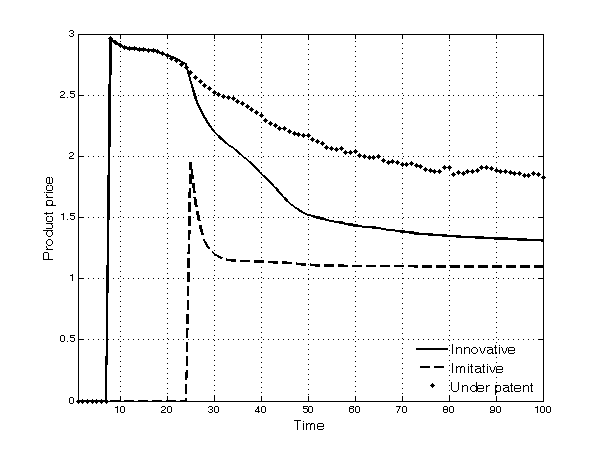
Figure 8. Average price of products 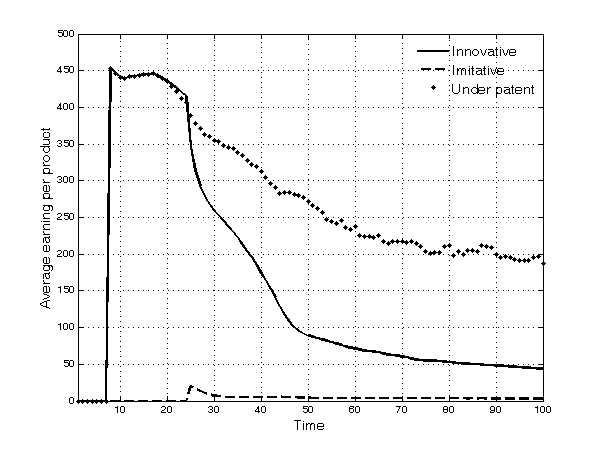
Figure 9. Average earning for each type of product
Sensitivity analysis
- 6.1
- Sensitivity analysis aims at assessing the effect of model input variations on the output. In the literature, many different approaches to sensitivity analysis have been considered, and no unanimous procedure has emerged. These approaches range from simple assessments of the effects of changes in the technicalities of the simulation to more sophisticated attempts at measuring and testing the impact of input variations on the outputs. The former set of approaches includes changes in shape and parameterisation of the distributions governing the uncertainty component of the model, changes in the number of actors, and changes in the rules according to which actors interact. The latter set of approaches includes ANOVA-like analysis, Monte Carlo simulations, and regression analysis (Richiardi et al. 2006;Kleijnen 1997).
- 6.2
- In this section we adopt an ANOVA-like approach in order to test if the output of the model is robust to small variations in the inputs[15] and if the main results described in Section 5 are statistically significant. We call the former our robustness check and the latter our confirmation test.
Robustness check
- 6.3
- We implement the robustness check in three steps:
- We identify a set of inputs considered crucial for the model, namely: patent duration, opportunities, fragmentation (number of TCs), size of the whole market, quality check (minimum level of quality), and number of potential entrants.
- We consider three simulations of 100 runs; each simulation corresponds to a specific value of the abovementioned inputs: the Standard Set, the Standard Set where the inputs have been increased by 2%, and the Standard Set where the inputs have been decreased by 2%.
- For selected outputs, we assess the difference of their three average values calculated respectively in the three simulations. In order to test for mean differences, we apply the one-way ANOVA technique. The outputs of interest (measured in the last period of each run, t=100) are: concentration overall (H overall), average concentration in the therapeutic categories (HTC), and the number of innovative products (Inno. Prod.). Table 2 shows the results.
Table 2: Robustness check. In parenthesis rounded values AVG. Output Input → Standard +2% -2% Output (time 100) → Standard +2% -2% ANOVA P-value
+/-2%ANOVA P-value +/- 5% ANOVA P-value +/-10% Patent Duartion 20 (21)20.4 (19)19.6 H overall 0.23 0.23 0.23 0.89 0.89 0.47 Avg. H in TC 0.30 0.30 0.29 0.56 0.56 0.07 Inno. Prod. 166.53 171.87 156.62 0.01 0.01 0.00 Opportunities
(% of zeros)0.97 0.9894 0.9506 H overall 0.23 0.32 0.18 0.00 0.00 0.00 Avg. H in TC 0.30 0.28 0.33 0.00 0.00 0.00 Inno. Prod. 166.53 75.64 221.89 0.00 0.00 0.00 Fragmentation 200 204 196 H overall 0.23 0.22 0.23 0.50 0.78 0.28 Avg. H in TC 0.30 0.30 0.30 0.75 0.90 0.70 Inno. Prod. 166.53 166.85 168.09 0.95 0.47 0.02 Size of the whole market 120000 122400 117600 H overall 0.23 0.23 0.24 0.45 0.96 0.34 Avg. H in TC 0.30 0.30 0.30 0.96 0.92 0.15 Inno. Prod. 166.53 163.10 162.36 0.69 0.23 0.00 Quality Check 30 (31)30.6 (29)29.4 H overall 0.23 0.24 0.22 0.45 0.04 0.04 Avg. H in TC 0.30 0.30 0.31 0.50 0.06 0.71 Inno. Prod. 166.53 158.75 179.84 0.00 0.00 0.00 Number of Firms 50 51 49 H overall 0.23 0.22 0.24 0.21 0.45 0.01 Avg. H in TC 0.30 0.30 0.30 0.54 0.18 0.38 Inno. Prod. 166.53 161.42 163.50 0.59 0.89 0.00 Upper/lower bound (all the variables in/decrease by 2% except opportunities) H overall 0.23 0.24 0.22 0.52 0.88 0.1 Avg. H in TC 0.30 0.32 0.29 0.01 0.20 0.57 Inno. Prod. 166.53 175.54 164.56 0.10 0.78 0.26 - 6.4
- When we consider small variations (+2%/-2%), almost none of the differences of output means in the three simulations are statistically significant (see column ANOVA P-value +/-2%). This result confirms that the model is robust to small variations of the inputs, although this is not the case for opportunities and (partially) for quality check, where the outputs are particularly sensitive to small input variations. The high sensitivity to small variations in opportunity values is due to the history-friendly setting of the model. It replicates the characteristics of the pharmaceutical industry by setting the probability of discovering new molecules at such a low level that even a small change in the share of zero-quality molecules produces a significant variation in industry concentration and in the number of innovative products. When we set the level of opportunities to a less extreme value, the model increases its robustness concerning this specific output.
- 6.5
- For larger variations of the inputs (+/-5% and +/-10%) the mean differences are statistically significant in about half of cases considered (see column ANOVA P-value +/-10% in Table 2). The more we move from small variations (i.e. robustness check) to large variations (i.e. counterfactual exercise), the more likely the means difference will be statistically significant.
Confirmation test
- 6.6
- In this section we aim to show that the model outputs are statistically different over time. We consider our investigations on graphical analysis (Section 5) to be instructive only if the average output values experiment a statistically significant variation of over time. Table 3 reports the results of the tests for the difference in overall concentration, the concentration in the TCs, and the number of innovative products in three simulation periods: 20, 50, and 100. Each simulation includes 100 runs and is set with the standard parameterisation. We test with a one-way ANOVA if the mean differences are statistically significant over the three periods considered. The right column of P-values in Table 3 confirms that the outputs vary during the three periods. Results about prices reported in Table 3 show also that average prices of innovative drugs, imitative drugs, and patented drugs are statistically different at the end of the simulation (period 100).
Table 3: Confirmation of the results Confirmation of results AVG. Output Output (time)-> 20 50 100 ANOVA P-value H overall 0.04 0.13 0.23 0.00 Avg. H in TC 0.98 0.39 0.30 0.00 Inno. Prod. 62.46 113.29 166.53 0.00 Output (time 100)-> In. Avg. price Im. Avg. price Under patent avg. price ANOVA P-value Prices 1.31 1.10 1.85 0.00
Concluding discussion
- 7.1
- This paper presented a history-friendly simulation model of the pharmaceutical industry. The results reproduce the main stylised facts in the evolution of pharmaceuticals and capture the determinants of the evolution of this industry in an appreciative fashion: Overall market concentration remains quite low while concentrations in each submarket are higher; a stable core of leading firms emerge; the size distribution of firms is highly skewed; firms compete through innovation and imitation strategies; and firms' diversification is increasing over time.
- 7.2
- Our results increase our understanding of the factors affecting the relationship between market structure and innovation in an evolutionary and Schumpeterian way. The analysis of this paper discusses which are the relevant aspects to consider when analysing industrial dynamics in this market. Major findings are that one of the most important channels through which firm interaction influences market structure is through the discovery of new submarkets. In our model, the lack of the emergence of concentration is explained by low cumulativeness, low bandwagon effects in the demand side, and by the creation of new submarkets. Thus, the model reveals itself to be suitable also for investigating interesting and more general theoretical issues, highlighting some suggestions about the theoretical relationships among innovation, market fragmentation, and industrial dynamics.
- 7.3
- A core result of our discussion is related to how alternative patent regimes may influence innovation, market structure, and welfare. Our main concern is that an increasing duration of patent protection may depend on the non-linear interactions among other key variables, whose study is hard to analyze in a simple, static model. Our model, conversely, lends itself to precisely this kind of investigation, as we show in Garavaglia et al. (2013). The policy conclusion we obtain is that arguments in favour or against a stronger patent regime should carefully consider the fact that consequences depend on a large set of (sometimes non-linearly) interacting variables. Those interactions may lead to vastly different paths of evolution and outcomes, with abrupt changes across the parameters space.
- 7.4
- More broadly, our model shows how analysing the interaction between technological regimes and the structure of demand is crucial to understanding this market's degree of concentration. As suggested by the literature, technological regimes matter, but their influence is modulated by the demand regime. We explore this issue in another paper (Garavaglia et al. 2012), where we show that, given a degree of market fragmentation, the nature of the technological regime influences market structure (according to expectations) in Schumpeter Mark I regimes (i.e. concentration tends to be lower as compared to the standard simulation), while in a Schumpeter Mark II regime, overall concentration tends to be lower. This seemingly negative result is explained as follows: Within each submarket, the variables that define the technological regime do, indeed, produce the expected results—stronger cumulativeness, richer opportunities to innovate, and tighter appropriability conditions favour the emergence of market leaders—but the opening of new submarkets reduces overall concentration. Also, we show that the number of submarkets as such is not the key determinant of market structure; rather, the key is the size of the "prize" that innovators gain. This result is in line with Sutton's (1998) "escalation mechanism" in explaining the relationship between innovation and market structure. However, our interpretation of the escalation parameter relates to a dynamic, evolutionary context, being influenced by the nature of technological regime, and endogenising the number of submarkets.
- 7.5
- Our analysis complements contributions that offer explanations of the relationships between innovation and market structure and proposes that the nature of market fragmentation plays a critical role in preventing the onset of concentration in innovative industries (Sutton 1998; Klepper 1996, 1997; Klepper and Thompson 2006). However, our work departs from the cited literature in many respects. First, coherently with an evolutionary approach, we do not assume full rationality on the part of the agents and pre-impose equilibrium conditions. Second, we do not assume that the number of submarkets is fixed or exogenously generated, nor that any potentially profitable submarket is actually occupied (the "arbitrage principle", seeSutton 1998). Rather, although there is a fixed number of "potential" submarkets, only some of them are actually discovered through R&D efforts. Thus, the degree of market fragmentation is partially endogenous. Third, our analysis is cast in an explicit dynamic setting.
- 7.6
- We believe our results can foster dialogue and cross-fertilisation between different approaches, identifying not only differences but also similarities, beyond fundamental diversity in basic methodological commitments. In this vein, a promising area of future work is the exploration of the relationship between the nature and changes of demand and the evolution of market structure, comparing them with the empirical evidence and the predictions of other models.
Appendix 1: Parameters and variables
-
- f index for firms
- t index for time
- TC index for therapeutic categories
- i index for molecule/project
- j index for product
- nF = 50 Initial number of possible entrants (firms)
- nTC = 200 Number of TCs
- time = 100 Periods of simulation
- a = U(0.5,0.6) Exponent of product quality (PQ)
- b = U(0.15,0.20) Exponent of inverse of price 1/Pricej,t
- c = U(0.35,0.4) Exponent of launch marketing expenditures M
- eA = 0.01 Erosion coefficient of launch marketing expenditure
- MolTC = 400 Number of molecules per TC
- PD = 20 Patent duration
- PW = 5 Patent width
- r = 0.08 Interest rate of remuneration
- φ = 0.97 Probability of drawing a zero-quality molecule
- TotSteps = 24 Total amount of steps that have to be climbed to develop a product
- μp = 600 Mean of normal distribution of number of patients per TC
- σp = 200 Standard deviation of normal distribution of the number of patients per TC
- μQ = Mean of normal distribution of positive quality molecules
- σQ = Standard deviation of normal distribution of positive quality molecules
- νQ = 30 Minimum quality of the product to be sold on the market
- η = 1.5 Demand price sensitivity in the mark-up equation (6)
- PatTC = N(μp, σp) Number of patients per TC
- Q = N(μQ,σQ) Quality of the molecule
- Qj Quality of the drug j
- Pj,t Price of the drug j at time t
- Stept Number of steps of development climbed in time t
- Bstart = 4500 Starting budget given to each entrant
- h = U[0.25, 0.75] Firm's strategy
- ψt = U(0,1) Random number drawn to decide the strategy of the firm in time t
- ω = U(0.05, 0.15) Firm's share of budget dedicated to search
- cinnovative/cimitative = 60/20 Cost of single step in developing process
- Tinnovative/Timitative= 8/4Time spent in the development of an Innovative / Imitative product
- Cs =20 Firm's cost of draw new molecules
- χ = 0.4% lower bound to exit the market
- z = 1 Price of manufacturing
- γ 0.5 Inertia in the price update mechanism
- Πf,t Total profits of firm f in period t
- Πf,j,t Profits of firm f given by product j
- BD,t Budget dedicated to development of products at time t
- BM,t Budget dedicated to marketing of products at time t
- Bnewt Budget given for new projects of a firm f at time t
- BS,t Budget dedicated to search of molecules at time t
- newPrt Number of new projects of a firm f at time t
- nPrt Number of ongoing project of a firm f at time t
- Prf Number of products belonging to firm f
- Pstarti First year when the patent is granted for molecule belonging to project i
- Mt marketing expenditure at time t
- Sharef,tTC Market share of firm f, in terms of patients, in a given TC
- Indexi,t position of the molecule in the drug ranking of possible molecules to develop
- avgEarnings average earnings given by the product sold in TCi
- Θt resources needed in oder to complete all the ongoing projects
- TSTARTi Starting time of project i
- Xt Number of molecules drawn by the firm in each period
- Mupj,t mark-up of drug j
Notes
-
1 See Garavaglia (2010) for a discussion about the characteristics of history-friendly simulations in comparison to other similar, agent-based approaches. See also Brenner and Werker (2007), Windrum (2007), and Windrum et al. (2007).
2 For a detailed discussion of the evolution of the pharmaceutical sector see, among others, Malerba and Orsenigo (2002), Sutton (1998), Pammolli (1996), Grabowski and Vernon (1977; 1994).
3 Basically, the most important innovations during this period were the introduction of alkaloids, of coal tar derivatives, and of sulfa drugs between 1938 and 1943 (Sutton 1998).
4 We explicitly refer to de novo entry. We are abstracting here from entry by mergers and acquisitions. It is worth noting, however, that R&D, manufacturing, and marketing constitute formidable barriers to entry. The biotechnology revolution offered a new set of technological opportunities and allowed for a division of labour in the innovative process in pharmaceuticals (Arora, Fosfuri, and Gambardella 2001; Orsenigo 1989; Chandler 2005; Pisano 1996, Henderson, Orsenigo, and Pisano 1999). Thus, new firms, typically university spinoffs, could enter the industry; they were extremely specialised in particular technological and product niches and did not engage in manufacturing and marketing. Indeed, only a handful of them succeeded in becoming a fully integrated company.
5 In pharmaceuticals, the Herfindahl index in the global market ranged (only) from 0.0164 in 1985 to 0.0195 in 1995 (Pammolli 1996). The CR4 index was equal to 28% in 1947, 24% in 1967, and 22% in 1987. Empirically, we observe that, contrary to pharmaceuticals, R&D-intensive industries are often highly concentrated. This is the case, for example, among aircraft engines (CR4=72%), turbine and turbine generators (CR4=80%), and synthetic organic fibres (CR4=76%) (Sutton 1998).
6 In antiviral products, CR4 was 86% in 1995.
7 Estimates suggest that, out of all new compounds discovered, only one in 5000 reached the market (Koenig 1983, cited in Sutton 1998, Inside Biotechnology & Pharmaceuticals 2000).
8 The model has been modified in many respects from its previous version (Malerba and Orsenigo 2002; Garavaglia et al. 2006). We believe the new model is an improvement in the sense that it better represents the features of the pharmaceutical industry. We briefly describe the main improvements in the functioning of the model here. (A) Parallel projects: The R&D process has been consistently modified to allow firms to run multiple parallel projects (i.e. develop many products at the same time) in order to represent a more realistic behaviour. This change implies a radical difference with respect to the previous version of the model, including more sophisticated rules for the choice of promising products to develop. Three new routines have been created in order to manage multiple projects: (1) the choice of the drugs to develop in the portfolio of potential projects, (2) the choice of the number of projects to start in each period, and (3) how to allocate marketing investments among the ongoing projects. The first routine (the choice of the drug to develop) is particularly relevant in this new version of the model. The choice of the drug is now based on a function of the value of the TC and the time horizon before patent expiration occurs: the higher the value and the further the date of patent expiration, the more the project is considered valuable to the firm. The second routine (the number of projects to start in each period) is an optimisation algorithm based on the trade-off between firms' willingness to develop all multiple projects available and the budget constraints. Finally, a new rule that allocates marketing investments at the launch of the drugs has been developed. (B) Pricing rule: We improved firms' pricing rule moving from a fixed (exogenous) mark-up to a dynamic (endogenous) pricing routine. In this version of the model, the price of a product at time t depends on its prices in previous periods, on the elasticity of demand, and on the market power of firms in the TC. This new routine allows firms to change their prices in different simulation periods. (C) Endogenous TC values: The TC value becomes now a crucial variable both for the choice of the investment in new research projects and for products pricing. In the previous version of the model, the value of each TC was time invariant and exogenously assigned. In the new version of the model, it is a function of the time-invariant number of patients of the TC and the time-variant degree of competition within the TC (because of the different prices). (D) R&D choices: The choice of developing a product from a promising molecule among the molecules in the portfolio is now based on two criteria: (1) the (endogenously generated) value of the TC and (2) the time horizon before patent expiration of the molecule. This routine allows firms to invest in R&D in the most promising molecules. (E) Firms classification: Firms' propensity to innovate and imitate has been updated in a less deterministic fashion. In the past version of the model, firms were exogenously defined as innovative or imitative according to two different sets of routines. The new version introduces a less stringent a priori, assigning to firms an exogenous innate preference for one of the two activities without precluding the possibility of running both during their existence. The model with this new routine is more history-friendly in the sense that firms with a high propensity for innovation are allowed (rarely) to imitate drugs with expired patents, and, conversely, it could happen that firms with a high propensity to imitate behave as innovators. (F) Heterogeneous consumers: In the past version of the model, all consumers were equal. In the new version of the model, we introduced heterogeneity of consumers within each TC in terms of preferences for drugs. We divide consumers of each TC into four groups; in these groups, consumers are willing to buy a drug only if it satisfies a minimum level of quality (i.e. it shows a certain level of effectiveness and low side effects). This implies that drugs with low quality may gain a lower market share if compared to drugs with higher quality, even if they have been launched in the marketplace earlier. (G) Exit rules: The exit rules have been restated in order to account for three potential sources of inefficiency: inefficiency in R&D process, financial difficulties, and marginal market share within the market. (H) Calibration: In this version of the model, we also improved and detailed parameters' calibration. Finally, several minor changes and improvements have been applied and are embedded in the current version of the model.
9 The portfolio of molecules includes not only the molecules from which other firms generated a drug but also molecules not developed because firms failed or the molecule was not economically attractive.
10 More precisely, an imitative firm spends 1/3 of the money spent by an innovative firm to buy a step (step) of drug development. On the other hand, the imitative firm buys each period two times the amount of step to develop a drug. Even if the number of total step ( TotStep) is equal for innovative and imitative firms, imitative firms are characterised by faster and cheaper development processes.
11 Preliminary exercises in this direction suggest that exogenous changes in some key parameters, such as the quality check, patent protection, etc., do indeed have some significant effects on the output variables. However, such changes imply a discrete modification in the level of the relevant endogenous variables, but afterwards the dynamics of the model remain practically the same.
12 Exercises not reported here show that significantly different values of this parameter (30 < n F > 100) do indeed generate different results in terms of concentration, firms' sizes, innovativeness, etc. However, as the number of initial potential entrants increases, a stronger shake-out is observed and the values of the key “output” variables (active firms, Herfindahl index, etc.) turn out not to be radically different from the Standard Set.
13 We checked the representativeness of the results by studying the underlying distribution of simulated traces. Looking at the arithmetic mean, the median, and the standard deviation, the variables are well distributed and almost symmetric. Thus, the arithmetic mean is a good representation of the outcomes of the model. For example, at time 100 in Figure 2 we have: mean 0.23; median 0.21; standard deviation 0.0971; in Figure 1: mean 0.29; median 0.3; standard deviation 0.062. The same applies to all the figures in the rest of the paper.
14 See Garavaglia et al. (2010) for further details. A thorough analysis of the properties of firm growth in the model, as compared to real data, is left to further research.
15 In case we consider large variations in the input values, a desirable property of history-friendly simulation models is to observe significant variation in the outputs. We define such experiments as counterfactual exercises (Garavaglia 2010). Table 2 reports ANOVA p-values for different ranges of input variations that can be considered robustness checks (+/-2%, +/-5% and +/-10%).
Acknowledgements
- The authors acknowledge the financial support of the Italian Ministry for Education, Universities, and Research (FIRB, Project RISC - RBNE039XKA: "Research and entrepreneurship in the knowledge-based economy: The effects on the competitiveness of Italy in the European Union").
References
-
ARORA A., Fosfuri A., Gambardella A. (2001). Markets for technology and their implications for corporate strategy. Industrial and Corporate Change, 10(2), 419-451. [doi:10.1093/icc/10.2.419]
BALLANCE R., Pogany J., Forstner H. (1992). The World's Pharmaceutical Industries: An Introduction Perspective on Innovation, Competition and Policy. Edward Elgar, Hants, England.
BRENNER T., Werker C. (2007). A Taxonomy of Inference in Simulation Models. Computational Economics, 30, 227-244. [doi:10.1007/s10614-007-9102-6]
CABRAL L., Mata J. (2003). On the Evolution of the Firm Size Distribution: Facts and Theory. American Economic Review, 93(4) 1075-1090. [doi:10.1257/000282803769206205]
CHANDLER, A. D. (2005). Shaping the Industrial Century. The Remarkable Story of the Modern Chemical and Pharmaceutical Industries. Harvard University Press, Cambridge, MA. [doi:10.4159/9780674029378]
CHONG J., Crowell, H., Kend, S. (2003). Merck: Refocusing Research and Development. Blaisdell Consulting. April.
CHETLEY, A. (1990). A Healthy Business? World Health and the Pharmaceutical Industry. Zed Books, London.
COMANOR, W.S. (1986). The Political Economy of the Pharmaceutical Industry. Journal of Economic Literature, 24(3), 1178-1217.
DI Masi, J.A., Hansen, R.W., Grabowski, H. G. (2003). The Price of Innovation: New Estimates of Drug Development Costs. Journal of Health Economics, 22(2), 151-185. [doi:10.1016/S0167-6296(02)00126-1]
GAGNON, M.A., Lexchin, J. (2008). The Cost of Pushing Pills: A New Estimate of Pharmaceutical Promotion Expenditures in the United States. PLoS Med. 5(1), 1549-1676 [doi:10.1371/journal.pmed.0050001]
GARAVAGLIA, C. (2010). Modelling Industrial Dynamics with 'History-friendly' Simulations. Structural Change and Economic Dynamics. 21(4) 258-275. [doi:10.1016/j.strueco.2010.07.001]
GARAVAGLIA, C., Malerba, F., Orsenigo, L. (2006). Entry, Market Structure and Innovation in a History-friendly Model of the Evolution of the Pharmaceutical Industry. in G. Dosi and M. Mazzucato (Eds.), Knowledge Accumulation and Industry Evolution: The Case of Pharma-Biotech, Cambridge University Press, Cambridge. [doi:10.1017/CBO9780511493232.008]
GARAVAGLIA, C., Malerba, F., Orsenigo, L., Pezzoni, M. (2010). A History-friendly Model of the Evolution of the Pharmaceutical Industry: Technological Regimes and Demand Structure. KITeS Working Paper.
GARAVAGLIA, C., Malerba, F., Orsenigo, L., Pezzoni, M. (2012). Technological Regimes and Demand Structure in the Evolution of the Pharmaceutical Industry. Journal of Evolutionary Economics. 22(4) 677-709. [doi:10.1007/s00191-012-0285-1]
GARAVAGLIA, C., Malerba, F., Orsenigo, L., Pezzoni, M. (2013). Innovation And The Evolution Of Market Structure In Pharmaceuticals: An Econometric Analysis On Simulated Data. Journal of Economics and Statistics, forthcoming.
GRABOWSKI, H., Vernon, J. (1977). Consumer Protection Regulation in Ethical Drugs. American Economic Review, 67(1) 359-364.
GRABOWSKI, H., Vernon, J. (1994). Innovation and Structural Change in Pharmaceuticals and Biotechnology. Industrial and Corporate Change, 3(2), 435-449. [doi:10.1093/icc/3.2.435]
Henderson R., Orsenigo L., Pisano G.P. (1999). The pharmaceutical industry and the revolution in molecular biology: Interactions among scientific, institutional and organizational change (in Sources of industrial leadership). Cambridge University Press, Cambridge.
INSIDE Biotechnology & Pharmaceuticals (2000). From the Field series. Harvard Business School Publishing.
KLEIJNEN, J. (1997). Sensitivity Analysis and Related Analyses: A Review of Some Statistical Techniques. Journal of Statistical Computation and Simulation. 57(1-4), 111-142 [doi:10.1080/00949659708811805]
KLEPPER, S. (1996). Entry, Exit, Growth and Innovation Over the Product Life Cycle. American Economic Review. 86, 562-583.
KLEPPER, S. (1997). Industry Life Cycles. Industrial and Corporate Change, 6(8), 145-181. [doi:10.1093/icc/6.1.145]
KLEPPER, S., Thomspon, P. (2006). Submarkets and the Evolution of Market Structure. The RAND Journal of Economics, 37(4), 861-886. [doi:10.1111/j.1756-2171.2006.tb00061.x]
KOENIG, M. (1983). A Bibliometric Analysis of Pharmaceutical Research. Research Policy, 12(1), 15-26. [doi:10.1016/0048-7333(83)90024-0]
LICHTENBERG F.R. (2006). The effect of using newer drugs on admissions of elderly Americans to hospitals and nursing homes: state-level evidence from 1997 to 2003. Pharmacoeconomics, 24(3), 5-25. [doi:10.2165/00019053-200624003-00002]
MALERBA, F., Orsenigo, L., (2002). Innovation and Market Structure in the Dynamics of the Pharmaceutical Industry and Biotechnology: Towards a History-friendly Model. Industrial and Corporate Change, 11(4), 667-703. [doi:10.1093/icc/11.4.667]
MALERBA, F., Nelson, R., Orsenigo, L., Winter, S. (1999). History-friendly Models of Industry Evolution: The Computer Industry. Industrial and Corporate Change, 8(1), 3-40. [doi:10.1093/icc/8.1.3]
MALERBA, F., Nelson, R., Orsenigo, L., Winter, S. (2001). History-friendly models: An Overview of the Case of the Computer Industry. Journal of Artificial Societies and Social Simulation, 4(3), 6. https://www.jasss.org/4/3/6.html
NIGHTINGALE, P., and Martin, P. (2004). The Myth of the Biotech Revolution. Trends in Biotechnology, 22(11), 564-9. [doi:10.1016/j.tibtech.2004.09.010]
ORSENIGO L. (1989). The emergence of biotechnology: institutions and markets in industrial innovation. Pinter Publishers Ltd, London.
PAMMOLLI, F. (1996). Innovazione, Concorrenza a Strategie di Sviluppo nell'Industria Farmaceutica. Guerini Scientifica.
PISANO, G. P. (1996). The Development Factory: Unlocking the Potential of Process Innovation. Harvard Business School Press, Boston.
PISANO G. P. (2006). Science Business: The Promise, the Reality and the Future of Biotech, Harvard Business School Press. Boston.
RICHIARDI, M., Leombruni, R., Saam, N., and Sonnessa, M. (2006). A Common Protocol for Agent-Based Social Simulation. Journal of Artificial Societies and Social Simulation, 9(1), 15. https://www.jasss.org/9/1/15.html
SUTTON, J. (1998). Technology and Market Structure: Theory and History. MIT Press Cambridge, MA.
WINDRUM, P. (2007). Neo-Schumpeterian Simulation Models. In H. Hanusch and A. Pyka (Eds.). Elgar Companion to Neo-Schumpeterian Economics. Edward Elgar, Cheltenham, 405-439. [doi:10.4337/9781847207012.00034]
WINDRUM, P., Fagiolo, G., Moneta, A. (2007). Empirical Validation of Agent-Based Models: Alternative and Prospects. Journal of Artificial Societies and Social Simulation, 10(2),8. https://www.jasss.org/10/2/8.html