
 Abstract
- The process of learning in social-ecological systems is an emerging area of research, but little attention has been given to how social and ecological interactions motivate or inhibit learning. This is highly relevant to the South African water sector, where a major policy transition is occurring that provides local water users and managers with new opportunities to engage in adaptive learning about how to balance human and ecological needs for water. In this paper, an agent-based model is used to explore potential 'learning dilemmas', or barriers to learning in the South African water sector, whereby human perceptions combined with social-ecological conditions affect the capacity, understanding, and willingness required to learn. Agents manage water according to different management strategies and use various indicators to evaluate their success. The model shows that in areas with highly variable hydrological regimes, agents may be less able to learn because conditions are too unpredictable for them to benefit from past experience. Because of these changing conditions, however, agents are more likely to try new water management strategies, promoting a greater diversity of experience in the system for agents to learn from in the future. In water-stressed areas, where agents tend to have greater difficulty fulfilling demand for water than in areas with abundant water supplies, they are also more apt to try new strategies. When learning is restricted to small areas, agents may learn more quickly but based on a more narrow range of experience than in larger or more heterogeneous areas. These results suggest a need to enhance learning so that it accounts for interacting hydrological, ecological, and social dynamics. Although the model is a highly stylised version of reality, this preliminary exploration may eventually help to reverse the past trend of poor understanding of social-ecological dynamics as they relate to water management.
- Keywords:
- Catchment, Institution, Learning, South Africa, Water, Agent
Introduction
- 1.1
- Sustainable management of complex social-ecological systems is based on an understanding and maintenance of system function and structure, amid situations of change and uncertainty (Schlüter et al. 2012). In particular, the ability of decision makers to capture system information so that important patterns can be detected is essential to achieving sustainability (Wilson 2002). Social-ecological systems, however, are inherently dynamic, requiring decision makers to not only detect patterns, but also to constantly 'keep up' with change in these patterns through reflection and adaptive learning. More often than not, however, individuals and institutions are disadvantageously positioned, first to capture and process appropriate information, and secondly to use it to guide management, serving to explain numerous resource management failures (Carpenter et al. 2002).
- 1.2
- Historically, both types of barriers—to learning and integrating learning into management—have plagued South African water management, the example discussed in this paper. Improving learning has been recognised as a high priority for the individuals and organisations responsible for implementing the South African Water Act of 1998 (Rogers et al. 2000; van Wyk et al. 2001; MacKay et al. 2003) and its accompanying set of institutional reforms. This will require management of whole river basins, marking a significant transition in information and power flows (du Toit et al. 2011) and an opportunity for further learning by actors across multiple scales (Pahl-Wostl et al. 2007). However, numerous barriers to learning will need to be overcome. Many of these arise from human perceptions of water resources that have been based on, and further contribute to, a flawed understanding (MacKay 2003). Meanwhile, these perceptions are confounded by social-ecological dynamics such as water stress, water variability, and ability of actors to access relevant information through learning networks. In this paper an agent-based modeling approach is used to investigate some of the major barriers to learning—'learning dilemmas'—confronting South African water management. This is followed by some reflection on the implications of these learning challenges for future water management and monitoring.
Learning in social-ecological systems
-
Learning how to learn
- 2.1
- The problem of 'learning how to learn' extends beyond simple learning and includes evaluation of learning outcomes and processes, also described as double- and triple-loop learning (Fernandez-Gimenez et al. 2008). These more advanced levels of learning are garnering increasing attention from researchers in the natural and social sciences, as well as natural resource managers and practitioners (Gunderson et al. 1995; Berkes et al. 2003; Fazey et al. 2005; Pahl-Wostl et al. 2007; Rodela 2011). Learning in social-ecological systems is important for several reasons. This is a time of dynamic change: societies are inundated – if not overwhelmed – by information, data, and computational power, they exert tremendous pressure on resources, and have forged greater interconnectedness among disparate parts of global systems than possibly ever before (van der Leeuw et al. 2011).
- 2.2
- As change and complexity increase, so does awareness of the limits of scientific knowledge and understanding for solving integrated problems in the real world (van der Leeuw et al. 2011). Active adaptive management, which integrates research and action (Salafsky et al. 2001; Fazey et al. 2005), and its variants, adaptive co-management (Armitage et al. 2009) and strategic adaptive management (Roux and Foxcroft 2011), are approaches based on this awareness. In this paper, the definition of learning is not restricted to the expansion of a formal body of knowledge about the natural environment, but includes varied individual and societal perceptions of this environment (Adams et al. 2003) as well as needs and aspirations in relation to it (Sen 1999). Learning is also understood to be a dynamic process, in which the interpretation of feedbacks is a key element. This includes the ability to read cues from the environment as well as to respond to them appropriately (Berkes and Folke 1998; Tengö and Belfrage 2004). This becomes a challenge as water infrastructure worldwide encourages "technology induced environmental distancing" behaviours that divorce water users from a holistic appreciation of water resource systems, and knowledge based on direct observation (Alessa et al. 2007, 2010).
'Learning dilemmas'
- 2.3
- Gallopín (2002) suggests that decision-making for sustainable development rests on three 'pillars': understanding, willingness and capacity. I argue that 'learning dilemmas' form when human perceptions combined with social-ecological conditions produce a deficiency of understanding, willingness, or capacity to learn. Understanding in learning terms means perceiving a problem in relation to learning; knowing what and how to learn (Fernandez-Gimenez et al. 2008). Willingness to learn depends on confidence in learning; belief that learning will help solve problems, as well as the acceptance of some level of risk, or tolerance of change associated with learning. The capacity to learn depends on reliable access to a 'learning network' from which information can be obtained. This relates to social learning (Conte and Paolucci 2001; Pahl-Wostl et al. 2007), and may include other actors, media, and collective experimentation that allows for recording and evaluation of past experiences. Naturally, these three pillars of learning are interdependent.
- 2.4
- Human societies have a long history of learning how to manage natural resources sustainably, but the very nature of linked social-ecological systems can cause challenges to learning (Berkes et al. 2003). For example, natural environmental variability may obscure signals and make it difficult to relate cause and effect (Fazey et al. 2005). This is amplified by anthropogenic changes to the environment and socio-technical regimes (Smith and Stirling 2010) that can also convolute understanding of natural processes. Ironically, it has been common practice to reduce natural ecosystem variability to increase productivity of a resource, although this may compromise learning ability and decrease adaptability over the longer term (Holling and Meffe 1996). For example, when dams reduce natural variability by stabilising river flows (Hughes et al. 2005), distortions are created in the perceived hydrological system which are mirrored in consumer behaviour. Learning may be stalled by differences in opinion about what learning priorities are and how they should be achieved; although managers and leaders may want to encourage learning, they may diverge on priorities or the way to achieve them. In other cases, leaders may limit public acquisition of new information because it is perceived as a threat to their power (Pritchard and Sanderson 2002).
Case study: Change in the South African water sector
- 3.1
- Historically, understanding of social-ecological dynamics among South African water institutions has been poor. South Africa shares the water management trajectory of many nations, where an initial focus on supply-side solutions is giving way to more integrated demand-side management as water stress increases (van Wyk et al. 2001). During the 20th century, learning was based on science and knowledge that was generated and controlled by the state (Dent 2001). This top-down style of water resources isolated itself from much of the knowledge that existed on the ground and had been amassed through observations and research by communities and civil society organisations.
- 3.2
- Among the state water institutions, the value of learning was also obscured by the prevailing worldview of the relationship between water and society, which held that water resources are the product of linear processes with predictable, controllable outcomes, though in fact, water resource dynamics throughout southern Africa are highly variable and non-linear (Schulze 2005). During the previous era of government, it was believed that most problems that arose could be solved through proven technical means (Turton and Meissner 2002)—water shortages could be averted by building large storage dams, for example. Monitoring was not considered necessary, on the premise that all of the relevant information already existed and any problems that arose could be addressed with existing solutions. Within this environment, resistance to change grew. Because change was not encouraged, it was very costly to attempt to deviate from the 'sanctioned discourse' of water management (Turton and Meissner 2002). Trying new approaches was synonymous with abandoning accepted views and long-held traditions, admitting flaws in current practices, and jeopardising one's career, and as such, little investment was made in the construction of a broad knowledge base (Dent 2001). This mode of operating was also highly exclusive, with little or no public participation, and with an inequitable distribution of water benefits (Colvin et al. 2008).
- 3.3
- The situation of the past is in stark contrast to the vision outlined in the country's current legislation, the Water Act of 1998, and its basis on three principles: efficiency, equity, and sustainability (Pollard and du Toit 2008). By this law, some of the powers formerly held by the state will be devolved to large catchment-scale institutions called catchment management agencies (CMAs), which together with their constituents will each prepare a catchment management strategy for the water management area (WMA) over which it presides. Currently, the greatest learning challenge faced in this arena revolves around implementation of the Act (Colvin et al. 2008), which represents a major cognitive and institutional shift from the previous system of water management. Meeting its three principles is expected to require an adaptive approach (Rogers et al. 2000; MacKay et al. 2003; King and Brown 2006; Pollard and du Toit 2008), because a uniform management regime cannot accommodate the vast range of variation and unpredictability in the country's water resources and water use.
- 3.4
- Learning in the South African water sector has also been particularly influenced by three significant characteristics of South African water resources: high temporal variability, spatial heterogeneity (Schulze 2005), and water stress that is expected to intensify during the next 20 years (Seckler et al. 1998). These conditions are likely to have even more impact in the future, due to the effects of climate change (Schulze 2005) and increasing demand for limited resources. The focus of this paper is therefore on how these three characteristics contribute to learning dilemmas.
An agent-based model of learning
- 4.1
- Models can be useful to improve understanding of social and environmental conditions that potentially motivate or inhibit learning in ecosystem management (Schlüter et al. 2012). Agent-based models, which allow the observation of dynamics that emerge from individual decisions over large scales of space and time (Epstein and Axtell 1996; Bousquet and Le Page 2004; García-Barrios et al. 2008; Le Page et al. 2012), are particularly well-suited to such investigations. Agent-based models have explored, for example, resilience of water management institutions to changes in the variability and uncertainty of water availability (Schlüter and Pahl-Wostl 2007), collective communication and cooperation (Power 2009), and the influence of narrow and broad 'knowledge pools' on knowledge transfer between and within groups (Kunz 2011), urban water planning applications (Galán et al. 2009) and future global water scenarios (Soboll et al. 2010).
- 4.2
- Much of the early modeling that underpinned South Africa's water management happened in isolation of social and policy processes (Dent 2000; Farolfi et al. 2010). In this paper, an agent-based model, called the WaterScape, investigates whether agents in a simplified, stylised version of the South African water sector demonstrate patterns of learning. Developed with CORMAS (Common-pool Resources and Multiagent Systems), an object-oriented programming platform (Bousquet et al. 1998; Le Page et al. 2012), the WaterScape explores the ability of water users to meet the South African Water Act principles by adopting different strategies and using different methods of learning. Here, learning experiments are conducted to explore two aspects of learning dilemmas: 1) how different social-ecological conditions and 2) agents' selection of different indicators to evaluate their actions affect capacity to learn, willingness to learn, and understanding of how and what to learn.
Spatial environment
- 4.3
- The learning 'game' is played on a spatial environment representing the collective surface water resources of South Africa, and upstream neighbours Lesotho and Swaziland (Figure 1).
- 4.4
- The modeled environment consists of quarter-degree-square (50 km2) grid cells, each of which represents approximately one quaternary catchment. Each quaternary catchment that falls entirely or partially within South Africa belongs to one of nineteen contiguous Water Management Areas (WMA). The total area (1268 km2) is divided into 1946 quaternary catchments. Initial runoff values are obtained from a hydrologic model of the region, the Water Situation Assessment Model (WSAM) version 3.0 (Schultz and Watson 2002). At each time step, equivalent to one year, runoff in a catchment is replenished at a rate that reflects inter-annual variation, based on a normally-distributed random function and the catchment's hydrological index value, a measure of flow variability (Hughes and Hannart 2003). Runoff is also affected by climate change, which is likely to lead to pronounced decreases in runoff that will move progressively from west to east. In the model a 10% decrease in runoff by 2015 is assumed for the western part of the country and a 10% decrease in runoff by 2060 is assumed for the eastern part of the country. Runoff is expected to increase in some catchments along the eastern seaboard, in the northeast, and isolated areas in the west during the same period (Schulze 2005). Water that is not withdrawn for consumption flows to downstream catchments.
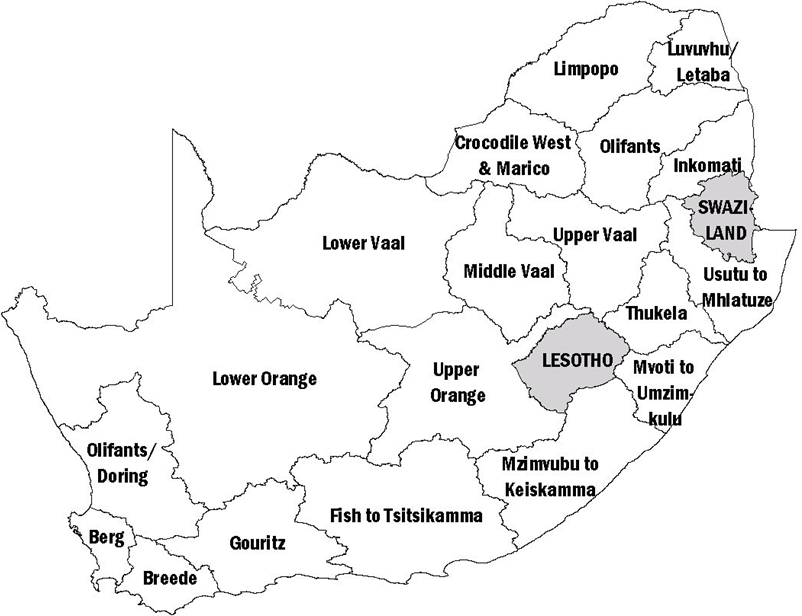
Figure 1. Map of South Africa depicting international boundaries and Water Management Areas (WMAs). Agent decision-making
- 4.5
- Water management decisions are based on information about the environment that is socially-constructed, and tend to be framed by a prevailing discourse on the relationship between water resources and society (Turton and Meissner 2002). However, this discourse is mediated by individual agent worldviews regarding the 'real' world (Janssen and de Vries 1998). These social and individual perceptions of the WaterScape environment manifest in the selection of measures or indicators used by agents to make decisions (Figure 2). The effectiveness of a water management strategy may be judged very differently when it is based on an indicator of a catchment's potential economic value as opposed to an indicator of its ecological transformation.
- 4.6
- Key model components include (see Appendix A and B for a description of model entities and attributes; the model code is available at the Open ABM model archive):
- 4.7
- Agents: In this model there are two types of agents, each of which represents a level of decision-making (Figure 3). The first type represents one of five water use sectors: agriculture, forestry, mining and industry, rural and urban. The second type represents the CMA, which strives to enforce rules to balance demand and supply in its Water Management Area (WMA). The sectoral agents' objective is to meet their demand with existing supplies in their quaternary catchment.
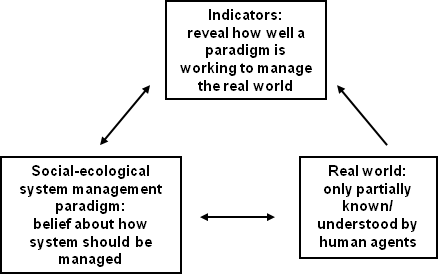
Figure 2. Schematic of major relationships governing an actual and perceived environment in a social-ecological system. 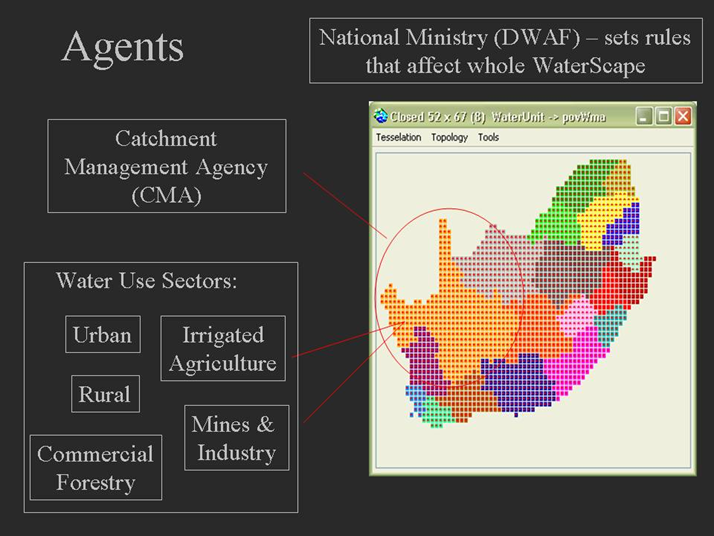
Figure 3. Visual representation of WMAs and two types of agents in the CORMAS program. - 4.8
- Each sector has a distinctive pattern of water use, based on various biophysical (e.g. land-cover, geology, climate) and socioeconomic (e.g. demographics, infrastructure) factors. Initial demand values for the model are obtained from the WSAM, as above. These amounts change from year to year in accordance with assumptions of each paradigm, and are estimated from a high or base growth projection for each sector and each WMA (DWAF 2004).
- 4.9
- Demand projections: Growth in sectoral demand is constrained to catchments in which the sector already consumes water; this constraint prevents agricultural growth, for example, from occurring in areas that are not viable for agriculture, but also prevents some potentially realistic growth, such as urban development in a presently rural area. To a large degree, areas that are suitable and available for agriculture and forestry in South Africa are already exploited, and thus little further expansion is expected (Biggs and Scholes 2002). Urbanisation, by contrast, is expected to have prolific implications for water resources in South Africa (DWAF 2004), but a fine-grained analysis of the urban sector was beyond the scope of this model.
- 4.10
- Water productivity: The productivity of water use (i.e. contribution to GDP per unit of water consumed) by these sectors varies greatly, with industry generating more than 50 times the GDP of agriculture for a given quantity of water (Eberhardt and Pegram 2002 ). The following sectoral multipliers are used to derive value generated in South African Rands per cubic meter, based on estimates of Eberhardt and Pegram (2002 ): 1.4 for agriculture, 73.6 for forestry and mining and industrial, 30 for urban and 10 for rural water use. As more detailed data on water productivity is limited, these average multipliers for the country only provide a rough indication of the relative value of water use by different sectors. These multipliers do not reflect variation within sectors or between regions, nor possible change over the 100-year period, all of which may be significant.
- 4.11
- Human and Ecological Reserve: Under the 1998 Water Act, the allocation of water to meet sectoral demands must take into account a legally-defined Reserve, which has two components (DWAF 2004). The human reserve is a mandated minimum of 25 litres per person per day from a source within 200 meters of the home. The ecological reserve refers to the quantity, quality, pattern, timing, water level, and assurance of water that must remain in a river in order to ensure its ecological functioning. The ecological reserve requirement is to be set by DWAF for each quaternary catchment based on a desired ecological management class, in turn based on objectives for the water resources (Palmer et al. 2004). Class values range from A for a pristine water resource to F for a critically modified one. For example, where conservation and ecotourism are viewed as important objectives for the water resource, the desired class would be designated as an A and a higher ecological reserve requirement would be set. Where the primary objective of the resource is to provide water for waste disposal, the desired class would be designated as a C or D and the reserve requirement would be lower. Desktop estimates of the present ecological management class for each quaternary catchment (Kleynhans 2000) are used in the model, where each class corresponds to a range of numerical values, which increase with increasing modification.
- 4.12
- Ecological feedbacks: When water withdrawal increases beyond a certain threshold, a water resource must be reclassified and its ecological management class adjusted, which in turn may affect future water availability (Figure 4). This occurs in a situation of severe water stress, defined as a ratio of water withdrawal to availability above 0.4 (Alcamo et al. 2000, 2003, Cosgrove and Rijsberman 2000, Vörösmarty et al. 2000). The reclassification required depends on the extent the ratio is exceeded and the sensitivity of the catchment to water withdrawal, and is calculated by multiplying the withdrawal-to-availability ratio and the catchment's importance and sensitivity index value (DWAF 1999, Kleynhans 2000). An impact on the ecological management class value in a given catchment similarly affects all downstream catchments in which the withdrawal-to-availability threshold is exceeded. It is assumed that an ecological management class value of D or worse (i.e. E-F) denotes a transformed catchment (Nel et al. 2004), for which the ecological management class value is not able to improve.
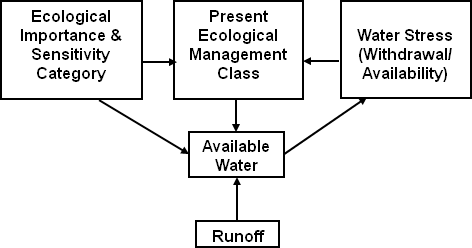
Figure 4. Ecological feedbacks in the WaterScape model. - 4.13
- Although these D-F catchments can be described ecologically as "beyond the brink"—i.e. they have undergone a regime shift (Biggs et al. 2009)—they can nonetheless still provide some functions more or less effectively depending on how water resources in the catchment are managed. Therefore, transformed catchments are affected by water stress in the same way as untransformed catchments, although no reclassification applies. Admittedly, the modeled relationships between the importance and sensitivity index, the ecological management class, and runoff available for withdrawal reflect a rudimentary understanding, as the precise relationships between hydrology and ecological integrity are not well known (Hughes and Hannart 2003, King and Brown 2006).
Water management paradigms
- 4.14
- Water use in the model is influenced by three broad water management paradigms: one based on maximising efficiency (Efficiency First), one rooted in a command-and-control approach (Hydraulic Mission), and one that strives for a balance of the three Water Act principles of efficiency, equity, and sustainability (Some, for All, Forever). Agents' decision-making is limited to choosing among these. These paradigms define the rules by which water is distributed among the sectoral agents in their catchment each year, management interventions that the CMAs can use to reconcile demand and supply, and different rates of growth for the five sectors.
- 4.15
- Efficiency First: Under this paradigm, if available water equals or exceeds the total demand of all agents in the catchment, all agents get as much water as they need. If there is not sufficient water, water is allocated preferentially, based on a sector's economic efficiency (Rand value generated per m3 of water use) in each catchment. Water is allocated in this way until either all water is allocated or all demands are fulfilled. In catchments that still have a deficit, demand can be 'offloaded' from deficit catchments in the WMA to catchments that have surplus water. This might happen, in the real world, when businesses or residences are relocated, or water use licenses are traded within a sector. Once this process is complete, any existing water shortages in a WMA can be alleviated through water transfers between WMAs. Under this scenario, water may be transferred from the catchment with the maximum surplus to the catchment with the maximum demand, on two conditions: water must travel over the shortest distance possible, and the amount transferred cannot exceed the recipient's deficit. Transferred water is immediately allocated according to the preferential rule described above.
- 4.16
- Hydraulic Mission: Here, the same rule used in Efficiency First applies if there is sufficient water to meet all agents' needs. If available water is less than the total demanded, each sector receives an amount proportional to its demand, serving to preserve the current sectoral ratios of water use. If a WMA has a deficit, water may be transferred from a surplus WMA. Transfers are made from catchments with the maximum available surplus to catchments with the maximum demand, which favours the agricultural and mining and industrial sectors in line with the Hydraulic Mission paradigm. There are no limits in the model on the distance over which water can be transferred. Transferred water is immediately allocated according to the proportional rule described above.
Some, for All, Forever
- 4.17
- Under this paradigm, CMAs are required by the Water Act to first satisfy the human and ecological components of the Reserve, respectively. Remaining water is then allocated according to the strategy used in Efficiency First. Water can then be transferred between WMAs under the same conditions that apply to Efficiency First, but in this case priority is given to the catchment with the largest deficit, irrespective of its demand. Under this scenario, CMAs take several active measures to improve sustainability and equity. First, restoration efforts are undertaken to improve the ecological management class so long as the level of ecological transformation and the withdrawal-to-availability ratio in the catchment are below the threshold values given above. Second, if the ecological management class deteriorates by five percent or more from initial conditions within a period of five years, a CMA may increase the ecological reserve requirement for the catchment by five percent, so long as the Reserve is currently met. This rate of change corresponds to modeled relationships between flows and ecological integrity that are being used to support the ecological reserve implementation in South Africa (King and Brown 2006). For example, a pristine catchment affected by a five percent decline within five years would retain 'near natural' flows, but if left unchecked, this rate of decline would result in severe modification by the end of the century. Third, to improve equity, a CMA may intervene in catchments where the difference between the largest and smallest ratios of water allocated to water demanded exceeds 0.5 for five consecutive years (i.e. the most satisfied user's ratio is more than 50% greater than the least satisfied user's). Here, CMAs enforce water demand management practices for the largest consumer in the catchment such that a five percent reduction in demand is achieved – in other words, the consumer is able to maintain current productivity with five percent less water and the 'freed up' water can be allocated to other sectors.
- 4.18
- A variant of this paradigm was explored that involved non-compliant agents who choose to ignore the reserve requirements and allocate water to other demands first. Though not presented here, the outcomes converged on those of the other two paradigms, with the consequences being a reduction in available water in the longer term.
Agent learning behaviour
- 4.19
- As an important area of learning on the WaterScape concerns the meeting of the three Water Act principles, agents use three indicators that relate to these principles to guide their decision-making. In this paper agents are restricted to choosing from among these indicators because of the water sector's interest in the effectiveness of the Water Act if implemented as envisioned. To test the sensitivity of the model to different assumptions about agents' goals related to learning, a series of different algorithms were explored (Appendix C).
- 4.20
- Agents can change their water use strategy when the value of their indicator exceeds a certain threshold. For simplicity of interpretation, each agent may use only one indicator at any given point in time. The first indicator is the economic value generated per cubic meter of water use, a measure of efficiency. Agents change strategies when this value falls below 10 South African Rands/m3, equivalent to one-half the average water use value across all sectors (Eberhardt and Pegram 2002 ). The second indicator is the ability to fulfil the human reserve requirement with available water; agents change strategies when there is a human reserve deficit. This indicator provides a broad measure of equity, in that the inability of the human reserve requirement to be met implies that either the distribution of water within a catchment or between catchments is skewed. A third indicator is the extent of change in the present ecological management class value, a measure of sustainability; agents may change strategies when the ecological management class declines from its initial value by five percent or more.
- 4.21
- The learning process is modeled as follows (Figure 5): Each year, agents use their indicator to evaluate whether their strategy in the previous year was successful. As agents assume conditions in the coming year will be similar to those in the previous year, a successful agent will continue using its previous strategy, following reinforcement learning theory (Izquierdo et al. 2008). An unsuccessful agent will imitate the most successful water user in its water management area, on the assumption that imitation is a key social learning process (Conte and Paolucci 2001) and that agents in close proximity face similar conditions and should thus achieve similar results. An agent considers experience in the previous year only, ignoring its more distant memory and historical information. Learning occurs when the outcome of an agent's decision to change or persist with its strategy matches its expectation of success.
- 4.22
- In an initial experiment, agents cannot change their indicator during the simulation. A second experiment is then conducted, in which agents may change their indicator after five successive years of failing to meet their success threshold. This time period is consistent with the water policy's recommendation for reviews every five years to re-evaluate and adapt approaches in light of changing social and economic circumstances (DWAF 2004). From a modeling perspective, after five years there is a reasonable chance that an unsuccessful agent has tried all three water management strategies and may thus wish to revisit its paradigm and subsequently, the indicator by which it measures success. Indicator change follows a prescribed sequence (Figure 6). First, agents who use the efficiency indicator and fail to meet the success threshold are likely to be situated in catchments dominated by low-efficiency water use (i.e. agriculture and rural). Although in reality measures may exist to improve efficiency in these catchments, this is not possible in the model. These agents believe that the onus is on other catchments to improve efficiency, while the best they can do is to ensure that all water users get a reasonable share of the resource; thus they switch to the equity indicator.
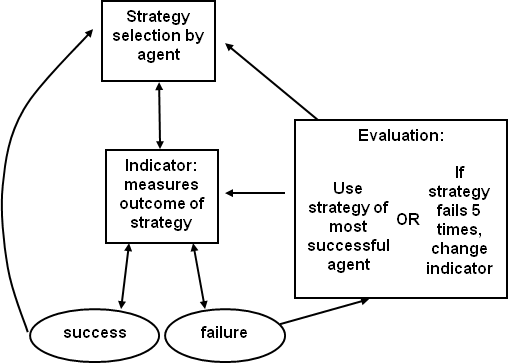
Figure 5. The mechanics of agent learning behaviour as represented in the WaterScape model. 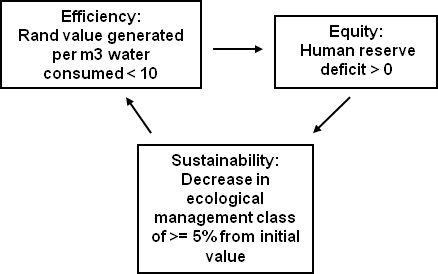
Figure 6. Sequence of indicator change (see text for rationale). - 4.23
- Second, agents who use the sustainability indicator, and fail to meet their success threshold, switch to the efficiency indicator, believing that higher efficiency will reduce water consumption and thus slow the decline in ecological condition. Third, agents who use the equity indicator and fail to meet their success threshold are suggestive of a water supply crisis: equity cannot be improved simply by increasing the amount allocated to each user. This drives these agents to adopt a more conservation-oriented approach and switch to the sustainability indicator.
- 4.24
- The sequence of model activities is illustrated in Figure 7.
Results of learning experiments
- 5.1
- Each model experiment was run for 100 time steps to observe medium- to long-term learning dynamics, and was run 20 times to account for random variation between simulations.
Use of indicators
- 5.2
- Figure 8a-e illustrates dynamics on the WaterScape when all agents follow the same rules for indicator use. When all agents use the efficiency indicator, the vast majority (80%) select the Efficiency First strategy at the end of the 100-year period. When the equity indicator is used by all agents, strategy selection is more erratic, but Efficiency First is the slightly preferred strategy for most of the simulation. When all agents use the sustainability indicator, more than 40% select Some, for All, Forever, with an approximately equal preference for the other two. When the three indicators are randomly distributed among agents, but are fixed, agents increasingly select the Efficiency First strategy, while the selection of the other two strategies declines over time. Similar patterns emerge when agents are allowed to change indicators.
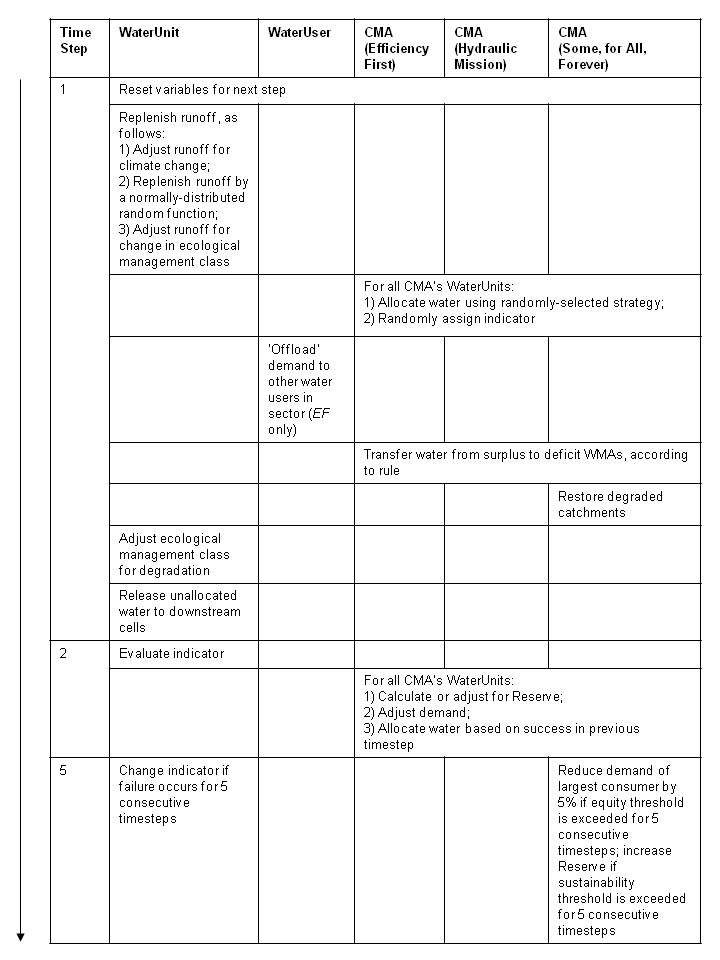
Figure 7. Sequence of activities in the model. All activities are repeated each timestep unless noted otherwise. 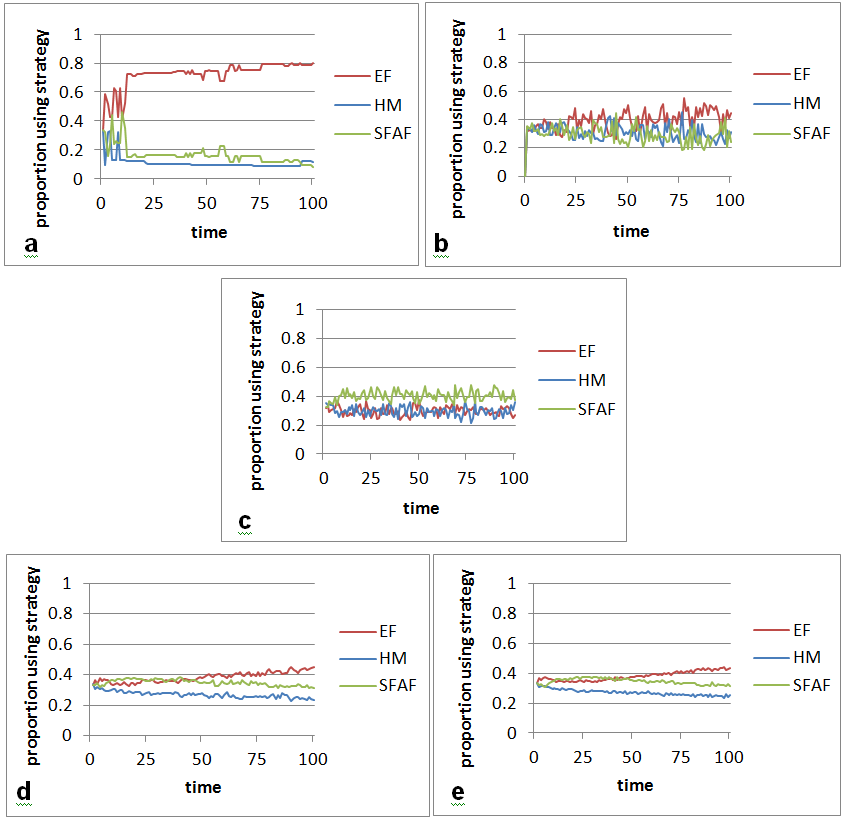
Figure 8. Strategy selection when all agents use: a) efficiency indicator; b) equity indicator; c) sustainability indicator; d) randomly assigned and fixed indicators; e) changing indicators. EF = Efficiency First, HM = Hydraulic Mission, SFAF = Some, for All, Forever. - 5.3
- Figure 9 shows the proportions of agents who change strategies. Agents change strategies when they fail to meet their success threshold; thus an increase in this measure signifies either increasing difficulty for agents to meet the threshold, decreasing ability to learn from other agents in the water management area, or both. At the end of the simulation, about 80% of the efficiency indicator users change strategies (i.e. adopt the most successful strategy in their water management area), while about 40% of the equity and sustainability indicator users change. When the three indicators are used together, but are fixed, the proportion of strategy changers drops to about 30%, and to less than 20% when agents can change indicators. In all cases, the proportion of agents that change strategies increases during the 100 years.
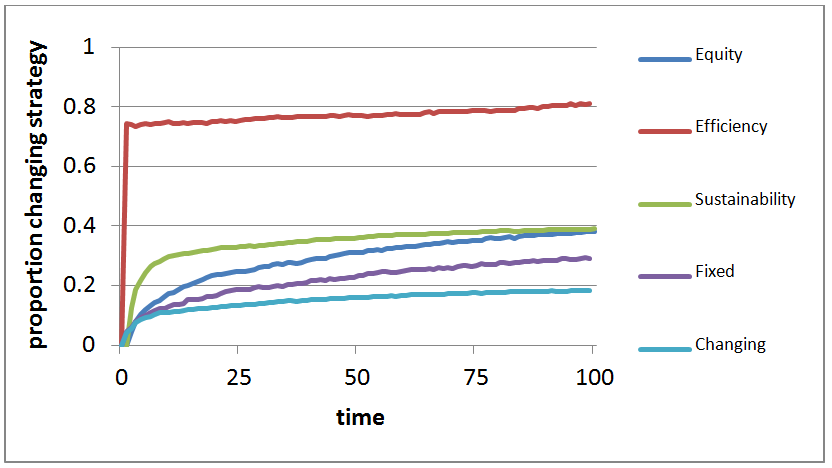
Figure 9. Strategy change when agents use the three single indicators, randomly-assigned fixed indicators, and changing indicators. - 5.4
- Given a choice of indicators, nearly half of the agents use the sustainability indicator, nearly 40% use the equity indicator, and less than 20% use the efficiency indicator by the end of the 100 years (Figure 10). The proportions of agents using the sustainability and efficiency indicators decline over time, however, while the proportion using the equity indicator increases.
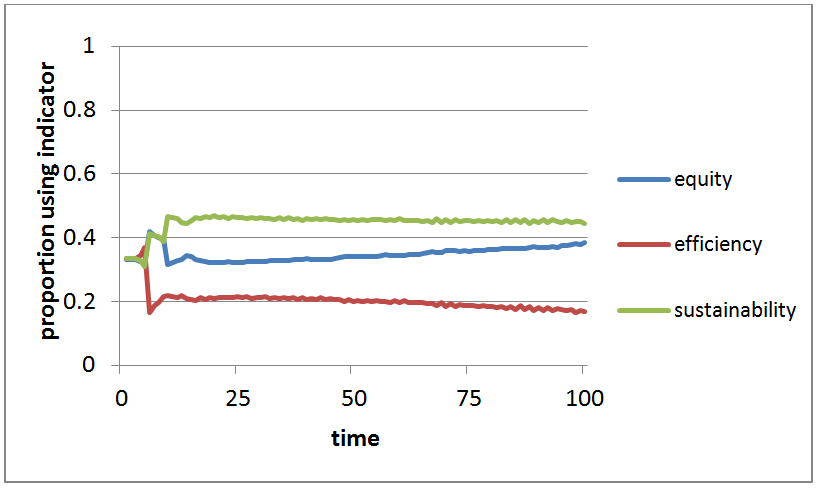
Figure 10. Indicator selection by agents with changing indicators. Effect of social-ecological conditions: Water Management Area (WMA) comparison
- 5.5
- Perceptions of the WaterScape are influenced not only by agents' water management paradigms, but by the social-ecological conditions they experience or observe. Because many future water management decisions in South Africa will be made at the WMA level, results are compared in five WMAs which differ in hydrological variability, water stress, and size (Figure 11).
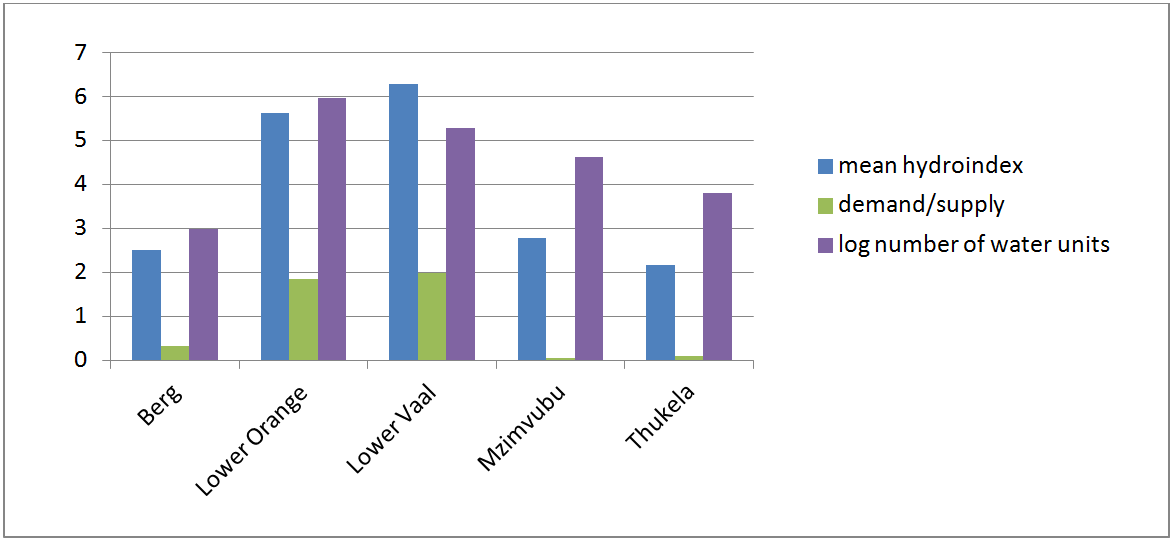
Figure 11. Hydrological variability (mean hydrological index value), water stress (ratio of demand to supply) and size (log number of water units) of five water management areas. - 5.6
- When indicators are randomly-assigned and fixed, agents slightly prefer Efficiency First where water stress and variability are high (e.g. Lower Vaal and Lower Orange WMAs, Figure 12a) and Some, for All, Forever where water stress and variability are relatively lower (e.g. Thukela and Mzimvubu, Figure 12c). Strategy preference is most dynamic in the smallest WMA, the Berg, where more agents switch from Some, for All, Forever to Efficiency First. When agents can change indicators, strategy preferences are clearer, particularly for Efficiency First in the Berg (Figure 13a) and for Some, for All, Forever in the Thukela and Mzimvubu (13c). When agents cannot change indicators, strategy change is more prevalent in the Lower Orange, Lower Vaal, and Berg WMAs, but increases in all over time (Figure 14a). When they can change indicators, the proportions of agents changing strategies decreases significantly in all WMAs except the Thukela, where the majority of agents use their previous strategies regardless of whether they can change indicators. More agents continue to change strategies in the Lower Orange and Lower Vaal WMAs than in the three others (Figure 14b).
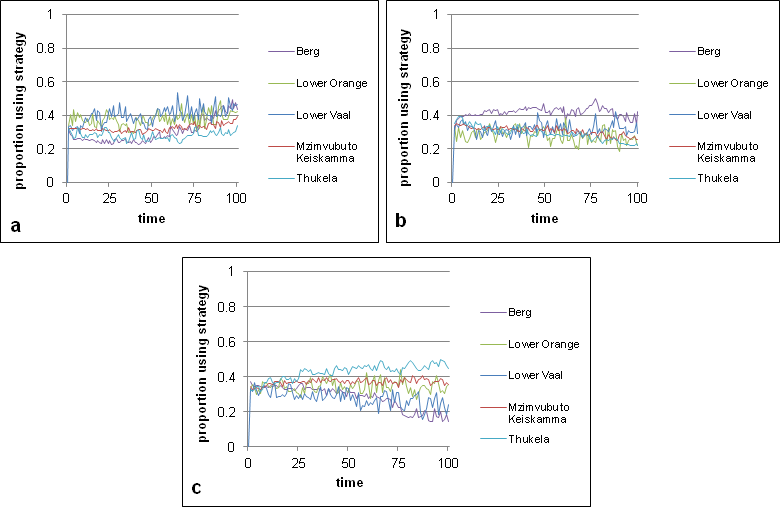
Figure 12. Agents selecting a) Efficiency First; b) Hydraulic Mission and c) Some, for All, Forever strategy when using randomly-assigned fixed indicators in five WMAs: smallest (Berg); largest (Lower Orange); least water-stressed (Mzimvubu); most variable and water-stressed (Lower Vaal); and least variable (Thukela). - 5.7
- The equity indicator is most strongly favoured by the Berg WMA, although at least 30% of agents use it in each WMA (Figure 15a). The efficiency indicator is initially strongly favoured by the Berg, but this preference declines over time; use of this indicator increases slightly in the Thukela (Figure 15b). The sustainability indicator dominates most clearly in the Lower Orange and Lower Vaal WMAs, while its use decreases steadily in the Berg during the first 50 years of the simulation (Figure 15c).
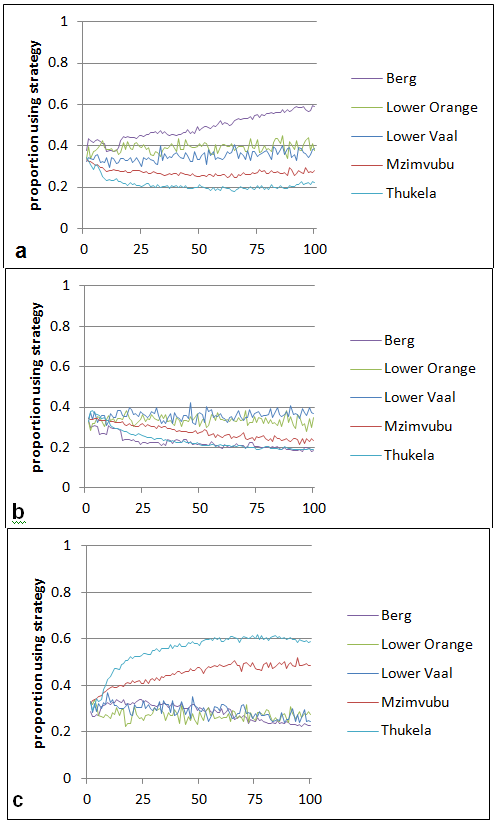
Figure 13. Agents selecting a) Efficiency First; b) Hydraulic Mission and c) Some, for All, Forever strategy when changing indicators in five WMAs: smallest (Berg); largest (Lower Orange); least water-stressed (Mzimvubu); most variable and water-stressed (Lower Vaal); and least variable (Thukela). 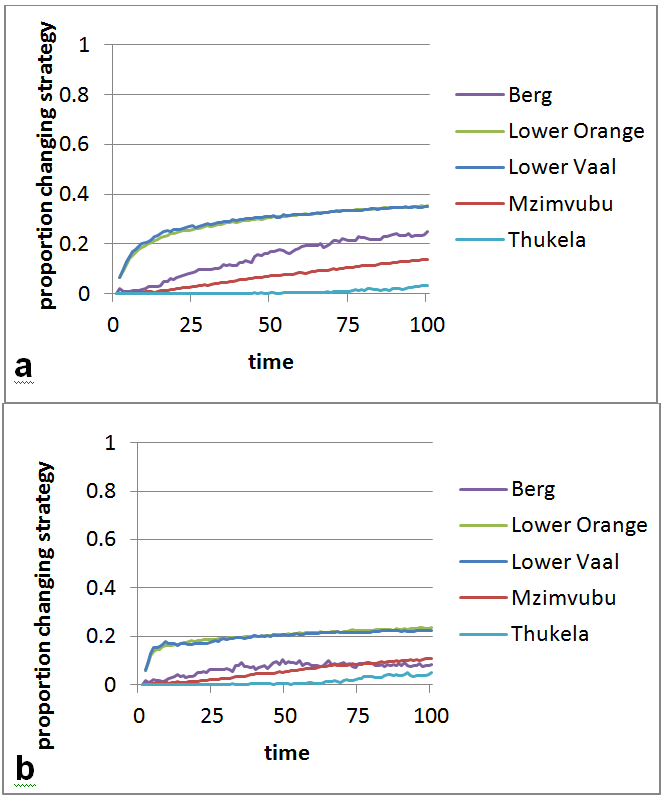
Figure 14. Strategy-changing behaviour of agents in five WMAs when: a) able to change strategies by randomly-assigned fixed indicators; b) able to change indicators. 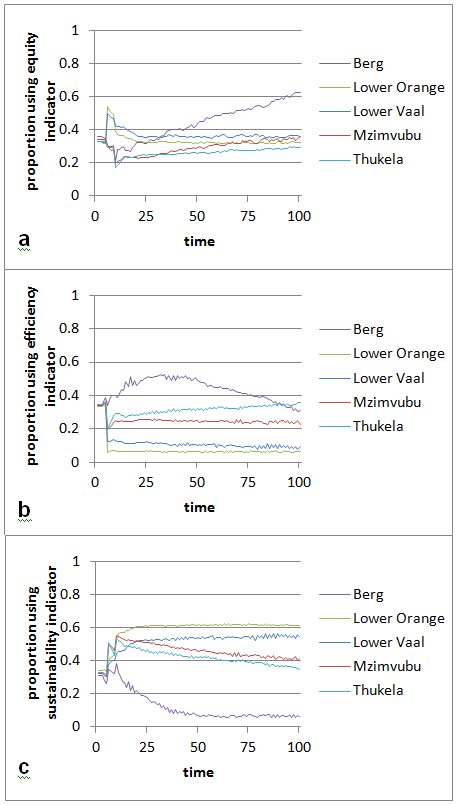
Figure 15. Proportion of agents in five WMAs who select: a) equity indicator, b) efficiency indicator and c) sustainability indicator.
Discussion
- 6.1
- These learning experiments investigated how 1) agents' selection of different indicators to evaluate their actions, and 2) different social-ecological conditions affect understanding of how and what to learn, willingness to learn, and capacity to learn.
Indicator selection
- 6.2
- The use of multiple indicators frees agents from using only collective learning to identify the most successful strategy, and allows them to better evaluate individual success in combination with the success of others. Furthermore, the ability to change indicators gives agents greater power to act on their evaluations. Nevertheless, the indicators and their use in the model are clearly simplistic. Naturally water users and managers employ numerous indicators to monitor the environment and evaluate their actions. In the model, agents can use three at most – and no agent can use all simultaneously. Furthermore, in reality, water users and managers usually have access to other information that is not incorporated into indicators but provides context for decision-making, over the longer term as well as from year to year. In addition, success in achieving one's goal must be measured in a way that is consistent with the broader management goals for the system.
Social-ecological conditions
- 6.3
- By comparing agent decisions at the WaterScape level with those made in five different WMAs, ways in which conditions such as hydrological variability, water stress, and size may affect learning in the model become evident. Among the clearest preferences for a particular strategy are those shown when agents can change indicators in the Thukela WMA, which has the lowest hydrological variability and where agent experience in a given year thus has a greater change of being relevant in the following year. Agents in highly variable environments, however, may be unable to benefit from their or others' experience in the previous year, because conditions change too rapidly and unpredictably for them to process and respond appropriately to the change. In the Lower Vaal and Lower Orange WMAs, which have the most variable runoff and highest water stress in the country, agents' strategy choice is less erratic when they can change their indicator than when they can only change their strategy based on the success of other agents in the previous year, which may be irrelevant. In this case, high variability may challenge agents' ability to detect patterns, as observed elsewhere in resource management systems (Wilson 2002). On the other hand, where agents have difficulty achieving success, they may have more incentive to keep trying to learn from their experimentation. Thus, variability may have mixed effects: it may negatively affect agent capacity to learn or decrease confidence in learning, but may increase willingness to learn and understanding of what learning is needed.
- 6.4
- In WMAs with lower water stress, agents are better able to stick with their current strategies, and have less 'incentive' to learn. In areas affected by higher water stress, by contrast, there is a greater need to try new strategies, a situation which may therefore increase willingness to learn (Anderies et al. 2006). In fact, agents in water-stressed areas have an advantage over those in more water-rich ones who are simply required by the model algorithm to 'pass the test' in order to continue using their existing strategies, though these may be sub-optimal. Water-stressed agents, by failing the success test, must try new strategies, and are more likely to locate optimal ones. However, high levels of variability and water stress tend to co-occur, amplifying the opportunity to learn but also a dilemma: agents are more likely to fail to meet a success threshold because of high stress but are also less likely to learn because variability makes learning difficult.
- 6.5
- Size—and a related issue, the range of spatial variation in an area—seems to play multiple roles. Divergence in strategy selection clearly occurs in the Berg WMA, with about 60% of agents choosing Efficiency First when they are able to evaluate their performance. In addition to being the smallest WMA in the country, the Berg, supporting the Cape Town area, is among the most transformed and urbanised. Somewhat paradoxically, the high transformation discourages agents from using the sustainability indicator. The high level of urbanisation enables a majority of agents to first use the efficiency indicator while water stress is lower and increasingly adopt the equity indicator, which the Efficiency First strategy serves best. Yet the small size of the Berg WMA may also restrict options for learning, so most options are identified quickly. Thus, the learning process may be more efficient than in larger or more spatially heterogeneous WMAs, but also draws on a more narrow range of experience.
- 6.6
- A variety of indicator-strategy combinations emerge. For variable, water-stressed WMAs, the sustainability indicator is favoured, but together with a combination of strategies. This suggests that a diversity of strategies is often most compatible with the objective of sustainability, particularly where water is less abundant. Where variability and water stress are low, a combination of the Some, for All, Forever strategy and the equity or efficiency indicator prevails, but this changes over time, presumably a result of the decreasing abundance of water relative to demand. The Berg WMA does not fit either profile: it begins favouring efficiency, briefly pursues sustainability, and lastly adopts the efficiency indicator. All three scenarios are roughly in equal use in the beginning of the simulation but Efficiency First ultimately takes over.
Overcoming dilemmas
- 6.7
- This modeling exercise offers a few insights for overcoming learning dilemmas to allow for more effective learning in future monitoring and management. First, to ensure that the three pillars of learning are upheld, the focus of learning and use of indicators sometimes needs to be tailored to specific environmental conditions. For example, in high-variability areas, management may benefit in particular from a better understanding of long term trends, dynamic interactions between fast and slow variables (Wilson 2002), and the extent to which maintaining a diversity of management options that can be readily adopted as conditions change has been a successful practice in the past (Tengö and Belfrage 2004). Monitoring must also consider the complex social conditions that attend learning about resource management in South Africa (Cundill 2010).
- 6.8
- The model results suggest that agents in water-stressed WMAs may have a greater incentive to learn, and be more active in formulating water allocation, conservation, and demand management strategies than water-rich WMAs. However, South African water legislation requires resources to be managed as a national asset, and the burden of water stress may shift to the more water-rich areas in the future as they absorb growing demands for water (DWAF 2004). Where water stress is high, learning may need to focus on efficiency of water use and demand management, as well as reallocation within and also between WMAs. Here there will be especially numerous opportunities to learn about the sensitivity to water stress of ecological parameters such as change in the ecological management class and the ecological reserve.
- 6.9
- The size and spatial heterogeneity of an agent's 'learning network' needs to be considered. Smaller or more homogeneous catchments may in fact be well suited to learning, where a high level of interaction between agents and quick building of trust are enabled (Dietz et al. 2003). On the other hand, Pollard and du Toit (2011) observed in their study of six South African catchments that learning may be constrained when confined to a local scale. Databases and exchanges to capture and share information and experiences between WMAs will be beneficial, as will social learning processes that contribute to learning within a common environment (Conte and Paolucci 2001; Stone-Jovicich et al. 2011). Learning should also be extended and broadened to encompass larger-scale problems and cross-comparison where similar challenges are experienced. Much can be learned from the Arctic, for example, where historical management systems that have obscured the role of local knowledge are moving towards co-management models (Armitage et al. 2011).
- 6.10
- Here, size and spatial heterogeneity were examined in terms of Water Management Areas, which are the most important unit of water management in South Africa going forward. Heterogeneity was expressed in terms of runoff; elsewhere research has addressed the question of heterogeneity in learning networks, for example, revealing the impact of networks on the diffusion of strategies (Poza et al. 2011) and emergence of the equity norm (Santos et al. 2012).
Limitations and further research
- 6.11
- This modeling approach depicts a simple and stylised version of South Africa's water sector, and several areas deserve further investigation in order to address questions raised by Galán et al. (2009) concerning agent-based models. First, the effect of changing agent perceptions should be explored. At present, the model is likely to portray some agents as unrealistically tolerant of risk. What would happen when agents can adapt their level of risk acceptance? In addition, agents in the real world are likely to have changing thresholds, in contrast to the assumption proposed by this model, for purposes of simplicity, that thresholds are static for the 100-year period. The thresholds themselves are also overly simplistic and a greater level of sophistication is needed to represent these in a modeling environment. Lastly, water managers are likely to use a mix of indicators. In the model, preference curves could be assigned to agents and weighting of indicators could reflect these preferences, and could change based on feedback. The rigidity of the current model is likely to underestimate water managers' adaptability. The parameterisation of these areas requires close collaboration with the water managers themselves, which was beyond the scope of this paper, but is identified as an important future research direction which could learn from the long tradition of companion modeling (Le Page et al. 2012).
Conclusion
- 7.1
- Learning processes in South African water management have much to gain from an agent-based modeling approach. First, the approach treats water management in the integrated social-ecological context that the subject demands, rather than treating human behaviour and water resources as distinct components. Second, implementation of the new water policy is in its early stages, creating uncertainties that cannot be explored in any way but through visions and models of the future (Pollard et al. 2007). A great advantage of agent-based models is that they do not intend to predict future outcomes but stimulate thinking and initiate dialogue, critical to addressing the challenges that are faced in this arena.
- 7.2
- Only a few of the many learning dilemmas that can arise in social-ecological systems are explored here, and many cannot be solved with modeling approaches alone but will demand attention in multi-stakeholder fora. Yet such models may soon play a role in informing water-related negotiations in South Africa, as several examples of smaller-scale studies indicate (Pollard et al. 2007;Farolfi et al. 2010). The greatest contributions to the current era of South African water management stand to be made from an improved understanding of precisely how and why alternative water use decisions achieve efficient, equitable, and sustainable outcomes or not. Greater consideration now needs to be given to the question of whether sufficient opportunities for learning are supported under the emerging institutional arrangements.
References
-
ADAMS, W.M., Brockington, D., Dyson, J., and Vira, B. (2003). Managing tragedies: understanding conflict over common pool resources. Science, 302, 1915–1916. [doi:10.1126/science.1087771]
ALCAMO, J., Henrichs, T., and Rösch, T. (2000). World Water in 2025: Global Modelling Scenarios for the World Commission on Water for the Twenty-first Century. World Water Series Report 2. Kassel: Center for Environmental Systems Research, University of Kassel.
ALCAMO, J., Döll, P., Henrichs, T., Kaspar, F., Lehner, B., Rösch, T. and Siebert, S. (2003). Global estimation of water withdrawals and availability under current and "business as usual" conditions. Hydrological Sciences, 48 (3): 339–348 [doi:10.1623/hysj.48.3.339.45278]
ALESSA, L., Kliskey A. and Williams, P. (2007). The distancing effect of modernization on the perception of water resources in Arctic communities. Polar Geography, 30(3–4): 175–191 [doi:10.1080/10889370701742761]
ALESSA, L., Kliskey A. and Williams, P. (2010). Forgetting freshwater: technology, values, and distancing in remote Arctic communities. Society & Natural Resources: An International Journal, 23(3): 254–268. [doi:10.1080/08941920802454813]
ANDERIES, J. M., Walker, B. H., and Kinzig, A. P. (2006). Fifteen weddings and a funeral: case studies and resilience-based management. Ecology and Society, 11 (1): 21. http://www.ecologyandsociety.org/vol11/iss1/art21/
ARMITAGE, D., Berkes, F., Dale, A., Kocho-Schellenberg, E. and E. Patton. 2011. Co-management and the co-production of knowledge: Learning to adapt in Canada's Arctic. Global Environmental Change, 21: 995–1004. [doi:10.1016/j.gloenvcha.2011.04.006]
ARMITAGE, D.R., Plummer, R,. Berkes, F., Arthur, R.I., Charles, A.T. et al. (2009). Adaptive co-management for social– ecological complexity. Frontiers in Ecology and Environment, 7: 95–102. [doi:10.1890/070089]
BERKES, F. and Folke, C. (1998). Linking Social and Ecological Systems: Management Practices and Social Mechanisms for Building Resilience. Cambridge: Cambridge University Press.
BERKES, F., Colding, J. and Folke, C. (Eds.). (2003). Navigating Social-Ecological Systems: Building Resilience for Complexity and Change. Cambridge: Cambridge University Press.
BIGGS, R. and Scholes, R.J. (2002). Land-cover changes in South Africa 1911-1993. South African Journal of Science, 98: 420–424.
BIGGS, R., Carpenter, S. and Brock, W. (2009). Turning back from the brink: Detecting an impending regime shift in time to avert it. Proccedings of the National Academy of Sciences USA, 106: 826–831. [doi:10.1073/pnas.0811729106]
BOUSQUET, F., Bakam, I., Proton, H. and Le Page, C. (1998). Cormas: common-pool resources and multi-agent systems. Lecture Notes in Artificial Intelligence, 1416: 826–838. [doi:10.1007/3-540-64574-8_469]
BOUSQUET, F. and Le Page, C. (2004). Multi-agent simulations and ecosystem management: a review. Ecological Modelling, 176: 313–332. [doi:10.1016/j.ecolmodel.2004.01.011]
CARPENTER, S.C., Brock, W.A., and Ludwig, D. (2002). Collapse, learning, and renewal. In L. H. Gunderson and C.S. Holling (Eds.), Panarchy: Understanding Transformations in Human and Natural Systems (pp. 173–193). Washington, D.C.: Island Press.
COLVIN, J., Ballim, F., Chimbuya, S., Everard, M., Goss, J., Klarenberg, G., Ndlovu, & Weston, D. (2008). Building capacity for co-operative governance as a basis for integrated water resource managing in the Inkomati and Mvoti catchments, South Africa. Water SA, 34(6): 681–689 http://www.wrc.org.za
CONTE, R. and Paolucci. M. (2001). Intelligent social learning. Journal of Artificial Societies and Social Simulation, 4(1) https://www.jasss.org/4/1/3.html
COSGROVE, W. and Rijsberman, F. (2000). World Water Vision: Making Water Everybody's Business. London: World Water Council, Earthscan Publications.
CUNDILL, G. (2010). Monitoring social learning processes in adaptive comanagement: three case studies from South Africa. Ecology and Society 15(3), 28. http://www.ecologyandsociety.org/vol15/iss3/art28/
DENT, M.C. (2000). Strategic issues in modelling for integrated water resource management in Southern Africa. Water SA, 26(4): 513–519 http://www.wrc.co.za
DENT, M.C. (2001). Installed water resource modelling systems for catchment management agencies. Water SA, 27(3): 333–340 http://www.wrc.co.za [doi:10.4314/wsa.v27i3.4976]
DIETZ, T., Ostrom, E. and Stern, P.C. (2003). The struggle to govern the commons. Science, 302, 1907–1912. [doi:10.1126/science.1091015]
DU TOIT, D. R., Biggs, H., and Pollard, S. (2011). The potential role of mental model methodologies in multi-stakeholder negotiations: integrated water resources management in South Africa. Ecology and Society, 16(3), 21 [doi:10.5751/ES-04237-160321]
DWAF (Department of Water Affairs and Forestry), (1999). Resource Directed Measures for Protection of Water Resources. Volume 3: River Ecosystems Version 1.0. Pretoria: DWAF.
DWAF (Department of Water Affairs and Forestry), 2004. First Edition of the National Water Resources Strategy. Pretoria: DWAF http://www.dwaf.gov.za/
EBERHARDT, R., and Pegram, G. (2002). The water sector. In M. Goldblatt et al. (Eds.), WWF, DBSA, GTZ Synthesis Report of South African Study on Water, Energy and Sustainable Development. Midrand, South Africa: DBSA.
EPSTEIN, J. and Axtell, R. (1996). Growing Artificial Societies: Social Science from the Bottom-Up. Washington, D.C.: MIT Press, Brookings Inst. Press.
FAROLFI, S., Müller, J., and Bonté, B. (2010). An iterative construction of multi-agent models to represent water supply and demand dynamics at the catchment level. Environmental Modelling & Software, 25, 1130–1148. [doi:10.1016/j.envsoft.2010.03.018]
FAZEY, I., Fazey, J.A., and Fazey, D.M.A. (2005). Learning more effectively from experience. Ecology and Society, 10(2), 4 http://www.ecologyandsociety.org/vol10/iss2/art4/
FERNANDEZ-GIMENEZ, M. E., Ballard, H. L., and Sturtevant, V. E. (2008). Adaptive management and social learning in collaborative and community-based monitoring: a study of five community-based forestry organizations in the western USA. Ecology and Society, 13 (2), 4 http://www.ecologyandsociety.org/vol13/iss2/art4/
GALÁN, J.M., López-Paredes, A. and del Olmo, R. (2009). An agent-based model for domestic water management in Valladolid metropolitan area, Water Resources Research, 45, W05401. doi:10.1029/2007WR006536. [doi:10.1029/2007WR006536]
GALÁN J.M., Luis R. Izquierdo, Segismundo S. Izquierdo, José Ignacio Santos, Ricardo del Olmo, Adolfo López-Paredes and Bruce Edmonds (2009). Errors and Artefacts in Agent-Based Modelling. Journal of Artificial Societies and Social Simulation 12 (1),1. https://www.jasss.org/12/1/1.html
GALLOPÍN, G., C. (2002). Planning for resilience: scenarios, surprises and branch points. In L. H. Gunderson and C.S. Holling (Eds.), Panarchy: Understanding Transformations in Human and Natural Systems (pp. 361-392). Washington D.C.: Island Press.
GARCÍA-BARRIOS, L.E., Speelman, E.N., Pimm, M.S. (2008). An educational simulation tool for negotiating sustainable natural resource management strategies among stakeholders with conflicting interests. Ecological Modelling, 210, 115–126. [doi:10.1016/j.ecolmodel.2007.07.009]
GUNDERSON, L. H., Holling, C. S., and Light, S. S. (Eds.). (1995). Barriers and Bridges to the Renewal of Ecosystems and Institutions. New York: Columbia University Press.
HOLLING, C.S. and Meffe, G.K. (1996). Command and control and the pathology of natural resource management. Conservation Biology, 10, 328-337. [doi:10.1046/j.1523-1739.1996.10020328.x]
HUGHES, D.A. and Hannart, P. (2003). A desktop model used to provide an initial estimate of the ecological instream flow requirements of rivers in South Africa. Journal of Hydrology, 270, 167-181. [doi:10.1016/S0022-1694(02)00290-1]
HUGHES, F.M.R., Colston, A. and Mountford, J.O. (2005). Restoring riparian ecosystems: the challenge of accommodating variability and designing restoration trajectories. Ecology and Society, 10(1), 12 http://www.ecologyandsociety.org/vol10/iss1/art12/
IZQUIERDO, S.S., Izquierdo, L.R. and Gotts, N.M. (2008). Reinforcement learning dynamics in social dilemmas. Journal of Artificial Societies and Social Simulation, 11(2), 1 https://www.jasss.org/11/2/1.html
JANSSEN, M. A. and de Vries, B. (1998). The battle of perspectives: A multi-agent model with adaptive responses to climate change. Ecological Economics, 26, 43–65. [doi:10.1016/S0921-8009(97)00062-1]
KING, J. and C. Brown. (2006). Environmental flows: striking the balance between development and resource protection. Ecology and Society 11(2): 26. [online] http://www.ecologyandsociety.org/vol11/iss2/art26/
KLEYNHANS, C.J. (2000). Desktop Estimates of the Ecological Importance and Sensitivity Categories (EISC), Default Ecological Management Classes (DEMC), Present Ecological Status Categories (PESC), Present Attainable Ecological Management Classes (Present AEMC), and Best Attainable Ecological Management Class (Best AEMC) for Quaternary Catchments in South Africa. DWAF report. Pretoria: Institute for Water Quality Studies.
KUNZ, J. (2011). Group-level exploration and exploitation: a computer simulation-based analysis. Journal of Artificial Societies and Social Simulation, 14(4),18 https://www.jasss.org/14/4/18.html
LE PAGE, C., Becu, N., Bommel, P. and Bousquet, F. (2012). Participatory agent-based simulation for renewable resource management: the role of the Cormas Simulation Platform to nurture a community of practice. Journal of Artificial Societies and Social Simulation, 15(1), 10 https://www.jasss.org/15/1/10.html
MACKAY, H. (2003). Water policies and practices. In D.Reed and M.de Wit, (Eds.), Towards a Just South Africa: The Political Economy of Natural Resource Wealth (pp. 49-83). Washington D.C. and Pretoria: WWF Macroeconomics Programme Office and Council for Scientific and Industrial Research.
MACKAY, H.M., Rogers, K.H. and Roux, D.J. (2003). Implementing the South African water policy: holding the vision while exploring an uncharted mountain. Water SA, 29(4), 353–358.
NEL, J., Maree, G., Roux, D., Moolman, J., Kleynhans, N., Silberbauer, M. and Driver, A. (2004). South African National Spatial Biodiversity Assessment 2004: Technical Report. Volume 2: River Component. CSIR Report Number ENV-S-I-2004-063. Stellenbosch: Council for Scientific and Industrial Research.
PAHL-WOSTL, C., Sendzimir, J., Jeffrey, P., Aerts, J., Berkamp, G. and Cross, K. (2007). Managing change toward adaptive water management through social learning. Ecology and Society, 12(2), 30 http://www.ecologyandsociety.org/vol12/iss2/art30/
PALMER, C.G., Berold, R.S. and Muller, W.J. (2004). Environmental water quality in water resources management. WRC Report No TT 217/04. Pretoria: Water Research Commission.
POLLARD, S. and du Toit, D. (2008). Integrated water resource management in complex systems: How the catchment management strategies seek to achieve sustainability and equity in water resources in South Africa. Water SA, 34(6), 671–679 http://www.wrc.org.za
POLLARD, S. Perret, S., Kotze, D., Lorentz, S., Ridell, E. and Ellery, F. (2007). Investigating interactions between biophysical functioning, usage patterns, and livelihoods in a wetland agro-ecosystem of the Sand River Catchment through dynamic modeling. A component of the wetlands health and livelihood security project of the Save the Sand Programme. Acornhoek: AWARD http://www.award.org.za/file_uploads/File/final%20Stella%20Craigieburn%20Pollard%20perret%20et%20al%20Sept%2007l%20WEB.pdf
POLLARD, S. and du Toit, D. (2011). Towards adaptive integrated water resources
management in Southern Africa: The role of self-organisation and multi-scale feedbacks for learning and responsiveness in the Letaba and Crocodile Catchments. Water Resource Management, 25, 4019–4035. [doi:10.1007/s11269-011-9904-0]
POWER, C. (2009) A spatial agent-based model of N-person prisoner's dilemma cooperation in a socio-geographic community. Journal of Artificial Societies and Social Simulation, 12(1), 8 https://www.jasss.org/12/1/8.html
POZA, D.J., Santos J.I., Galán J.M., López-Paredes, A. (2011) Mesoscopic Effects in an Agent-Based Bargaining Model in Regular Lattices. PLoS ONE 6(3): e17661. doi:10.1371/journal.pone.0017661 [doi:10.1371/journal.pone.0017661]
PRITCHARD, L. and Sanderson, S.E. (2002). The dynamics of political discourse in seeking sustainability. In L. Gunderson and C. S. Holling (Eds.), Panarchy: Understanding Transformations in Human and Natural Systems (pp. 147-169). Washington D.C.: Island Press.
RODELA, R. (2011). Social learning and natural resource management: the emergence of three research perspectives. Ecology and Society, 16(4), 30. [doi:10.5751/ES-04554-160430]
ROGERS, K., Roux, D., and Biggs, H. (2000) Challenges for catchment management agencies: lessons from bureaucracies, business and resource management. Water SA, 26, 505–511.
ROUX, D.J. and Foxcroft, L.C. (2011) The development and application of strategic adaptive management within South African National Parks, Koedoe 53(2), Art. #1049, 5 pages.
SALAFSKY, N., Cauley, H., Balachander, G., Cordes, B., Parks, J., Margoluis, C. and R. Margoluis. (2001). A systematic test of an enterprise strategy for community-based biodiversity conservation. Conservation Biology, 15, 1585–1595. [doi:10.1046/j.1523-1739.2001.00220.x]
SANTOS, J., Poza, D.J., Galán, J.M., and López-Paredes, A. (2012). Evolution of Equity Norms in Small-World Networks. Discrete Dynamics in Nature and Society, vol. 2012, Article ID 482481, 18 pages, 2012. doi:10.1155/2012/482481 [doi:10.1155/2012/482481]
SCHLüTER, M., and Pahl-Wostl, C. (2007). Mechanisms of resilience in common-pool resource management systems: an agent-based model of water use in a river basin. Ecology and Society, 12(2), 4 http://www.ecologyandsociety.org/vol12/iss2/art4/
SCHLÜTER, M., McAllister, R. R. J., Arlinghaus, R., Bunnefeld, N., Eisenack, K., Hölker, F., … & Stöven, M. (2012). New horizons for managing the environment: a review of coupled social-ecological systems modeling. Natural Resource Modelling, 25(1), 219. [doi:10.1111/j.1939-7445.2011.00108.x]
SCHULTZ, CB and Watson MD. (2002). Water Situation Assessment Model – A Decision Support System for Reconnaissance Level Planning, Volume 1 – Theoretical Guide, Version 3. December 2002. Interim draft report No. RSA/00/0900 compiled by Arcus Gibb and others for the Department of Water Affairs and Forestry, Directorate: Strategic Planning, Pretoria, South Africa.
SCHULZE, R.E. (2005). Climate Change and Water Resources in Southern Africa. WRC Report Number 1430/1/05. Pretoria: Water Research Commission.
SECKLER, D., Amarasinghe, U., Molden, D., de Silva, R., and Barker, R. (1998). World Water Demand and Supply, 1990 to 2025: Scenarios and Issues. Research Report No. 19. Colombo: International Water Management Institute (IWMI).
SEN, A.K., (1999). Development as Freedom. Oxford: Oxford University Press.
SMITH, A., and A. Stirling. (2010). The politics of social-ecological resilience and sustainable socio-technical transitions. Ecology and Society 15(1): 11. [online] http://www.ecologyandsociety.org/vol15/iss1/art11/
SOBOLL, A., Elbers, M., Barthel, R., Schmude, J., Ernst, A. and Ziller, R. (2010). Integrated regional modelling and scenario development to evaluate future water demand under global change conditions, Mitigation and Adaptation Strategies for Global Change, 16 (4), 477–498. [doi:10.1007/s11027-010-9274-6]
STONE-JOVICICH, S., T. Lynam, A. Leitch, and N. A. Jones. (2011). Using Consensus Analysis to Assess Mental Models about Water Use and Management in the Crocodile River Catchment, South Africa. Ecology and Society 16(1): 45. [online] http://www.ecologyandsociety.org/vol16/iss1/art45/
TENGÖ, M. and Belfrage, K. (2004). Local management practices for dealing with change and uncertainty: a cross-scale comparison of cases in Sweden and Tanzania. Ecology and Society, 9(3), 4. http://www.ecologyandsociety.org/vol9/iss3/art4
TURTON, A.R. and Meissner, R. (2002). The hydrosocial contract and its manifestation in society: A South African case study. In A. R. Turton and R. Henwood, (Eds.), Hydropolitics in the Developing World: A Southern African Perspective (pp. 37–60). Pretoria: African Water Issues Research Unit.
VAN DER LEEUW, S., Costanza, R., Aulenbach, S., Brewer, S., Burek, M., Cornell, S., Crumley, C., & W. Steffen. (2011). Toward an integrated history to guide the future. Ecology and Society, 16 (4): 2. [doi:10.5751/ES-04341-160402]
VAN WYK, E., van Wilgen, B.W., and Roux, D.J. (2001). How well has biophysical research served the needs of water resource management? Lessons from the Sabie-Sand. South African Journal of Science, 97, 349–356.
VÖRÖSMARTY, C.J., Green, P., Salisbury, J., and Lammers, R.B. (2000). Global water resources: vulnerability from climate change and population growth. Science, 289, 284–288. [doi:10.1126/science.289.5477.284]
WILSON, J. (2002). Scientific uncertainty, complex systems, and the design of common-pool institutions. In E. Ostrom, T. Dietz, N. Dolšak, P.C. Stern, S. Stovich, and E.U. Weber (Eds.), The Drama of the Commons. Committee on the Human Dimensions of Global Change, National Research Council (pp. 327–360).Washington, D.C.: National Academy Press.