
 Abstract
- An agent-based simulation model (ABM) is developed and implemented using Python to explore the emergence of intragenerational and intergenerational skill inequality at the societal level that results from differences in parental investment behavior at the household level during early stages of the life course. Parental behavior is modeled as optimal, heuristic-based, or norm-oriented. Skills grow according to the technology of skill formation developed in the field of economics, calibrated with empirically estimated parameters from existing research. Agents go through a simplified life course. During childhood and adolescence, skills are produced through parental investments. In adulthood, individuals find a partner, give birth to the next generation, and invest in offspring. Number and spacing of children and available resources are treated as exogenous factors and are varied experimentally. Simulation experiments suggest that parental decisions at the household level play a role in the emergence of inequality at the societal level. Being egalitarian or not is the most important distinction in parental investment behavior, while optimizing parents generate similar results as egalitarian parents. Furthermore, there is a tradeoff between equality at home and inequality at the macro-level. Changes in the environment reduce or exacerbate inequality depending on parental investment behavior. One prediction of the model on intragenerational inequality in cognitive skills was validated with the use of empirical data. The simulation can best be described as a middle-range model, informed by research on skill formation and the intrahousehold allocation of resources. It is a first step toward more complex ABMs on inequality from a life course perspective. Possible model extensions are suggested. The Overview, Design Concepts, and Details (ODD) protocol and Design of Experiments (DOE) were used to document the model and set up the experimental design respectively.
- Keywords:
- Skill Formation, Parental Investments, Inequality in the Life Course, Intrahousehold Allocation of Resources, Agent Behavior
Introduction
- 1.1
- Two central questions in the study of social inequality and the life span have caught the attention of scholars for decades: Why do some individuals become more successful than others as they grow up? And why does economic and social success tend to persist across generations? Social scientists now recognize that the intricacies of skill formation constitute an important piece of the puzzle. Cognitive abilities, including but not limited to those measured by IQ tests, as well as socio-emotional capacities such as achievement-striving, perseverance, assertiveness, curiosity, ambition, delay of gratification, and sociability, have been shown both to predict individual disparities in education, earnings, health, well-being, and deviant behavior (Heckman and Kautz 2012; Roberts et al. 2007) and to be crucial in the transmission of advantage from one generation to the next (Ermisch et al. 2012).
- 1.2
- Multidisciplinary research on skill formation has revealed the cumulative character of skill growth during a person's life span, pointing to the pivotal character and indelibility of parental investments in shaping children's skills starting early in life (Knudsen et al. 2006 and the references cited therein). The extent of parental material and time resources a child enjoys depends both on the amount of resources commanded by their parents and on parental discretion in allocating them within the family (Behrman 1997; Conley 2005). As a result, in order to explain differences in individual skills, parental allocation choices may be as important as the amount of parental resources available to allocate.
- 1.3
- This study uses agent-based modeling (ABM) to explore what happens to inequality in cognitive and socio-emotional skills within and across generations if parents differ in their investment behavior. Traditionally, models of parental investments have been dominated by depictions from biology and economics of individuals as optimizers. In evolutionary biology, parents invest in their offspring to maximize reproductive success (Hamilton 1964a, 1964b; Trivers 1972), while in economics, parents maximize household utility, which is a function of children's achieved levels of wealth, income, or human capital (Becker & Tomes 1986; Behrman et al. 1982; for a review, see Björklund & Jäntti 2009: 493–95). Despite the dominance of these assumptions about parental behavior, or perhaps precisely as a consequence of it, models that compare alternative parental investment strategies among humans and their impact on children's outcomes, such as the simulation study by Davis et al. (1999) on alternative feeding strategies among birds, have not yet been devised. ABM offers a natural modeling strategy to represent heterogeneous agents and to inquire into the macro-consequences of agent behavior under changing environmental conditions. With the use of ABM, it is thus possible to go beyond optimizing parents and compare optimizing with non-optimizing behavior. In addition, it is possible to explore how variations in resources available to households, as well as number and spacing of children, affect the unequal distribution of skills in society over time.
- 1.4
- This study offers two main contributions. First, it shows how parental investment behavior serves as a transformational mechanism (Hedström & Ylikosky 2010), linking parental allocation decisions at the micro-level of the household to the emergence of skill inequality at the societal level. Second, the model takes a first step toward bringing together ABM and social inequality research from a life course perspective (Mayer 2009), which has not yet been done (Meyer et al. 2009; Squazzoni & Casnici 2013). To be sure, ABM has already been used to make sense of inequalities in various contexts, including crime (e.g., Makowsky 2006), health (e.g., Auchincloss et al. 2011), labor markets (e.g., Dawid & Gemkow 2013), gender (e.g., Robison-Cox et al. 2007), and particularly place of residence, as the ever-growing collection of segregation models inspired by Schelling (1971) attest. Yet there is still much room for developing agent-based models that explore the emergence and persistence of social disparities in education, income, wealth, health, fertility, and deviant behavior along the lines of gender, ethnicity, age, and class by modeling individual lives and decision-making processes over time in the context of households, neighborhoods, social networks, and labor markets. If further elaborated and calibrated for particular societies, agent-based models of social inequality and the life course could be used effectively as virtual laboratories to generate testable hypotheses, guide data collection, and eventually assist in decisions regarding family, education, and health policy. This is particularly relevant given the restrictions known to affect nationally representative longitudinal data on individuals and households, such as attrition, high administrative costs, and the slow pace of accumulating data.
- 1.5
- The article is structured as follows: The next section makes the case for parental investment behavior beyond optimizing agents. Section 3 describes the model using the Overview, Design Concepts, and Details (ODD) protocol (Grimm et al. 2006, 2010). Section 4 explains the experimental design based on the Design of Experiments (DOE) (Lorscheid et al. 2012). The results of the experiments and an empirical validation of one prediction of the model are presented in Sections 5 and 6 respectively. The concluding section offers an outlook for future extensions of the model. In documenting the simulation, an effort was made to comply with best practices. Therefore, in addition to the ODD and the DOE, the full code of the simulation in Python is provided; it is available at: http://www.openabm.org/model/4084/version/1/view.
Beyond optimizing parents: heuristics and norms
- 2.1
- There are at least two good reasons not to limit the modeling of parental investments to optimizing agents. First, the assumption that parents are perfect optimizers ignores the extensively documented computational and informational limitations faced by individuals in solving real-world tasks (Kahneman 2011). There is no reason to believe that the same internal and environmental constraints that make Homo economicus an unlikely model of decision making in general are not equally limiting in the demanding task of optimizing parental investments. Finding the optimal investment profile that maximizes children's skills would require that parents have perfect information about the child's endowments; know the exact functional form of skill formation; and are capable of allocating, in real time, just the right amount of nourishment, toys, emotional support, cognitive stimulation, and other parental inputs that will produce the best possible outcome in all their offspring many years into the future. Since this kind of optimization is most likely intractable for individuals, and perhaps even burdensome for less powerful computers, parents may instead default to simple heuristics or rules of thumb in the allocation of resources (Gigerenzer 2004), which, although not necessarily less effective in bringing them closer to their goal of promoting children's skills, are computationally less costly. Second, declaring that all parents behave as output maximizers ignores agent heterogeneity in motives and goals. Culturally dictated norms regarding the relative importance of children within the family, in particular those related to gender and birth order, constitute an alternative framework that regulates parental resource allocation among siblings.
- 2.2
- In the following, heuristics and norms that shape parental investments are briefly discussed. The exact operationalization of these alternative forms of parental behavior are explained in the model description below (see Submodels, Parental investment behavior).
Heuristics
- 2.3
- According to Gigerenzer (2004), a complete model of a heuristic consists of three elements: first, the exact rules that guide decision making; second, the individual capacities they exploit; and third, the type of problem they are supposed to solve (p. 67). For parental investments two candidate heuristics can be found in the literature on the intrahousehold allocation of resources: a) equality and b) reinforcing or compensation.
- 2.4
- Allocation rules. For an egalitarian distribution, the allocation rule is very simple: divide total resources equally among children (Hertwig et al. 2002). Research on the so-called dilution hypothesis, which poses a negative relationship between sibship size and amount of resources available to siblings, provides indirect empirical support for the equality heuristic (Blake 1989; Baydar et al. 1997; Stewart 2005). As an alternative rule to equality, a growing body of empirical research supports both the existence of compensatory (Del Bono et al. 2012) and reinforcing investment strategies (Datar et al. 2010) triggered by children's initial endowments. When parents reinforce (compensate) they give more than the equal share of resources to children with high (low) endowments relative to their siblings.
- 2.5
- Individual capacities. At a minimum, parents should be able to divide inputs. This is a plausible assumption for goods, services, and time devoted to children. Other inputs such as affection might prove to be more difficult to ration. In addition, allocating inputs requires that parents keep track of past resources given to children and adapt present distribution accordingly. Finally, to follow compensating or reinforcing strategies, parents must be in a position both to observe children's strengths and weaknesses and to draw comparisons between them in order to reallocate resources. Thus, divisibility of inputs, memory of past allocation, and perception of children's differences are required to put these two heuristics into practice.
- 2.6
- Type of problem. The third element of the heuristic model is more difficult to pinpoint, since research on parental investment behavior in humans from a heuristic perspective is scant. The explanation advanced here is therefore sketchy and should be updated when more research on the subject becomes available. According to Gigerenzer and Gaissmaier (2011), an egalitarian distribution of resources is an instance of a "tradeoff" heuristic, where individuals weigh alternatives equally, a "1/N Rule" (2011, pp. 470f. and the references cited there). In the context of parental investments, Hertwig, Davis, and Sullaway (2002) argued that an egalitarian distribution should be observed among parents who command enough resources and can afford not having to decide which of their offspring to nourish preferentially. This, however, is a prediction about the environmental conditions under which such a heuristic is likely to be observed in parental investment behavior and not an explanation of the problem the heuristic is supposed to solve. In general terms, the problem faced by parents can be formulated as allocation of resources under uncertainty regarding both observed child endowments and expected returns on investment. Davis and Todd (2001) suggest that for equal expected returns an egalitarian distribution should yield the highest outcomes from parental inputs. However, it is also plausible that equality is less a response to equal expected returns and more an adaptation to unknown returns. In the domain of financial decisions, equal allocation of assets among alternative investments, or "naïve diversification," has been demonstrated to yield surprisingly positive results compared with more complicated allocation strategies (DeMiguel et al. 2007). Thus, with noisy expected returns on investments, parents may default to an egalitarian distribution as a way to reduce the volatility of child outcomes.
- 2.7
- A similar argument can be advanced to explain the heuristic of reinforcement or compensation. According to the taxonomy found in Gigerenzer and Gaissmaier (2011), this heuristic can be classified as a "one-clever-cue" heuristic, a form of "one-reason"-type heuristic. Instead of weighing cues equally, as with the egalitarian heuristics (i.e., number of children), individuals look for a "good" cue among known alternatives and choose one based on that standard. If parents face uncertainty about returns but somehow observe child endowments at birth, this additional information might be interpreted as a cue for expected returns on investments that can be used to adjust allocation decisions. Highly endowed children promise high returns, hence reinforcement as a way to secure higher payoffs; low-endowed children, by contrast, threaten to produce low returns, hence compensation as a way to reduce losses. In both cases the cue that activates the heuristic is the child's endowments and the problem the heuristic solves is return volatility.
- 2.8
- Which of these two strategies is followed by parents—equality or compensation/reinforcement—may depend on the environment they face (Todd & Gigerenzer 2007). As argued by Conley (2005), families with fewer resources may tend to prioritize parental investments toward better-endowed children. The rationale behind reinforcement is summarized by Conley as the desire of low-class parents to maximize upward mobility. By the same token, if middle-class and high-class parents aim to avoid downward mobility, as Goldthorpe (2000) argues, then compensation for less-endowed children or equality could be the ecologically rational strategy. To some extent these arguments are compatible with the hypothesis of Trivers and Willard (1973) that parents always follow a gender-specific reinforcing strategy, changing parental investment behavior depending on available resources, but always in such a way that the most promising gender in terms of expected reproductive success is favored.[1] Such a relationship between resource scarcity/reinforcing strategies and resource abundance/compensation has been observed in birds and shown through simulation to produce high payoffs in terms of offspring fitness (Davis & Todd 2001).
- 2.9
- In the case of equality, an additional environmental triggering factor could be the difficulty in observing differences in endowments among children. If parents are unable to extract meaningful cues about the potential of their offspring, the less risky guess in the allocation of resources is to distribute them equally among siblings. Furthermore, even if parents choose a compensating or reinforcing strategy, an equality heuristic can still be used as an anchor (Messick 1993), a benchmark to help them decide how much of their resources should be devoted to one particular child.
Norms
- 2.10
- Norms about gender and birth order, such as those manifested in the millennia-old traditions of primogeniture and son privilege, are the two most prominent allocation rules likely to affect parental investment behavior across societies. In the case of gender, parental bias can be as moderate as spending more time with same-sex children (Lundberg 2005) or as extreme as selective abortion and even infanticide (Sen 1992, 2003). Thus, even if only for outliers, the bias in the allocation of resources can in practice approach a maximum of zero investments in particular children. In contrast to gender, research on birth order norms suggests that investment bias along this dimension tends to be much more moderate, taking the form of favoritism rather than outright neglect. Empirical studies on parental favoritism offer mixed results as to which child receives more parental attention. Although there is evidence of both last-born and first-born bias, what seems to be a consistent result is that middle children are seldom favored (Suitor et al. 2008).
- 2.11
- It is important to note the apparent overlap of norm-oriented behavior with heuristic-based and optimizing behavior. Norm-oriented agents follow rules of thumb to guide their investment decisions in a way that, on the surface, appears to be similar to heuristic-following agents. Yet, in contrast to heuristics, norms are not means to an end but ends in themselves. The goal of norm-oriented behavior is to comply with the norm rather than to achieve an ulterior goal by using the norm as an instrument, as in the case of heuristics. In practice, it is true, by merely observing parental behavior it is not always possible to decide whether norms or heuristics are guiding decision making. For example, parents who abide by an equality norm may appear to an observer as behaving exactly the same way as parents who follow an equality heuristic, although the underlying decision mode is different.[2] Furthermore, favoritism based on gender or birth order may result when parents adapt to environmentally dictated expected payoffs of parental investments, and hence may to some extent be compatible with optimizing behavior (see Lundberg 2005; Ejrnæs & Pörtner 2004 for an economic perspective; Trivers & Willard 1973; Sulloway 1996 for a biological perspective). However, norms change only gradually and persist even after environmental conditions have shifted (see, e.g., Almond et al. 2013), so normative pressure may still influence action even if the payoffs seen from the perspective of a rational agent are no longer present. Finally, both gender and birth order bias can be explained without resorting to norms; for example, first-born and gender favoritism may result from a reinforcing heuristic strategy, where parents use age (Davis and Todd 2001, p. 311) and gender (Trivers and Willard 1973) as cues for expected payoffs and invest accordingly.
- 2.12
- In short, heuristics and norms are alternative and separate forms of action that parents may follow when allocating resources among children, even if empirically they are not always clearly distinguishable from each other and may to some extent be compatible with optimizing behavior. As summarized in Table 1, parental investment strategies vary according to agents' goals, available information, and computational capabilities.
Table 1: A comparison of parental investment behavior Optimizing Heuristics Norms Investment strategy Optimize children's skill levels Rules of thumb based on observed initial skill endowments
- Equality
- Reinforcement and
compensationRules of thumb based on social norms
- Son preference
- First-born favoritism
- Last-born favoritismGoal Maximize expected sum of children's skills Achieve the highest possible sum of children's skills (reduce return volatility) Conform to norms Information Complete
- Children's skill endowments.
- Technology of skill formationIncomplete
- Children's skill endowmentsMinimal
- Children's gender and birth orderComputational
capabilitiesHigh Limited Minimal
Description of Model Using the ODD Protocol
-
Purpose
- 3.1
- The model explores the emergence of inequality in cognitive and socio-emotional skills at the societal level within and across generations that results from differences in parental investment behavior at the household level during childhood and adolescence. Parents behave alternatively as optimizers, heuristic-based, or norm-oriented. The simulation is a middle-range model informed by stylized facts from research on skill formation and the intrahousehold allocation of resources. It is intended to produce testable hypotheses about parental decisions and overall skill inequality in society. Since the main focus is on parental investment decisions, other processes, including skill homophily in partner search, fertility decisions (number and spacing of children), and the amount of resources available to parents, are treated as exogenous factors that are varied experimentally.
Entities, state variables, and scales
- 3.2
- The only scale in the model is time (t). One time unit equals 2 years, derived from the biennial empirical estimates used to calibrate the technology of skill formation (see Submodels below). Two entities are modeled: persons (or individuals) and parents (or households). Individual state variables can be classified into four groups: demographics, partner matching, life-course events, and skill formation. Households combine mothers and fathers into one agent with state variables related to fertility and parental investments. Endogenous variables are identified with an "[e]" and exogenous variables with an "[x]." The most central endogenous variables in the model are the current skill stocks of each individual and the amount of parental resources invested by households in each child.
Table 2: Individual state variables State Variable Description ind_id, hh_id, hh_id_parents, gen_id [x] Numerical identifications (Ids) were assigned to each individual to facilitate keeping track of skill dependencies within families and across generations. ind_id is unique; hh_id identifies current household; hh_id_parents is shared by siblings and refers back one generation; and gen_id is equal for all agents belonging to the same generation. Demographics age_ind [e] Age of individual in number of years sex [x] Female (1), male (2) birth_order [e] First-born, second-born, etc. [1, 2…] Partner matching homophily_skills_partner [x] Preference for a partner with similar skill level [0, 1] Life-course events (see Figure 1 below) age_end_childhood [x] Age of last year of childhood (A in Figure 1) age_end_adolescence [x] Age of last year of adolescence (B in Figure 1) Skill formation (see Submodels, Eq. 3) initial_cog_skills [e]
initial_soc_emo_skills [e]
initial_avg_skills [e]Initial skill endowments of cognitive and socio-emotional skills (0,1) current_cog_skills [e]
current_soc_emo_skills [e]Stocks of cognitive and socio-emotional skills (0,1) productivity_cog_child_cog [x]
productivity_cog_child_soc_emo [x]
productivity_cog_adolesc_cog [x]
productivity_cog_adolesc_soc_emo [x]Effect of past cognitive skill stocks on present child and adolescent skill growth (0,1] productivity_soc_emo_child_cog [x]
productivity_soc_emo_child_soc_emo [x]
productivity_soc_emo_adolesc_cog [x]
productivity_soc_emo_adolesc_soc_emo [x]Effect of past socio-emotional skill stocks on present child and adolescent skill growth (0,1] parental_inv_productivity_child_cog [x]
parental_inv_productivity_child_soc_emo [x]
parental_inv_productivity_adolesc_cog [x]
parental_inv_productivity_adolesc_soc_emo [x]Effect of parental investments on child and adolescent skills (0,1] parental_cog_child_cog [x]
parental_cog_child_soc_emo [x]
parental_soc_emo_child_cog [x]
parental_soc_emo_child_soc_emo [x]
parental_cog_adolesc_cog [x]
parental_cog_adolesc_soc_emo [x]
parental_soc_emo_adolesc_cog [x]
parental_soc_emo_adolesc_soc_emo [x]Effect of parental skills on child and adolescent skills (0,1] input_substitutability_child_cog [x]
input_substitutability_child_soc_emo [x]
input_substitutability_adolesc_cog [x]
input_substitutability_adolesc_socio_emotional [x]Captures how difficult it is to compensate early investments with late investments in t. Higher values are associated with higher elasticities of input substitution.
(-∞,1]Table 3: Household state variables State Variable Description hh_id [x] Numerical Ids assigned to each household to facilitate keeping track of family members members_parents [e]
members_children [e]List of parents' and children's Ids belonging to the household Fertility age_parents [e] Age of parents (age of mothers = age of fathers). intended_fertility [x] Intended total number of children actual_fertility [e] Actual total number of children child_spacing [x] Distance in years between each birth number_children_0_16 [e] Number of children between 0 and 16 years of age. These are the children that receive parental investments. skill_heritability_cognitive [x],
skill_heritability_socio_emotional [x]Heritability of cognitive and non-cognitive skills [0, 1]
Parental investments (see Submodels, Eq. 4 to Eq. 9)parental_cognitive_skills [e]
parental_soc_emo_skills [e]Average maternal and paternal cognitive and socio-emotional skills [0,1] available_res_total [x] Total annual resources available to invest in offspring
(0, 1]investment_behavior [x] One of the different investment strategies followed by parents {optimal, equality, reinforcement/compensation, son privilege, first-born privilege, last-born privilege} investment_bias [x] Deviation from perfectly egalitarian distribution of resources among siblings [0, 1]. Used for heuristic-based and norm-oriented investment behavior. parental_inv_child_n [e] Vector with resources allocated by parents to each of their children (0, 1] Process overview and scheduling
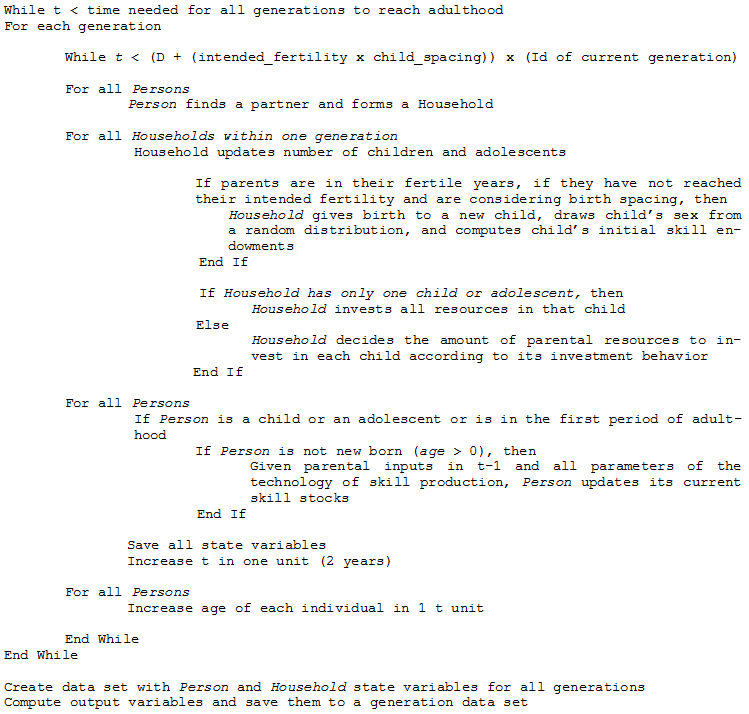
- 3.3
- Each generation of individuals follows a standard life course, with identical life stages and age intervals for particular events. The life course consists of three stages—childhood, adolescence, and adulthood—as depicted in Figure 1. During the first two stages (ages 0 to B), cognitive and socio-emotional skills are produced through parental investments starting from an initial inherited amount of skill endowments. In the first period of adulthood (age B+1), agents update their skill from investments in the last period of adolescence. During the third stage (ages B+1 to D), individuals find a partner, form a household, give birth to the next generation, and invest in the skills of their offspring.
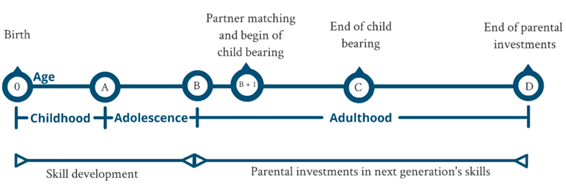
Figure 1. Life course for individuals in each generation - 3.4
- At each t, processes are executed, starting with adults (age ≥ B and < D), then households, and finally children and adolescents (age < B). Among adults, only partner matching is executed in random order, since potential partners are limited and it matters who chooses first. For the remaining processes, the order of execution is not relevant, so it is scheduled according to the individual's or household's Id. Partner matching in the next generation starts only after parental investments have ended, which is the time when all individuals within a given generation have reached adulthood. Processes update state variables as soon as they are executed. The simulation is run for the number of generations defined in the experimental design (see Experimental design below). Output variables are produced at the end of all runs.
Design concepts
- 3.5
- Basic principles. At the core of the simulation is skill formation through parental investments. Skill growth is modeled according to the technology of skill formation developed by Cunha and Heckman (2007), where initial endowments at birth are augmented by subsequent parental investments in a dynamic, self-reinforcing process of skill accumulation during multiple stages of the life course. Although skills are multiple in nature (Cunha & Heckman 2007), they can be reduced to low-dimensional constructs (Heckman, Pinto and Savelyev 2012). Here, two dimensions of skills are assumed: cognitive skills and socio-emotional skills. Stages of development are also simplified to include only childhood and adolescence as two central phases of skill growth. Parental investment decisions are informed by research on the intrahousehold allocation of resources (Behrman 1997) and on heuristics in decision making (Gigerenzer & Gaissmaier 2011). Three further processes of intergenerational dynamics—partner matching, fertility, and skill inheritance—are included but modeled in a simplified manner.
- 3.6
- Emergence. Skill inequality is the main emergent phenomenon in the model. Inequality is measured both within a generation and across generations (see Submodels, Measures of inequality).
- 3.7
- Adaptation. Depending on which behavioral model they follow, parents adapt resource allocation decisions to family size, available resources, and children's attributes, including age, sex, and skill endowments (see Submodels, Parental investment behavior).
- 3.8
- Objectives. For optimizing parents, the goal is to maximize the expected sum of their children's skills when they reach adulthood. Heuristic-based agents also strive to increase the sum of their children's skills as adults. By contrast, the implicit goal of norm-oriented parents is to comply with allocation rules as dictated by norms about gender and birth order.
- 3.9
- Prediction. To allocate resources among siblings optimally, optimizing parents maximize future skill stocks and thus predict how present inputs will affect children's skill formation in the future.
- 3.10
- Sensing. Parents observe children's skills without error.
- 3.11
- Interaction. Parents interact directly with their children inside the household through parental investments. Adults interact with each other when searching for a partner. There is no direct interaction among households.
- 3.12
- Stochasticity. Stochasticity is used to simplify the much more complex processes of partner matching, fertility, skill inheritance, and the determination of the amount of parental resources available to invest in children. Instead of providing an explicit model of genetic transmission and gene–environment interaction, skill inheritance is implemented by producing a correlated random distribution of children's skills based on empirically plausible fixed parent–child skill correlations. Stochasticity is also included in the models of partner matching and child bearing to produce variability in parental skill similarities and siblings' gender composition respectively. The amount of resources available to adults to invest in children is treated as a random variable, too, with a distribution that reflects the amount of parental resource inequality as experienced by children. Parental resources are distributed unequally among parents, but so is the willingness of parents to invest those resources in their children. When posing the existence of an exogenous distribution of resources effectively invested in children as a single dimension, it is not necessary to model the source of parental resources (e.g., labor markets) nor how parents decide between their own consumption and child investments.
- 3.13
- Collectives. Households combine mothers and fathers into one agent.
- 3.14
- Observation. All endogenous state variables are collected at each time period in a main dataset. A second dataset is also generated that summarizes for each simulation run and for each generation key exogenous parameters, including number of children per parent, child spacing, and number of agents in each generation, as well as key outcome variables (see Submodels, Measures of inequality).
Initialization
- 3.15
- Without a previous generation of parents to invest in children's skills, agents in the first generation start their lives as adults. To avoid creating skill inequality from the outset, both initial endowments and current levels of cognitive and socio-emotional skills are drawn from a random beta distribution with parameters alpha = beta = 7. With these parameters, the beta distribution is similar in shape to a normal distribution but with values defined in the range [0, 1]. The intragenerational inequality (Gini) of this initial distribution is approximately 0.145. The remaining values of exogenous parameters of life-course events and technology of skill formation are listed in the section on Submodels below, while number of agents as well as parameters for partner matching, fertility, and parental investments vary depending on the experimental setting and are explained in the section on Experimental design below.
Input data
- 3.16
- No external input data are used.
Submodels
- 3.17
- Life-course events. Life-course events are fixed for all agents with the values A = 6 and B = 16, which are approximations for sensitive developmental stages of cognitive and socio-emotional skills (Borghans et al. 2008) and were chosen to match empirical estimations of the technology of skill formation by Cunha, Heckman, and Schennach (2010). B and C correspond to starting and final periods of child bearing; C and D are described by Equations 1 and 2, as follows:


Equation 2 means that parents invest in their children until each of them has reached adulthood. Although B, C, and D can be calibrated to match country-specific demographic characteristics, here they take on some plausible values intended to give the model a simple yet realistic life-course dynamic.
Table 4: Parameterization of life-course events Parameter Value age_end_childhood (A) 6 age_end_adolescence (B) 16 - 3.18
- Partner matching. Individuals are divided into two groups according to gender. Matching proceeds by taking the first agent in one list (e.g., men) and matching him with a probability p to an agent in the list of the opposite sex (e.g., women), starting from the first in the list, and moving down until a match occurs. After a successful match, the second agent of the first list is picked and the process is repeated with the remaining agents in the second list. Matching is continued until all individuals have found a partner or until no unmatched members of the opposite sex are left. Individuals without a partner remain single for the rest of the simulation.[3] The probability of success is modeled as a unique trial drawn from a binomial distribution, with p as a function of the Euclidean distance d of cognitive and socio-emotional skills (Eq. 3) normalized in the interval [0, 1] and modified by the homophily coefficient h (homophily_skills_partner), as expressed in Equation 4.
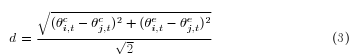
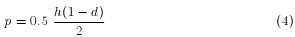
If h = 0, partner matching takes place with a probability of 0.5 of matching success for every matched pair of individuals. If h = 1, the normalized Euclidean distance alone determines the deviation of p from 0.5.
- 3.19
- Parental available resources. At age B, households draw their available resources randomly from a distribution modified experimentally to reflect different levels of inequality between parents (see Experimental design below). The amount of resources remains constant over the life course.
- 3.20
- Child rearing. Number of children and child spacing are fixed parameters defined at the start of each simulation. Only sex composition is probabilistic. Each child has the same probability of 0.50 of being a boy or a girl. This aims at a 50:50 ratio and allows for multiple combinations of sibship sex composition. Given a number of children and child spacing, households give birth to the first child at age B and then again after the number of years determined by child spacing has elapsed. This continues until households have reached the number of children predefined for a given simulation run.
- 3.21
- Initial skill endowments. For each child i, initial cognitive (θci,0)and socio-emotional skill endowments (θei,0) are drawn from a beta-distributed random distribution, with parameters alpha = beta = 7. The same applies to the initial distribution of adult skills in the first generation of agents, which correlates on average by a magnitude given by the heritability coefficient b with the distributions of one of the parents (e.g., maternal skills). During the generation of the random correlation distribution, a negligible amount of outliers slightly exceed 1. In these cases the value is corrected and assigned the value 1. Parameter b captures both genetic and environmental factors that influence children's skills at birth. According to research on behavioral genetics, the heritability of IQ and of personality traits has been estimated at around 0.50 to 0.80 and 0.20 to 0.50 respectively (Johnson et al. 2009). To simplify, b is assumed to be 0.50 for both cognitive and socio-emotional skills. This is not only an empirically plausible value, but given that the parameter is used to generate a correlated random distribution that on average produces a correlation of 0.50, it prevents direct parent–child inheritance at a fixed rate from dominating skill transmission across generations.
Table 5: Parameterization of skill heritability Parameter Value skill_heritability_cog 0.50 skill_heritability_soc_emo 0.50 - 3.22
- Update skills. Skill growth is modeled according to the technology of skill formation developed by Cunha and Heckman (2007) and extended in Cunha, Heckman, and Schennach (2010), as shown in Equation 5.[4]

For agent i, next-period cognitive (θci,t+1) and socio-emotional skills (θei,t+1) are a function of skill stocks (θci,t, θei,t), parental skills (θcp, θep), and present parental investments (Ii,p,t).[5] Given that skills remain constant after individuals have reached adulthood, parental skills have no time subscript. The function is defined for each age t starting at birth (t = 0) and up to adulthood (t = B). Parameters are different depending on the life-cycle stage s (childhood: s = 1; adolescence: s = 2; see Figure 1 above). Equation 6 expresses Equation 5 as a constant elasticity of substitution (CES) production function. (See Table 6 below for a list of the corresponding variables in the simulation for each of the γ coefficients.)
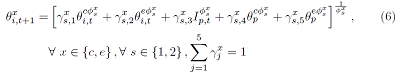
- 3.23
- The functional form of the technology of skill formation defined by Equation 6 captures two important stylized facts about skill growth (Cunha and Heckman 2007):
- Dynamic complementarity (self-productivity and cross-productivity). Skills in t+1 depend on past stocks of both cognitive and socio-emotional skills.
- Sensitive periods. Depending on the age of the child, investments in skills may have more or less indelible consequences for children's skill development. The substitutability parameter φs and the associated elasticity of substitution 1/(1 - φxs) capture how difficult it is to compensate early investments with late investments. The higher φxs is, the higher the elasticity of substitution and the easier it is to substitute early investments with late ones. Low values of φs imply that early and late investments are complements. Elasticities are specific to each type of skill (x = c, e) and each stage of the life course (s = 1, 2).
- 3.24
- The exact content of parental investments (Ip,t) and the reason to include parental skills (θcp, θep) in Equations 5 and 6 require further clarification. As research on brain development suggests, the two most relevant factors affecting children's emotional and cognitive development at the neurophysiological level, aside from prenatal factors, are parental care and a cognitively stimulating environment (Hackman et al. 2010). Parents invest in their children not only by spending material resources in goods and services, but also by deciding on the quantity and quality of time and attention to be devoted to their offspring (Heckman 2006; Berger et al. 2009). Both the quantity and quality dimensions of parental inputs are reflected in Equations 5 and 6. While (Ip,t) measures the amount of parental inputs, a combination of material resources and parenting time, parental skills (θcp, θep) can be understood as a proxy for quality of parenting.[6] This separation of quantity from quality of inputs makes it possible to accommodate in the model the finding that household material resources do not necessarily correspond to good parenting (Heckman 2008). Accordingly, even parents with fewer resources but high parenting skills may contribute to children's skill formation effectively.
- 3.25
- To parameterize Equation 6, empirical estimates based on the Children of the National Longitudinal Survey of Youth (NLSY79), a representative U.S. longitudinal study, were used (Cunha et al. 2010). High-quality parameter estimates for other countries are not available. These estimates control for measurement error, unobserved heterogeneity, and endogeneity of parental inputs (Ibid: Table V, p. 919). The original estimates conflate multiple measures of parental resources from the HOME scale into a single dimension of parental investments. Parental skills refer to those of the mother. Investments in different types of skills were not distinguished. Cognitive and non-cognitive (in this case socio-emotional skills) were summarized into two independent dimensions based on various age-specific scales of child development (Ibid: Appendix, Section 9, for a list of measures). Estimates were obtained from biennial measures of children during two stages of development: ages 0 to 6 years and ages 6 to 14 years. To accommodate the estimates to the present simulation, parameter estimates for the second stage of development (ages 6 to 14 years) were assumed to remain constant up to age 16. Furthermore, arbitrary scales were assumed for parental investments and skills, all ranging from 0 to 1. As shown in their web appendix (Ibid: A11, Table 11-1), rescaling the variables for parental inputs and skills makes no qualitative difference in terms of parameter estimates (Ibid: p. 921). Finally, parental skills (θcp, θep) were taken to be the average of both maternal and paternal skills and not only the skills of the mother.
Table 6: Parameterization of the technology of skill formation Parameter Value Cognitive skills (θci,t+1) children (s = 1) productivity_cog_child_cog γc1,1 0.485 productivity_soc_emo_child_cog γc1,2 0.062 parental_inv_productivity_child_cog γc1,3 0.261 parental_cog_child_cog γc1,4 0.035 parental_soc_emo_child_cog γc1,5 0.157 input_substitutability_child_cog φc1 0.585 Cognitive skills (θci,t+1) adolescents (s = 2) productivity_cog_adolesc_cog γc2,1 0.884 productivity_soc_emo_adolesc_cog γc2,2 0.011 parental_inv_productivity_adolesc_cog γc2,3 0.044 parental_cog_adolesc_cog γc2,4 0.051 parental_soc_emo_adolesc_cog γc2,5 0.011 input_substitutability_adolesc_cog φc2 -1.220 Socio-emotional skills (θei,t+1) children (s = 1) productivity_cog_child_soc_emo γe1,1 0.000 productivity_soc_emo_child_soc_emo γe1,2 0.602 parental_inv_productivity_child_soc_emo γe1,3 0.209 parental_cog_child_soc_emo γe1,4 0.014 parental_soc_emo_child_soc_emo γe1,5 0.175 input_substitutability_child_soc_emo φe1 -0.464 Socio-emotional skills (θei,t+1) adolescents (s = 2) productivity_cog_adolesc_soc_emo γe2,1 0.002 productivity_soc_emo_adolesc_soc_emo γe2,2 0.857 parental_inv_productivity_adolesc_soc_emo γe2,3 0.104 parental_cog_adolesc_soc_emo γe2,4 0.000 parental_soc_emo_adolesc_soc_emo γe2,5 0.037 input_substitutability_adolesc_socio_emo φe2 -0.522 - 3.26
- Parental investment behavior. Three alternative models of parental behavior are considered: optimizing, heuristic-based, and norm-oriented. All types of parents allocate their available resources (Ip,t) among their children i {1,…N}, as specified by the following budgetary restriction (Eq. 7):
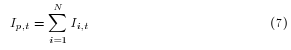
Until the birth of the second child, the first-born receives all parental resources (I1,p,t = Ip,t). The same is true for the youngest child after all older siblings have reached adulthood.
- 3.27
- (i) Optimizing behavior: Parents choose how much to invest in each sibling i {1,…N} in order to maximize the total expected sum of cognitive and socio-emotional skills over all children when they reach adulthood (t = B), subject to the technology of skill formation and the budgetary restriction. Optimization takes place once each time a new child is born or an adolescent reaches adulthood.
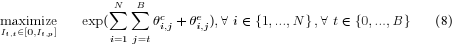
subject to Equations 6 and 7.
- 3.28
- The result of the optimization is a vector I with the amount of resources to invest in each child i and each period t until t = B for every child. Maximization does not weigh a particular type of skill higher than the other, nor the skills of a particular sibling. To optimize Equation 8 in Python, the module for constrained optimization found in SciPy was used with the option for sequential least-squares programming.[7] Before applying the optimization algorithm, the equation had to be solved analytically by means of backward induction (i.e., by reformulating the optimization problem for all periods t in terms of first-period investments). In Python, this was achieved using the library for symbolic mathematics SymPy.[8]
- 3.29
- (ii) Heuristic-based behavior: Two alternative heuristics are considered: equality (Eq. 9) and reinforcement (Eq. 10) or compensation (Eq. 11).
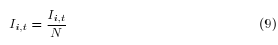
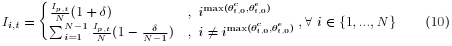
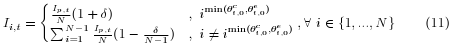
- 3.30
- An egalitarian distribution divides resources equally by the number of children (Eq. 9). By adhering to the other heuristic (Eqs. 10 and 11), parents may instead choose an unequal distribution of resources either through reinforcement, by giving more to the child with the highest average endowments at birth (θci,0, θei,0), or through compensation, preferentially allocating resources to the less-endowed child. The exact size of preferential investment cannot be easily inferred from the empirical literature on parental investments (see Section two above), and hence the size of compensation or reinforcement is modified experimentally by the investment_bias parameter δ {0,1}. Choosing to reinforce or to compensate children's endowments is a function of the amount of resources available to parents. Reinforcement is followed by parents with relatively low resources, compensation by those with relatively high resources. The mean of the parental resource distribution is used to distinguish between low resources (below the mean) and high resources (equal to or greater than the mean).
- 3.31
- (iii) Norm-oriented behavior: The two norms considered are son preference (Eq. 12)[9] and favoritism based on birth order, either for the first-born or the last-born (Eq. 13).
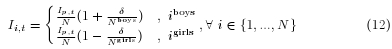

- 3.32
- As with reinforcing and compensating strategies, the size of the deviation from an egalitarian distribution is measured by the investment_bias parameter δ {0,1}. The value of δ varies depending on the strength of parental bias, which can be as high as 1 in the case of infanticide.
- 3.33
- Measures of inequality. One measure of intragenerational inequality and two of intergenerational inequality are provided.
- 3.34
- (i) Gini coefficient. This measures inequality in the distribution of cognitive (θic) and socio-emotional skills (θie) among individuals n belonging to a given generation g (Eq. 14). Values are defined in the range [0, 1], with 1 being maximum inequality.

- 3.35
- (ii) Intraclass correlation (ICC). This measures the portion of total variance in cognitive skills (θci) and socio-emotional skills (θei) due to variations between households h (Eq. 15). ICC can be interpreted as a measure of shared environment and used to quantify inequality among siblings. Values are defined in the range [0, 1]. The higher the ICC, the more important is family background for skill formation or the more similar siblings are to each other.
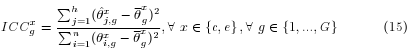
where θxg "bar" is the overall generation mean and θxj,g "hut" household's h mean.
- 3.36
- (iii) Intergenerational correlation. The Pearson correlation coefficient between children's cognitive and socio-emotional skills and parental average skills (household skills) is used as a measure of intergenerational persistence of inequality. Values are defined in the range [0, 1]. A correlation close to 1 means high persistence.
Experimental Design
- 4.1
- The DOE was used to set up the experiments (see Lorscheid et al. 2012). Table 7 summarizes the dependent, independent, and control variables. Although the analysis is exploratory and is intended to produce and not to test hypotheses about which forms of parental behavior lead to which levels of inequality in society, it seems reasonable to expect higher levels of inequality both within and across generations from non-egalitarian and optimal allocation strategies compared to egalitarian strategies. The reason is simple: given variability in individual gender, birth order, and skills, parents that are blind to these differences will tend, over time, to level them up unintentionally through egalitarian resource allocation. By contrast, resource allocation that not only deviates from equality but is dictated by precisely those differences in gender, birth order, or skills should tend to create divergent paths of individual skill growth along those same dimensions and ultimately increase overall inequality. In other words, it is reasonable to expect that equality (inequality) at the micro-level should translate into equality (inequality) at the macro-level. This, however, is a simple and "naïve" intuition about the macro-consequences of alternative parental behavior that needs to be explored systematically using the experimental setup. In particular, the experiments allow for the exploration of parental allocation decisions under changing environmental conditions within the household (number of children and child spacing) and in society as a whole (differences in resources among households).
Table 7: Classification of variables Dependent variables Independent variables Control variables - Gini, ICC, intergenerational correlation - Investment behavior
- Number of children
- Child spacing
- Inequality of parental resources- Skill homophily
- Investment bias (δ) - 4.2
- Factor levels for the independent and control variables are shown in Table 8. In the case of inequality of parental resources, zero inequality means equal resources for all parents. Low inequality and high inequality are implemented by a beta distribution with parameters that approximate a normal and a log-normal distribution respectively.
Table 8: Factorial Factors Factor level range Factor levels
Investment behavior
Number of children
—
[0, x]*{Optimal, equality, reinforcement/compensation, son privilege, first-born privilege, last-born privilege}
{2, 3, 4}Child spacing [1, x]* {2, 4, 6} Inequality of parental resources — {0, low, high} Skill homophily [0, 1] {0.2, 0.8} Investment bias (δ) [0, 1] {0.2, 0.8} * In the factor level range, the x equals the upper boundary defined by the biological limits of childbirth. - 4.3
- A full factorial design was implemented. Since investment bias is not defined for optimizing and egalitarian parents, the number of design points varies depending on parental behavior, as summarized in Table 9. A total of 540 design points was thus obtained
Table 9: Design points according to parental investment behavior Parental investment behavior Design points Optimizing 1. Optimal allocation 54 Heuristic 2. Equality
3. Reinforcement or compensation54
108Norms 4. Son privilege
5. First-born favoritism
6. Late-born favoritism108
108
108 - 4.4
- For each design point, the optimal number of runs (n) was established by computing the experimental error for the dependent variables for n = 5, 10, 15, 20, 25, 50, 100, 250, and 500 using egalitarian parents, which is the simplest allocation rule. For each n and each design point, the coefficient of variation (Cv = standard deviation/mean) was estimated as suggested in Lorscheid et al. (2012). Results indicate that Cv stabilizes at around 50 iterations at most.
- 4.5
- Owing to constraints in computer power, two separate experiments were run to make simulation experiments computationally feasible. Simulating optimizing parents is computationally expensive. Each household in the simulation, at each t, solves a dynamic problem of optimizing resource allocation among a changing number of children. Thus, the first experiment excluded optimizing parents and ran the remaining 486 design points, including egalitarian parents, alongside all other non-egalitarian strategies for 1,000 initial agents over five generations. The second experiment considered optimizing parents and again included all design points for egalitarian parents. The number of initial agents was 100, and the simulation was run for three generations. In this way, the computational burden was reduced and all parental behavior models could be compared with one another using egalitarian parents as a benchmark.
Results
- 5.1
- To visualize and analyze output, a metamodel was used. Each of the three dependent variables for each type of skill was summarized based on a linear-regression Tobit model, with the dependent variable defined in the range [0, 1]. The regressors included all independent and control variables (see Table 7), and an interaction term between parental investment behavior and number of children, child spacing, and parental resources. All variables were treated as categorical and were included in the model using dummies for each of its values, thus allowing for nonlinearities. A dummy for each generation was also included to control for time. For each of the two experiments, the data used to estimate the parameters of the regression encompassed all generations and experimental runs for each design point, as described above. The values of dependent variables corresponded to levels observed at the end of each generation when all agents had reached adulthood. Results are presented using predicted values.
Experiment 1: Egalitarian vs. non-egalitarian parents
- 5.2
- Non-egalitarian strategies include unequal distribution of resources based on child endowments (reinforcement/compensation), gender (son privilege), and birth order (first-born or last-born privilege). Figure 2 summarizes the predicted margins for each dependent variable and type of skill as a function of parental investment strategies. Both overall predicted averages and averages for changes in covariates are displayed. Changes are presented using the overall predicted average as a benchmark. The graph lines do not represent any particular trend; they are shown to facilitate the visualization of predicted values across parental investment strategies. Based on these results, five conclusions can be drawn.
- Parental behavior matters. Parental investment strategies at the household level do affect aggregate levels of skill inequality within and across generations. This is particularly true for Gini and ICC. Intergenerational correlations are relatively insensitive to different parental investment strategies.
- Results are comparable for both types of skills. Differences among parental cognitive and socio-emotional skills are not substantial. Only the ICC displays skill-specific differences. The ICC for cognitive skills is relatively more sensitive to child spacing, while the ICC for socio-emotional skills is relatively more elastic to fertility. Aggregate levels of inequality for parents that conferred last-born privilege also vary between types of skills; however, the differences are small.
- Being egalitarian or not is the most important distinction in parental investment behavior. In terms of effect on aggregate levels of inequality, the largest differences can be seen between egalitarian and non-egalitarian parental investment strategies. Among non-egalitarian investment strategies, levels of inequality are comparable.
- There is a tradeoff between equality at home and inequality within and across generations. Equality at home reduces skill inequality within one generation (Gini) but at the cost of increasing inequality across generations (ICC, intergenerational correlation). The opposite is true for a non-egalitarian allocation of resources at home. This contradicts the "naïve" expectation that equality (inequality) at the micro-level always leads to equality (inequality) at the macro-level.
- Changes in the environment reduce or exacerbate inequality depending on parental investment behavior. Although greater inequality in the distribution of parental resources produces greater inequality within (Gini) and across generations (ICC) for all types of parental investment strategies, changes in the composition of the household (fertility and child spacing) affect inequality differently depending on parental choices. All else being equal, higher fertility and wider child spacing have no influence on inequality within a generation but reduce inequality across generations if the parents are egalitarian. Yet, if they are non-egalitarian, larger families are associated with a lower Gini, a higher ICC (with the exception of son privilege), and a lower intergenerational correlation. Wider child spacing has no influence on Gini or intergenerational correlation but tends to reduce sibling similarity.
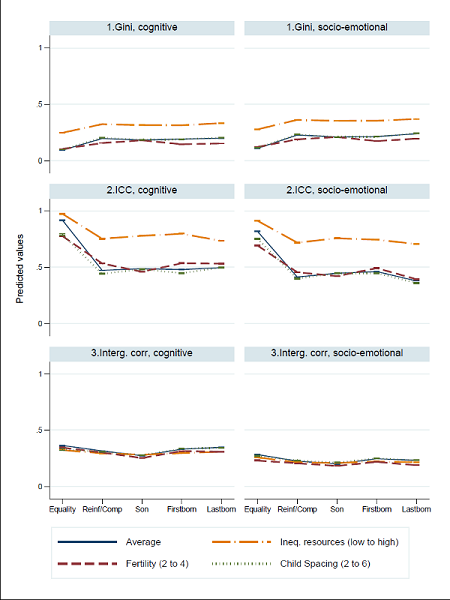
Figure 2. Differences in predicted values between egalitarian and non-egalitarian parents, showing 95% confidence intervals[10] Experiment 2: Egalitarian vs. optimizing parents
- 5.3
- Do optimizing parents differ from egalitarian parents? Figure 3 summarizes the predicted margins for each dependent variable and type of skill when parents act as optimizers relative to the predicted values for egalitarian parents using the latter as a reference (see Figure 2). The closer the difference in predicted values is to zero, the more optimizing parents produce the same results as egalitarian ones. On the graph, error bars around predicted values show whether differences above or below zero are statistically significant.
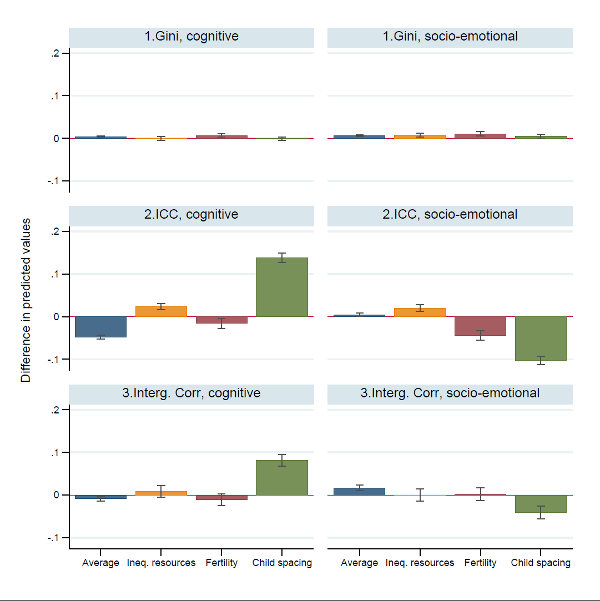
Figure 3. Differences in predicted values between optimizing and egalitarian parents, showing 95% confidence intervals - 5.4
- At the aggregate level, differences between egalitarian and optimizing parents are small. Only the difference in ICC for cognitive skills is sizable. Most of the differences between the two types of parental behavior are evident in their effects on inequality across generations as a response to changes in child spacing. When child spacing increases both the ICC and the intergenerational correlation for optimizing parents increases more than for egalitarian parents. The opposite is true for socio-emotional skills, for which wider child spacing reduces inequality across generations. In short, aside from their response to child spacing, societal levels of inequality generated by optimizing parents remain fairly close to those produced by egalitarian parents. This implies, by transitivity, that non-egalitarian parents differ from optimizing parents in the levels of societal inequality they produce.
Validation
- 6.1
- Although the simulation is a middle-range model, it is possible to assert the validity of at least one of its conclusions using empirical data. Ideally, cross-country representative data on cognitive and socio-emotional skills for all members of the household and for more than one generation, as well as data on parental allocation behavior, would be required to test the relationship between parental investments and societal levels of inequality. Unfortunately, such comprehensive data do not exist. Although there are scattered, country-specific longitudinal studies with some of the data needed, such as the Panel Study of Income Dynamics (United States) and Socio-Economic Panel (Germany), they are not sufficient to compare the Gini, ICC, and intergenerational correlation of different skills for various countries with varying parental investment strategies. For this reason, only one model prediction can be validated, and only through indirect measures.
- 6.2
- In terms of data needed, the less demanding prediction to validate is the one related to cognitive skills within one generation, since neither data on siblings or parents nor data on multiple generations are required. One common operationalization of cognitive skills is IQ. To obtain the distribution of cognitive skills for young people, data from the Programme for International Student Assessment (PISA) was used. The PISA test evaluates student competencies from randomly selected students in multiple countries at age 15 in mathematics, science, and language.[11] As shown by Lynn and Vanhanen (2006, p. 69), the correlation between average mathematics scores in the PISA study and average country IQ is 0.876. Thus, as a proxy measure of inequality in cognitive abilities within one generation, the Gini of total individual raw math scores in 61 countries based on 2009 PISA data was computed.
- 6.3
- Furthermore, as a measure of parental investment strategies in the countries for which PISA results are collected, the World Values Survey (WVS) was used. The WVS includes representative data on values and beliefs across countries that concentrate over 85% of the world's population.[12] Based on this dataset, Inglehart and Welzel (2005) defined a two-dimensional space that classifies all countries in the survey according to their values: traditional vs. secular and survival vs. self-expression. The more countries tend toward secular and self-expression values, the more they adhere to values such as individual freedom, equality, and democracy. Although society-wide trends in values and beliefs are not a direct measure of parental intrahousehold resource allocation strategies, it is plausible to assume that parents in countries that score high in traditional and survival values are more likely to follow non-egalitarian allocation rules such as gender or birth-order privileges and reinforcing heuristics, while parents in countries with predominantly secular and self-expression values are more likely to be inclined to follow egalitarian strategies that provide each individual child with equal chances. In addition, and more specific to gender inequality, the WVS asks respondents whether they agree, disagree, or neither agree nor disagree that men should have a greater right to a job than women if jobs are scarce. If one codes "agree" as -1, "neither agree nor disagree" as 0, and "disagree" as 1, a gender-equality scale can be constructed, with average scores at the country level defined between -1 (low gender equality) and 1 (high gender equality).
- 6.4
- According to the predictions of the model, the inequality in mathematics scores should be greater in countries with traditional and survival values and higher gender inequality and less in countries with secular and self-expression values and a lower tolerance for differences between men and women. As depicted in Figures 4, 5, and 6, this is in fact the case. The correlation between the Gini of mathematics scores and the traditional/secular index is -0.54; if the survival/self-expression index is used instead, the correlation is cut down by one third but remains negative. Using the gender-equality scale, the correlation is -0.37. Similar results are obtained if science and language individual raw scores are used: correlations are -0.45 and -0.32 for the traditional/secular index, -0.33 and -0.33 for the survival/self-expression index, and -0.36 and -0.29 for the gender-equality score.
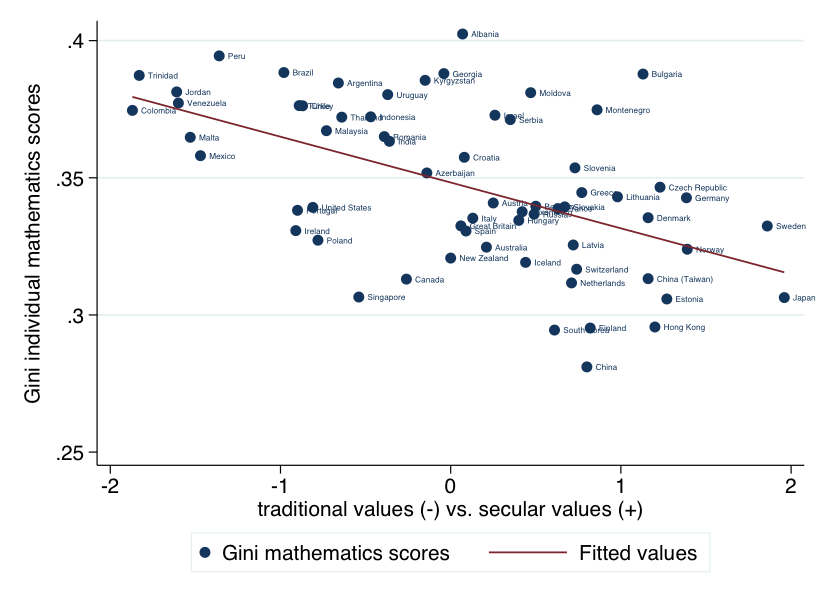
Figure 4. Gini of PISA mathematics scores and country according to traditional vs. secular values 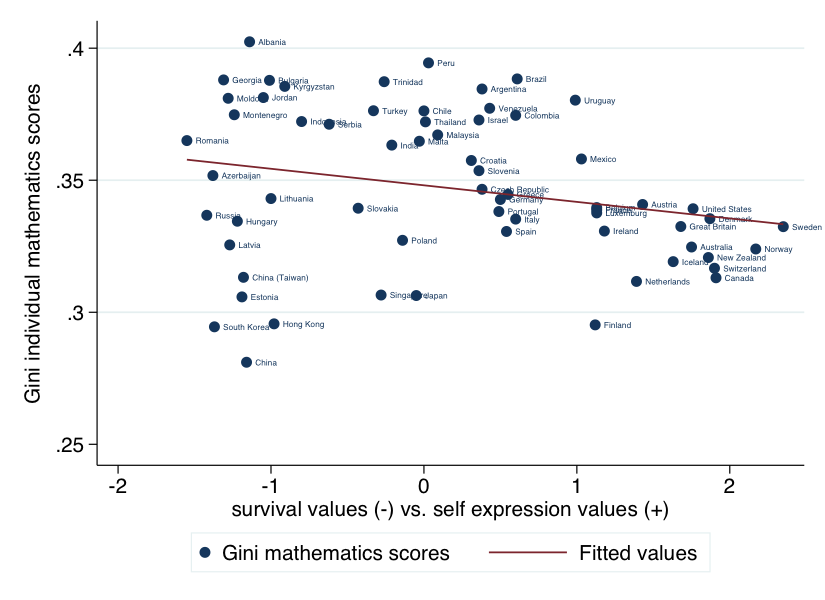
Figure 5. Gini of PISA mathematics scores and country according to survival vs. self-expression values 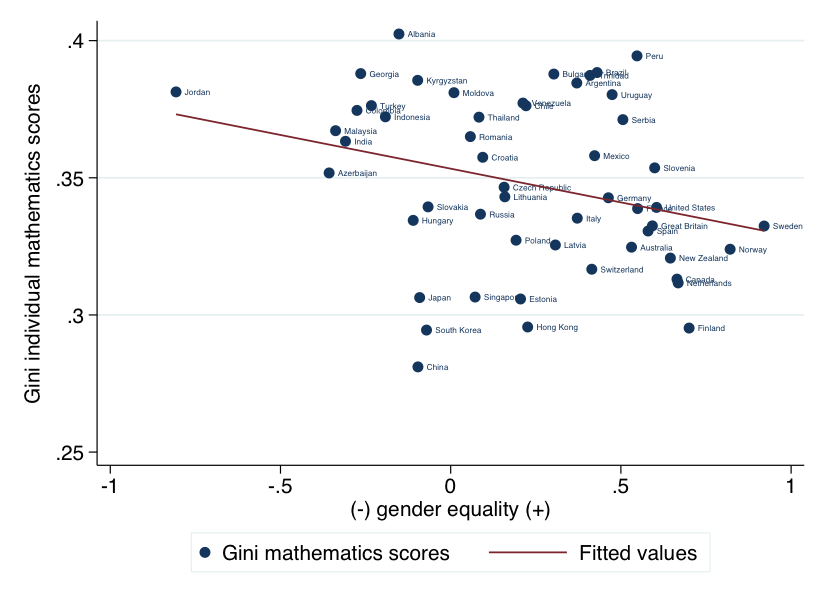
Figure 6. Gini of PISA mathematics scores and country according to gender equality score
Conclusion and Outlook
- 7.1
- A first step was taken toward using ABM to study the emergence of social inequality from a life-course perspective. The results of the simulation showed that parental behavior matters for understanding how skill inequality at the societal level emerges and reacts to changes in household composition and distribution of resources among households. Following egalitarian allocation rules as opposed to non-egalitarian heuristic or norm-based rules appears to be the most important distinction in parental investment behavior to explain aggregate differences in Gini, ICC, and intergenerational correlations of cognitive and socio-emotional skills. Results obtained from optimizing parental behavior were surprisingly close to those of egalitarian parents and thus distinct from those of heuristic-based and norm-oriented parental behavior. As a result, if, in the world outside the model, parents in fact follow reinforcement/compensation strategies or allocate resources based on gender or birth order, then predictions drawn from models based on optimizing parents alone, which is the dominant assumption in economics and biology, may be at odds with empirical reality. Not only should this result serve as a cautionary tale against relying too much on optimizing assumptions when modeling intrahousehold allocation of resources and intergenerational transmission of inequality, but, perhaps more importantly, it should motivate researchers to explore alternative models of parental decision making from a non-optimizing view of behavior, such as heuristics or norms.
- 7.2
- Furthermore, the fact that one prediction of the model related to the distribution of cognitive skills within one generation and parental allocation strategies seems to be supported by empirical data, despite the proxy nature of the measures used, gives credence to the promise of using ABM productively in the study of social inequality from a life course perspective. In particular, this shows how combining plausible mechanisms of intrahousehold resource allocation with an empirically validated representation of skill growth makes it possible to produce microfounded hypotheses about the relationship between parental choices and society-level emergent inequality.
- 7.3
- It goes without saying that the present version of the model is far from complete and that validation was limited to one prediction of the model. Several aspects of the model can and should be addressed in future work to fully capitalize on the advantages of ABM for the study of social inequality. The following is a tentative and non-comprehensive list of possible model extensions.
Transmission of resources within the family
- Children are active agents who influence parental investments.
- Mothers and fathers are treated as separate entities.
- Parents have heterogeneous preferences regarding child care and competing activities such as work and leisure.
- There is intramarital bargaining over working time, leisure time, and child care.
- Parental investment behavior adapts to changes in the amount of available resources.
- There is a labor market. Parents decide how much to work, and their resources are a function of skills.
- Other resources aside from investments in skills are transmitted (e.g., bequests).
- Households interact directly (e.g., effects of the network in decisions about how and how much to invest in children).
Skills and skill formation
- Parental inputs are specific (e.g., financial, time, and emotional resources).
- Inputs are a function of age or gender (e.g., gender-role socialization).
- Parents have different preferences for investing in each type of skill.
- There are more sensitive periods and/or different sensitive periods for each skill or skill type.
- Other agents (e.g., siblings and grandparents) or institutions (e.g., schools) influence skill formation.
- Agents invest in their own skills (e.g., differences in aspirations).
- Skills continue to grow during adulthood.
- Skill inheritance is explicitly modeled.
Life cycle
- Life-course stages are heterogeneous.
Fertility
- Parental fertility decisions are endogenous.
- Marital sorting/assortative mating is explicitly modeled.
In general
- What is the tradeoff at the aggregate level between efficiency (sum of skills) and equity (distribution of skills) for different forms of parental behavior; within the family; in society?
- Calibrate the model using country-specific parameters: returns on skills, fertility rates, family size, and stages of the life course.
- 7.4
- Lastly, for those modelers with a preference for simple models, a simplified version of the present analysis might be worth pursuing and its results compared with the results reported in this article.
Acknowledgements
-
I would like to thank Nanda Wijermans and Frederik Schaff for insightful discussions about modeling agent behavior; Herbert Dawid, Simon Gemkow, as well as participants of ESSA@Work Osnabrück and Warsaw for useful technical advice and guidance through different stages of simulation design and implementation; Andreas Haupt, Anna Klabunde, and Antje Brock for helpful comments on previous versions of this paper; and two anonymous reviewers for generous feedback that helped improved this manuscript. I am also grateful to Robert Glowienka for his competent IT-support, and Ann-Kristin Koop and Janina Jaeckel for research assistance.
This research has been funded by the German Research Foundation (DFG), Collaborative Research Center (CRC) 882 "From Heterogeneities to Inequalities" at Bielefeld University.
Notes
-
1 According to this hypothesis, if sexual competition is more decisive for the reproductive success of males than females and if the rank or status of parents correlates with that of their offspring, then low-rank parents would tend to invest preferentially in females, while high-rank parents who can afford giving males enough resources to successfully face reproductive competition would favor them instead (Trivers and Willard 1973). In humans, this hypothesis predicts that high-status parents invest more in boys and low-status parents more in girls, a correlation that has been supported by only weak and mixed evidence when tested empirically (Cronk 2007).
2 See Messick (1993) for an experimental design that tries to distinguish between the two types of decision modes.
3 For a brief review of recent simulation-based models of marriage and mate selection, see Walker and Davis (2013).
4 Similar models of cognitive skill formation have been developed by Todd and Wolpin (2003, 2007). See early efforts to formulate the technology of skill production in Ben-Porath (1976).
5 The statistical model used by Cunha, Heckman and Schennach (2010) includes in Eq. 6 an error term that captures shocks and unobserved inputs. These are not modeled in the present version of the simulation to avoid additional sources of randomness in skill growth.
6 The interpretation of parental skills as quality of parenting is not explicitly made in Cunha, Heckman, and Schennach (Cunha 2010); however, there is evidence that parenting styles vary according to parental socio-economic status (Bornstein and Bradley 2003), which in turn correlates with cognitive and non-cognitive skills.
7 http://docs.scipy.org/doc/scipy/reference/generated/scipy.optimize.minimize.html
8 http://sympy.org/de/index.html
9 Daughter preference is not modeled as a separate parental investment behavior, since results would be analytically identical to those obtained from son preference.
10 Confidence intervals are so narrow that they appear as small "rectangles" on the graph. Lines connecting these rectangles have been included to facilitate comparisons among models.
12 http://www.worldvaluessurvey.org
References
-
ALMOND, D., Edlund, L. & Milligan, K. (2013). Son preference and the persistence of culture: Evidence from South and East Asian immigrants to Canada. Population and Development Review, 39 (1), 75–95. [doi:10.1111/j.1728-4457.2013.00574.x]
AUCHINCLOSS, A. H., Riolo, R. L., Brown, D. G., Cook, J. & Diez Roux, A. V. (2011). An agent-based model of income inequalities in diet in the context of residential segregation. American Journal of Preventive Medicine, 40 (3), 303–311. [doi:10.1016/j.amepre.2010.10.033]
BAYDAR, N., Hyle, P. & Brooks-Gunn, J. (1997). A longitudinal study of the effects of the birth of a sibling during preschool and early grade school years. Journal of Marriage and Family, 59 (4), 957–965. [doi:10.2307/353795]
BECKER, G. S. & Tomes, N. (1986). Human capital and the rise and fall of families. Journal of Labor Economics, 4 (3), 1–39. [doi:10.1086/298118]
BEHRMAN, J. R. (1997). Intrahousehold distribution and the family. In M. R. Rosenzweig and O. Stark (Eds.), Handbook of Population and Family Economics: Volume 1A. (pp. 125–187). Amsterdam et al.: Elsevier.
BEHRMAN, J. R., Pollak, R. A. & Taubman, P. (1982). Parental preferences and provision for progeny. Journal of Political Economy, 90 (1), 52–73. [doi:10.1086/261039]
BEN-PORATH, Y. (1967). The production of human capital and the life cycle of earnings. Journal of Political Economy, 75 (4), 352–365. [doi:10.1086/259291]
BERGER, L. M., Paxson, C. & Waldfogel, J. (2009). Income and child development. Children and Youth Services Review, 31 (9), 978–989. [doi:10.1016/j.childyouth.2009.04.013]
BJÖRKLUND, A. & Jäntti, M. (2009). Intergenerational income mobility and the role of family background. In W. Salverda, B. Nolan and T. M. Smeeding (Eds.), The Oxford Handbook of Economic Inequality (pp. 491–521). Oxford/New York: Oxford University Press.
BLAKE, J. (1989). Family Size and Achievement. Berkeley, CA: University Of California Press.
BORGHANS, L., Duckworth, A. L., Heckman, J. J. & ter Weel, B. (2008). The economics and psychology of personality traits. IZA Discussion Papers (3333). [doi:10.3368/jhr.43.4.972]
BORNSTEIN, M. H. & Bradley, R. H. (Eds.) (2003). Socioeconomic status, parenting, and child development. Mahwah, NJ: Lawrence Erlbaum Associates.
CONLEY, D. (2005). The Pecking Order: A Bold New Look at How Family and Society Determine Who we Become. New York: Vintage.
CRONK, L. (2007). Boy or girl: Gender preferences from a Darwinian point of view. Reproductive BioMedicine Online, 15 (Suppl. 2), 23–32. [doi:10.1016/S1472-6483(10)60546-9]
CUNHA, F. & Heckman, J. J. (2007). The technology of skill formation. American Economic Review, 97 (2), 31–47. [doi:10.1257/aer.97.2.31]
CUNHA, F., Heckman, J. J. & Schennach, S. M. (2010). Estimating the technology of cognitive and noncognitive skill formation. Econometrica, 78 (3), 883–931. [doi:10.3982/ECTA6551]
DATAR, A., Kilburn, M. & Loughran, D. (2010). Endowments and parental investments in infancy and early childhood. Demography, 47 (1), 145–162. [doi:10.1353/dem.0.0092]
DAVIS, J. N., Todd, P. M. & Bullock, S. (1999). Environment quality predicts parental provisioning decisions. Proceedings: Biological Sciences, 266 (1430), 1791–1797. [doi:10.1098/rspb.1999.0848]
DAVIS, J. N., & Todd P. M. (2001). Parental investment by simple decision rules. In G. Gigerenzer and P. M. Todd (Eds.), Evolution and Cognition. Simple Heuristics That Make us Smart (pp. 309–326). Oxford: Oxford University Press.
DAWID, H. & Gemkow, S. (2013). How do social networks contribute to wage inequality? Insights from an agent-based analysis. Bielefeld Working Papers in Economics and Management (5). Bielefeld: Bielefeld University.
DEL BONO, E., Ermisch, J. & Francesconi, M. (2012). Intrafamily resource allocations: A dynamic structural model of birth weight. Journal of Labor Economics, 30 (3), 657–706. [doi:10.1086/664831]
DEMIGUEL, V., Garlappi, L. & Uppal, R. (2007). Optimal versus naive diversification: How inefficient is the 1/N portfolio strategy? Review of Financial Studies, 22 (5), 1915–1953. [doi:10.1093/rfs/hhm075]
EJRNÆS, M. and Pörtner, C. C. (2004). Birth order and the intrahousehold allocation of time and education. Review of Economics and Statistics, 86 (4), 1008–1019. [doi:10.1162/0034653043125176]
ERMISCH, J., Jäntti, M. & Smeeding, T. M. (Eds.) (2012). From Parents to Children: The Intergenerational Transmission of Advantage. New York: The Russell Sage Foundation.
GIGERENZER, G. (2004). Fast and frugal heuristics: The tools of bounded rationality. In D. J. Koehler & N. Harvey (Eds.), Blackwell Handbook of Judgment and Decision Making (pp. 62–88). Malden, Ma/Oxford/Victoria: Blackwell Publishing. [doi:10.1002/9780470752937.ch4]
GIGERENZER, G. & Gaissmaier, W. (2011). Heuristic decision making. Annual Review of Psychology, 62 (1), 451–482. [doi:10.1146/annurev-psych-120709-145346]
GOLDTHORPE, J. H. (2000). Outline of a theory of social mobility. In J. H. Goldthorpe (Ed.), On Sociology: Numbers, Narratives, and the Integration of Research and Theory (pp. 230–258). Oxford : Oxford University Press.
GRIMM, V., Berger, U., Bastiansen, F., Eliassen, S., Ginot, V., Giske, J., Goss-Custard, J., Grand, T., Heinz, S. K., Huse, G., Huth, A., Jepsen, J. U., Jørgensen, C., Mooij, W. M., Müller, B., Pe'er, G., Piou, C., Railsback, S. F., Robbins, A. M., Robbins, M. M., Rossmanith, E., Rüger, N., Strand, E., Souissi, S., Stillman, R. A., Vabø, R., Visser, U. & DeAngelis, D. L. (2006). A standard protocol for describing individual-based and agent-based models. Ecological Modelling, 198 (1–2), 115–126. [doi:10.1016/j.ecolmodel.2006.04.023]
GRIMM, V., Berger, U., DeAngelis, D. L., Polhill, J. G., Giske, J. & Railsback, S. F. (2010). The ODD protocol: A review and first update. Ecological Modelling, 221 (23), 2760–2768. [doi:10.1016/j.ecolmodel.2010.08.019]
HACKMAN, D. A., Farah, M. J. & Meaney, M. J. (2010). Socioeconomic status and the brain: mechanistic insights from human and animal research. Nature Reviews Neuroscience, 11 (9), 651–659. [doi:10.1038/nrn2897]
HAMILTON, W. D. (1964a). The genetical evolution of social behaviour. I. Journal of Theoretical Biology, 7 (1), 1–16. [doi:10.1016/0022-5193(64)90038-4]
HAMILTON, W. D. (1964b). The genetical evolution of social behaviour. II. Journal of Theoretical Biology, 7 (1), 17–52. [doi:10.1016/0022-5193(64)90039-6]
HECKMAN, J. J. (2006). Skill formation and the economics of investing in disadvantaged children. Science, 312 (5782), 1900–1902. [doi:10.1126/science.1128898]
HECKMAN, J. J. (2008). Role of Income and Family Influence on Child Outcomes. Annals of the New York Academy of Sciences, 1136 (1), 307–323. [doi:10.1196/annals.1425.031]
HECKMAN, J. J. & Kautz, T. (2012). Hard evidence on soft skills. Labour Economics, 19 (4), 451–464. [doi:10.1016/j.labeco.2012.05.014]
HECKMAN, J. J., Pinto, R. & Savelyev, P. (2012). Understanding the mechanisms through which an influential early childhood program boosted adult outcomes. IZA Discussion Paper Series, 7040. Bonn: Institute for the Study of Labor. [doi:10.3386/w18581]
HEDSTRÖM, P. & Ylikoski, P. (2010). Causal mechanisms in the social sciences. Annual Review of Sociology, 36, 49–67. [doi:10.1146/annurev.soc.012809.102632]
HERTWIG, R., Davis, J. N. & Sulloway, F. J. (2002). Parental investment: How an equity motive can produce inequality. Psychological Bulletin, 128 (5), 728–745. [doi:10.1037/0033-2909.128.5.728]
INGLEHART, R. & Welzel, C. (2005). Modernization, cultural change, and democracy: The human development sequence. Cambridge: Cambridge University Press.
JOHNSON, W., Turkheimer, E., Gottesman, I. I. & Bouchard, Jr., T. J. (2009). Beyond heritability: Twin studies in behavioral research. Current Directions in Psychological Science, 18 (4), 217–220. [doi:10.1111/j.1467-8721.2009.01639.x]
KAHNEMAN, D. (2011). Thinking, Fast and Slow. New York: Farrar, Straus and Giroux.
KNUDSEN, E. I., Heckman, J. J., Cameron, J. L. & Shonkoff, J. P. (2006). Economic, neurobiological, and behavioral perspectives on building America's future workforce. Proceedings of the National Academy of Sciences of the United States of America, 103 (27), 10155–10162. [doi:10.1073/pnas.0600888103]
LORSCHEID, I., Heine, B.-O. & Meyer, M. (2012). Opening the 'black box' of simulations: increased transparency and effective communication through the systematic design of experiments. Computational and Mathematical Organization Theory, 18 (1), 22–62. [doi:10.1007/s10588-011-9097-3]
LUNDBERG, S. (2005). Sons, daughters, and parental behaviour. Oxford Review of Economic Policy, 21 (3), 340–356. [doi:10.1093/oxrep/gri020]
LYNN, R. & Vanhanen, T. (2006). IQ and Global Inequality. Augusta: Washington Summit Publishers.
MAKOWSKY, M. (2006). An agent-based model of mortality shocks, intergenerational effects, and urban crime. Journal of Artificial Societies and Social Simulation, 9 (2) 7 <https://www.jasss.org/9/2/7.html>.
MAYER, K. U. (2009). New directions in life course research. Annual Review of Sociology, (35), 413–433. [doi:10.1146/annurev.soc.34.040507.134619]
MESSICK, D. M. (1993). Equality as a decision heuristic. In B. A. Mellers and J. Baron (Eds.), Psychological Perspectives on Justice: Theory and Applications (pp. 11–31). Cambridge/New York: Cambridge University Press. [doi:10.1017/CBO9780511552069.003]
MEYER, M., Lorscheid, I. & Troitzsch, K. G. (2009). The development of social simulation as reflected in the first ten years of JASSS: A citation and co-citation analysis. Journal of Artificial Societies and Social Simulation, 12 (4), 12 <https://www.jasss.org/12/4/12.html>.
ROBERTS, B. W., Kuncel, N. R., Shiner, R., Caspi, A. & Goldberg, L. R. (2007). The power of personality: The comparative validity of personality traits, socioeconomic status, and cognitive ability for predicting important life outcomes. Perspectives on Psychological Science, 2 (4), 313–345. [doi:10.1111/j.1745-6916.2007.00047.x]
ROBISON-COX, J. F., Martell, R. F., & Emrich, C. G. (2007). Simulating gender stratification. Journal of Artificial Societies and Social Simulation, 10 (3), 8 <https://www.jasss.org/10/3/8.html>
SCHELLING, T. C. (1971). Dynamic models of segregation. The Journal of Mathematical Sociology, 1 (2), 143–186. [doi:10.1080/0022250X.1971.9989794]
SEN, A. (1992). Missing women. British Medical Journal, 304 (6827), 587–588. [doi:10.1136/bmj.304.6827.587]
SEN, A. (2003). Missing women—revisited. British Medical Journal, 327 (7427), 1297–1298. [doi:10.1136/bmj.327.7427.1297]
SQUAZZONI, F. & Casnici, N. (2013). Is social simulation a social science outstation? A bibliometric analysis of the impact of JASSS. Journal of Artificial Societies and Social Simulation, 16 (1), 10 <https://www.jasss.org/16/1/10.html>.
STEWART, S. D. (2005). How the birth of a child affects involvement with stepchildren. Journal of Marriage and Family, 67 (2), 461–473. [doi:10.1111/j.0022-2445.2005.00128.x]
SUITOR, J. J., Sechrist, J., Plikuhn, M., Pardo, S. T. & Pillemer, K. (2008). Within-family differences in parent–child relations across the life course. Current Directions in Psychological Science, 17 (5), 334–338. [doi:10.1111/j.1467-8721.2008.00601.x]
SULLOWAY, F. J. (1996). Born to Rebel: Birth Order, Family Dynamics, and Creative Lives. New York: Pantheon Books.
TODD, P. E. & Wolpin, K. I. (2003). On the specification and estimation of the production function for cognitive achievement. The Economic Journal, 113 (485), F3–F33. [doi:10.1111/1468-0297.00097]
TODD, P. E. & Wolpin, K. I. (2007). The production of cognitive achievement in children: Home, school, and racial test score gaps. Journal of Human Capital, 1 (1), 91–136. [doi:10.1086/526401]
TODD, P. M. & Gigerenzer, G. (2007). Environments that make us smart: Ecological rationality. Current Directions in Psychological Science, 16 (3), 167–171. [doi:10.1111/j.1467-8721.2007.00497.x]
TRIVERS, R. L. (1972). Parental investment and sexual selection. In B. G. Campbell (Ed.), Sexual Selection and the Descent of Man: 1871–1971 (pp. 136–179). London: Heinemann.
TRIVERS, R. L. & Willard, D. E. (1973). Natural selection of parental ability to vary the sex ratio of offspring. Science, 179 (4068), 90–92. [doi:10.1126/science.179.4068.90]
WALKER, L. & Davis, P. (2013). Modelling "marriage markets": A population-scale implementation and parameter test. Journal of Artificial Societies and Social Simulation, 16 (1), 6 <https://www.jasss.org/16/1/6.html>.